


Features
- 5 Unique slides
- Fully editable and easy to edit in Microsoft Powerpoint, Keynote and Google Slides
- 16:9 widescreen layout
- Clean and professional designs
- Export to JPG, PDF or send by email


Do you have any questions?
Recommend


21 slides
Logos Content Marketing Pitch Deck Presentation
The Marketing Presentation Template is designed for impactful business storytelling. With 20+ slides, it features sections for company history, core values, target audience, competitive analysis, growth plans, and testimonials. Ideal for agencies and brands, it's fully customizable and compatible with PowerPoint, Keynote, and Google Slides. Perfect for pitching ideas effectively!


6 slides
Business Decision Venn Diagram Presentation
Make complex decision-making simple and visually impactful with this Business Decision Venn Diagram Presentation. Featuring a bold triangular layout with six segmented areas, this slide is ideal for presenting overlapping factors, interconnected strategies, or priority zones. Perfect for business planning, competitive analysis, or project evaluation. Fully editable in PowerPoint, Keynote, and Google Slides for seamless integration into your presentations.


12 slides
Leadership Development and Growth
Highlight leadership skills with this dynamic radar chart template, ideal for tracking individual or team competencies across six core areas. Use this layout to visualize progress in communication, strategy, vision, influence, adaptability, and accountability. Great for HR reviews, training evaluations, or performance dashboards. Fully editable in PowerPoint, Keynote, and Google Slides.


20 slides
Oscillation Project Proposal Presentation
This project proposal template is designed to captivate your audience with a bold purple and yellow color scheme, adding a modern flair to your presentation. It includes comprehensive sections like company overview, objectives and goals, methodology, deliverables, and budget breakdown. Perfect for clearly communicating your project vision and strategy, this template streamlines your content while highlighting your professional approach. Compatible with PowerPoint, Keynote, and Google Slides, it provides versatility for seamless delivery across platforms.


7 slides
Flow Chart Diagram
A flowchart diagram is a visual representation that illustrates a process or system by using different symbols and shapes to depict the steps, decisions, and actions involved. Our flow chart diagram infographic is the compass to navigate your concepts into concrete actions. It's a visual roadmap that simplifies complex processes, helping you illustrate the steps in a sequence. This Infographic is your trusted tool for transforming processes into a visually appealing and understandable journey. This tool is designed to be used in various fields, including software development, business process analysis, education, and more, to depict the logical flow.


26 slides
Efficient Time Management Presentation
Optimize your time management skills with a presentation designed to streamline your productivity. The template offers a professional and calming color palette, encouraging focus and clarity. It's structured to address the key principles of time management, from prioritizing tasks to strategic planning. Within the slides, you’ll find tools to introduce time management concepts, team profiles to assign roles efficiently, and charts to monitor progress. Engaging graphics and infographics are used to outline processes and time allocation, making it easier to visualize effective time management strategies. This template is a perfect match for workshops, personal organization sessions, or corporate training programs, compatible with popular platforms like PowerPoint, Keynote, and Google Slides. It’s designed to aid professionals and teams in harnessing their time effectively, ensuring every second counts towards achieving their goals.


8 slides
Business Lifecycle Circle Format Presentation
Present your business stages with clarity using this lifecycle circle diagram. Ideal for showcasing four key phases—planning, execution, growth, and review—in a circular format that emphasizes continuity. Each section includes icons and editable text. Fully customizable in PowerPoint, Keynote, or Google Slides for strategy meetings, reports, or progress updates.


6 slides
Organizational Goals and SMART Objectives Presentation
Align your business vision with clarity using this Organizational Goals and SMART Objectives slide. Designed to visually represent each SMART component—Specific, Measurable, Achievable, Relevant, and Time-bound—it helps communicate strategic goals in a simple and effective format. Fully editable in Canva, PowerPoint, and Google Slides for maximum flexibility.


25 slides
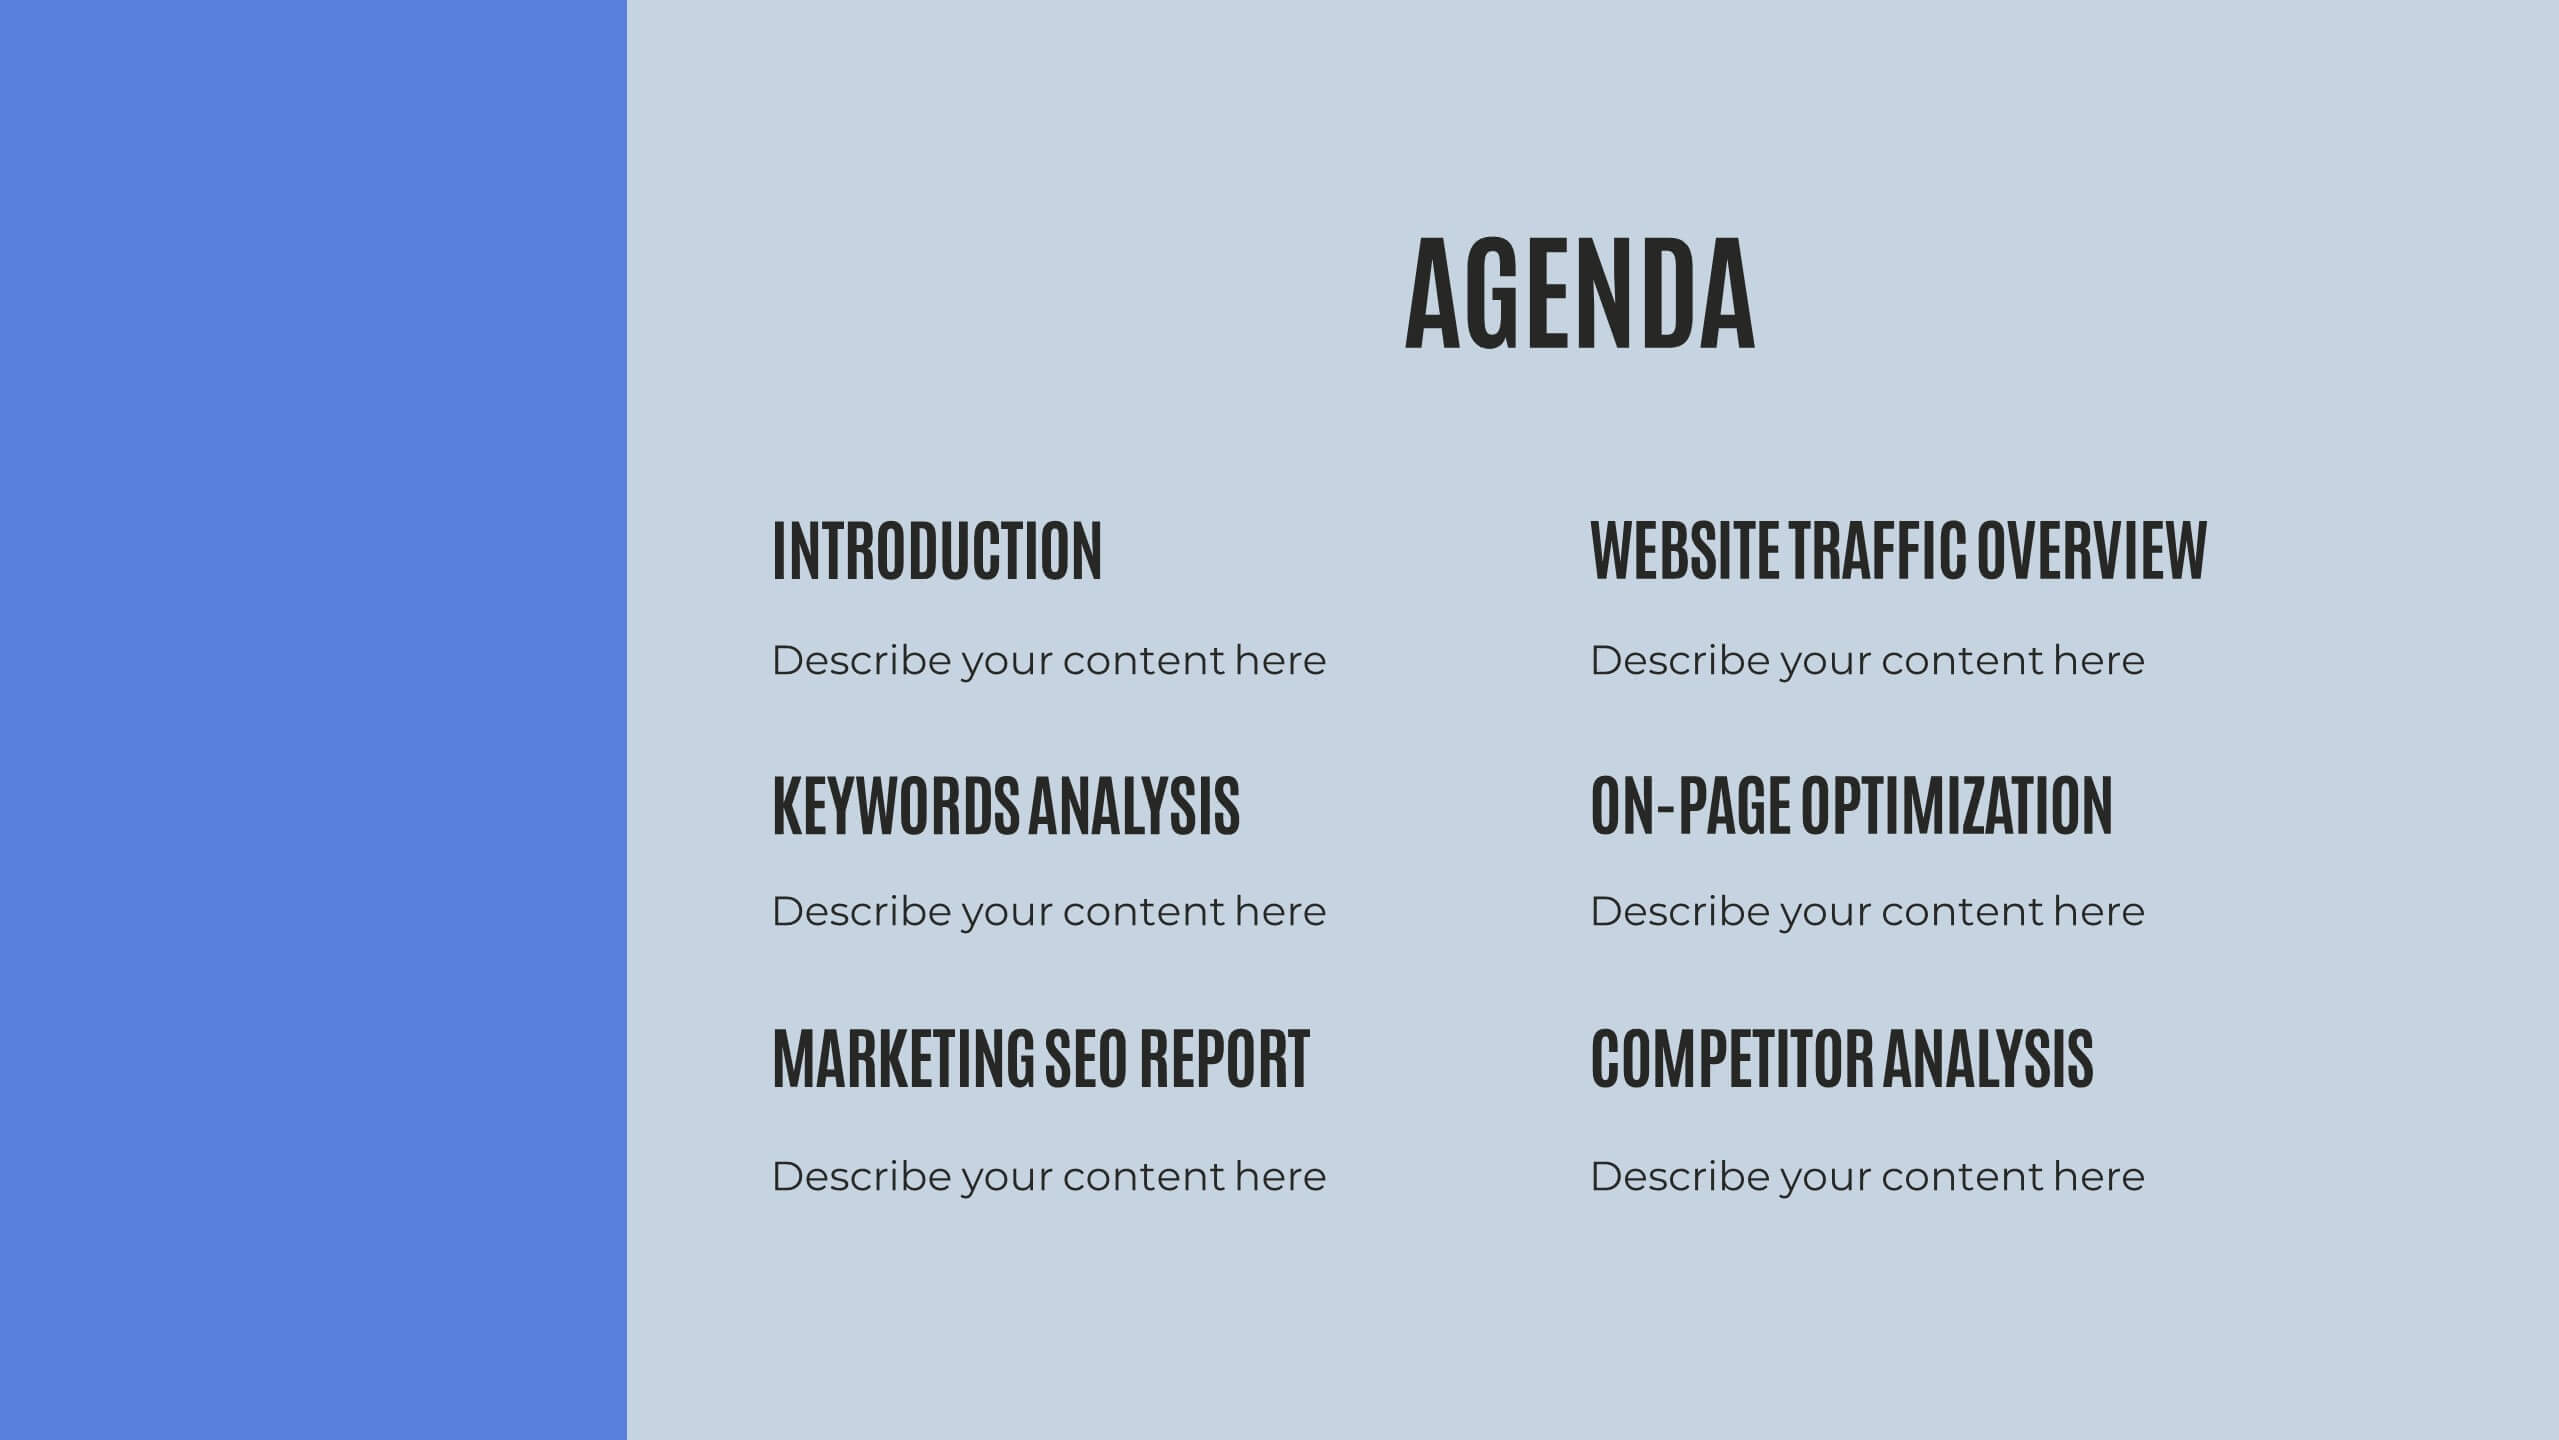
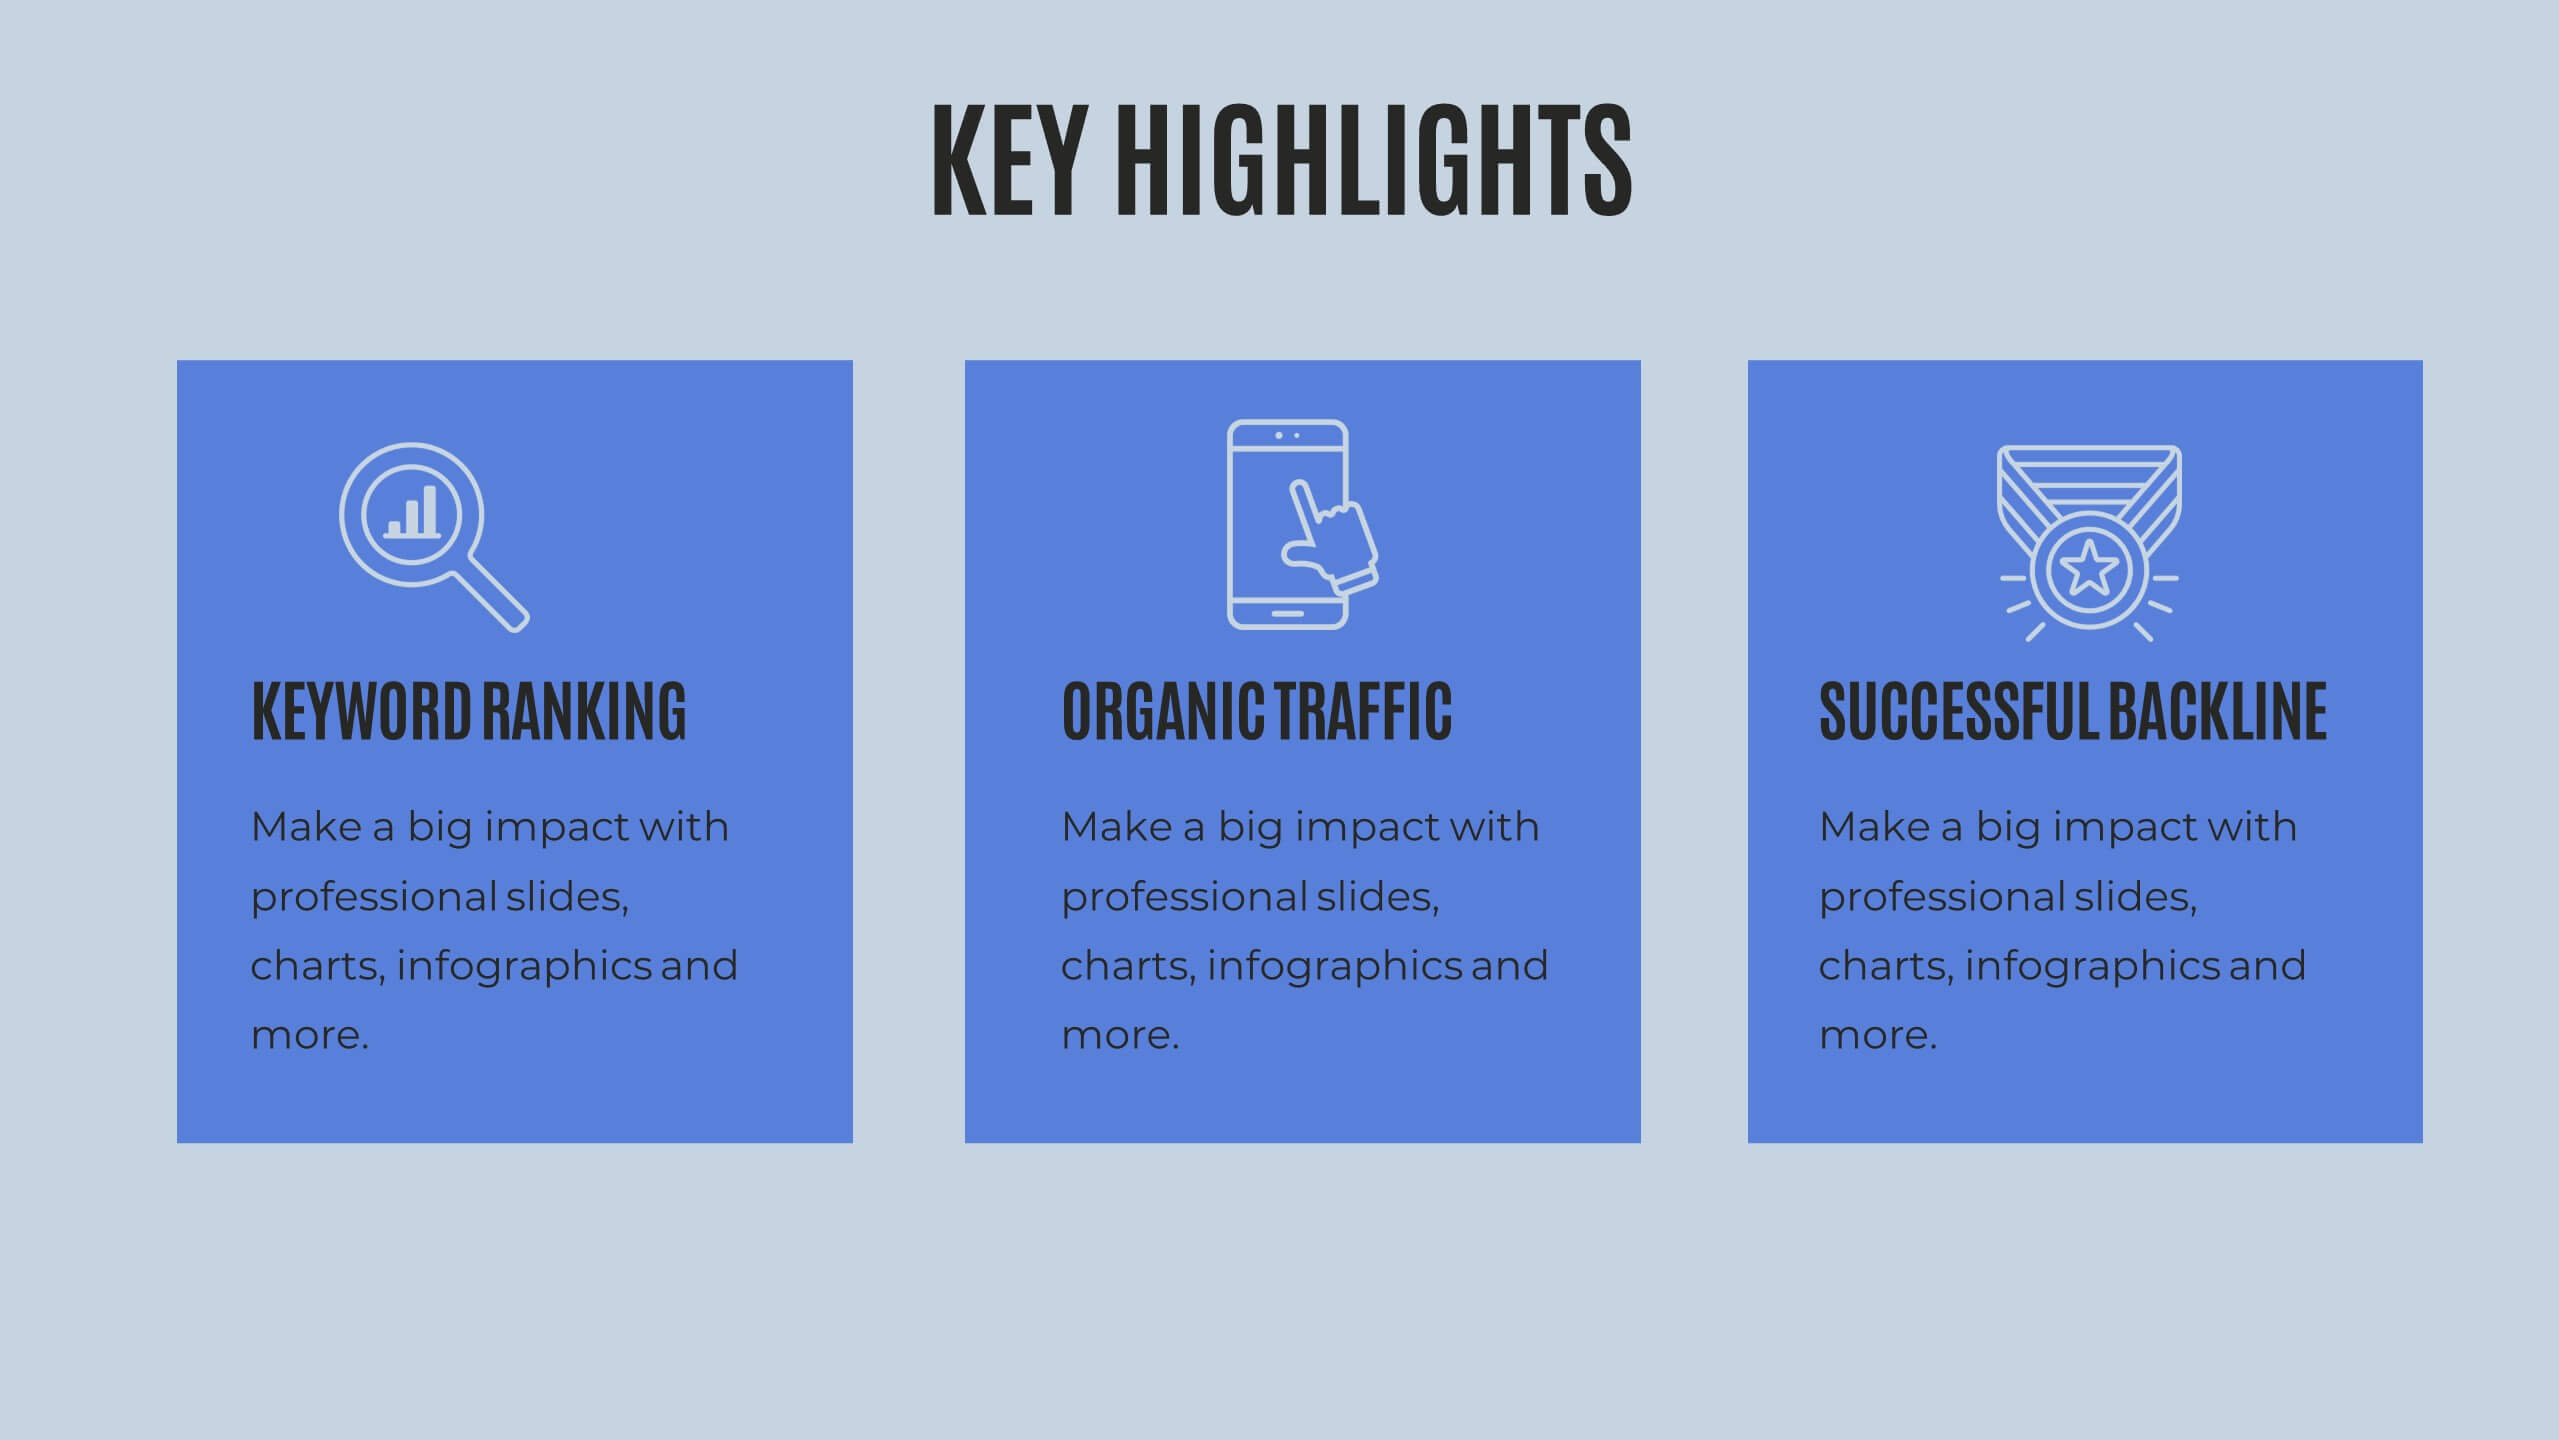
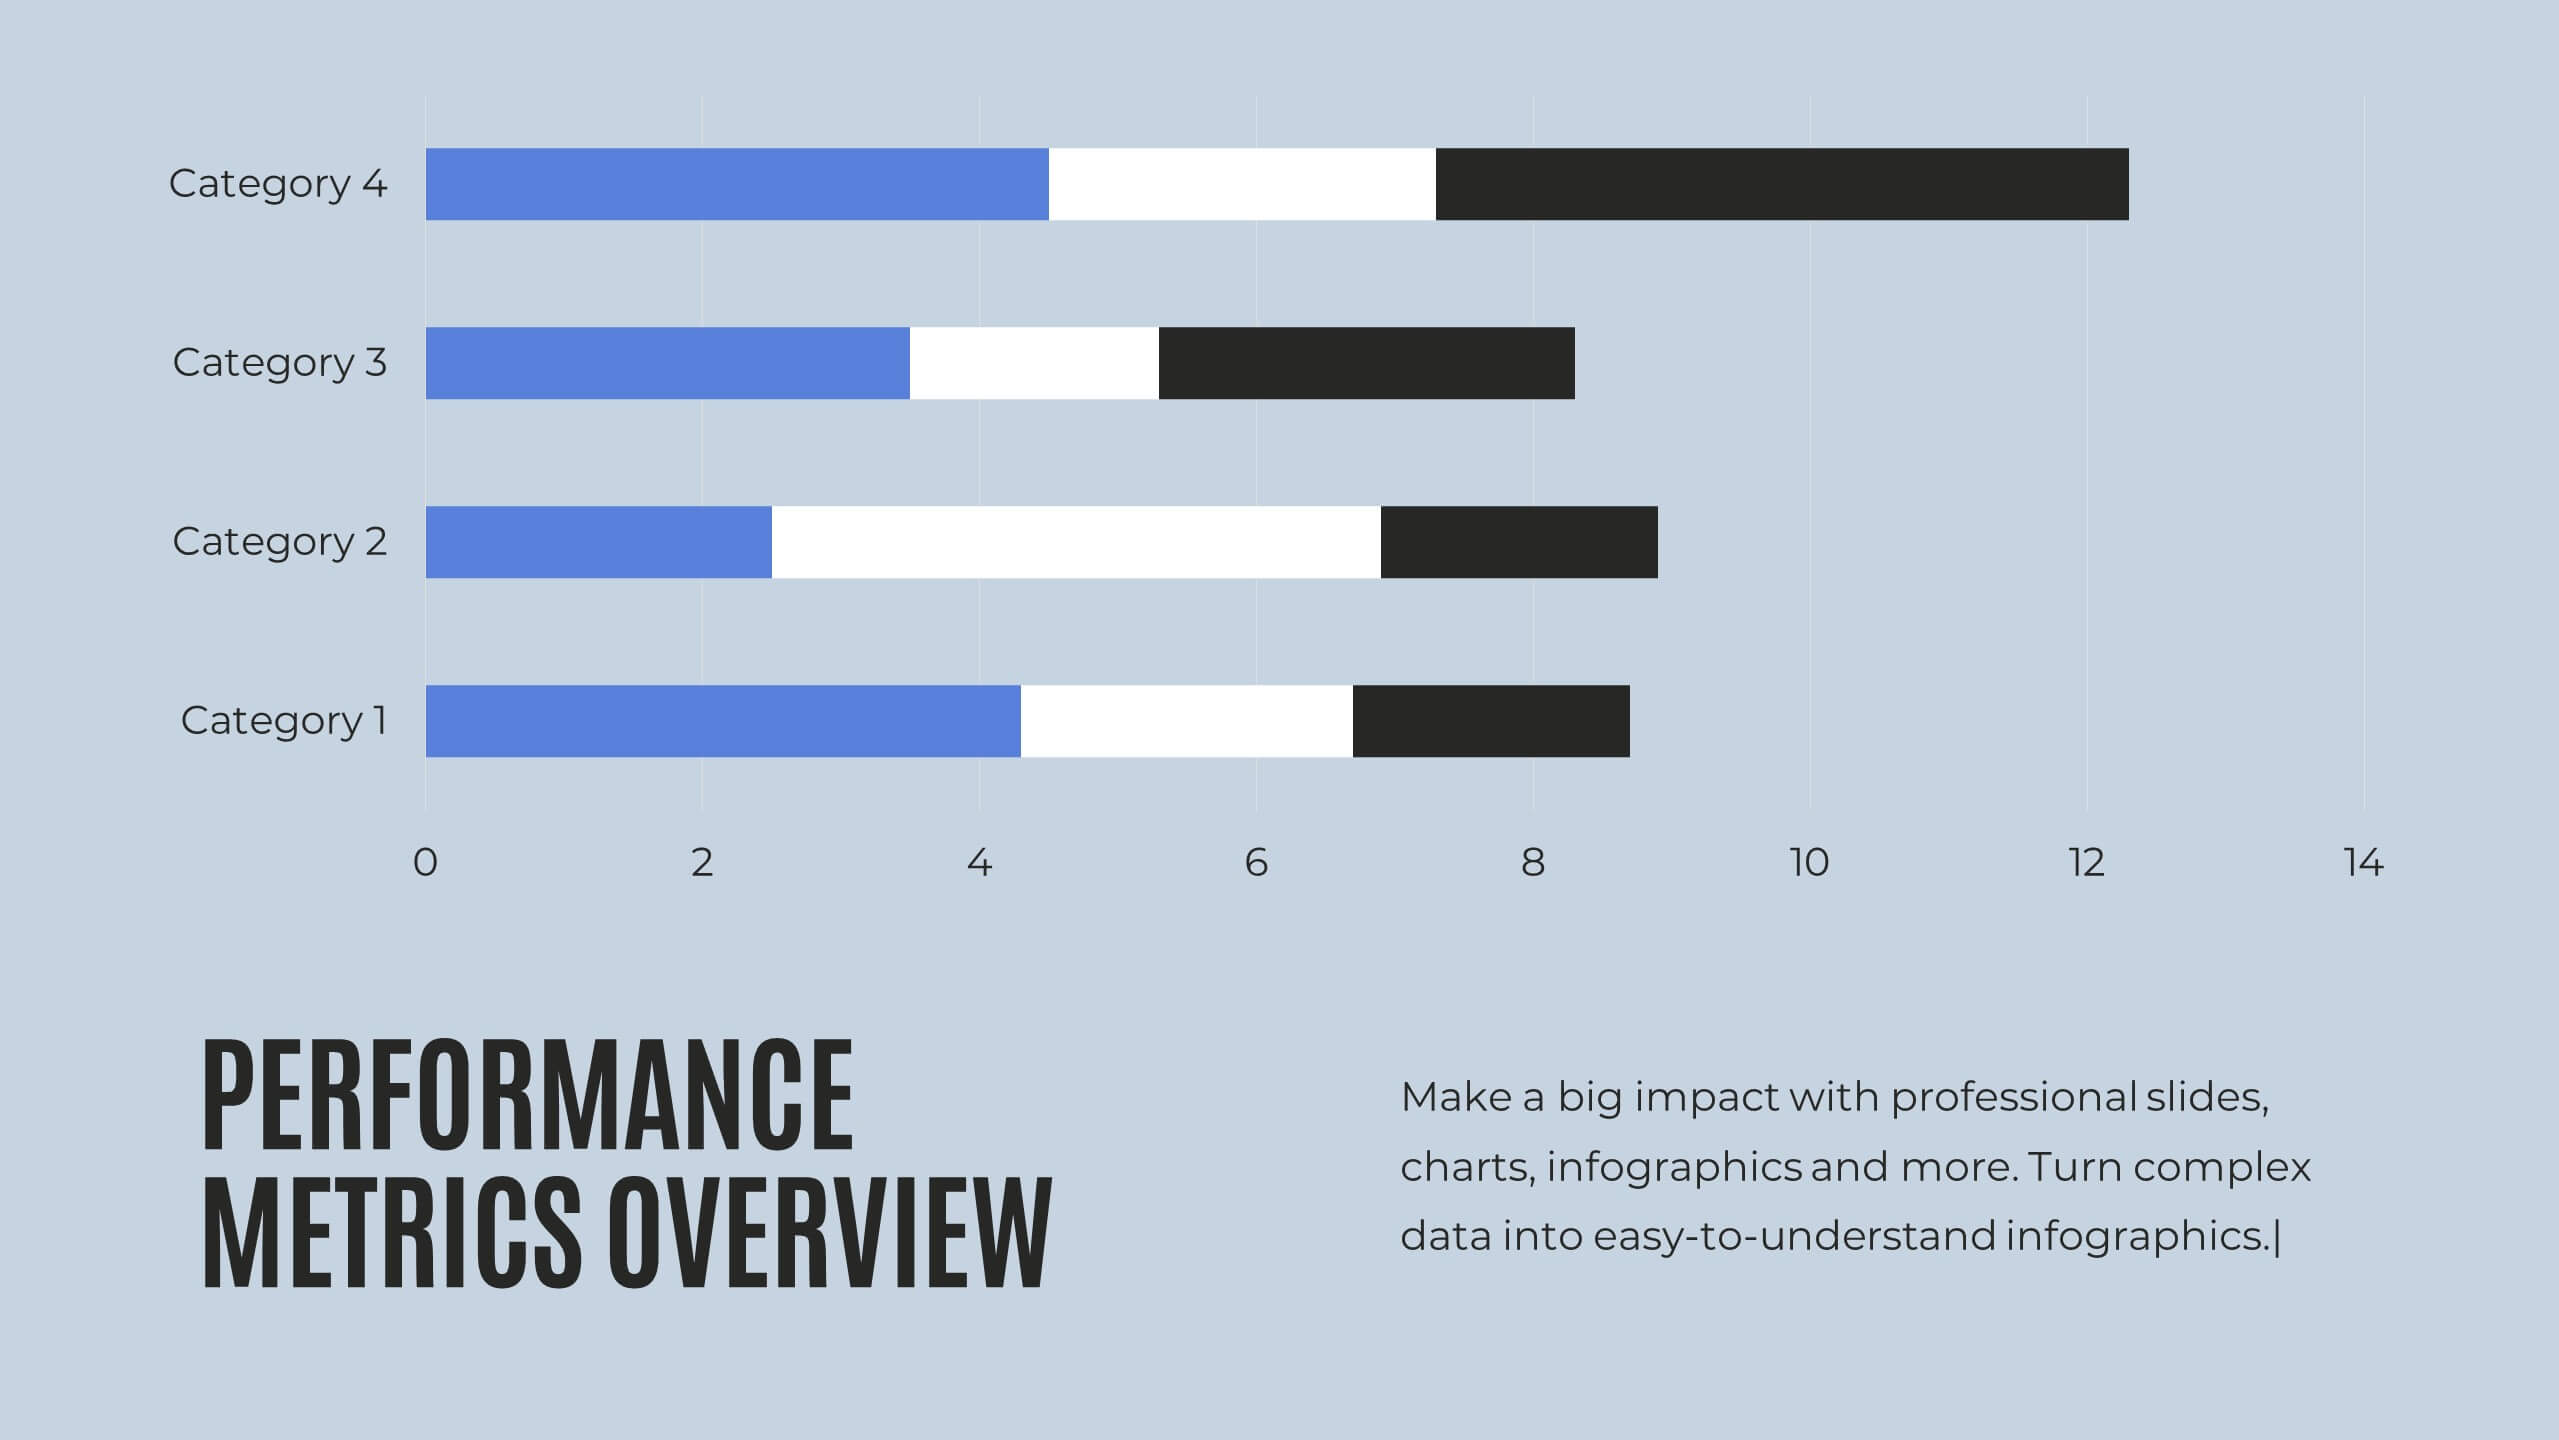
Siren Rebranding Project Plan Presentation
This sleek brand presentation template covers essential elements like market analysis, brand guidelines, positioning, and audience insights. It's designed to showcase your brand identity and development strategies with a modern layout. Compatible with PowerPoint, Keynote, and Google Slides, it’s perfect for delivering professional and engaging brand presentations.


8 slides
Flight Operations and Aviation Trends Presentation
Track insights with precision using the Flight Operations and Aviation Trends presentation. Designed around a radar-style layout, this template is ideal for showcasing key performance metrics, operational trends, or regional air traffic data. Perfect for airline analysts, airport authorities, and aviation consultants. Fully customizable in PowerPoint, Keynote, and Google Slides.


26 slides
Kasra Presentation Template
Fitness is an important part of good health. It improves your quality of life and may keep you from getting sick by helping to strengthen your immune system, prevent heart disease and reduce the risk of diabetes and much more. The Kasra template will help you deliver your message with an impact. Whether you're selling your product, promoting an event, or creating a landing page, this template features the necessary components to capture your audience's attention. This provides you with a powerful platform to engage others, illustrate key messages and demonstrate deep insight into an issue.


4 slides
IT Infrastructure and Architecture Presentation
Enhance your IT Infrastructure and Architecture presentations with this structured infographic. Featuring a layered, circular design, this template is ideal for illustrating network systems, data management, cloud computing, and cybersecurity strategies. Fully editable and compatible with PowerPoint, Keynote, and Google Slides.


21 slides
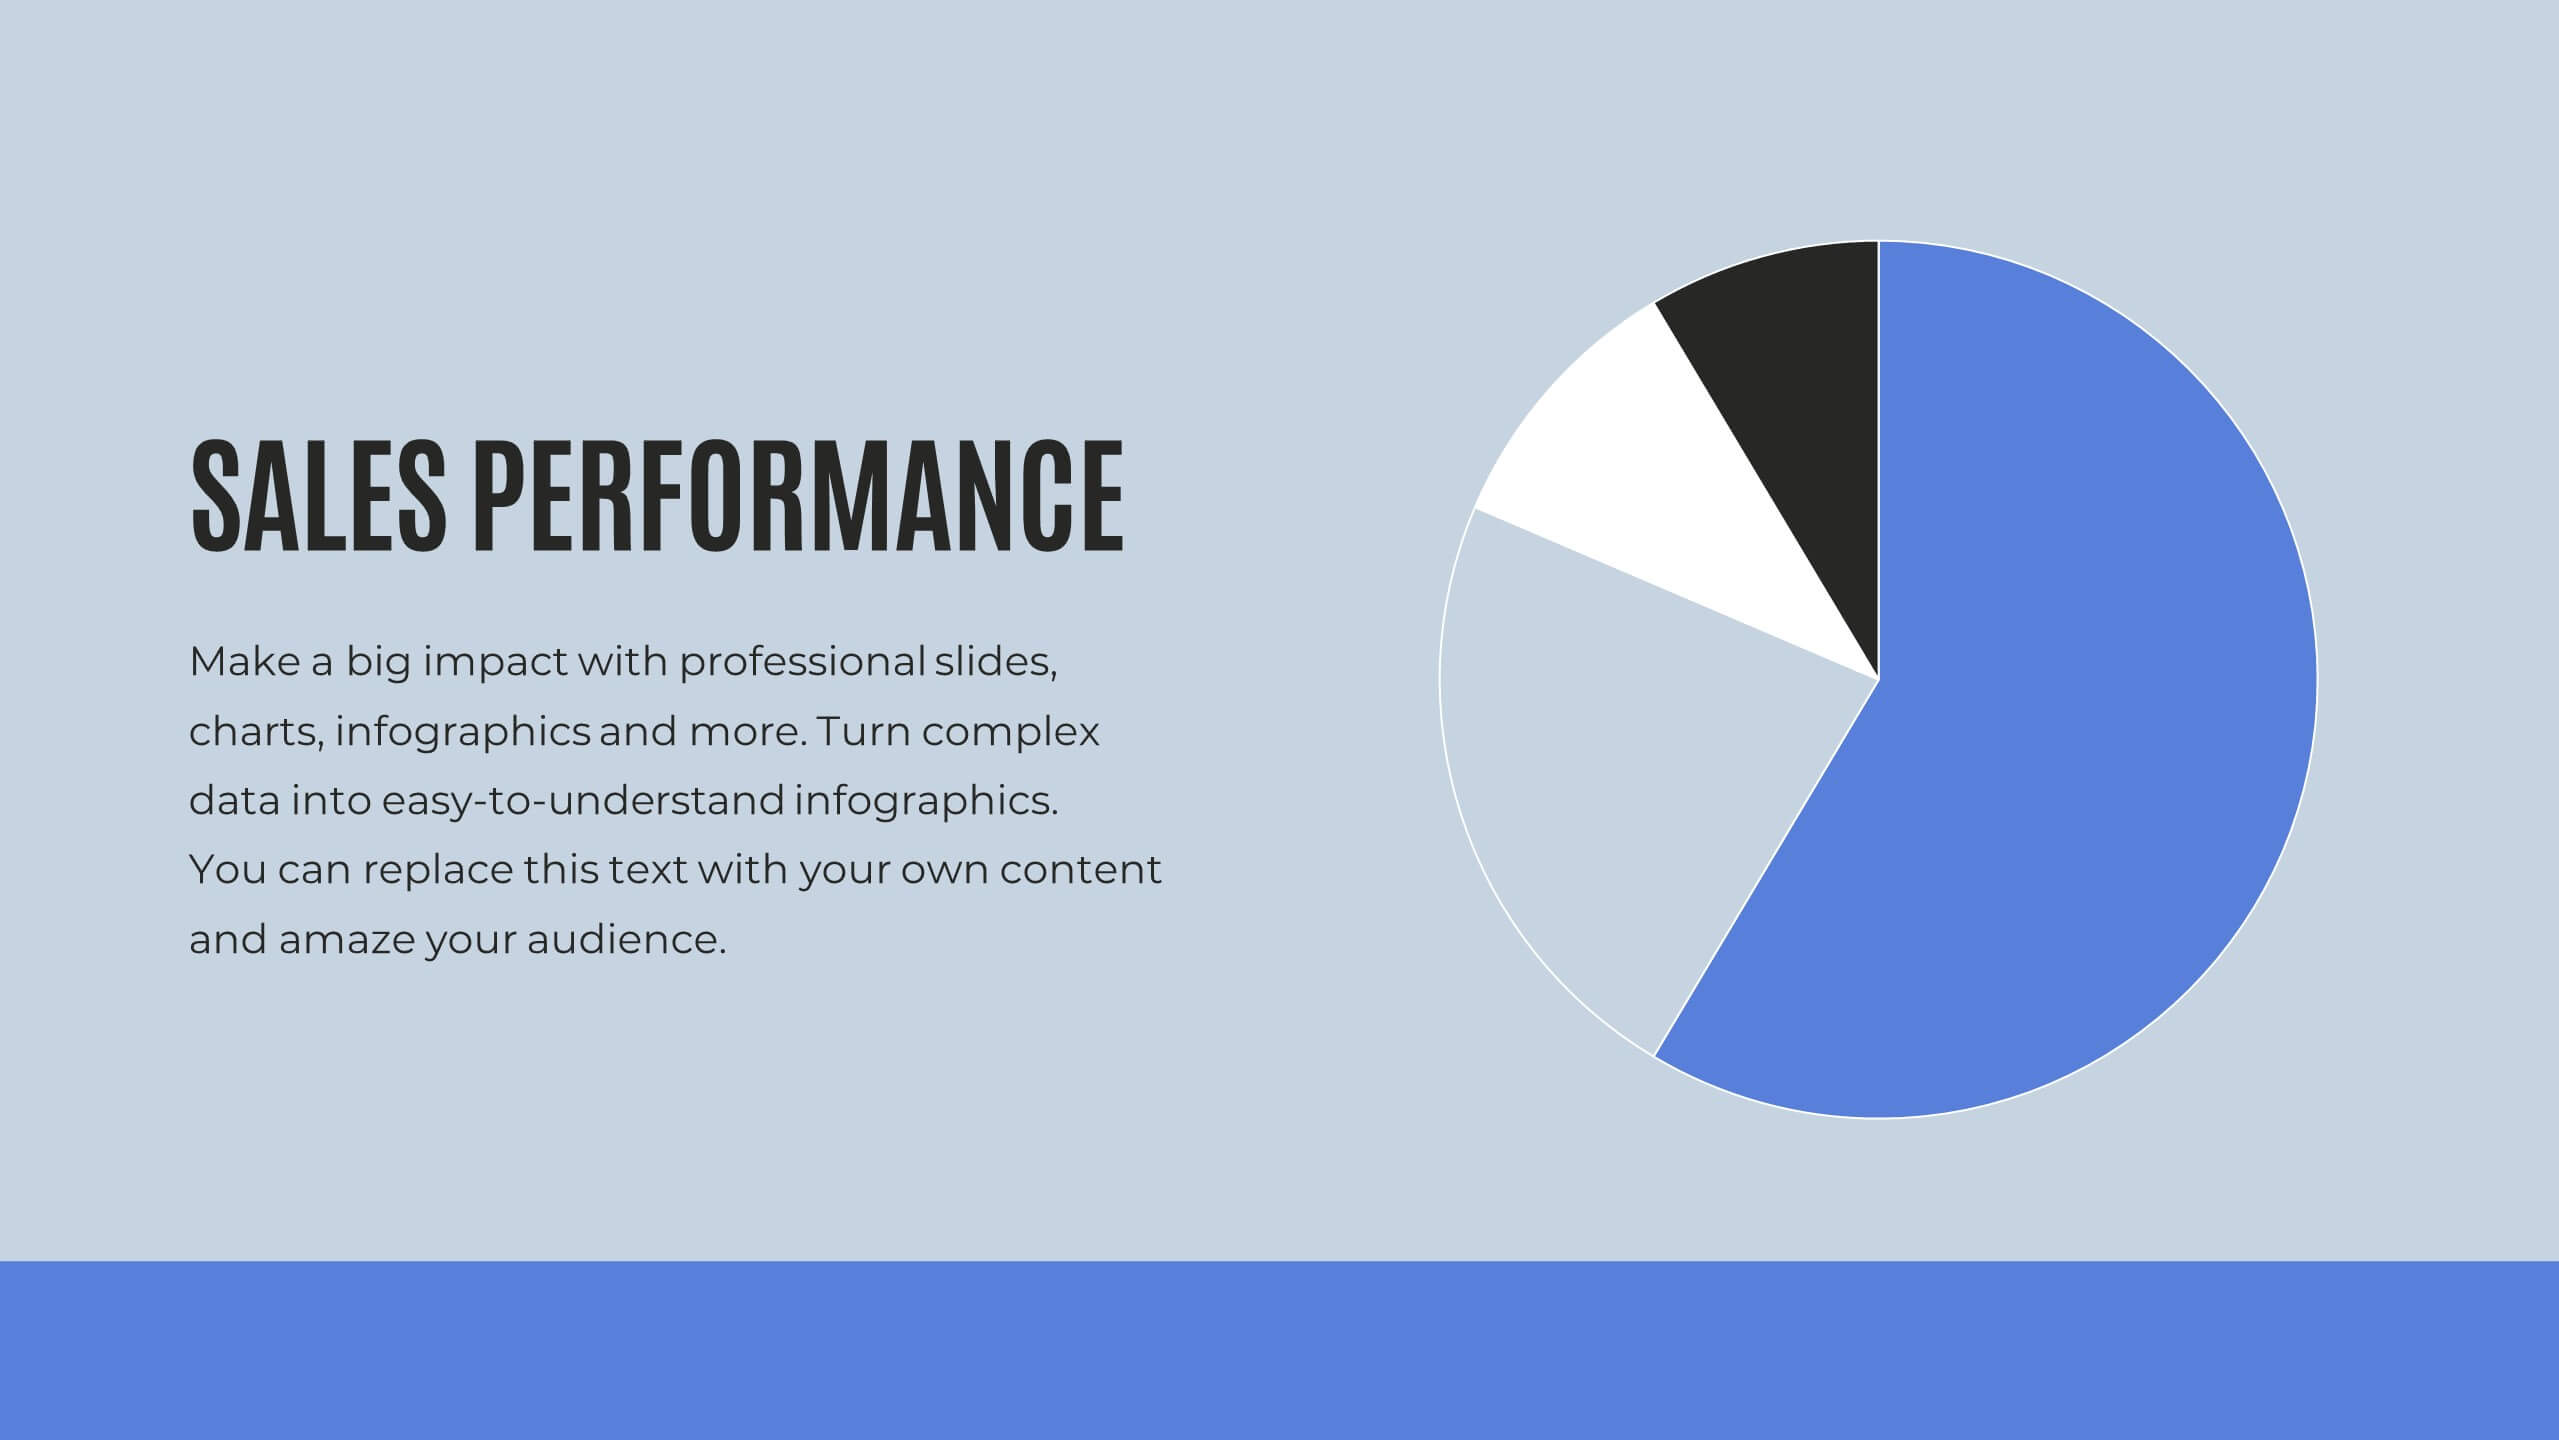
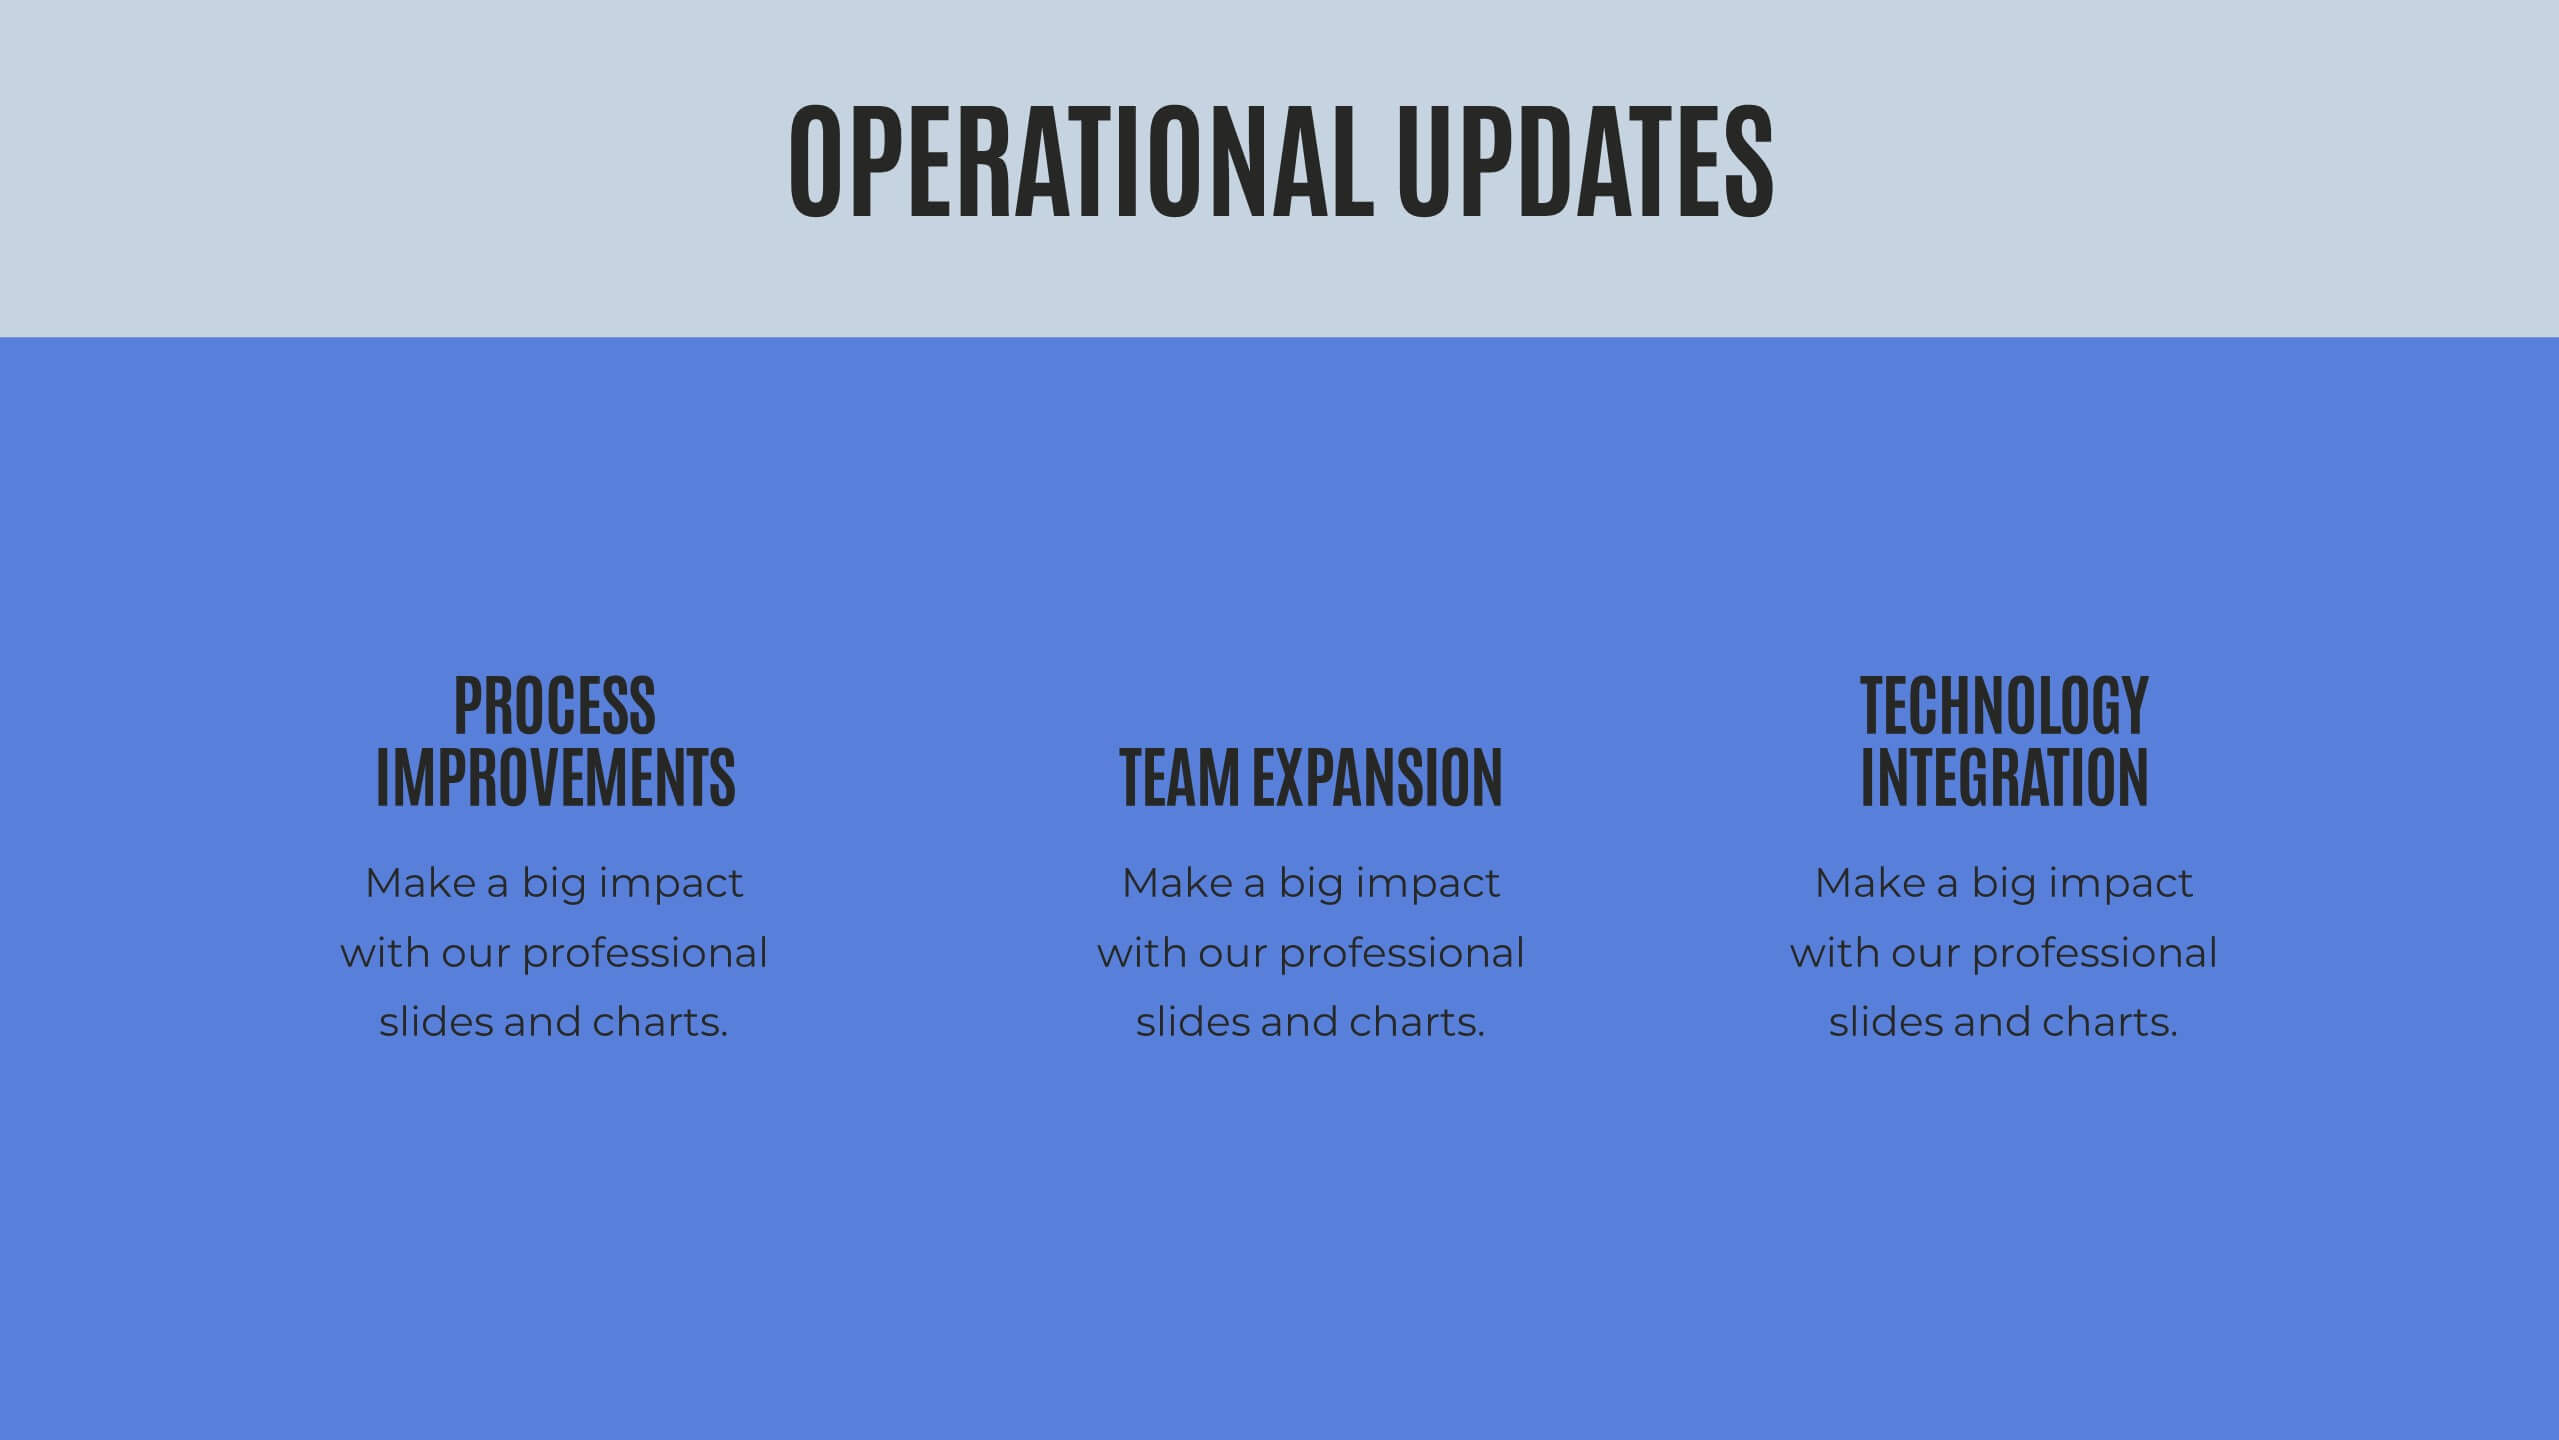
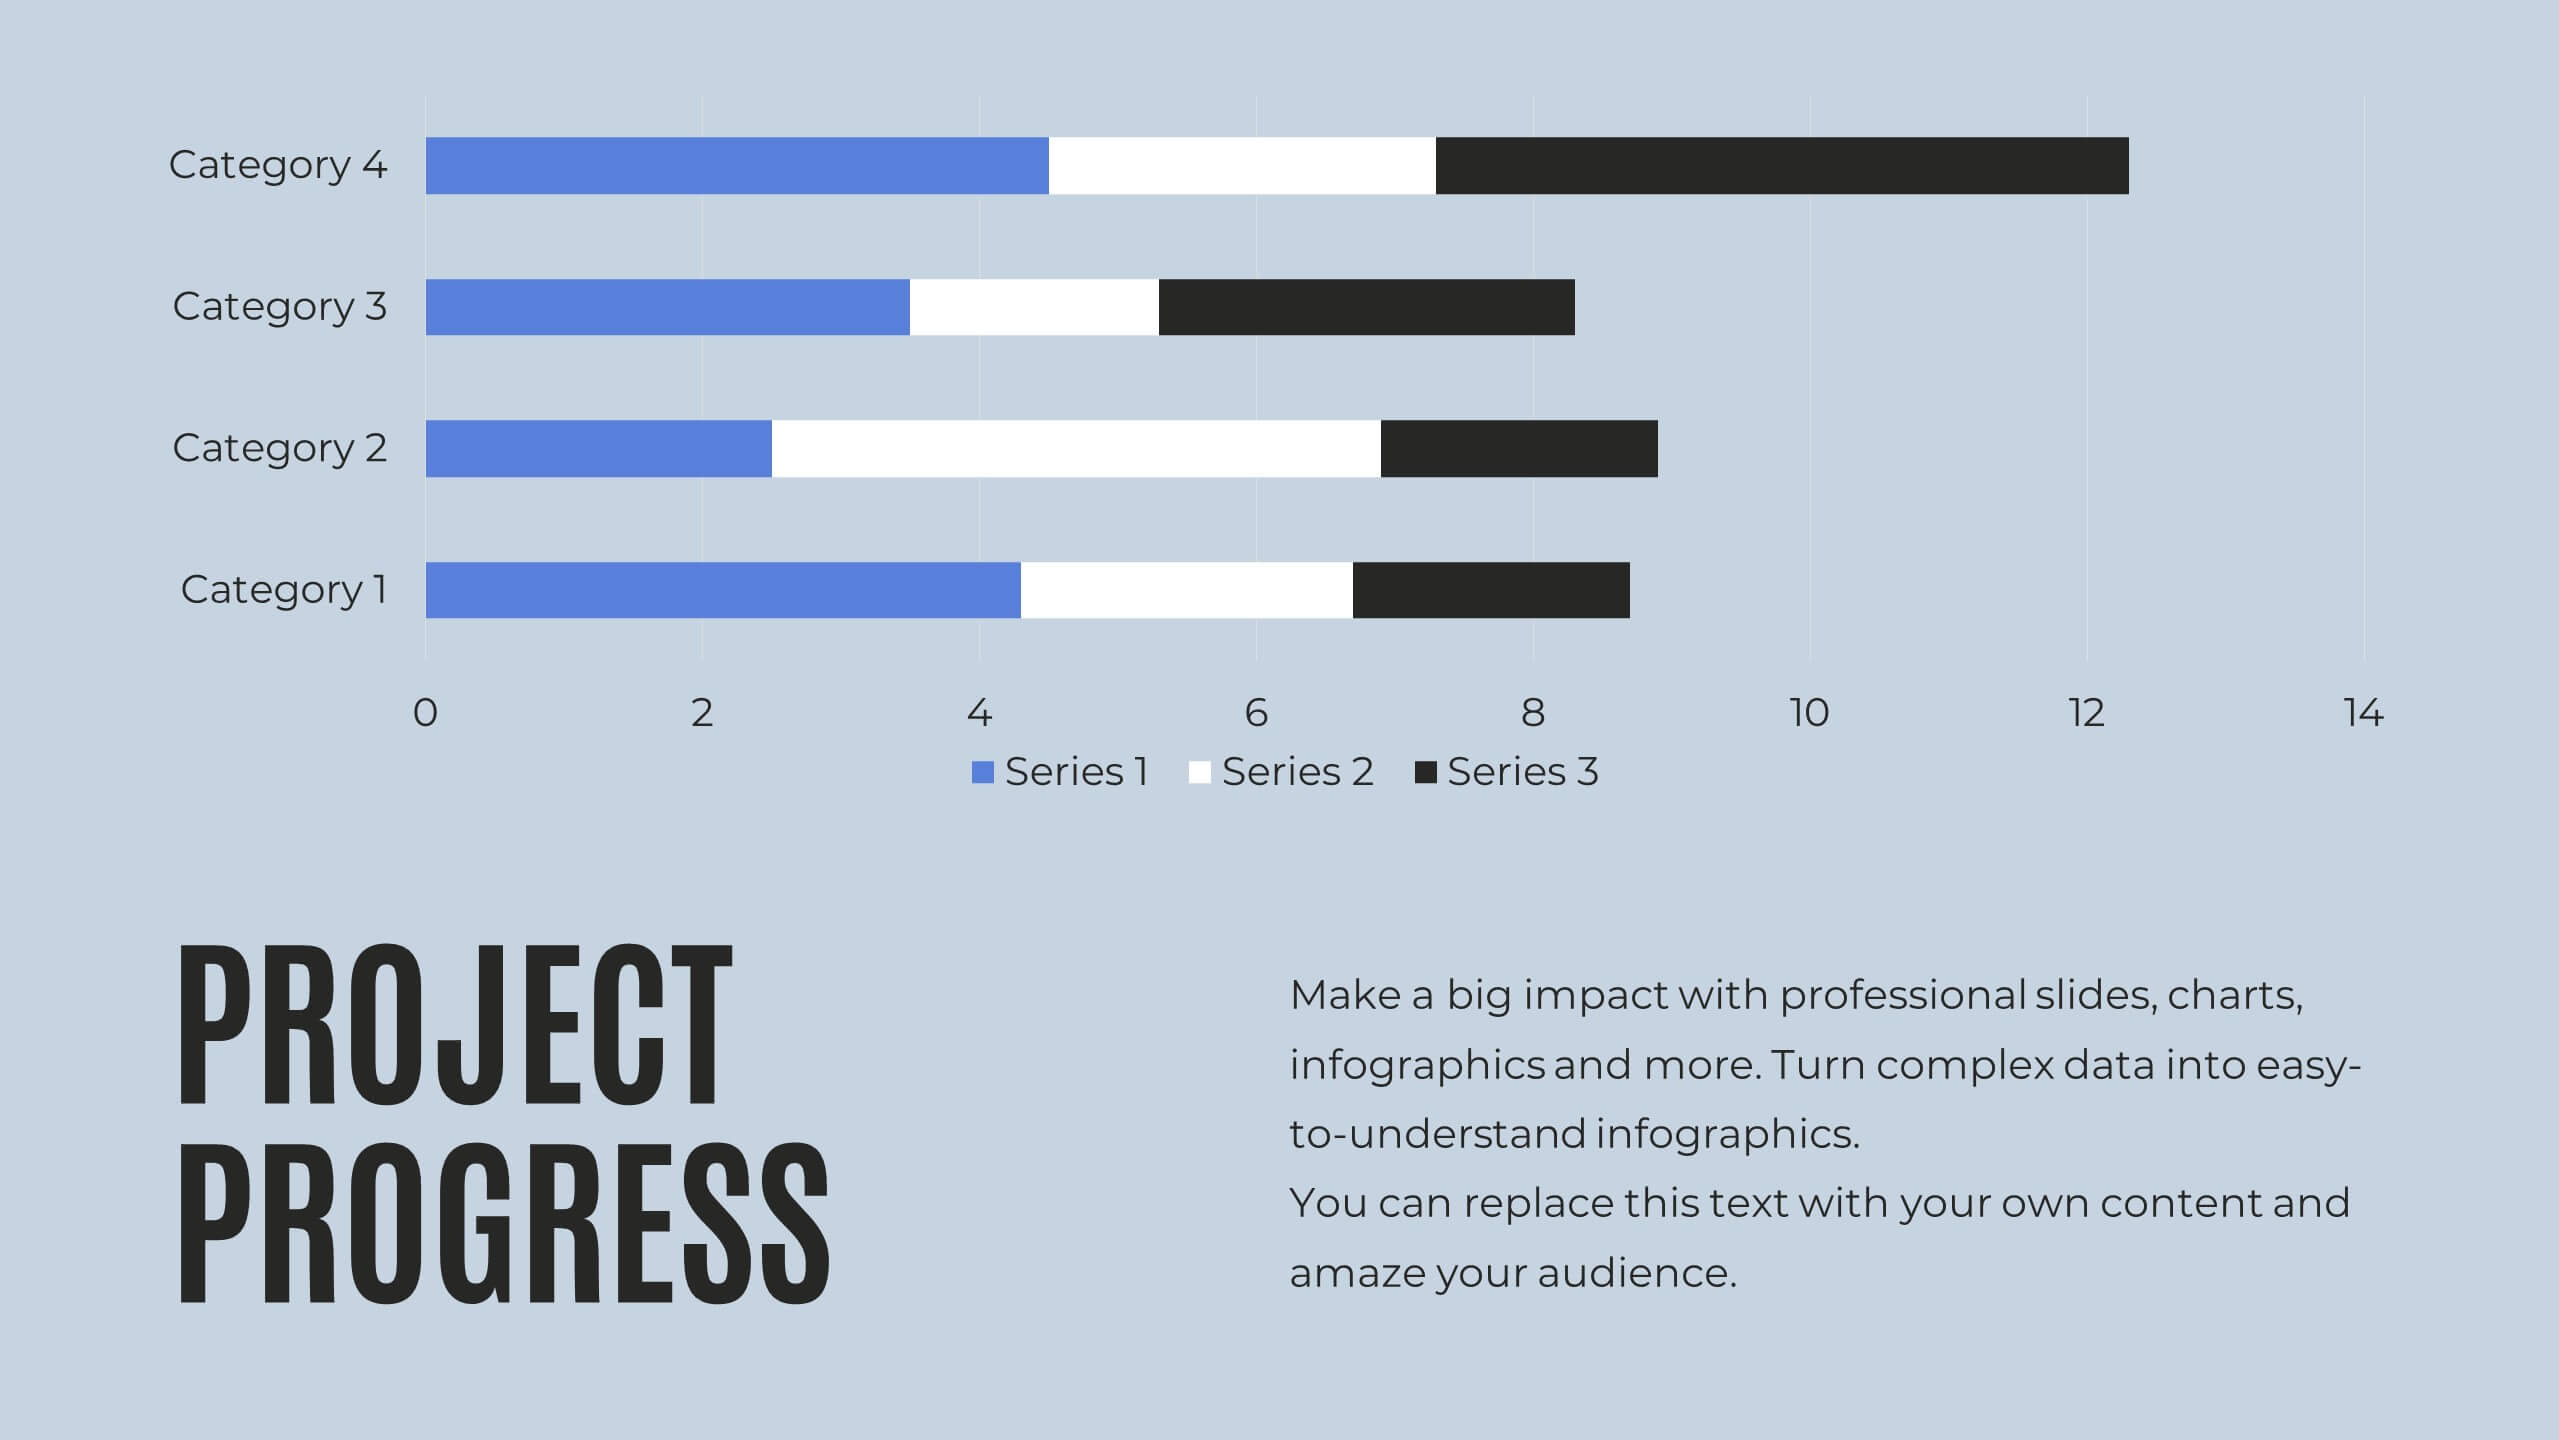
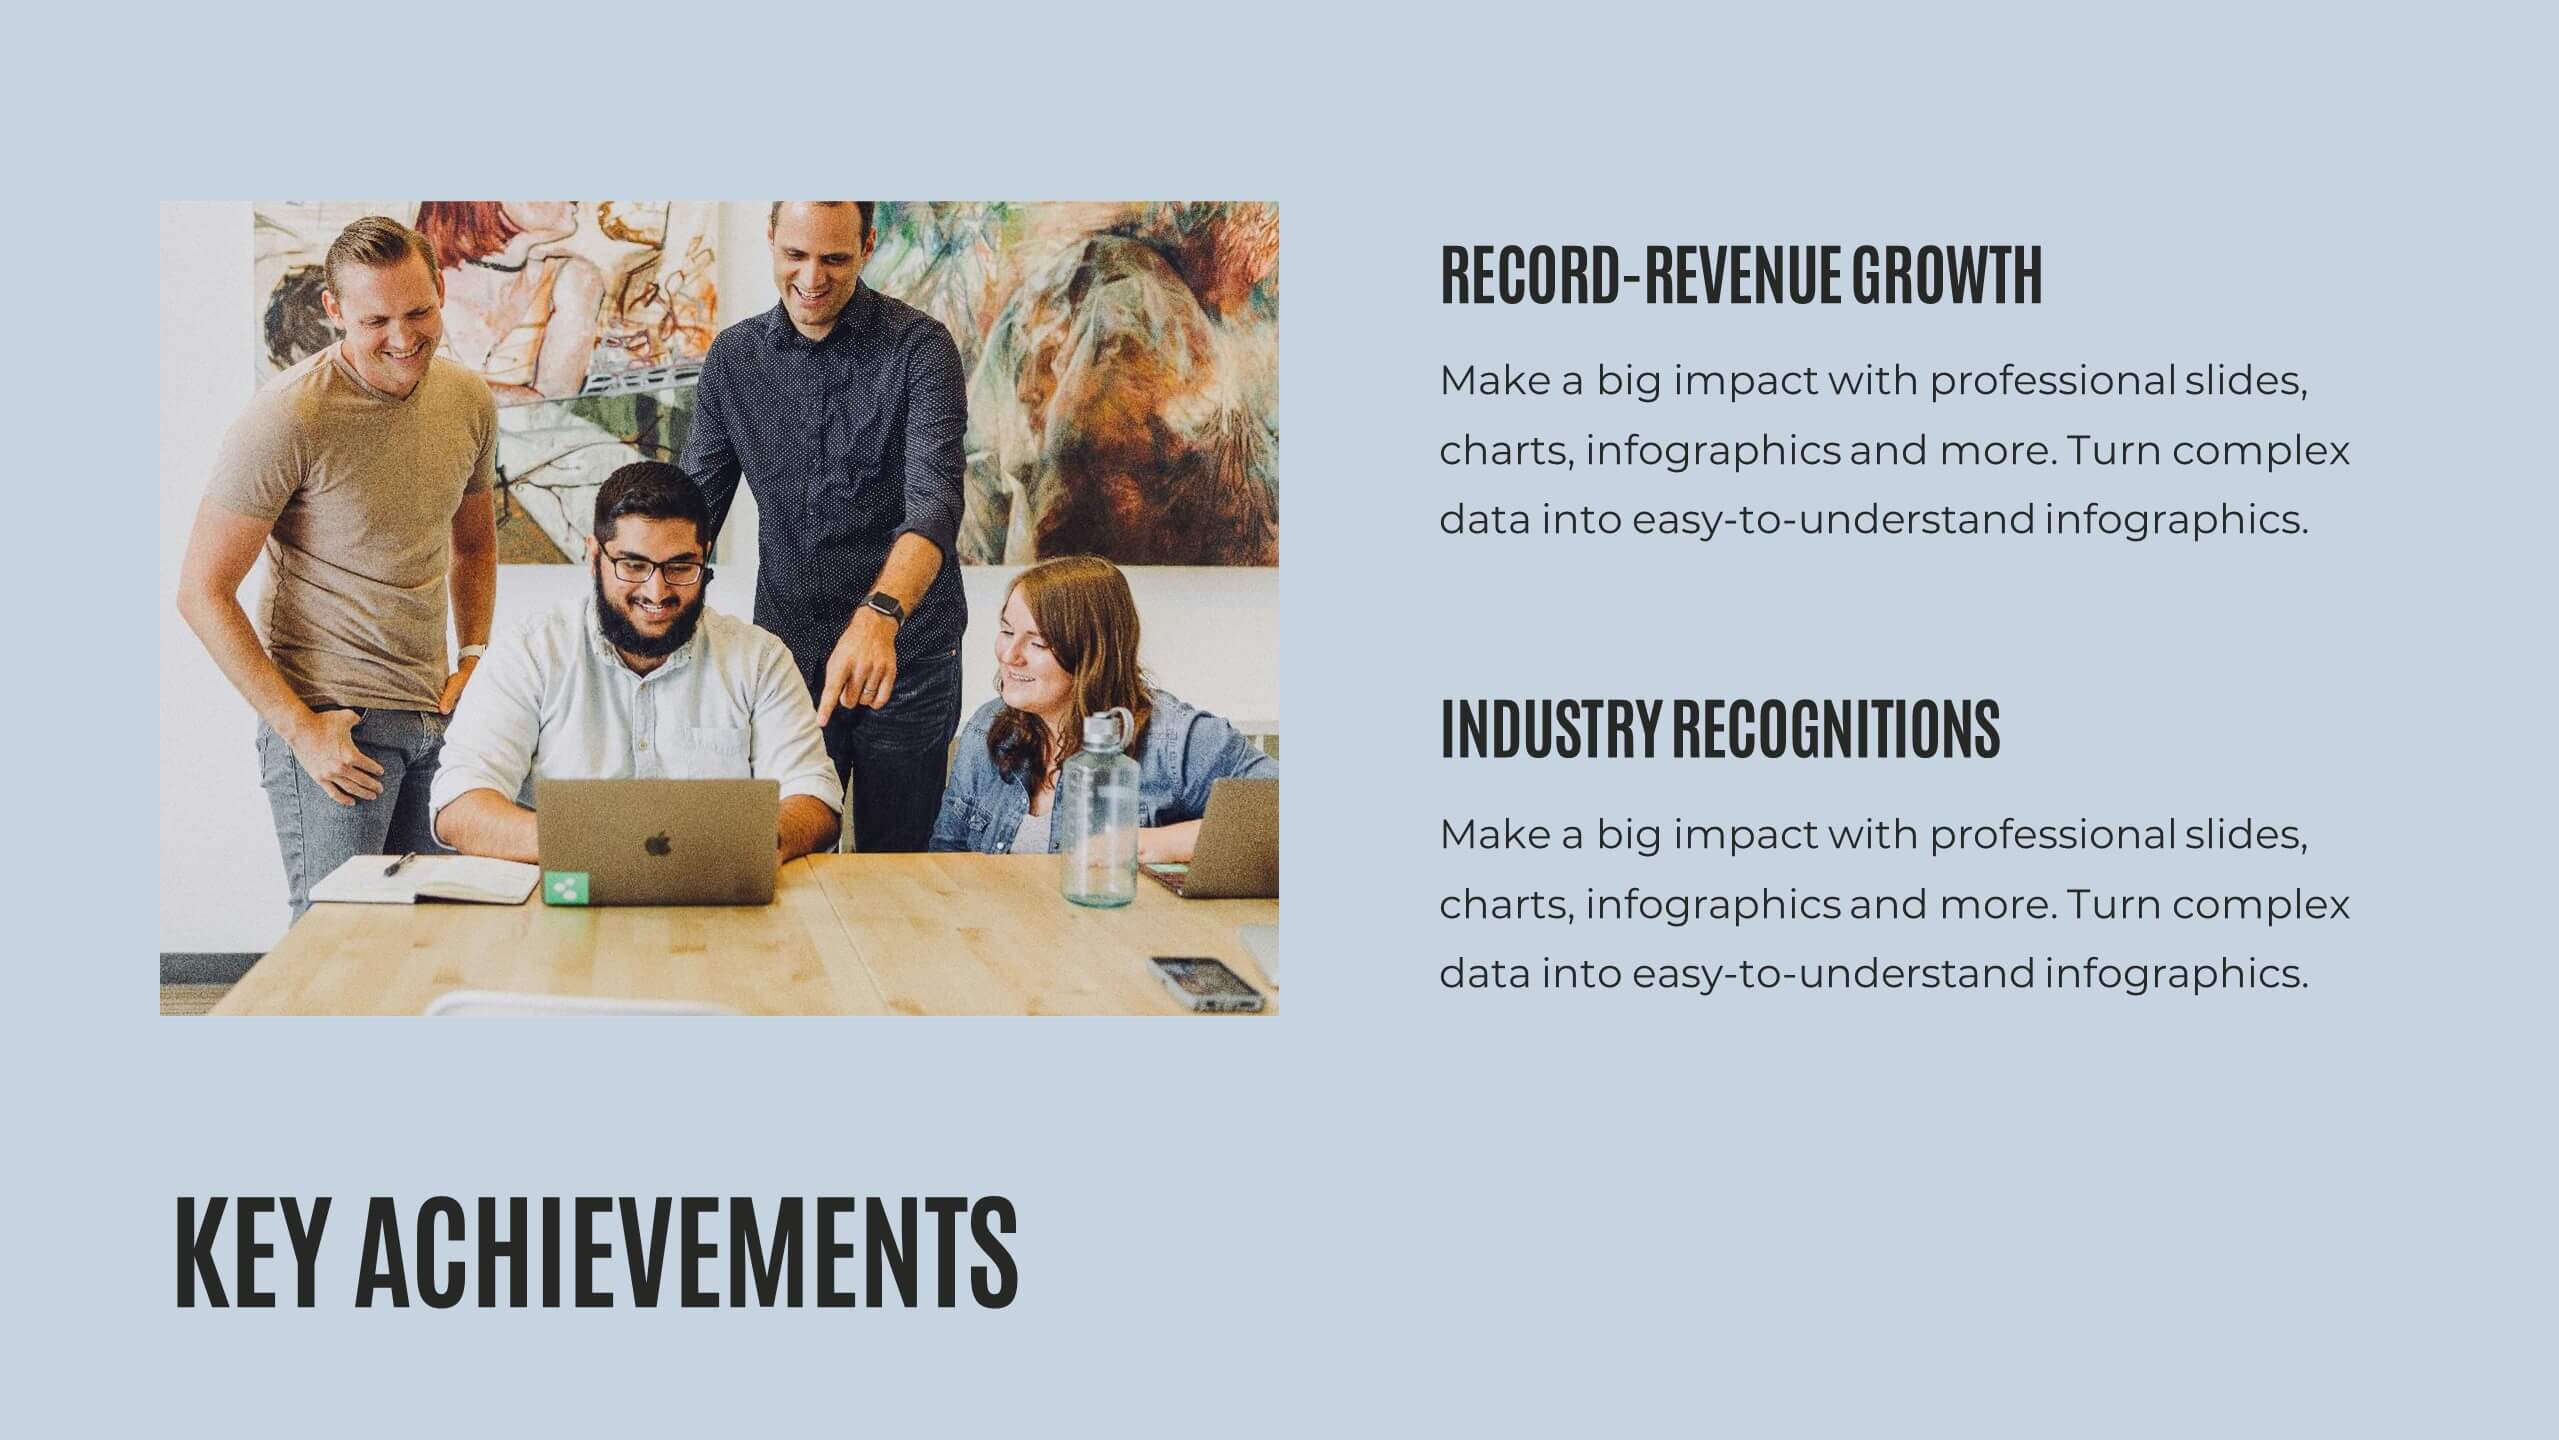
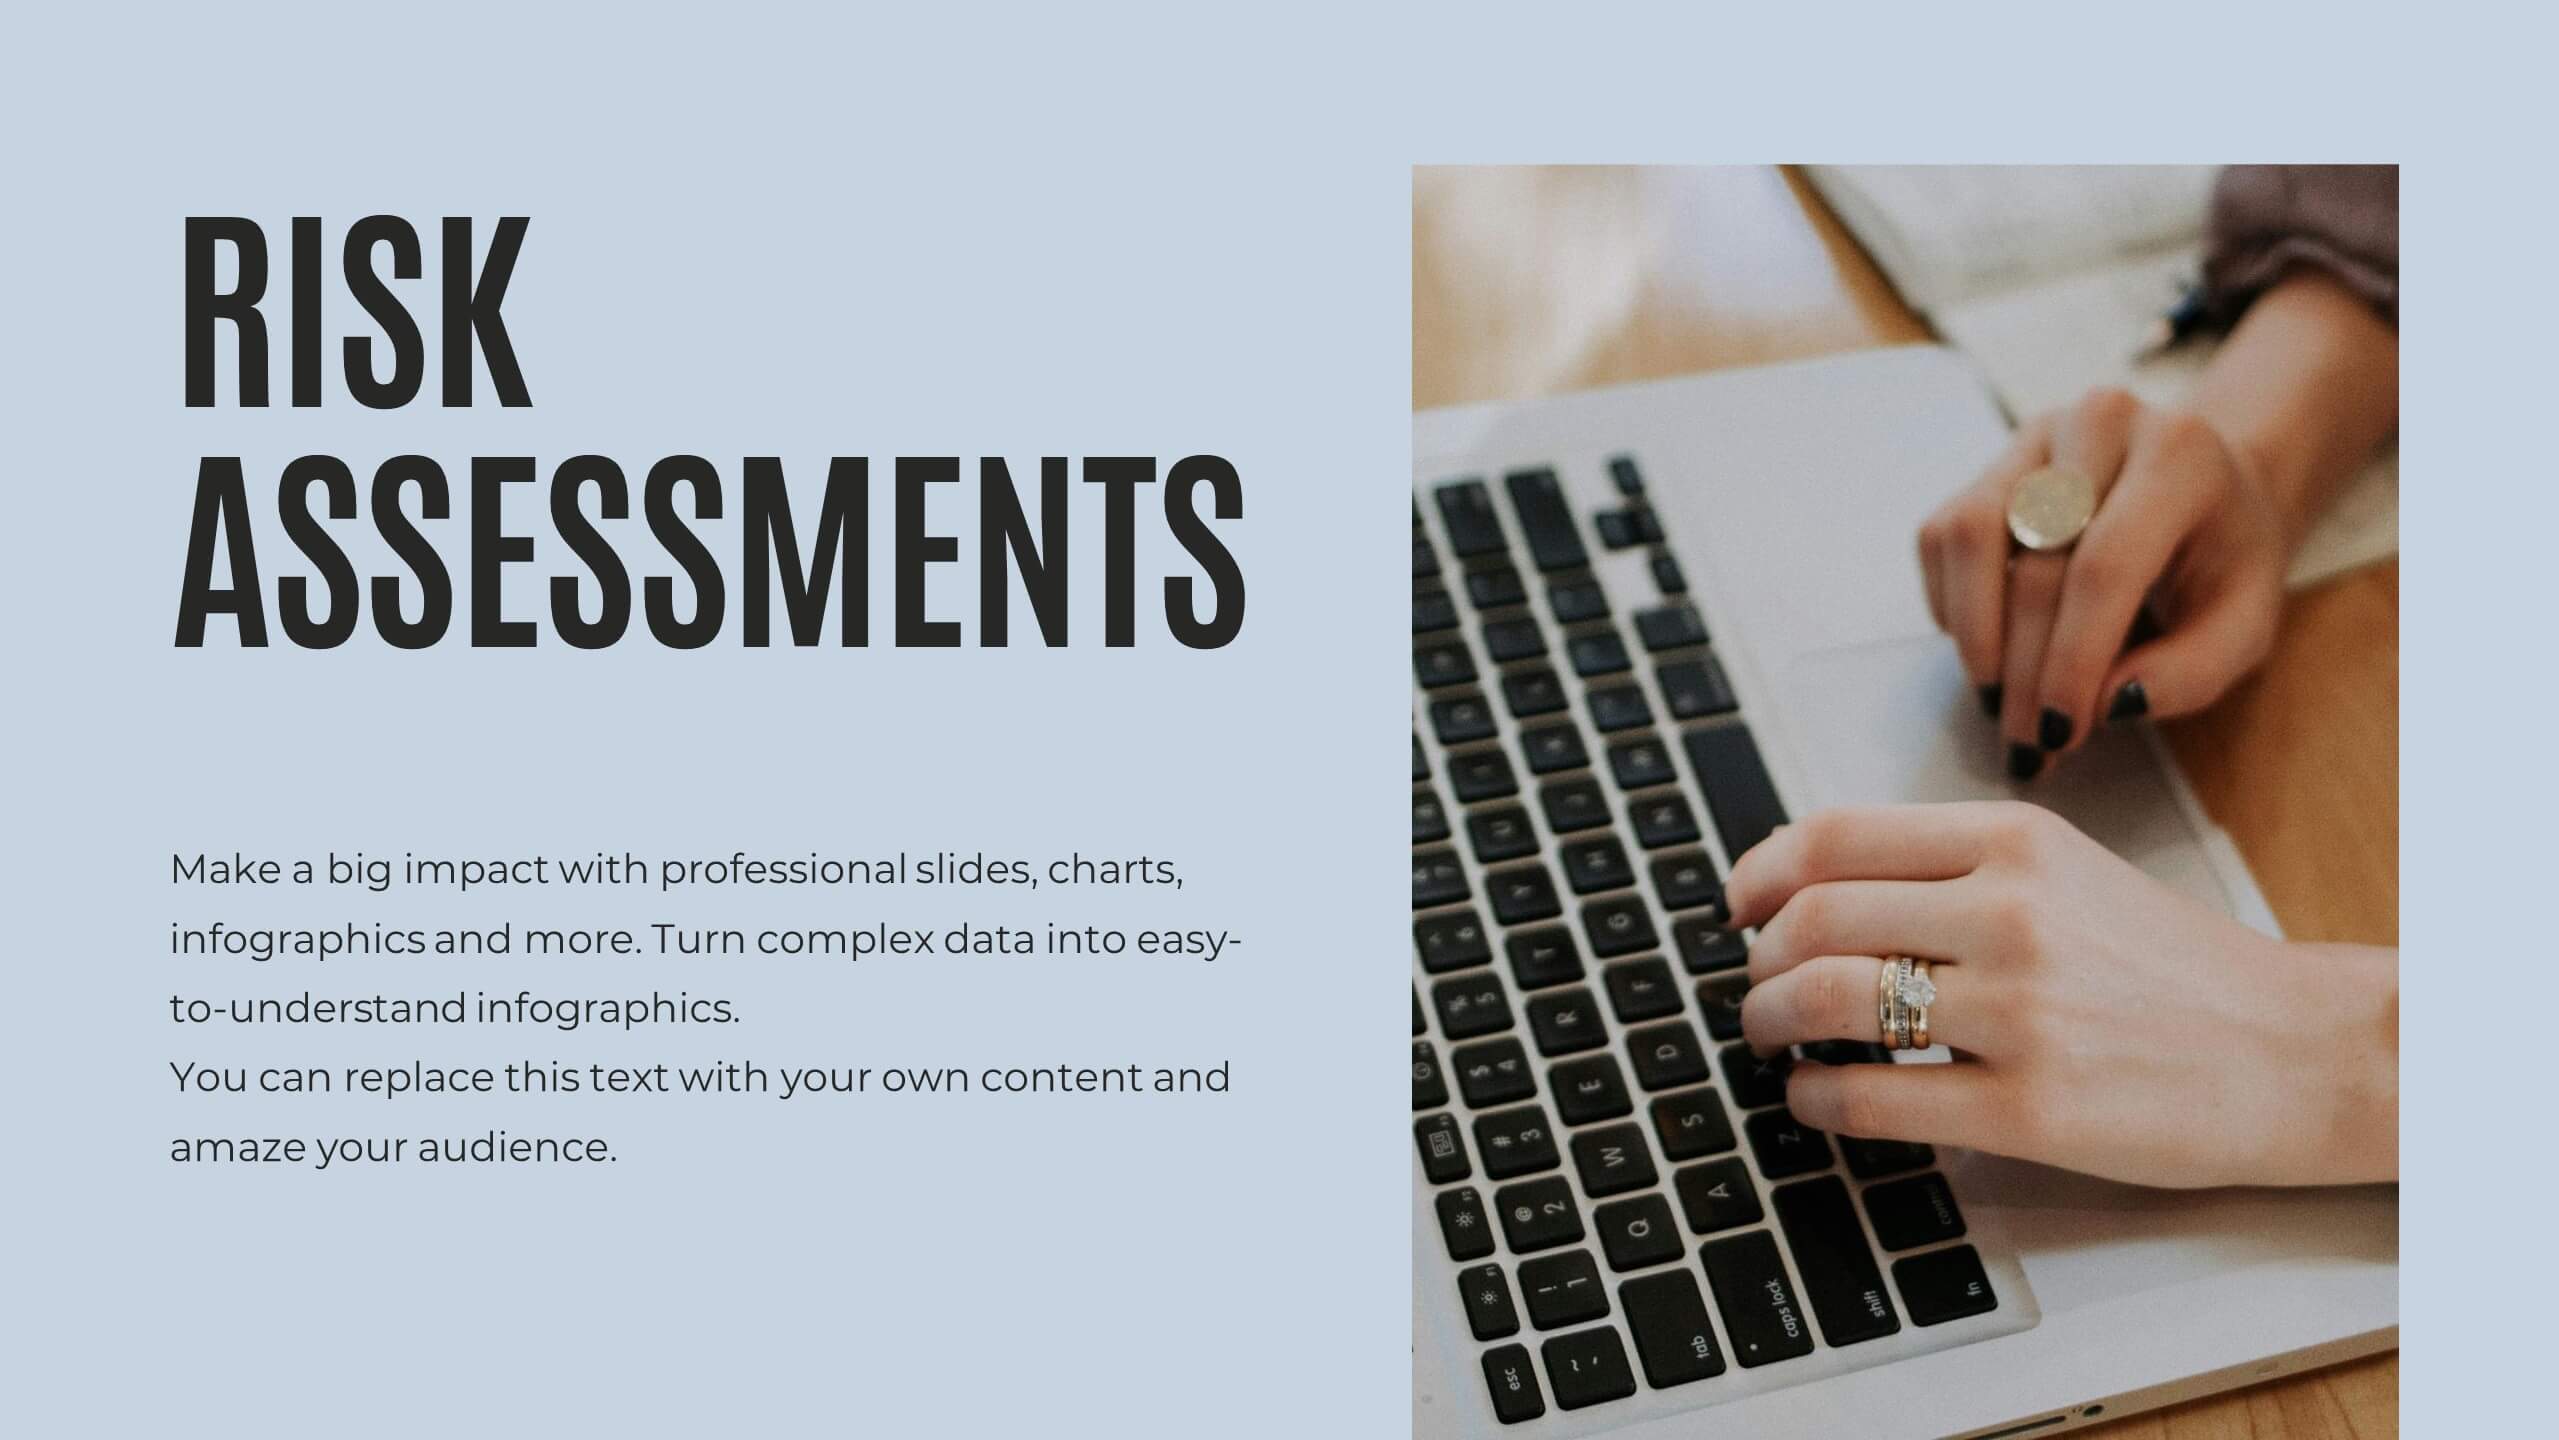
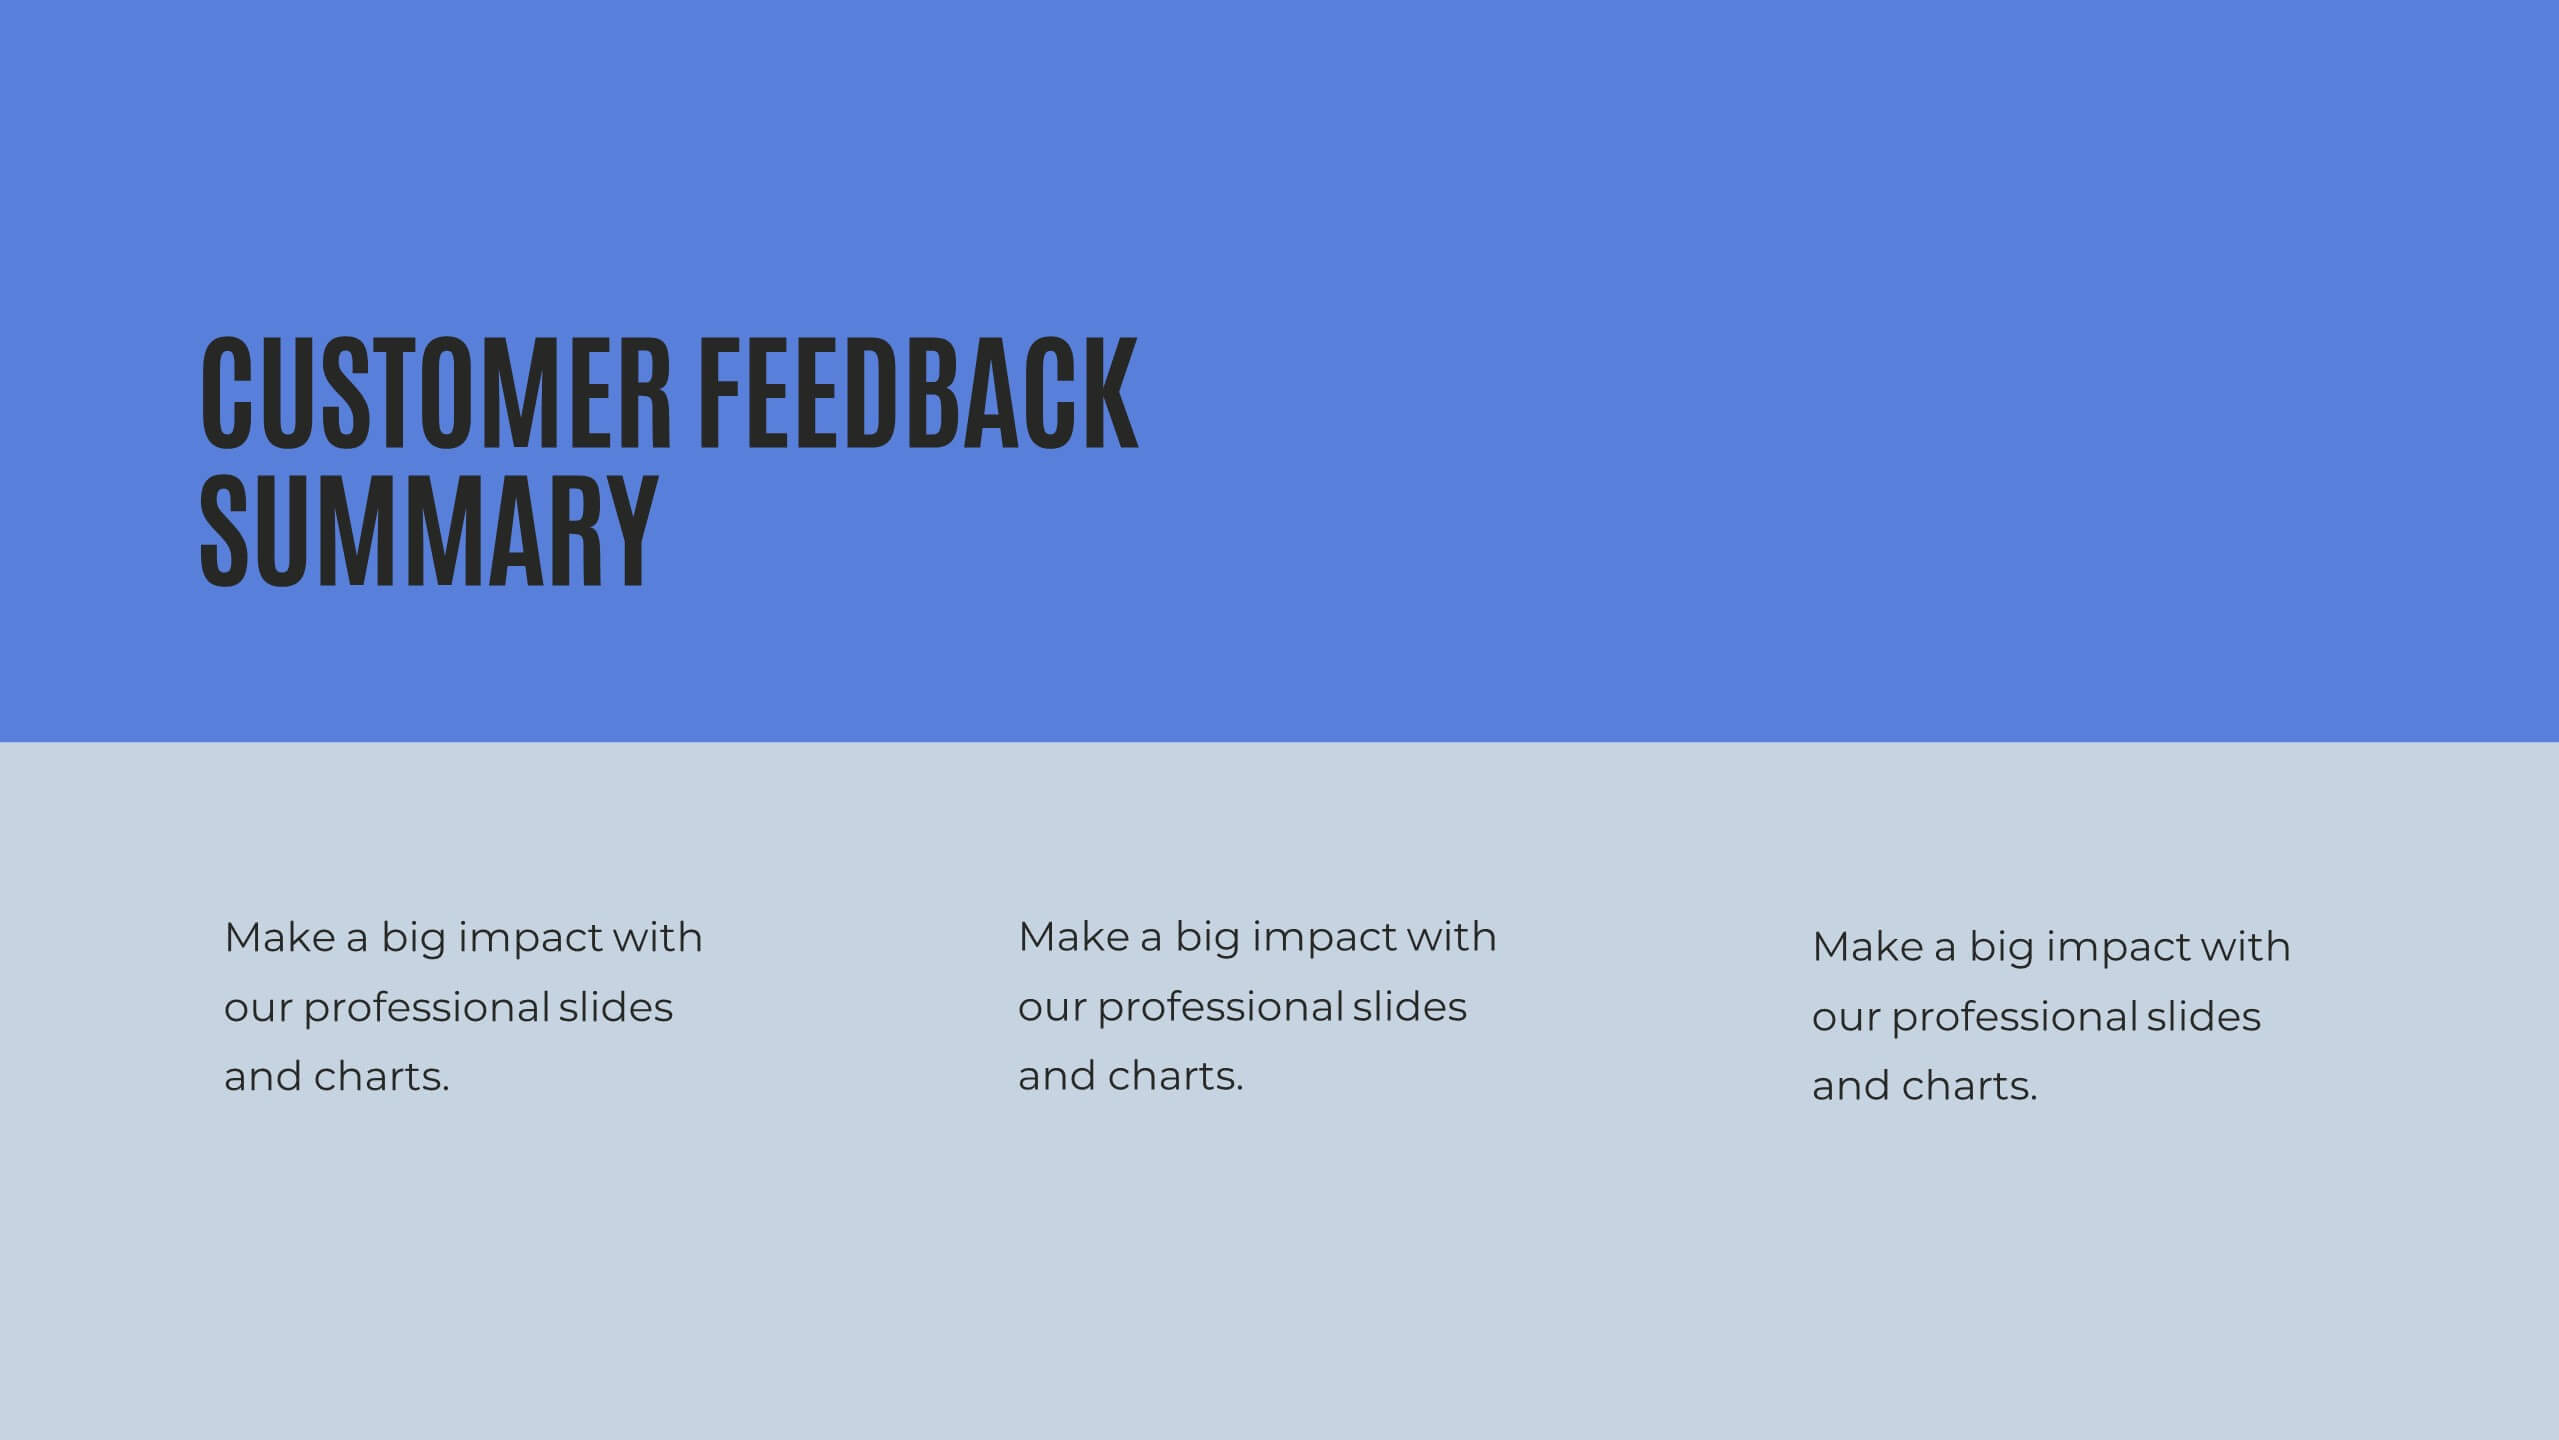
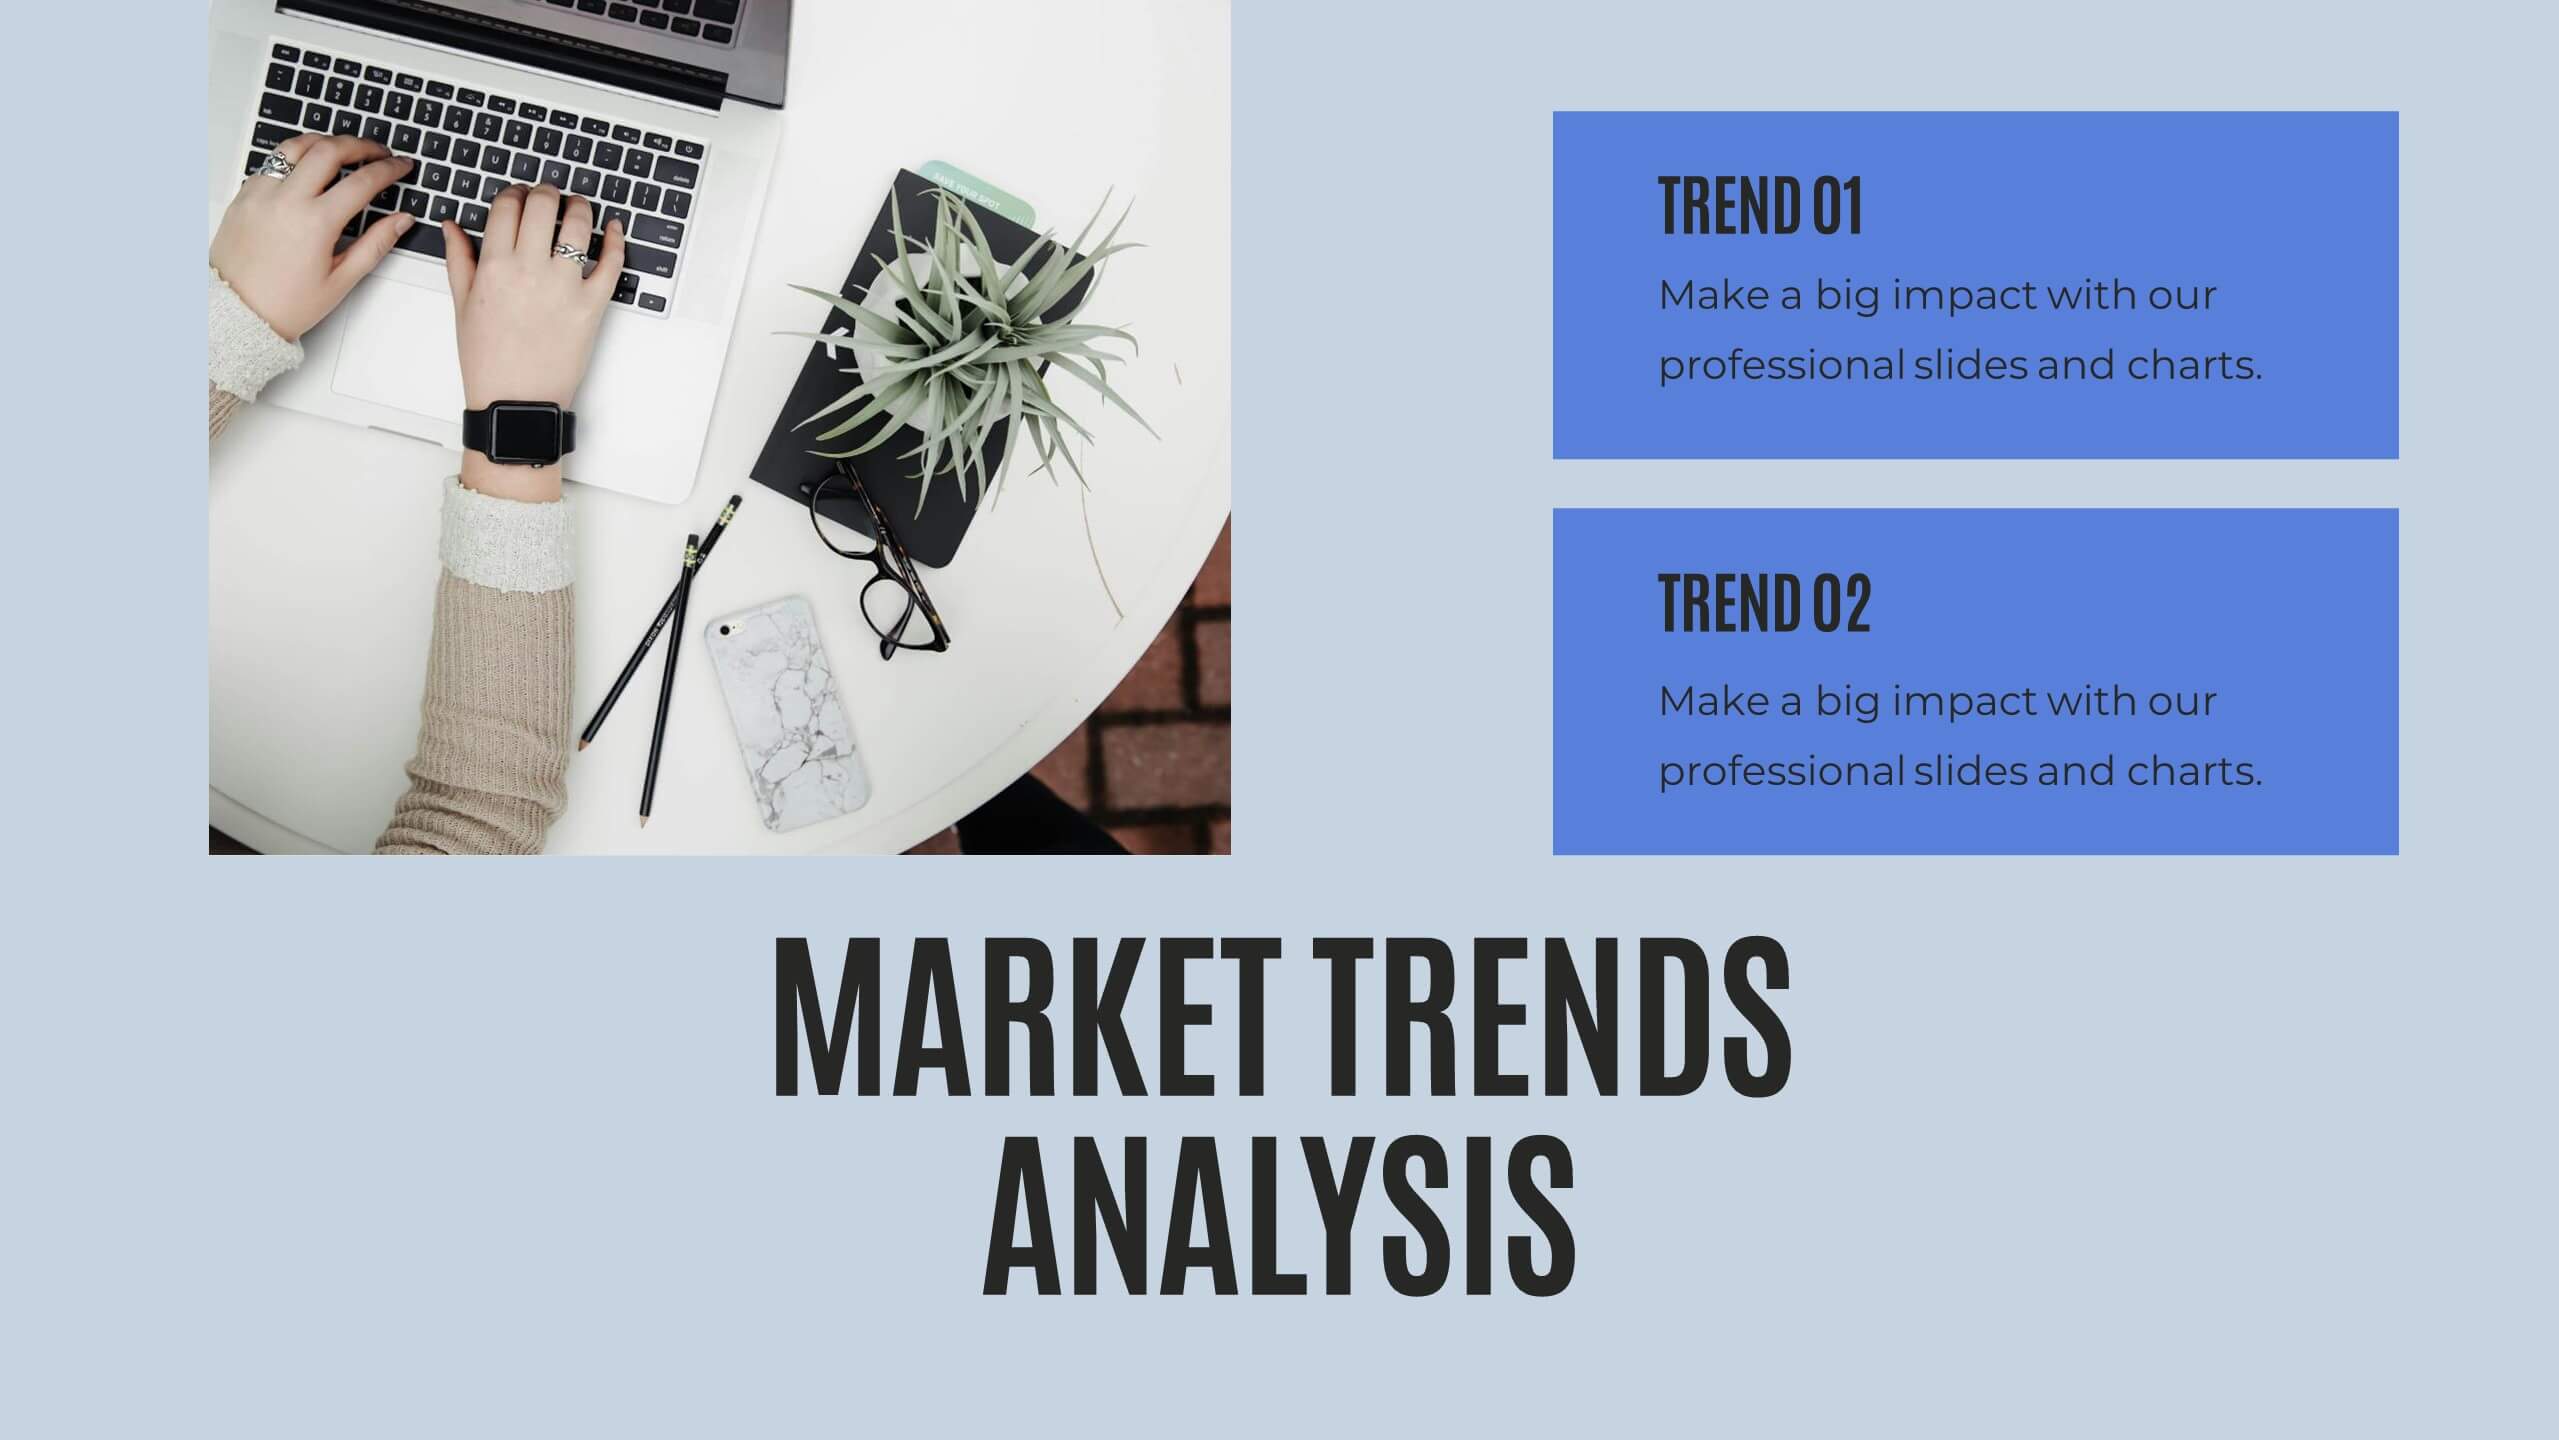
Quill Research Findings Report Presentation
Illuminate your findings with this comprehensive research report template! Perfect for presenting key highlights, performance metrics, and financial summaries, it features professional slides for project progress, risk assessments, and market trends analysis. Engage your audience with clear visuals and detailed content. Compatible with PowerPoint, Keynote, and Google Slides for seamless presentations on any platform.


6 slides
Corporate Health Metrics Dashboard Presentation
Take the pulse of your workplace with this dynamic health dashboard presentation layout. Designed to visualize employee wellness data, activity levels, and corporate health KPIs, this template blends clarity and creativity for impactful reporting. Easily customizable and fully compatible with PowerPoint, Keynote, and Google Slides to fit your presentation needs.


20 slides
Harmony Sales Forecast Presentation
Elevate your sales forecasting presentations with this vibrant and engaging template! Designed to captivate your audience, it covers all critical areas such as objectives, strategy, performance metrics, and opportunities. Keep your team motivated with visually striking layouts and an easy-to-follow structure. Compatible with PowerPoint, Keynote, and Google Slides for seamless integration!


7 slides
World Map Infographic Presentation Template
The world map includes 195 recognized countries around the globe. This geographic world map template includes detailed background information and facts on each country, with flags and outline images of each country. You can easily see where all 195 countries are located on this map, and which countries share borders with each other. This overall template design is easy to read and highly informative for any geography enthusiast who wants to learn more about the different countries in the world. This World map template include all continents, regions of the world, oceans and seas.


6 slides
Business Success Case Study
Showcase your brand's impact with this clean, image-forward case study slide. Designed for storytelling, it outlines the Problem, Solution, and Approach alongside a product image—perfect for client wins, pitch decks, and brand storytelling. Fully customizable in PowerPoint, Keynote, and Google Slides.