


Features
- 5 Unique slides
- Fully editable and easy to edit in Microsoft Powerpoint, Keynote and Google Slides
- 16:9 widescreen layout
- Clean and professional designs
- Export to JPG, PDF or send by email


Do you have any questions?
Recommend


6 slides
Customer Empathy Map Infographics
Enhance your understanding of your customers' needs with our Customer Empathy Map infographic template. This template is fully compatible with popular presentation software like PowerPoint, Keynote, and Google Slides, allowing you to easily customize it to empathetically connect with your target audience. The Customer Empathy Map infographic template offers a visually engaging platform to explore and document your customers' thoughts, feelings, pains, and gains. Whether you're a marketer, product manager, or business owner, this template provides a user-friendly canvas to create customer profiles that drive better decision-making and customer-centric strategies. Elevate your customer relations with this SEO-optimized Customer Empathy Map infographic template, thoughtfully designed for clarity and ease of use. Customize it to gain insights into your customers' experiences, challenges, and aspirations, enabling you to tailor your products and services to their specific needs. Start crafting your personalized empathy map today to build stronger, more empathetic customer relationships.


3 slides
Project Proposal Executive Summary
Summarize your project proposal with clarity and visual appeal using this clean executive slide. Highlight key metrics, growth indicators, and progress updates alongside a modern photo layout that keeps your audience engaged. This template is fully customizable and compatible with PowerPoint, Keynote, and Google Slides for easy, polished presentations.


3 slides
Logistics and Inventory Flow Strategy Presentation
Visualize your operational flow with the Logistics and Inventory Flow Strategy Presentation. Designed with 3D-style isometric elements, this slide helps illustrate key stages of shipping, warehousing, and delivery. Easily customize icons, colors, and titles to reflect your supply chain or inventory management strategy. Compatible with PowerPoint, Keynote, and Google Slides.


4 slides
Key Pillar Infographic Slide Presentation
Make your ideas stand tall with this modern pillar-themed infographic layout. Perfect for illustrating strategies, business foundations, or organizational principles, it transforms complex data into visually clear, structured visuals. Fully editable and compatible with PowerPoint, Keynote, and Google Slides for professional and easy-to-customize presentations.


5 slides
Market Segmentation Strategy Presentation
Refine your approach with our "Market Segmentation Strategy" presentation template. Perfect for marketers looking to target specific consumer bases, this layout visually divides your market into manageable segments. It's ideal for presentations on market analysis and targeted marketing strategies, ensuring compatibility with PowerPoint, Keynote, and Google Slides to accommodate any presentation environment.


5 slides
SEO Strategies Infographics
Immerse yourself in the dynamic world of digital marketing with our SEO strategies infographics. Rendered in bold black, vibrant orange, and various eye-catching colors, this creative and vertical template serves as a beacon for marketing professionals, digital strategists, and entrepreneurs who aim to conquer the digital space. Each element, from engaging graphics to interpretative icons, is specifically tailored to present SEO methodologies with clarity and charisma. This infographic template is not only a visual treat but a reservoir of insights, facilitating users to communicate influential SEO tactics effectively and drive their brand's online visibility forward.


28 slides
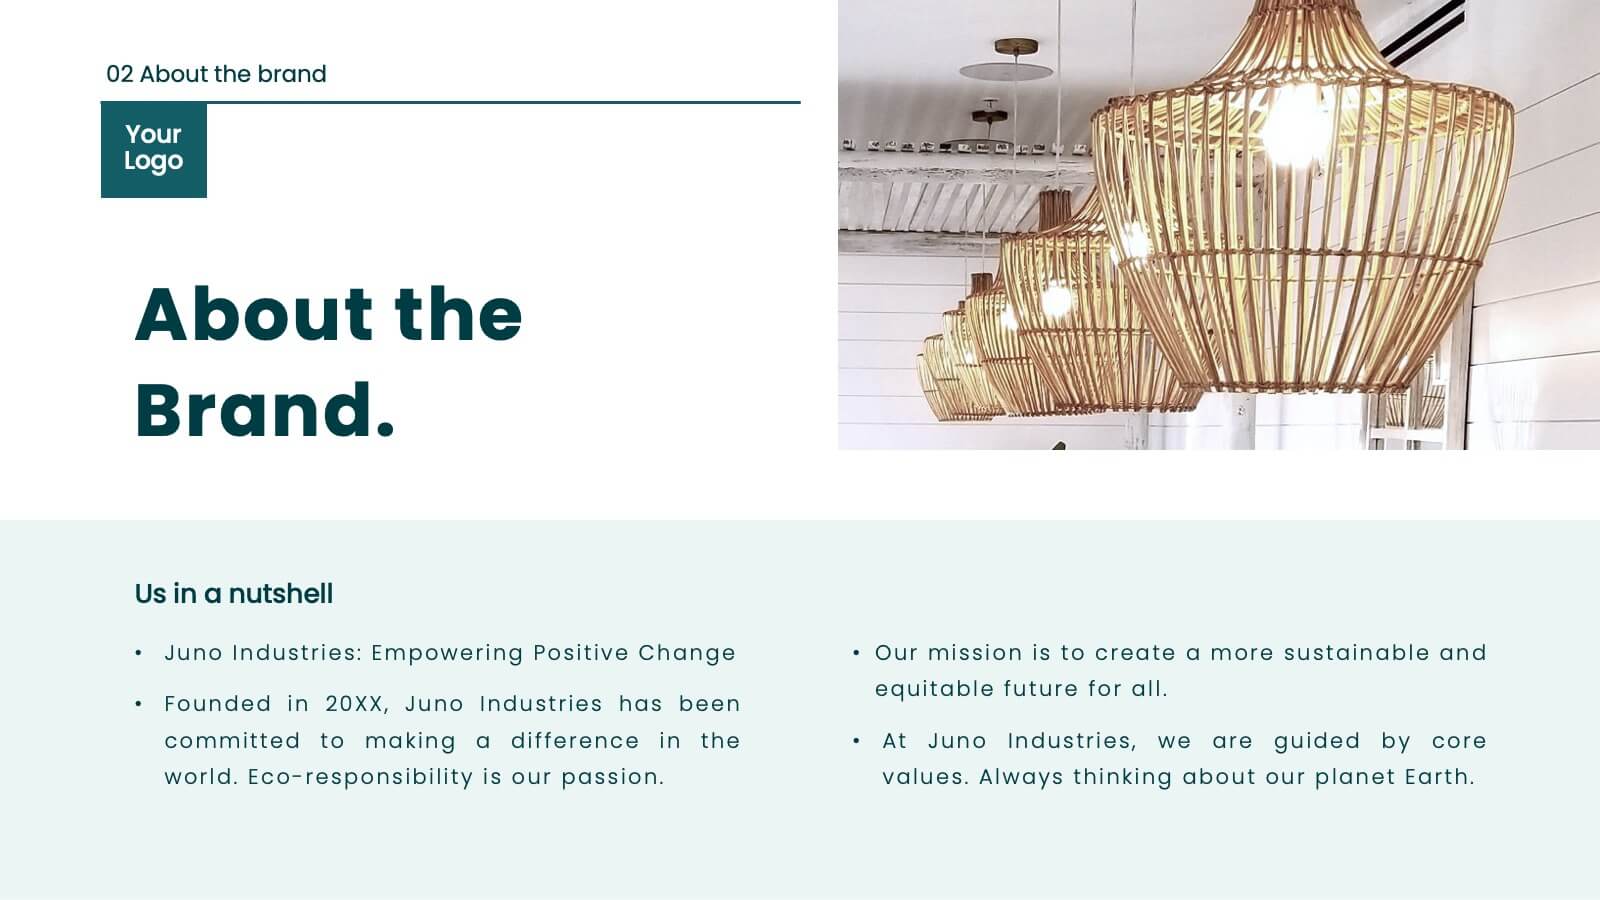
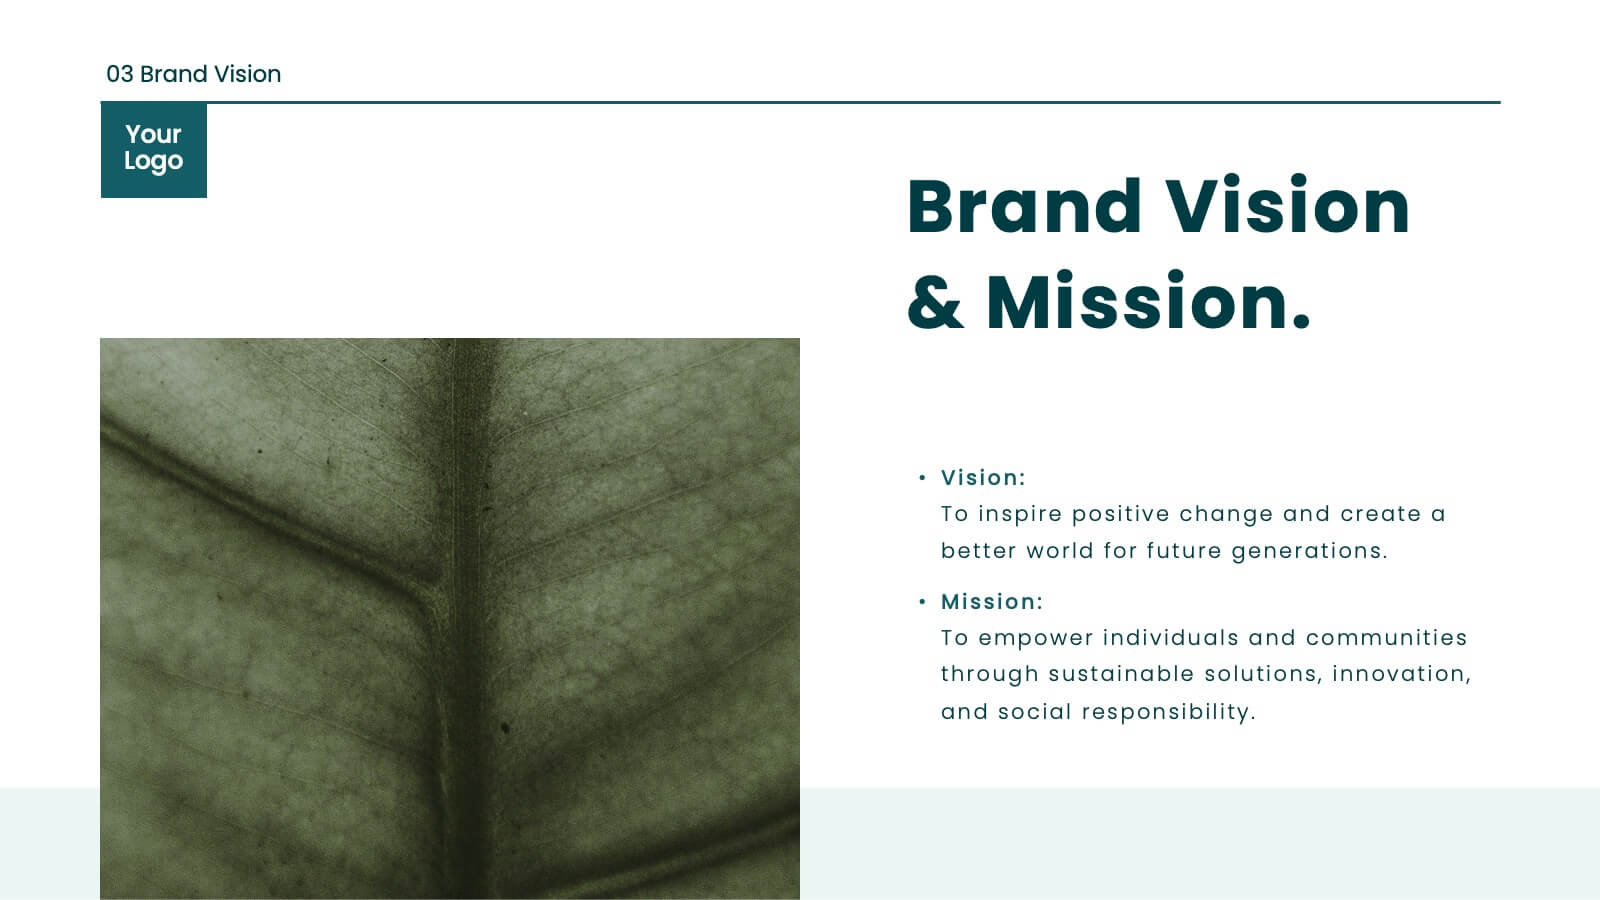
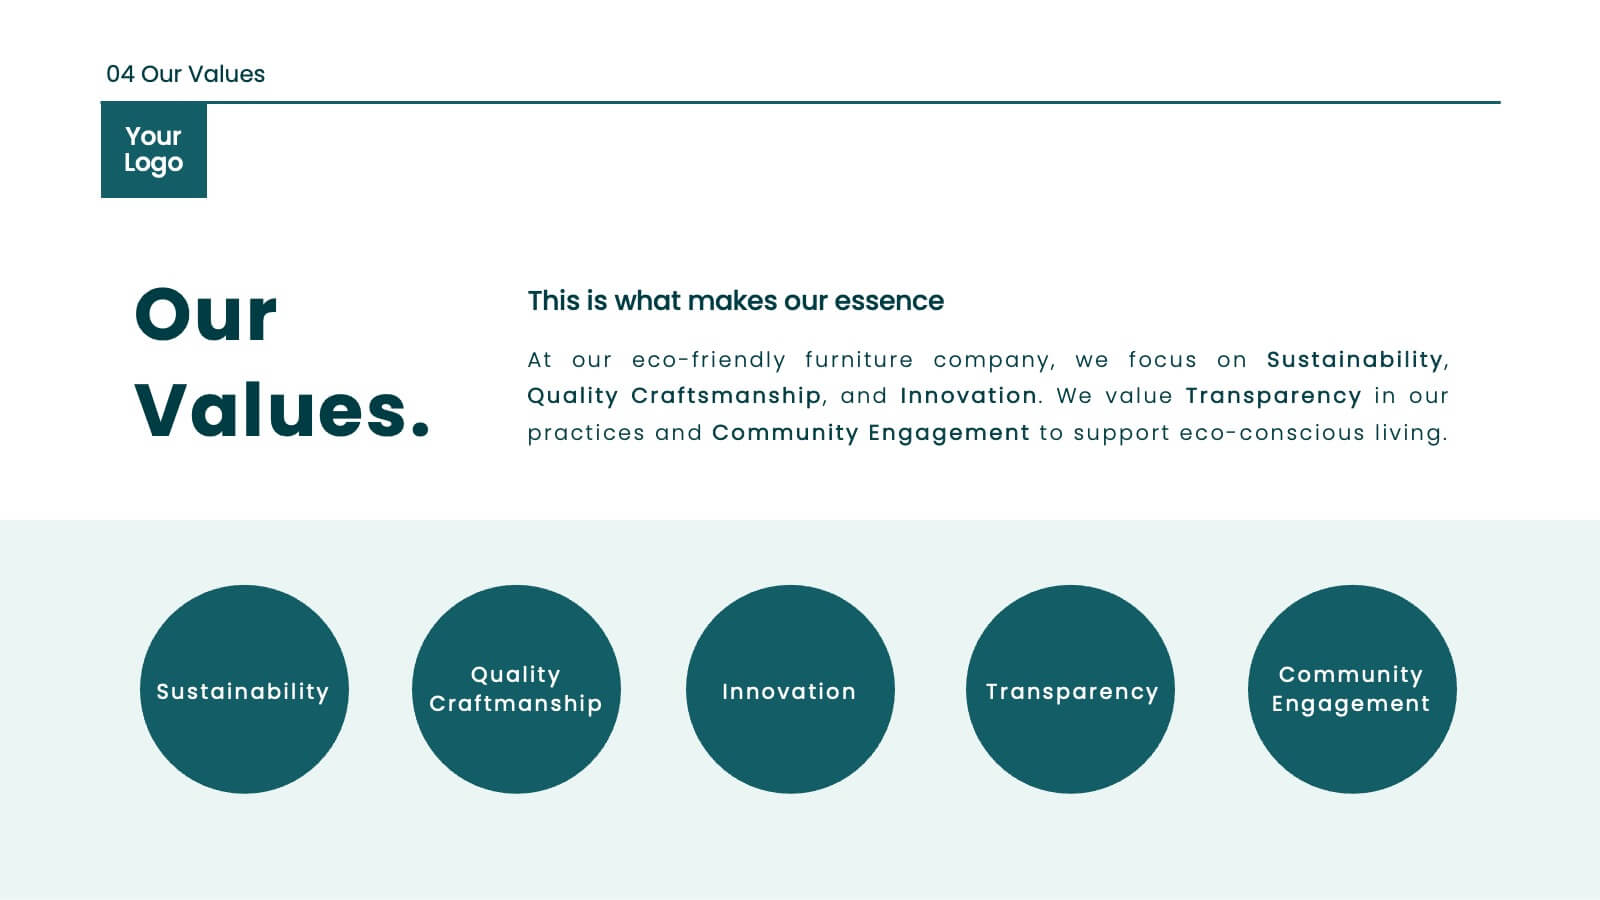
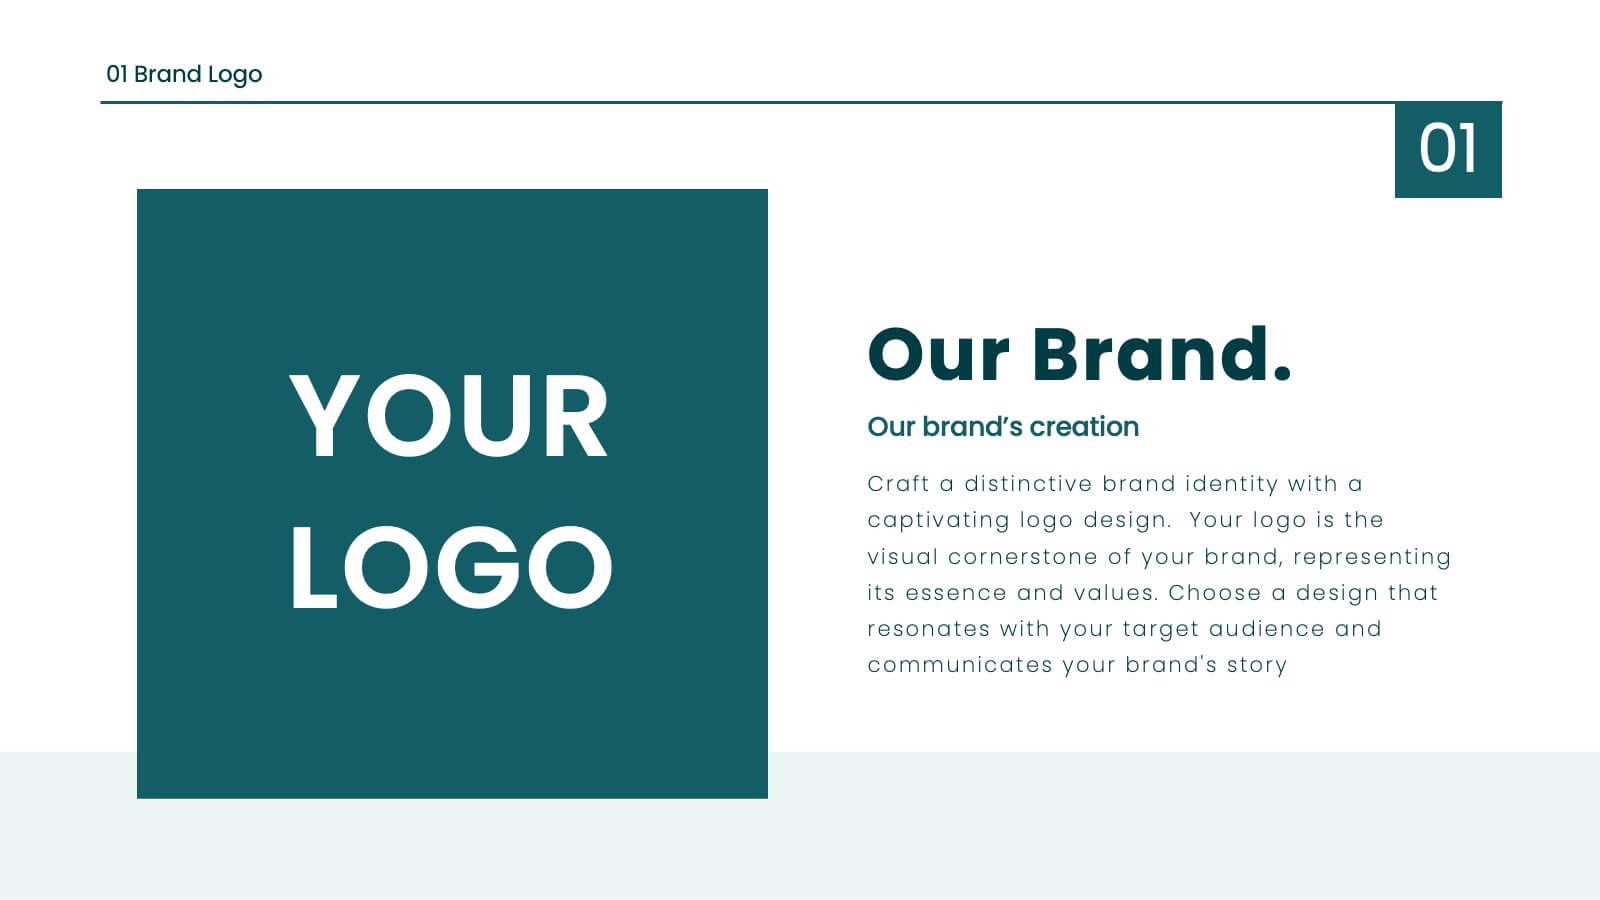
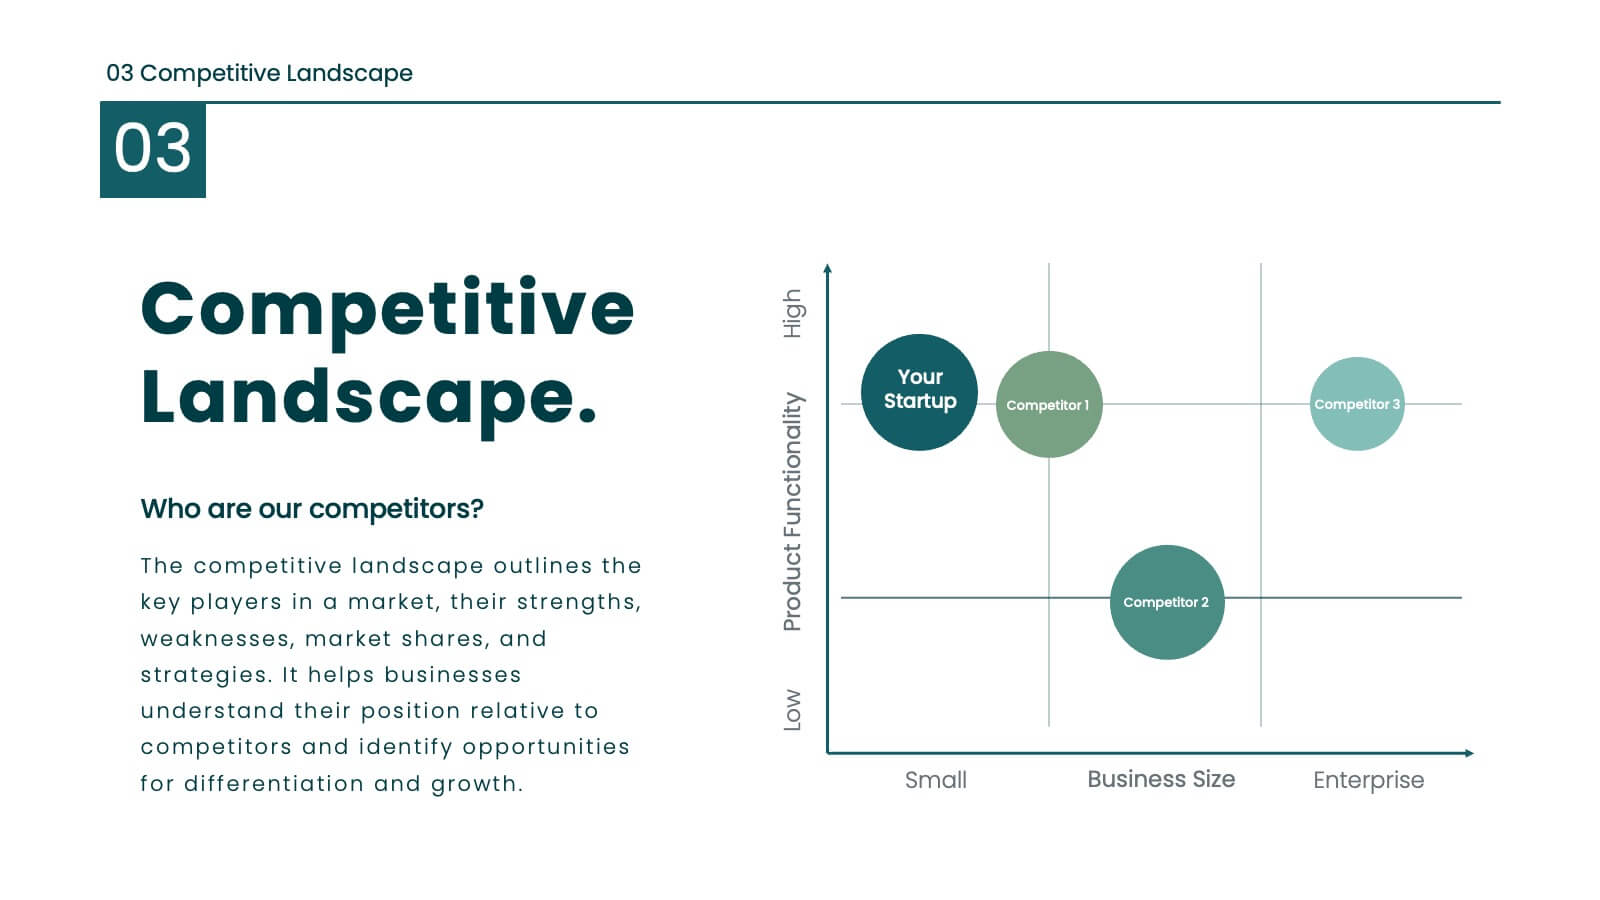
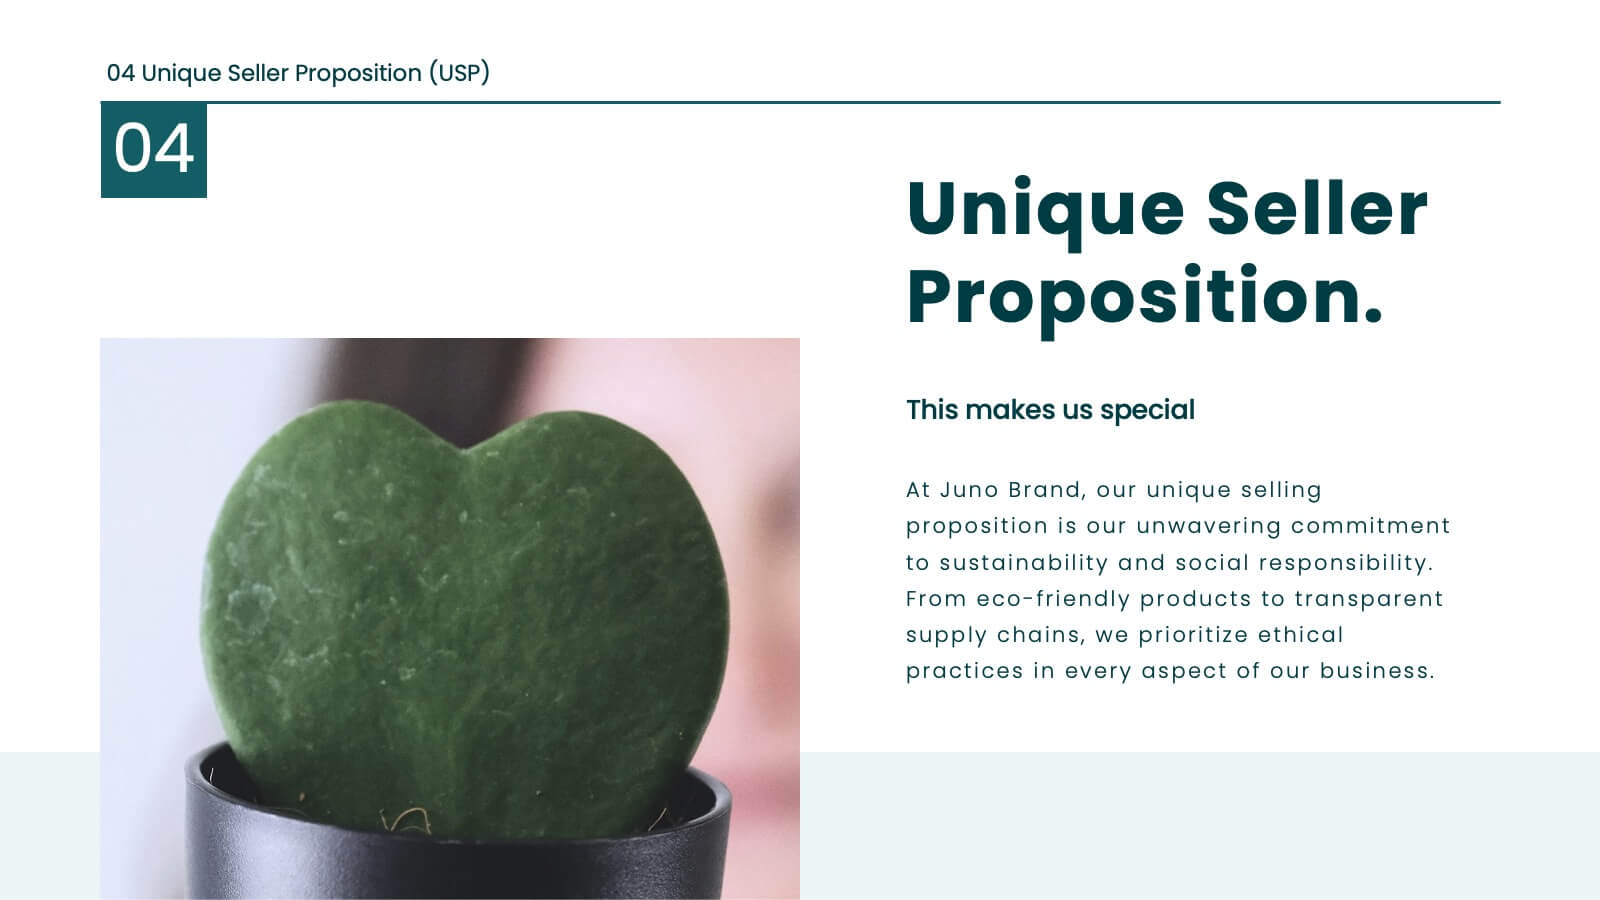
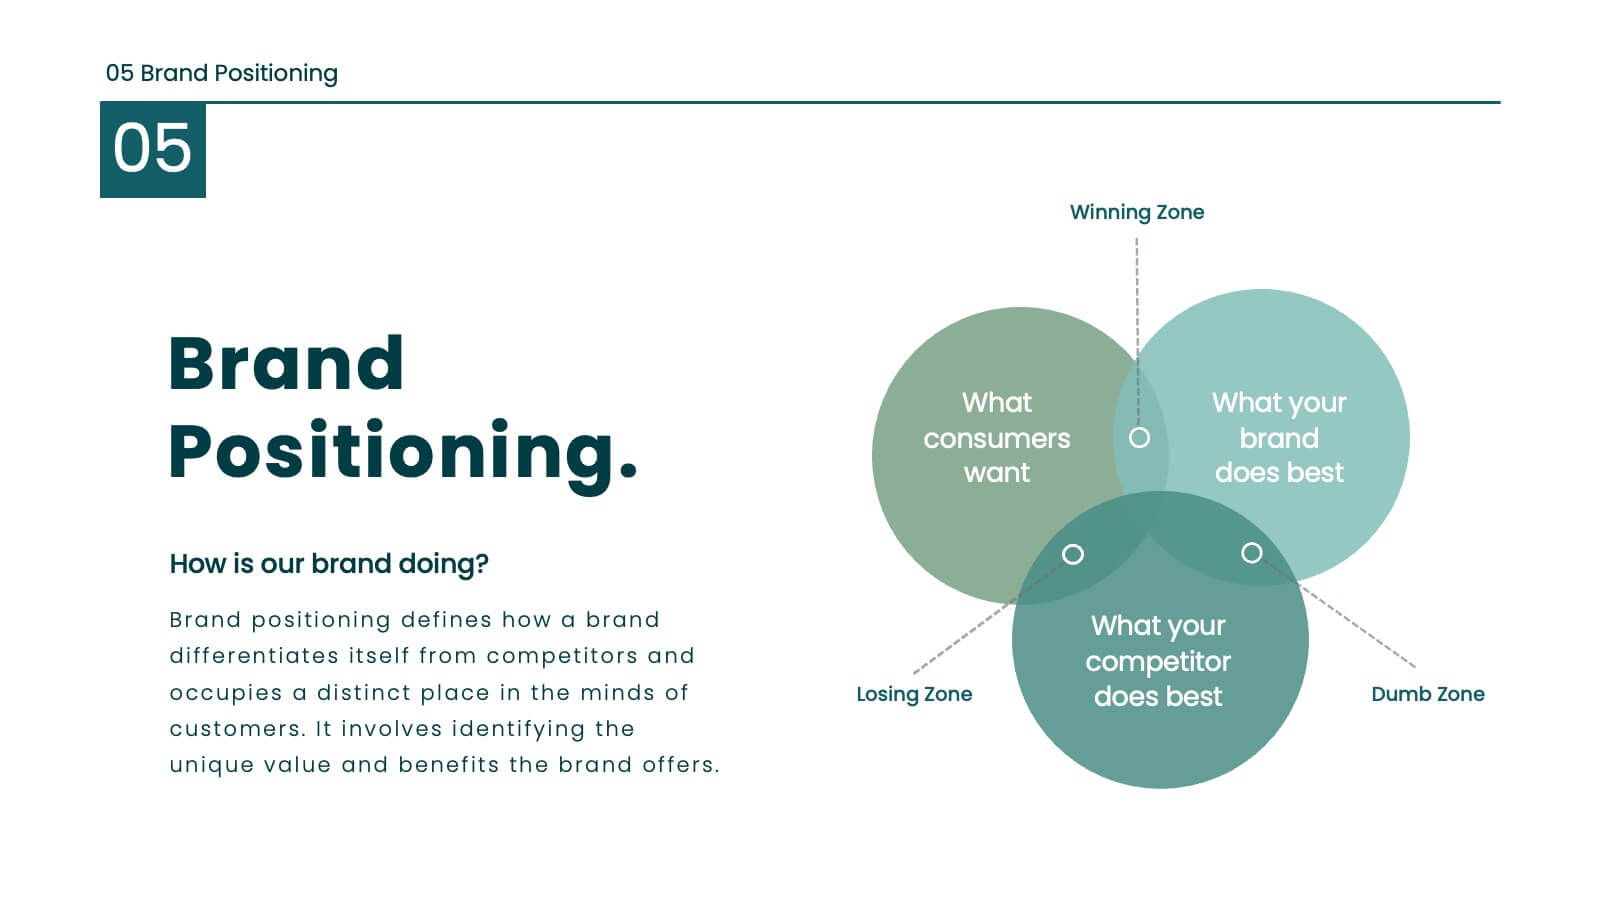
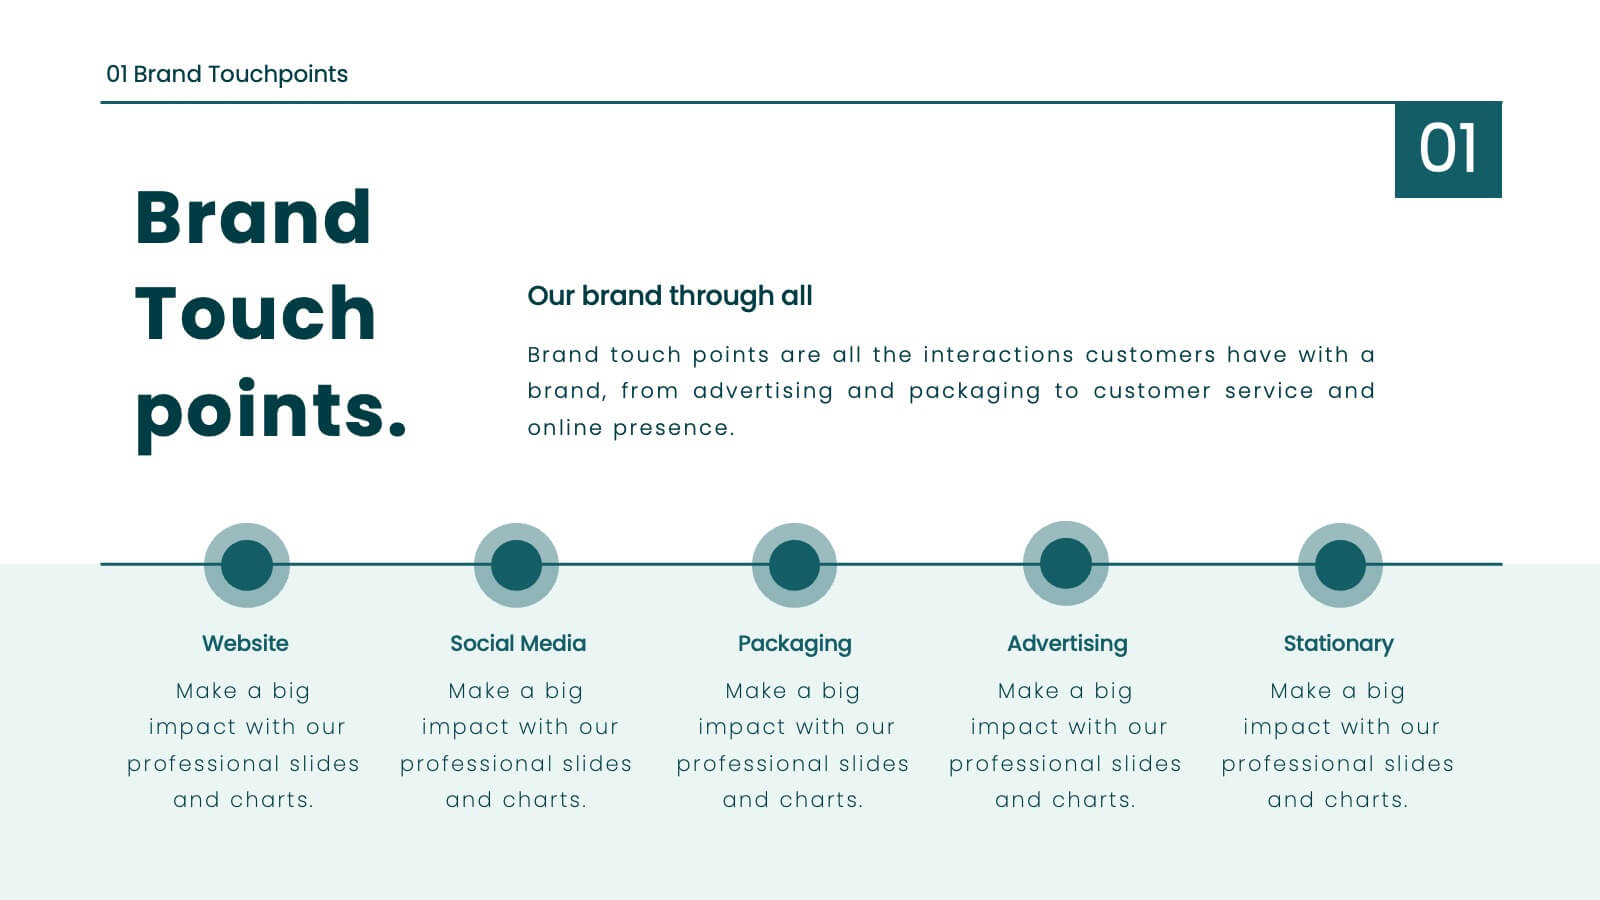
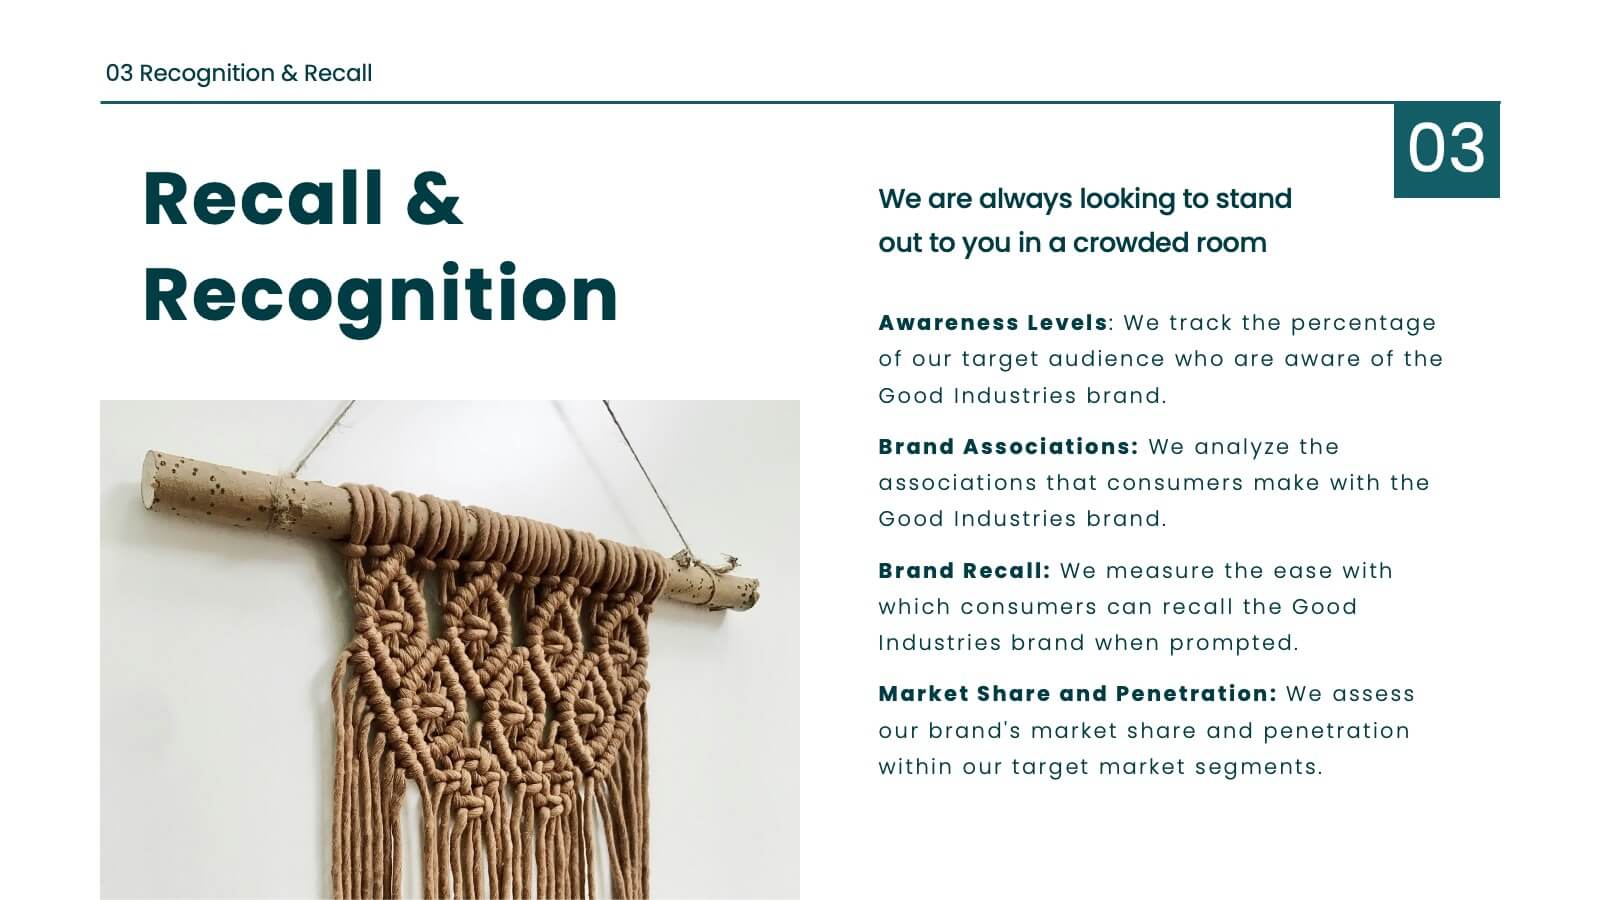
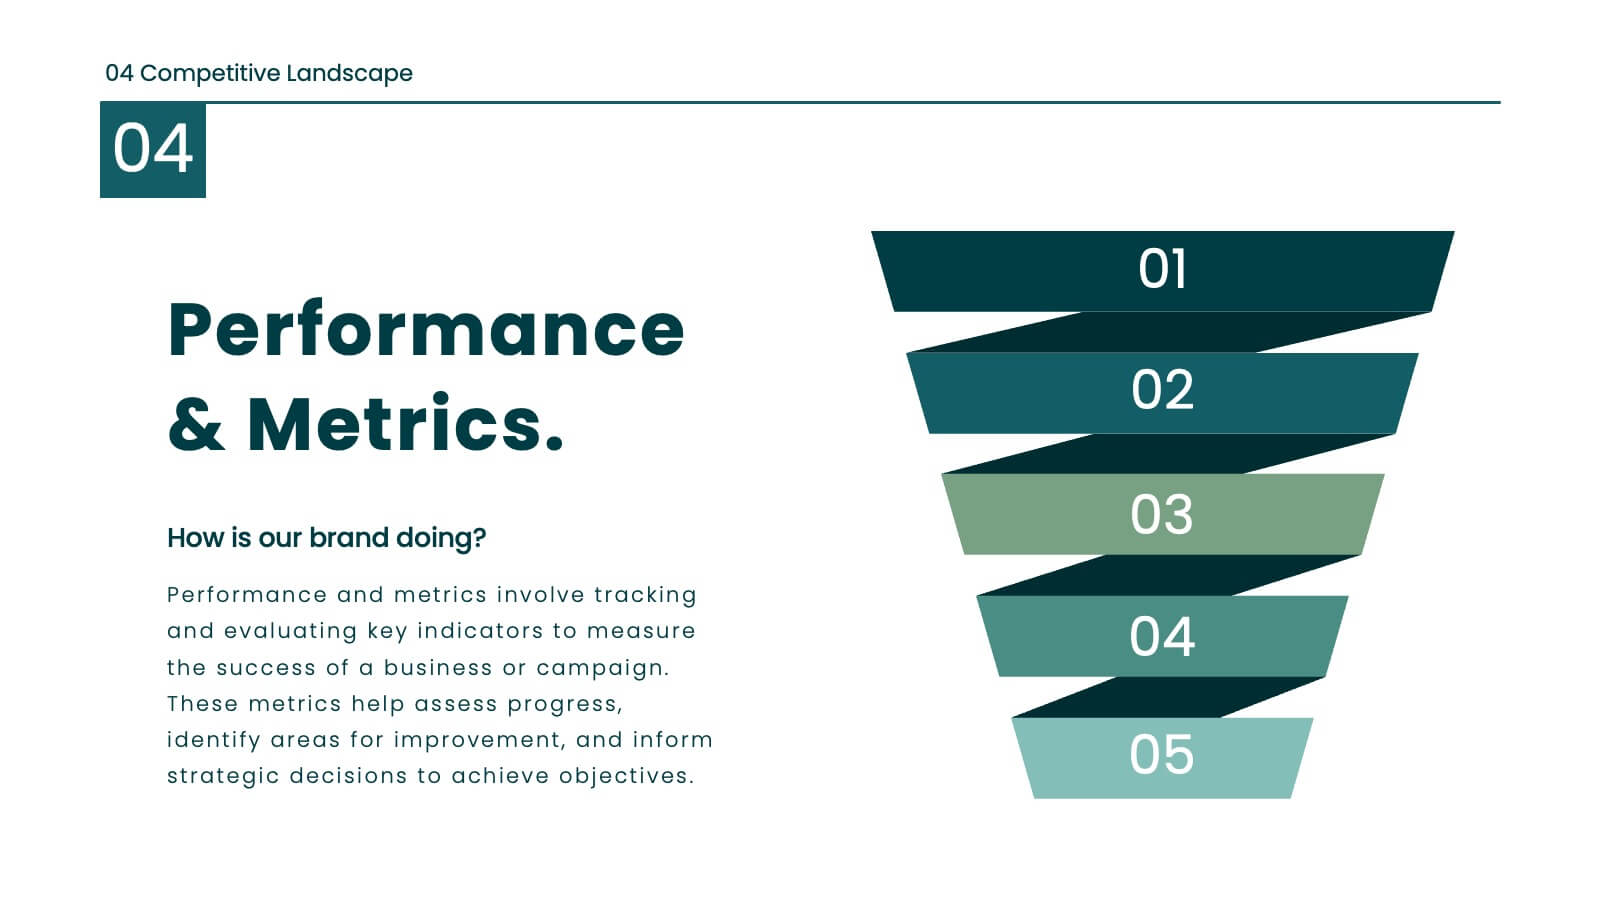
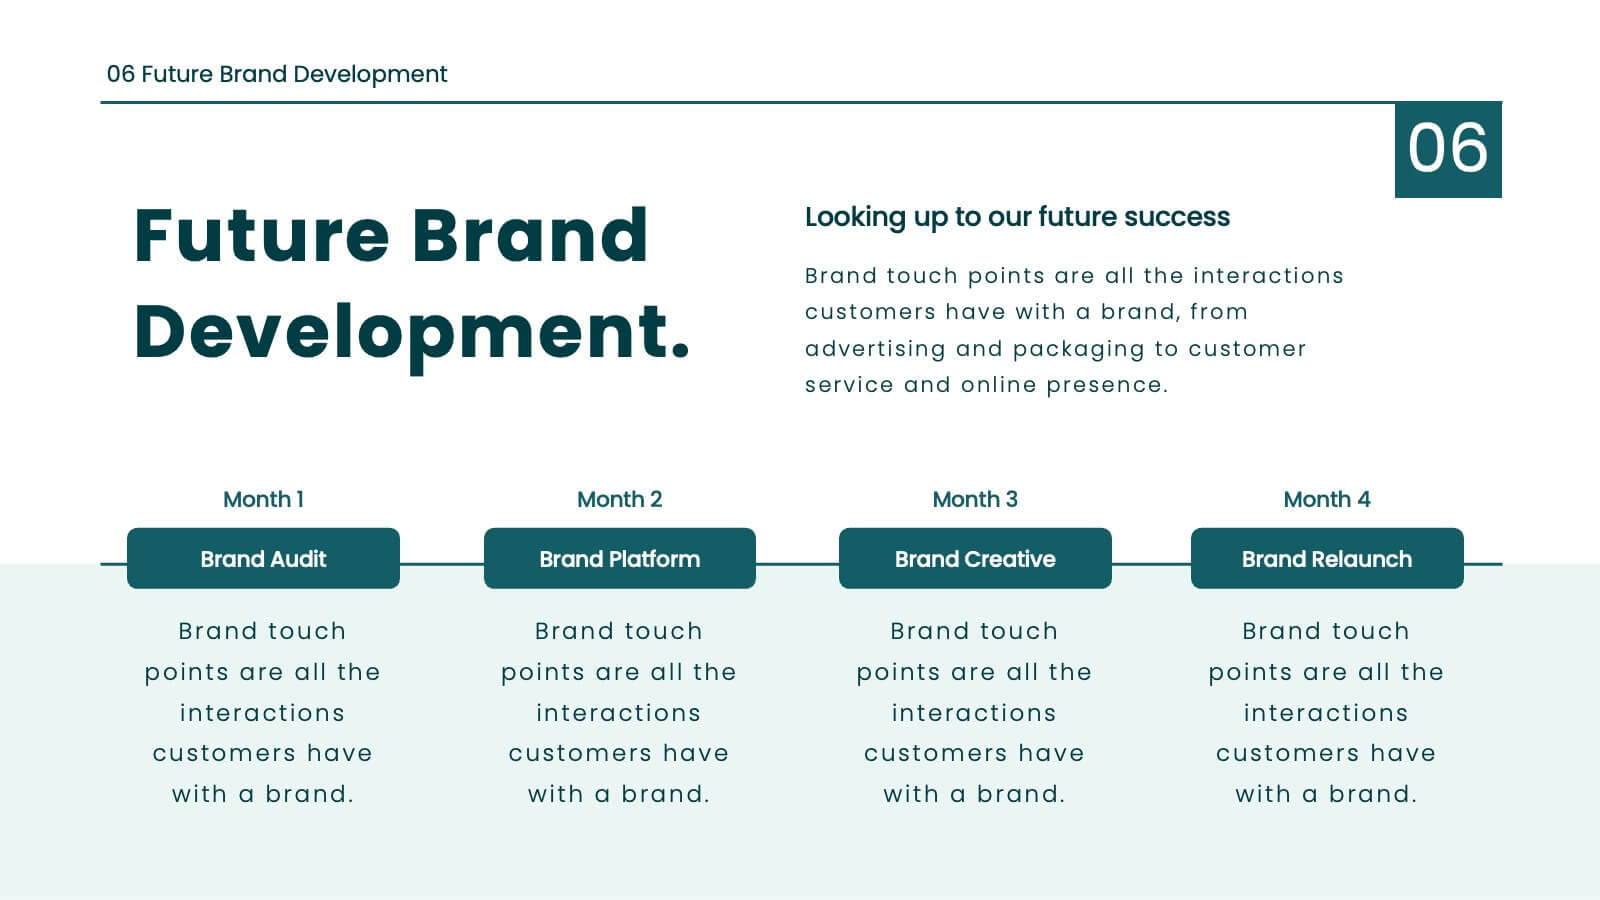
Juno Brand Guidelines Proposal Presentation
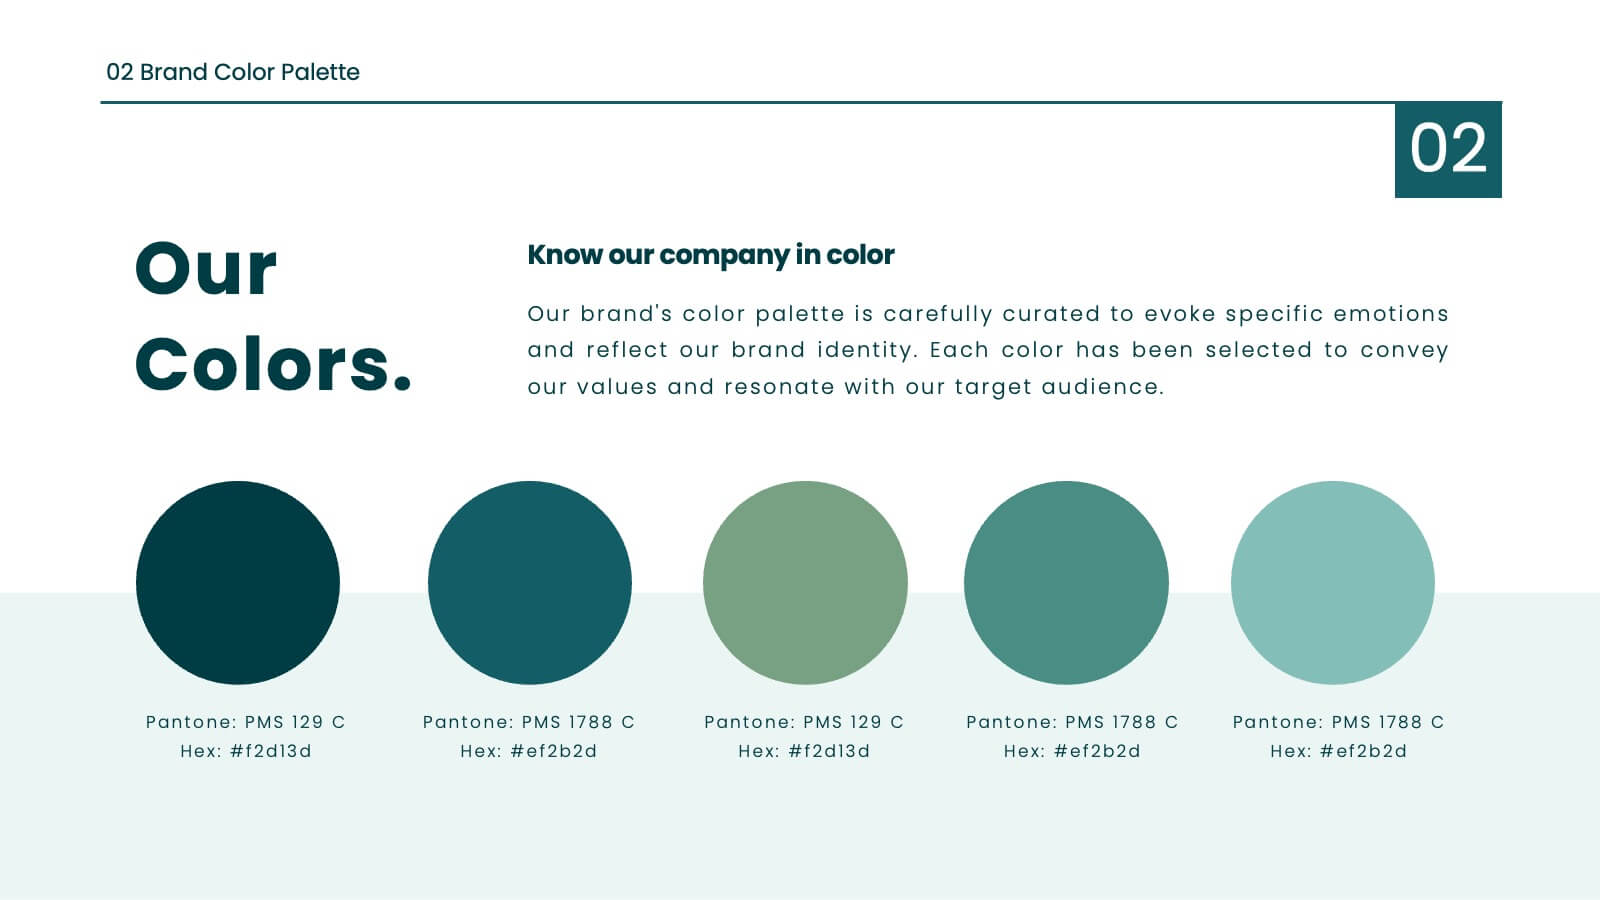
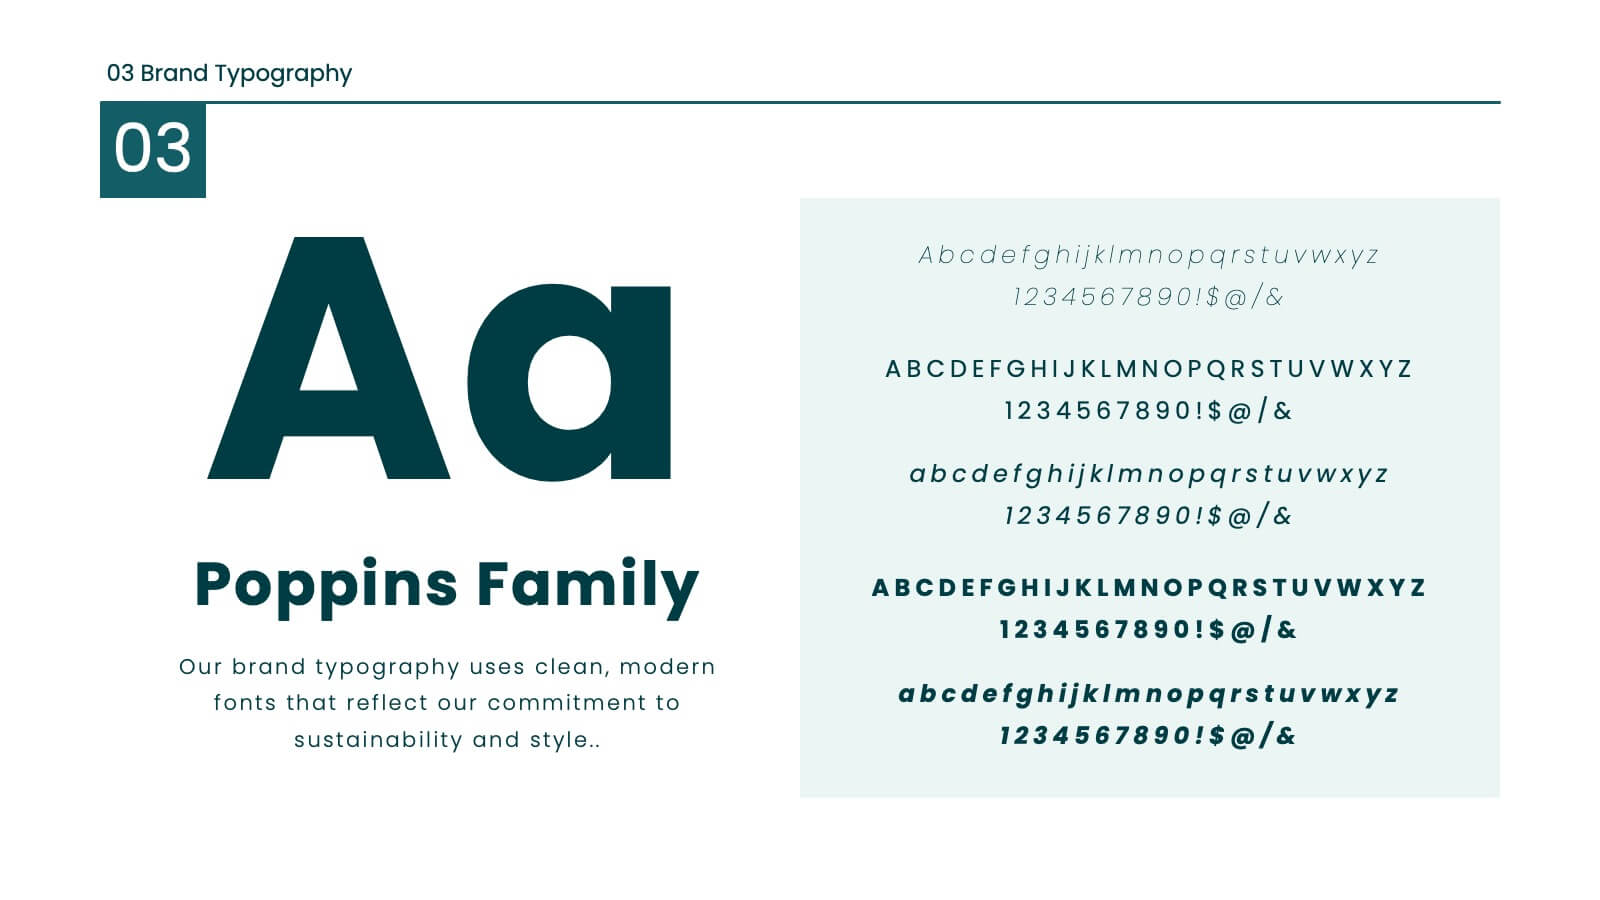
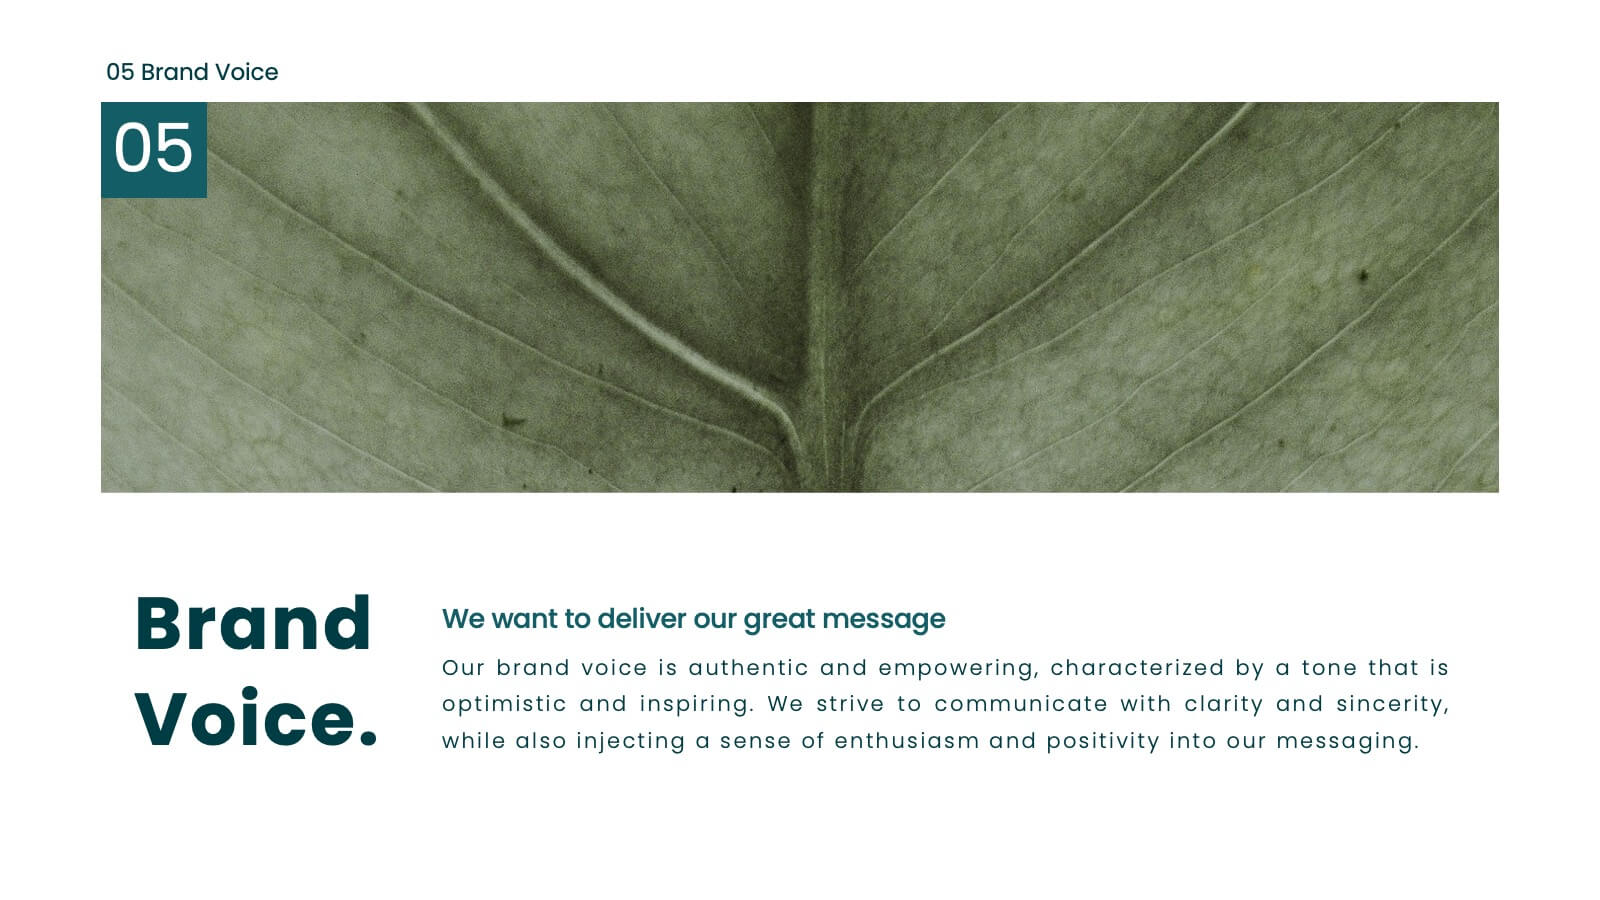
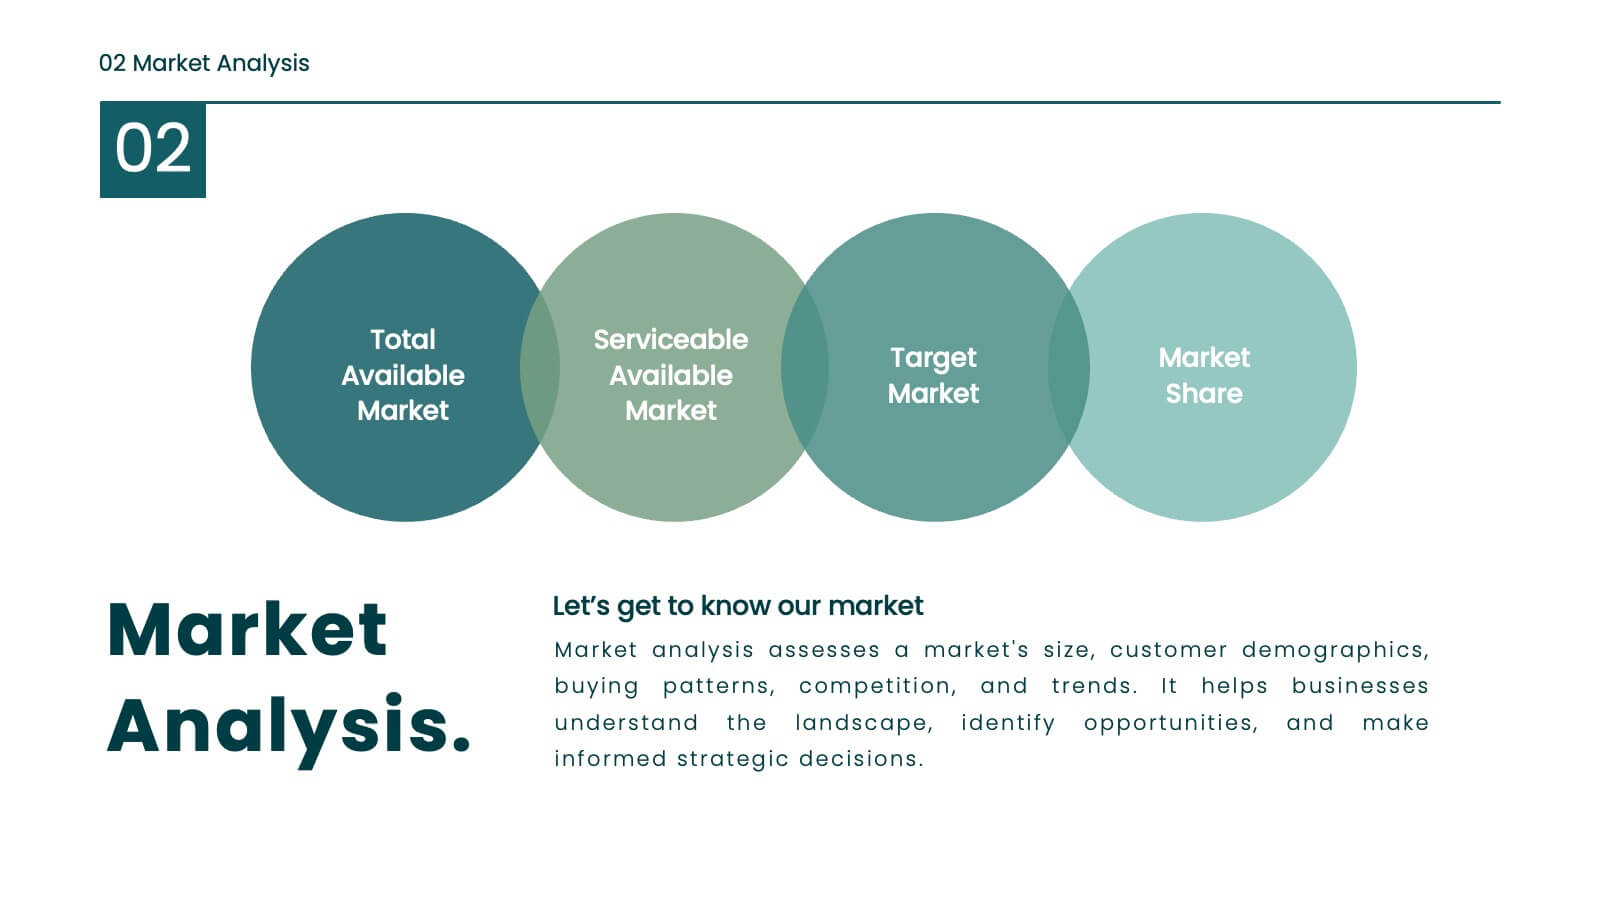
Define your brand's identity with this comprehensive, stylish presentation template. Perfect for detailing brand guidelines, vision, mission, and market analysis, it features a clean design with a professional layout. Highlight key elements like color palettes, typography, and unique selling propositions to ensure consistency and clarity. Compatible with PowerPoint, Keynote, and Google Slides, it’s ideal for any platform.


7 slides
Operational Workflow Chart Presentation
Turn complex operations into clear, engaging visuals with this clean, structured presentation design. Ideal for outlining procedures, systems, or process improvements, it helps your audience easily follow each stage from start to finish. Fully customizable and compatible with PowerPoint, Keynote, and Google Slides for effortless editing and professional results.


7 slides
Big Data Analytic Infographics
Big Data are the large and complex data sets that are difficult to process and analyze using traditional data processing methods. This template will allow you to visualize key data points and insights in an appealing and easy to digest way. Your information is presented in a clear manner with a variety of graphs, to convey the fundamentals of big data analytics. Customize this infographic with your own data in the bullet points and graphics. Quickly edit text and colors for your next presentation. All the slide in this template are fully editable in Powerpoint, Keynote, and Google Slides.


10 slides
South America Business Development Growth Map Presentation
Showcase business growth insights with this South America-focused development map. Featuring vibrant bar-style columns aligned with country highlights, this layout helps visualize economic potential, investment zones, and performance indicators. Perfect for regional strategy presentations, market analysis, and expansion proposals. Fully editable for PowerPoint, Keynote, and Google Slides compatibility.


6 slides
Business Value Chain Strategy
Turn your strategy into a winning move with this interactive spin on business value chains. This engaging diagram template helps break down key activities and visualize how each stage adds value—perfect for process optimization or stakeholder presentations. Fully compatible with PowerPoint, Keynote, and Google Slides.


4 slides
Circular Strategy Model Presentation
Turn your ideas into a story that flows effortlessly with this clean and modern presentation design. Perfect for visualizing continuous improvement, collaboration strategies, or organizational frameworks, it helps you present key points in a clear circular format. Fully compatible with PowerPoint, Keynote, and Google Slides for easy customization.


4 slides
KPI and Business Performance Dashboard
Drive strategic insights with this sleek KPI and business dashboard template. Highlight key metrics, trends, and performance results using easy-to-read graphs and organized data sections. Perfect for management reports, executive summaries, and project tracking. Fully editable in PowerPoint, Keynote, and Google Slides.


21 slides
Luminor Project Timeline Presentation
Stay on track and achieve your goals with this dynamic project timeline presentation template. It provides a clear structure to outline key milestones, objectives, budget breakdown, risk management, and resource allocation, ensuring seamless project execution. The modern and professional design enhances communication with stakeholders and team members alike. Fully customizable and compatible with PowerPoint, Keynote, and Google Slides.


4 slides
Sustainability in Water Conservation Presentation
Highlight your eco-initiatives with this visually engaging Sustainability in Water Conservation presentation. Featuring a puzzle-style water drop diagram, this slide helps communicate four core strategies or ideas clearly and effectively. The clean layout and modern icons ensure your message is both professional and impactful, making it ideal for presentations on sustainability goals, environmental education, or water-saving initiatives. Fully editable and compatible with PowerPoint, Keynote, and Google Slides.


7 slides
United States Market Map Infographic
Navigate the vastness of the United States with our meticulously designed map infographic. Rendered in a pristine white background, this template is adorned with the patriotic fervor of red, the tranquility of blue, and the charm of purple. Whether it's for market segmentation, regional data visualization, or a travel itinerary, the infographic seamlessly blends informative value with visual appeal. This US map, compatible with Powerpoint, Keynote, and Google Slides, offers custom-made icons and flexible image placeholders to suit varied purposes. Unfold stories from coast to coast, showcasing the diverse tapestry that is the United States.


5 slides
World History Infographic Presentation
Bring the past to life with this engaging World History Infographic presentation. Featuring a circular layout with 4 editable sections, this infographic allows you to highlight key events, historical milestones, or cultural movements. Ideal for educators, students, and history enthusiasts, it’s designed for clarity, storytelling, and visual appeal. Fully compatible with PowerPoint, Keynote, and Google Slides – and easy to customize for any topic or timeline.