


Features
- 7 Unique slides
- Fully editable and easy to edit in Microsoft Powerpoint, Keynote and Google Slides
- 16:9 widescreen layout
- Clean and professional designs
- Export to JPG, PDF or send by email


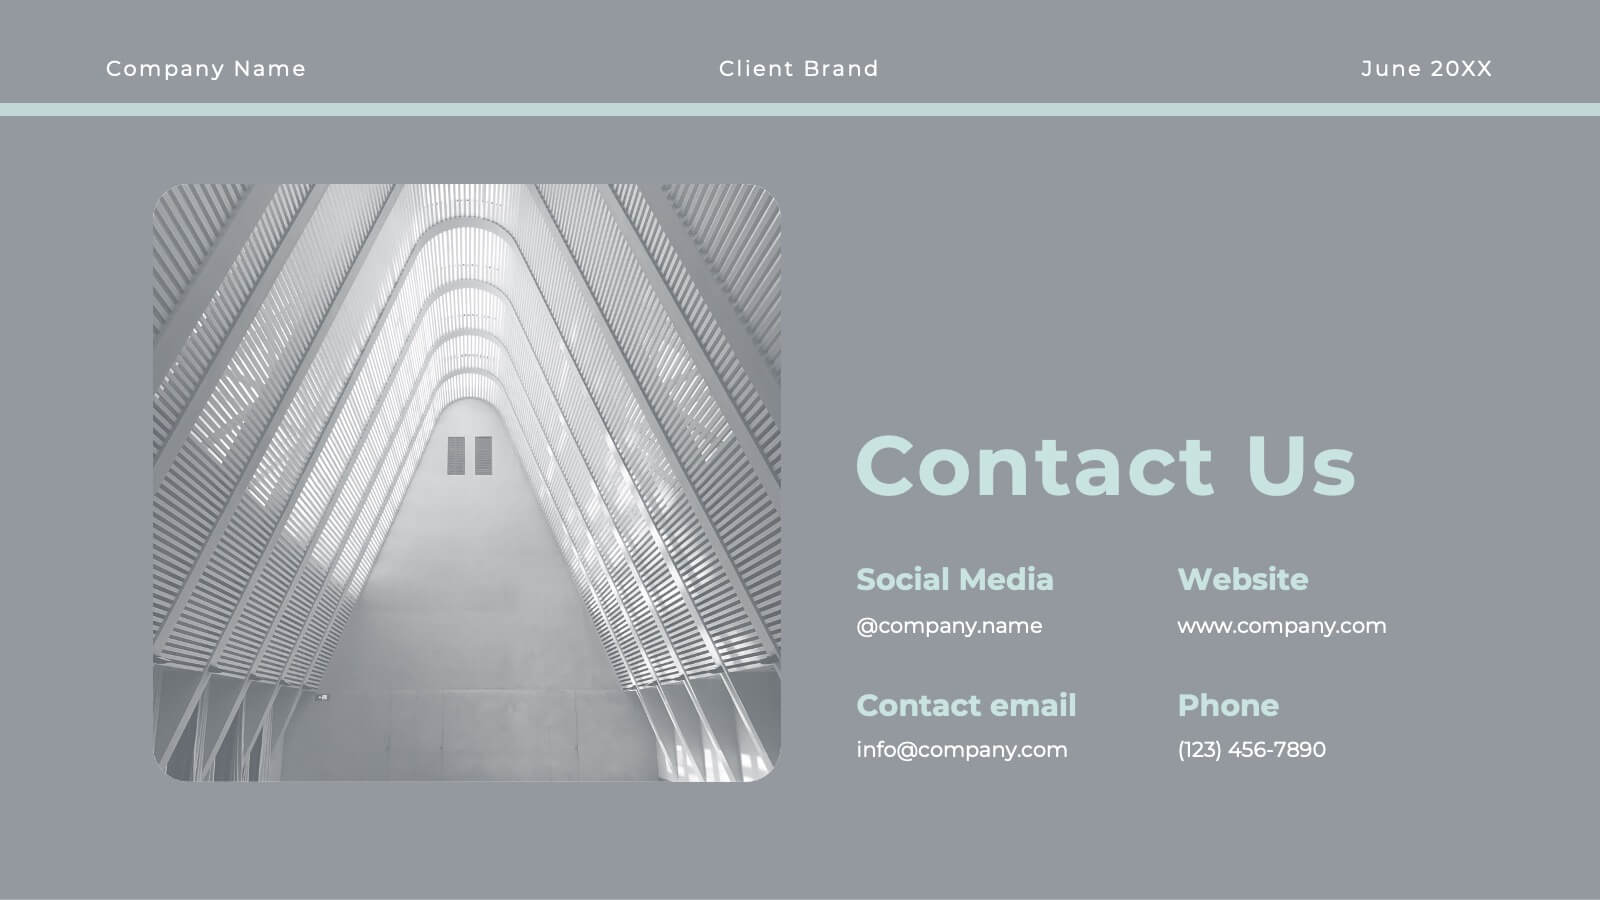
Do you have any questions?
Recommend


26 slides
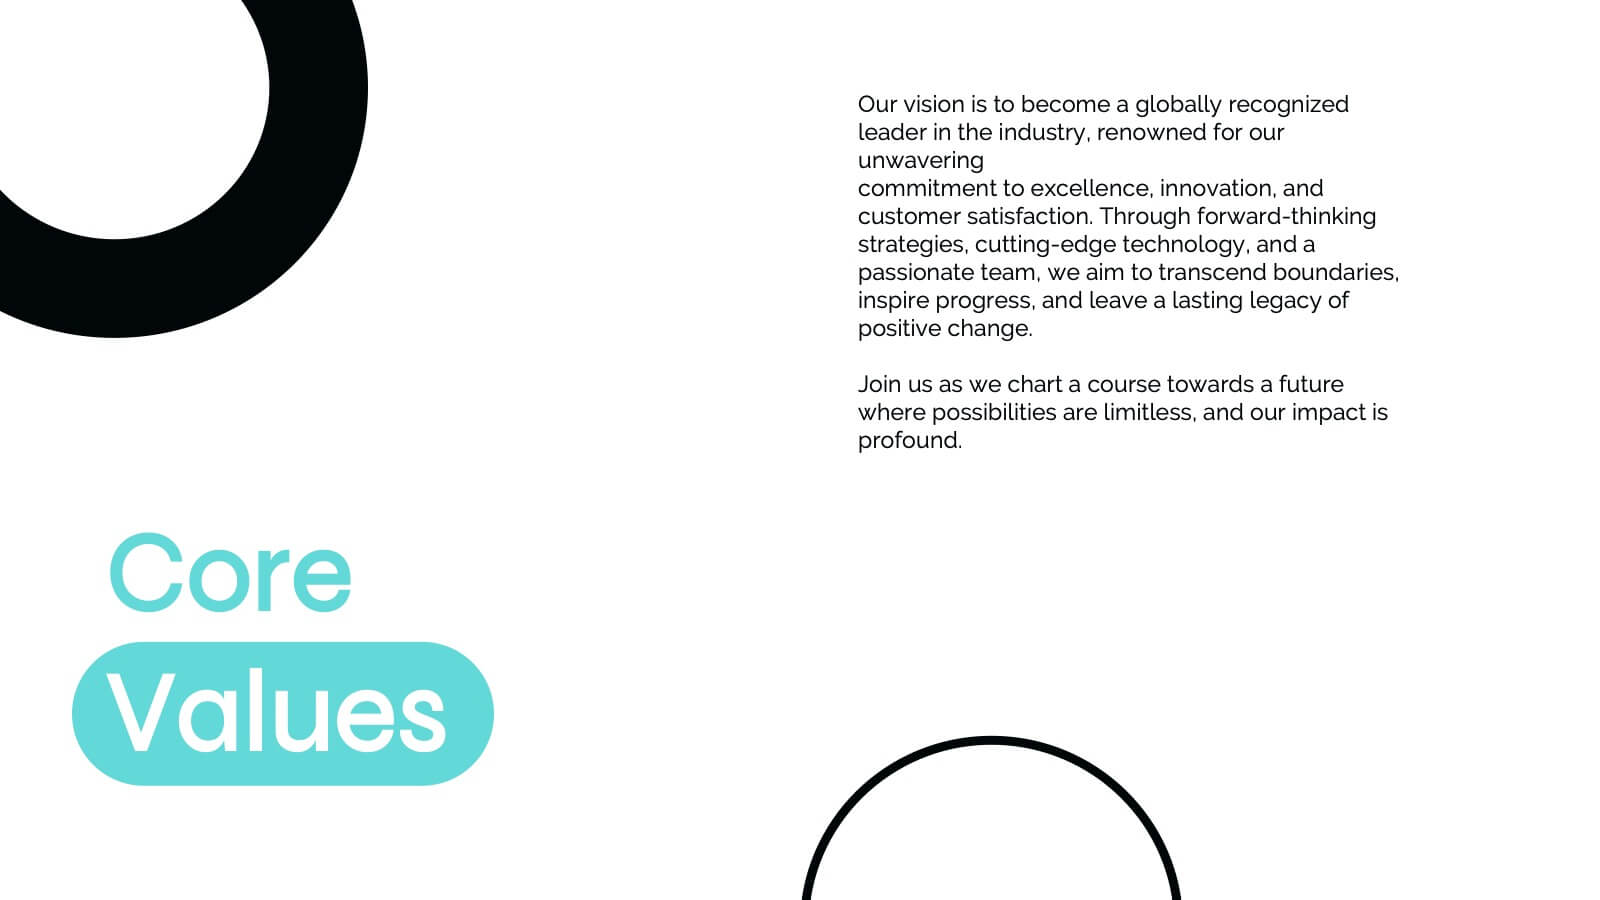
Leyna Presentation Template
Leyna is an elegant and minimalist wedding planner presentation template. This wonderful presentation template will help couples know what all you’ll offer as a wedding planner. We have made it easy for you this this multipurpose template because you will be able to edit easily to make sure it fits what you need. We have built a clean, responsive and modern design for them to have a great experience on what they are looking for in the best way possible. This template provides a professional and clean design for your business or personal use. It's time to impress the potential clients!


5 slides
Startup Growth Roadmap and Milestones Presentation
Present your startup journey clearly with the Startup Growth Roadmap and Milestones Presentation. This timeline-style layout breaks down your key phases, from initial concept to market traction. Ideal for investor decks, pitch presentations, or internal planning. Fully editable in PowerPoint, Canva, and Google Slides for seamless customization.


6 slides
Corporate Training Program Presentation
Build excitement from day one with a sleek and modern visual! This presentation template is ideal for outlining your professional development plans, onboarding paths, or internal training milestones in a structured, step-by-step format. Fully editable and designed to impress, it works seamlessly with PowerPoint, Keynote, and Google Slides.


8 slides
Team Roles & Skills Chart Presentation
Bring your team’s strengths to life with this clean, engaging slide designed to highlight individual roles, skill levels, and key capabilities. It helps teams clearly visualize expertise, compare competencies, and communicate responsibilities with ease. Fully editable and compatible with PowerPoint, Keynote, and Google Slides.


7 slides
Property Market Forecast and Trends Presentation
Present your real estate insights clearly with this Property Market Forecast and Trends Presentation. Featuring a central isometric house graphic surrounded by six editable segments, this layout is perfect for highlighting key indicators like market trends, pricing shifts, and investment zones. Use the icons and color-coded areas to enhance clarity. Ideal for housing reports and investor decks. Fully compatible with PowerPoint, Canva, Keynote, and Google Slides.


5 slides
Team Roles and Responsibilities Matrix Presentation
Define accountability with this Team Roles and Responsibilities Matrix. Clearly map tasks to team members using RACI codes (Responsible, Accountable, Consulted, Informed). Ideal for project planning, cross-functional alignment, and team coordination. Fully editable and compatible with PowerPoint, Keynote, and Google Slides to suit any workflow or team structure.
9 slides
Arrow Security Infographic
Introducing our new "Arrow Security Infographic", this is a visually engaging and informative presentation template that focuses on various aspects of arrow infographics. This template can be used to provide an overview of different security measures, techniques, and technologies that can be implemented to enhance safety and protect against potential threats. This is designed with a variety of arrow infographics that can help help individuals and organizations understand the importance of security and make informed decisions to safeguard their assets and interests. Compatible with Powerpoint, Keynote, and Google Slides.


5 slides
Business Process Cycle Presentation
Energize your message with a clean, visual journey that turns complex workflows into an easy-to-follow cycle. This presentation helps you explain stages, roles, and transitions with clarity while keeping your audience focused on what matters. Designed for business process overviews and strategy talks, it works seamlessly in PowerPoint, Keynote, and Google Slides.


4 slides
End Slide with Strategic Reflection Presentation
Wrap up your presentation with purpose using the End Slide with Strategic Reflection Presentation. Designed to highlight final insights, priorities, or key outcomes, this template features a visual pyramid layout ideal for summarizing growth, goals, or performance tiers. Fully editable in Canva, PowerPoint, and Google Slides for easy customization.


5 slides
Hydrology and Water Cycle Presentation
Showcase the complete water cycle with this vibrant Hydrology and Water Cycle infographic. Highlight key stages like precipitation, collection, evaporation, and condensation using clear visuals and numbered sections. Fully customizable for science, sustainability, or educational presentations. Compatible with PowerPoint, Keynote, and Google Slides for easy editing.


20 slides
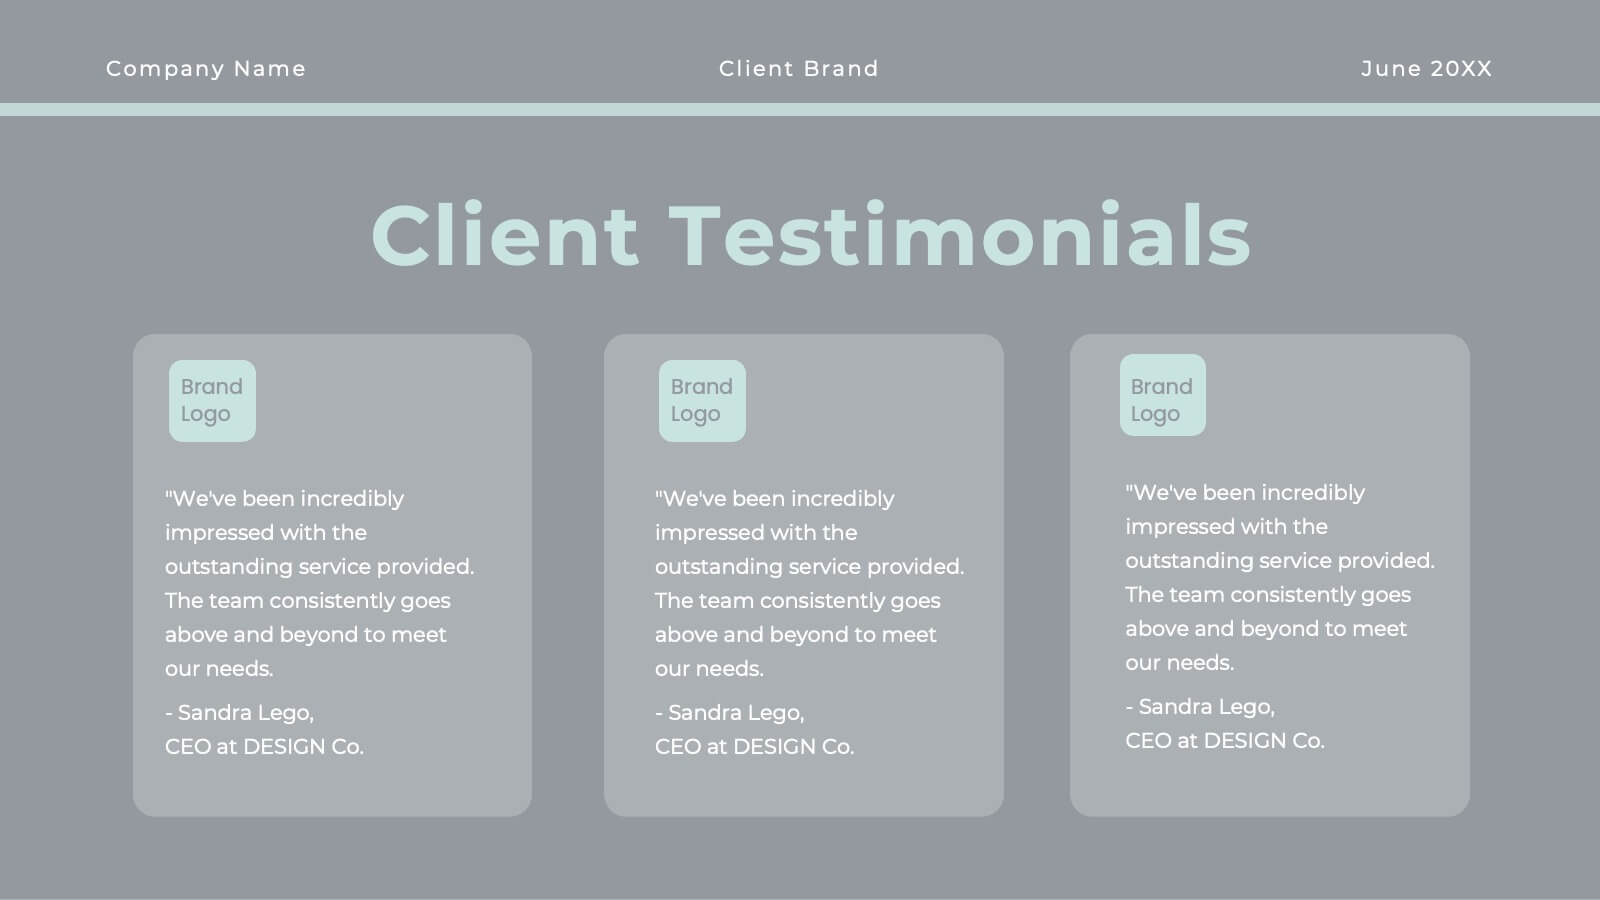
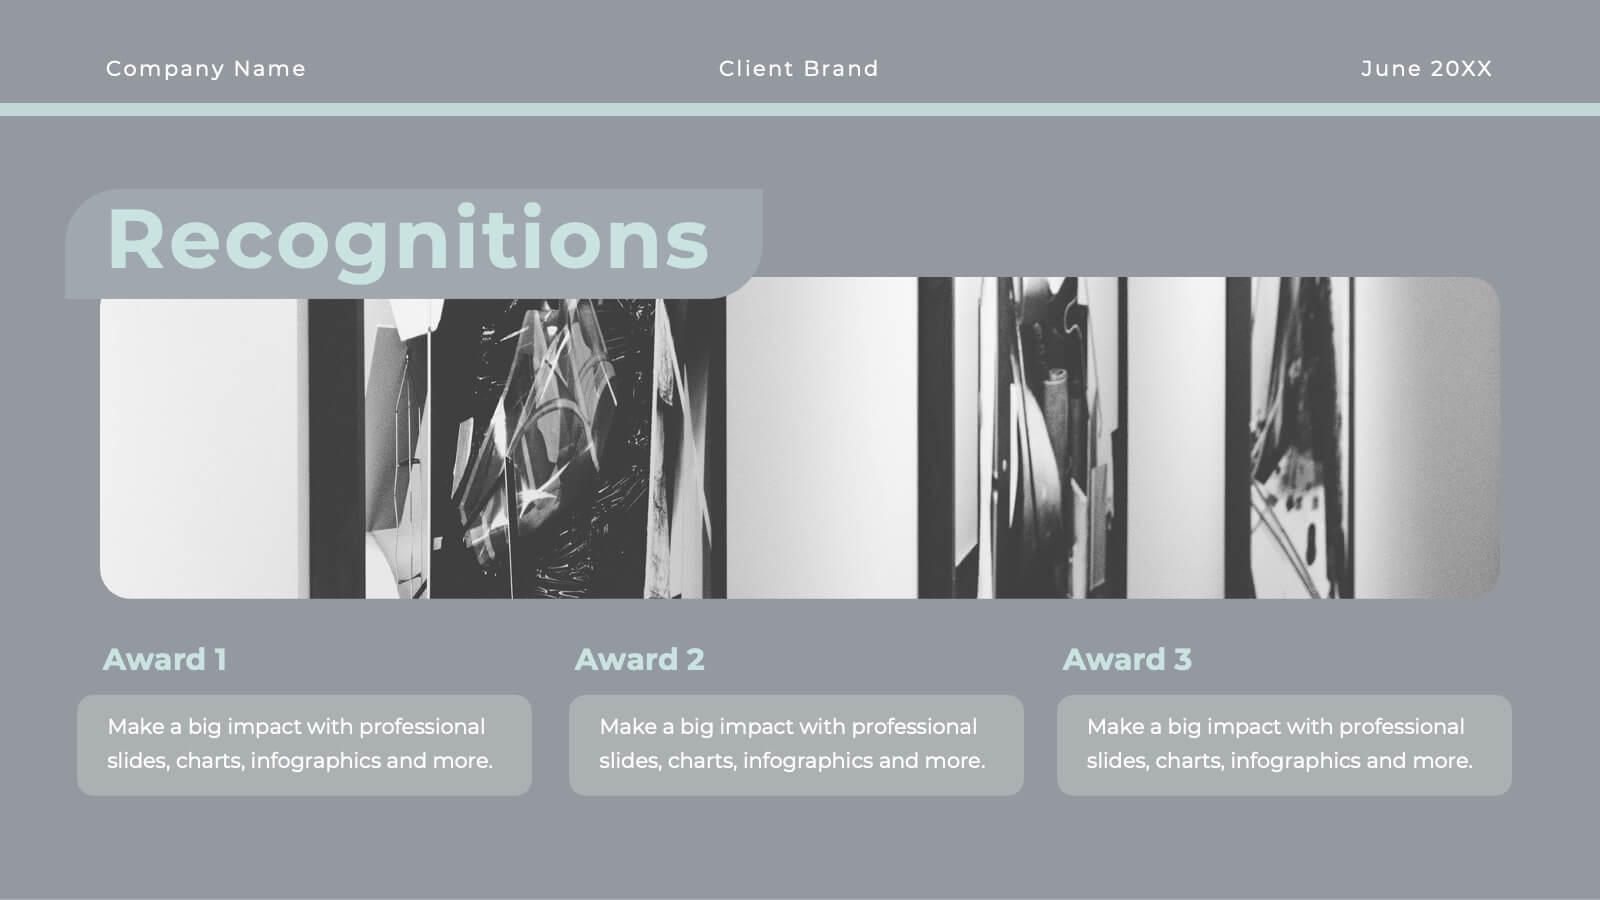
Scriptorium Design Portfolio Presentation
Showcase your creative work with a sophisticated design portfolio presentation template tailored for designers and creators. This template includes clean, minimalist slides to highlight your introduction, portfolio overview, design philosophy, and style. Showcase featured projects with dedicated project highlight slides, complete with client testimonials and awards for added credibility. With sections for your design process, services, pricing, and blog integration, this template provides a professional framework for sharing your creative journey. The editable layout ensures seamless customization to reflect your unique brand, making it suitable for freelancers, agencies, or design teams. Compatible with PowerPoint, Google Slides, and Keynote, this versatile template offers an elegant way to communicate your expertise and leave a lasting impression on clients or stakeholders. Tailor it to your needs and take your portfolio presentations to the next level!

22 slides
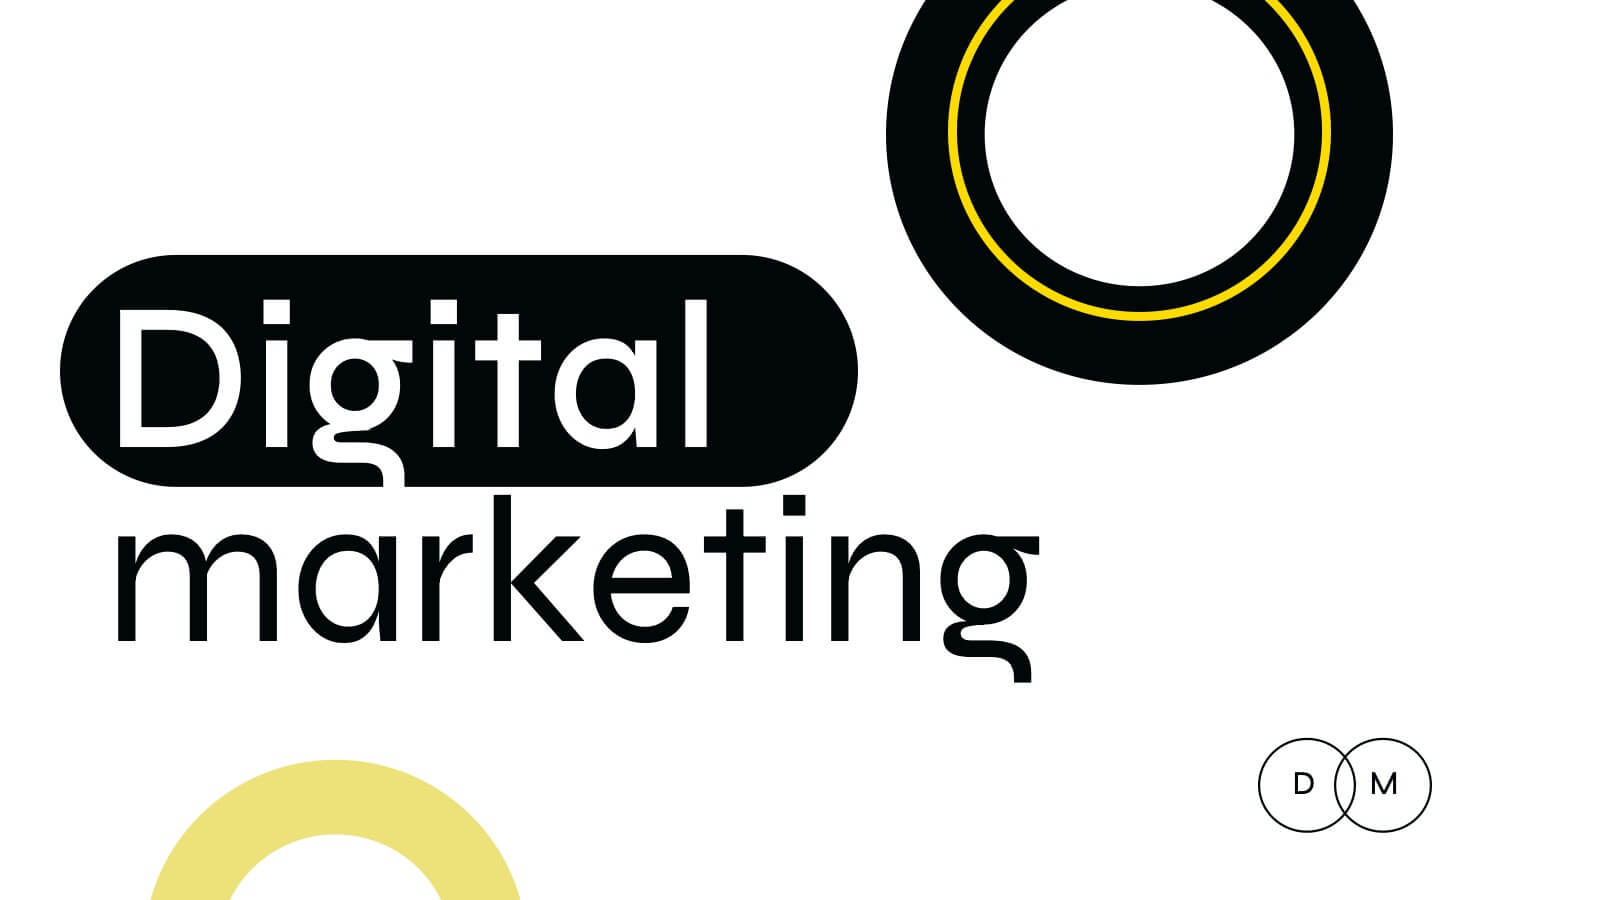
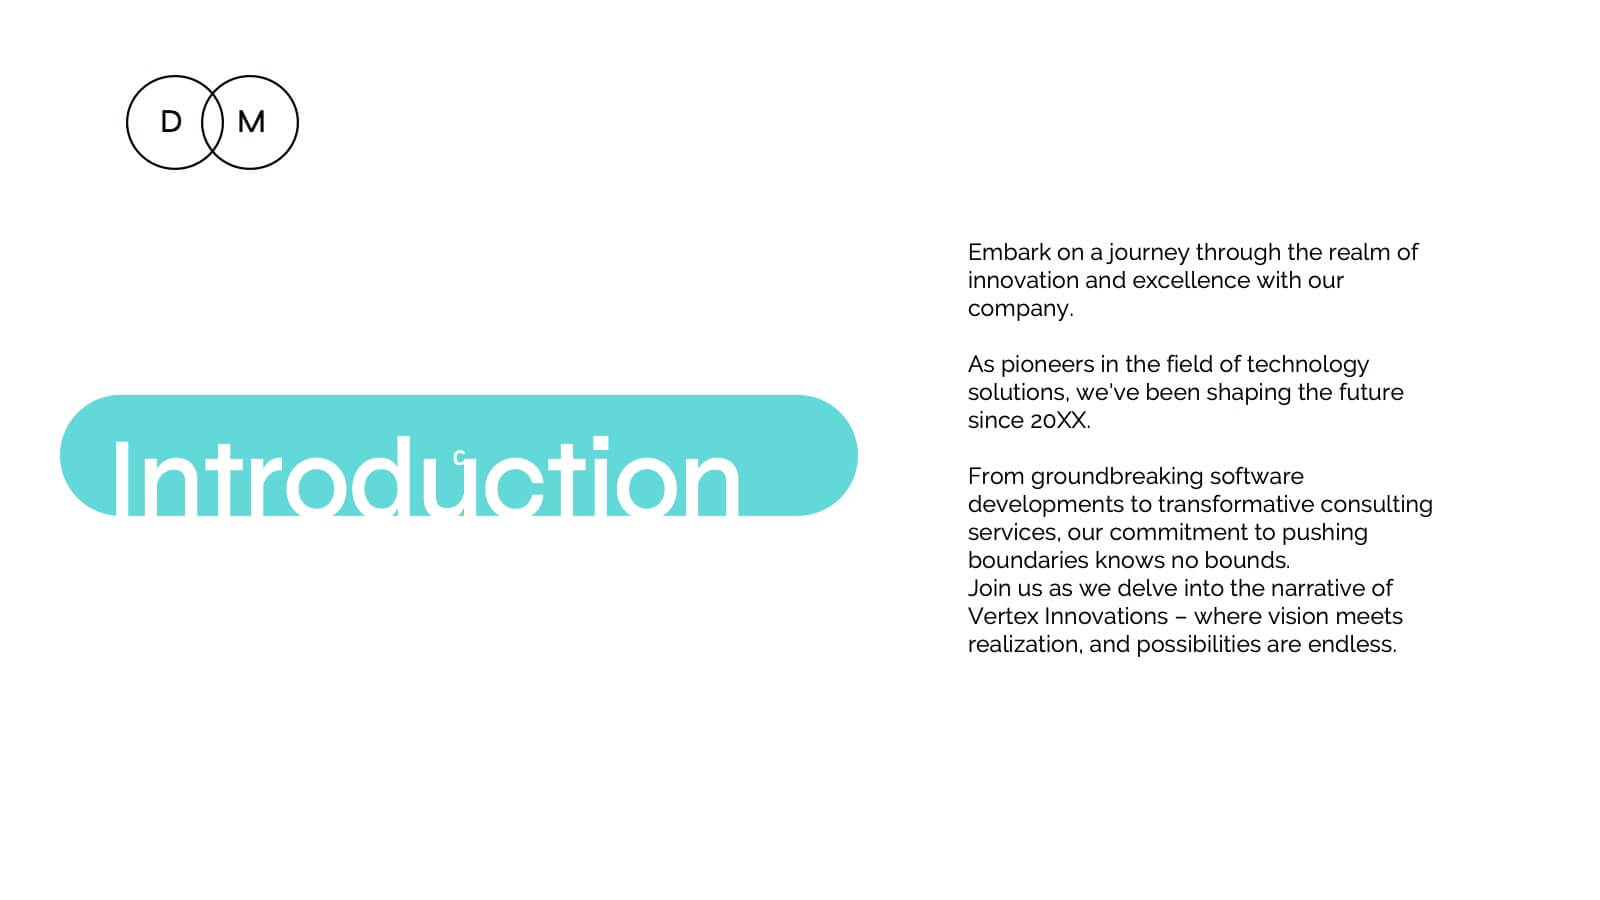
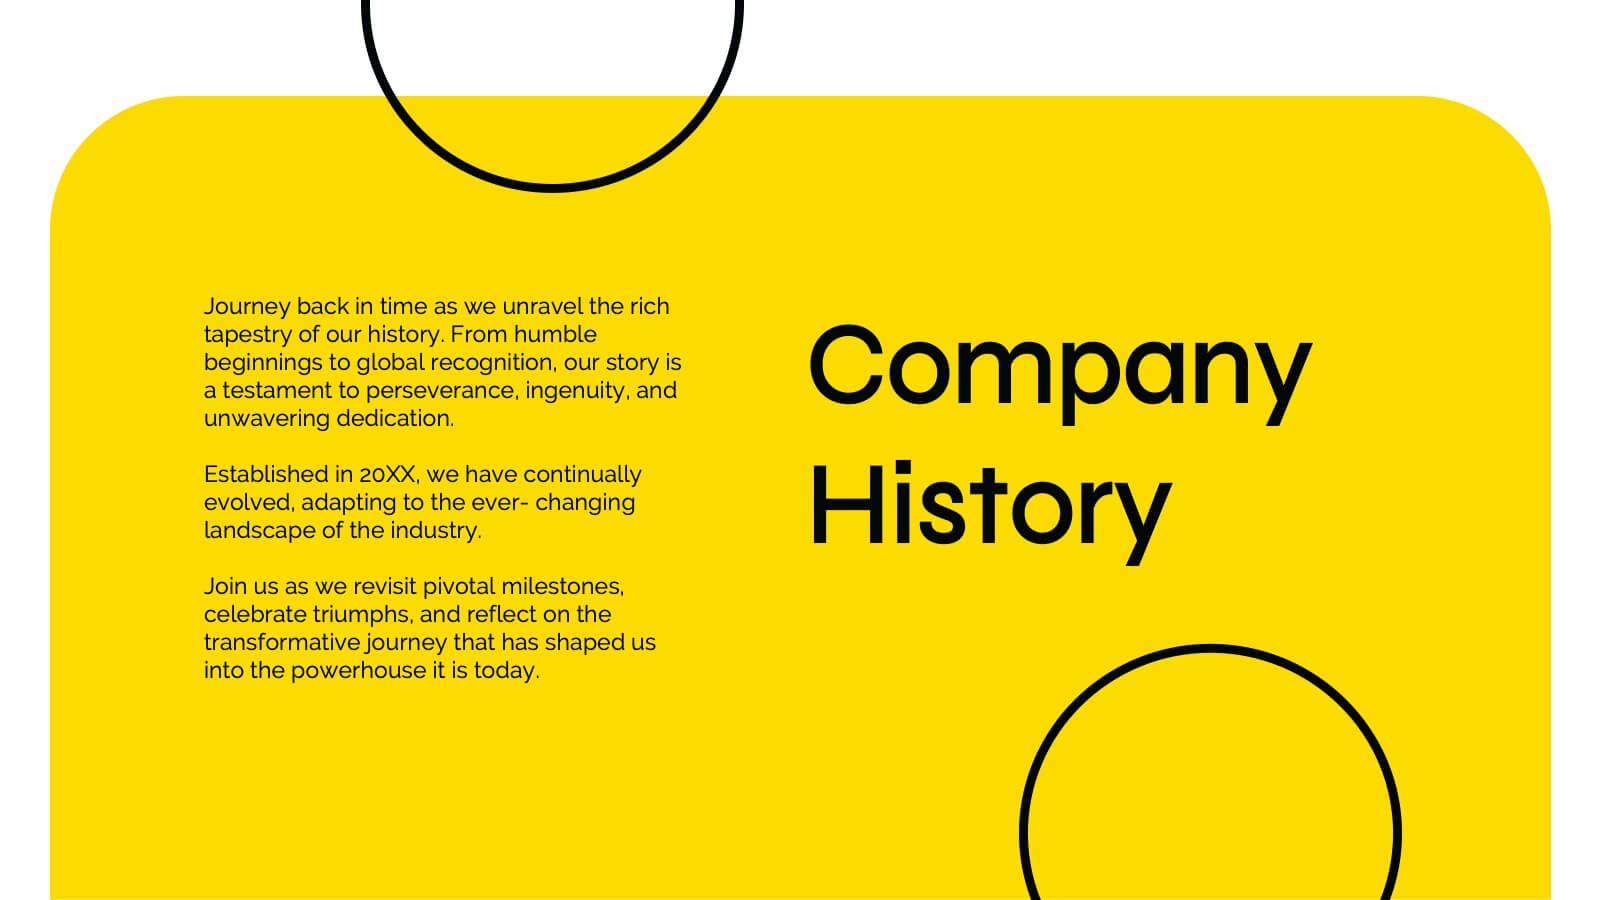
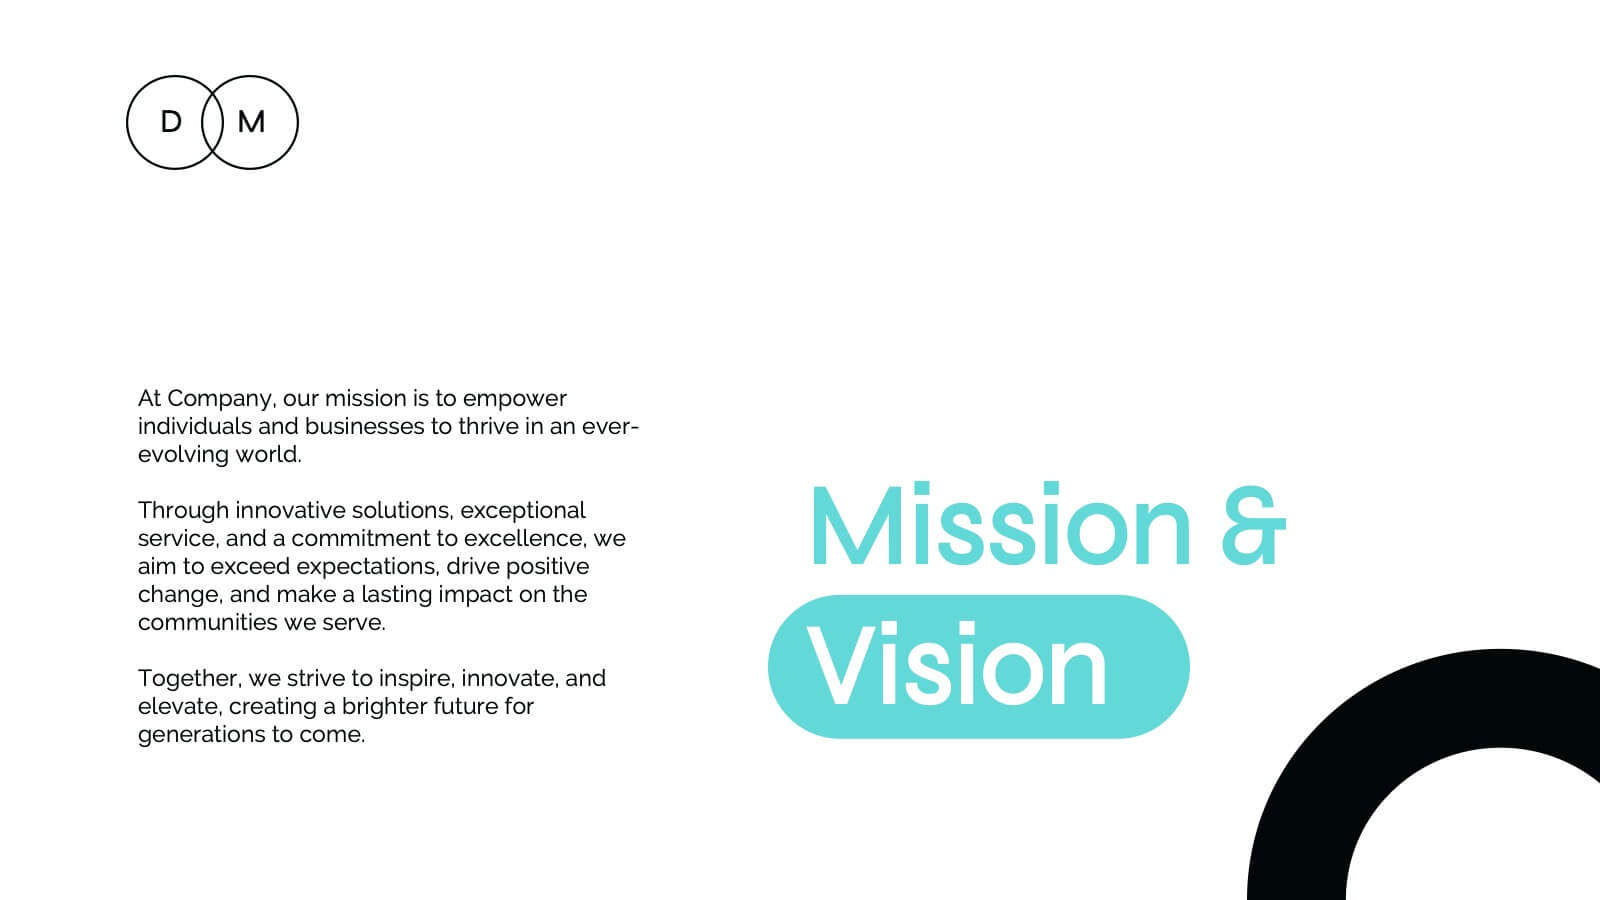
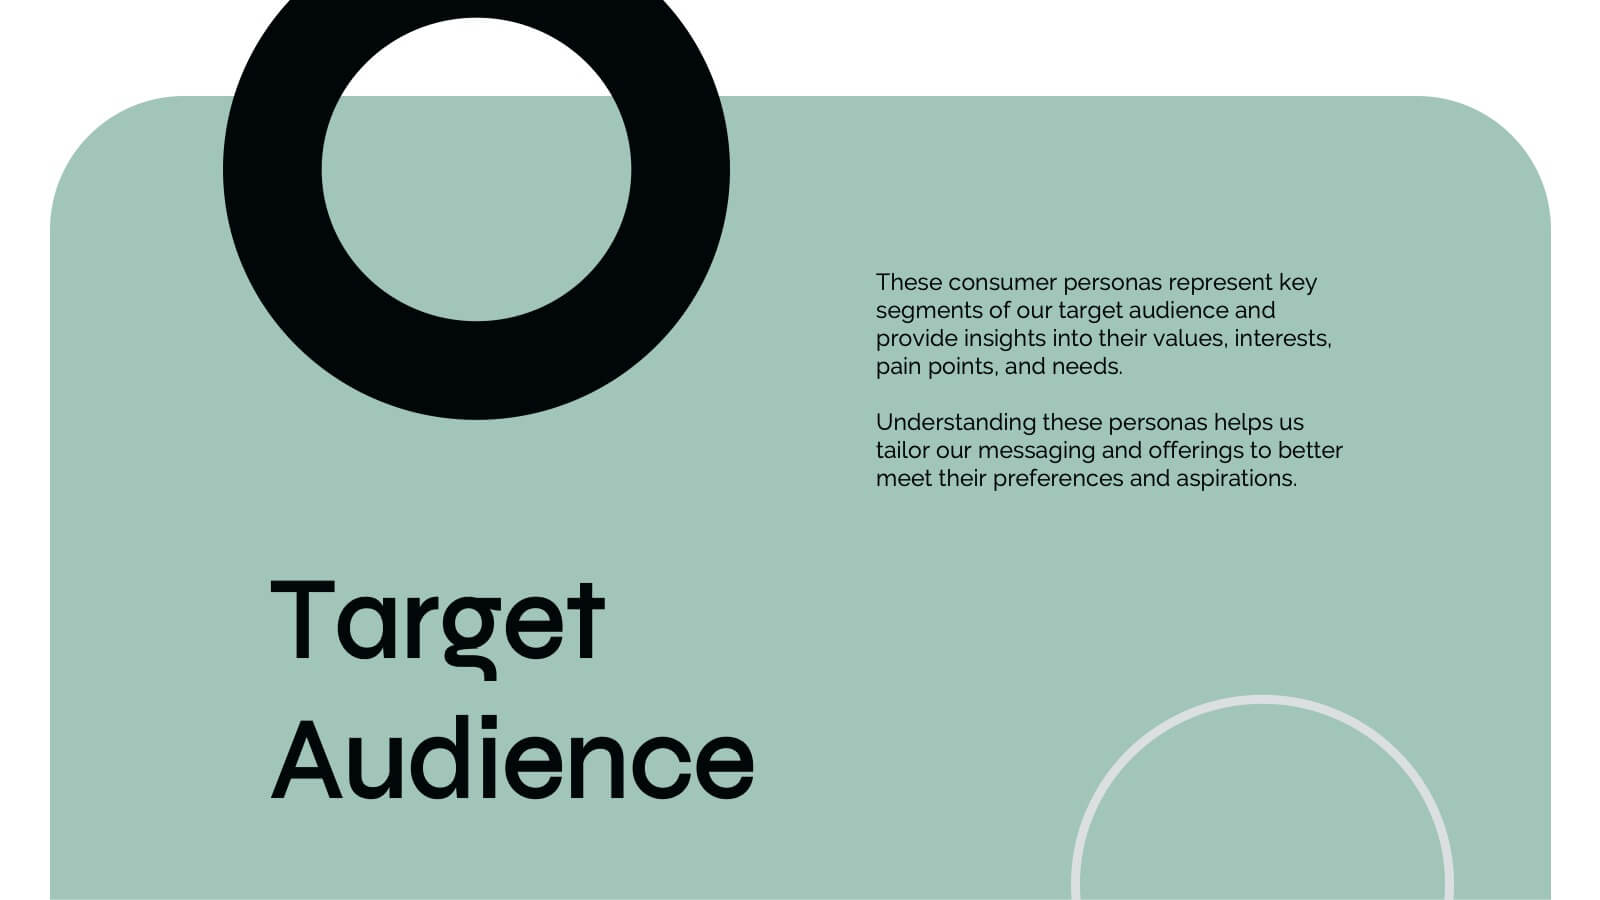
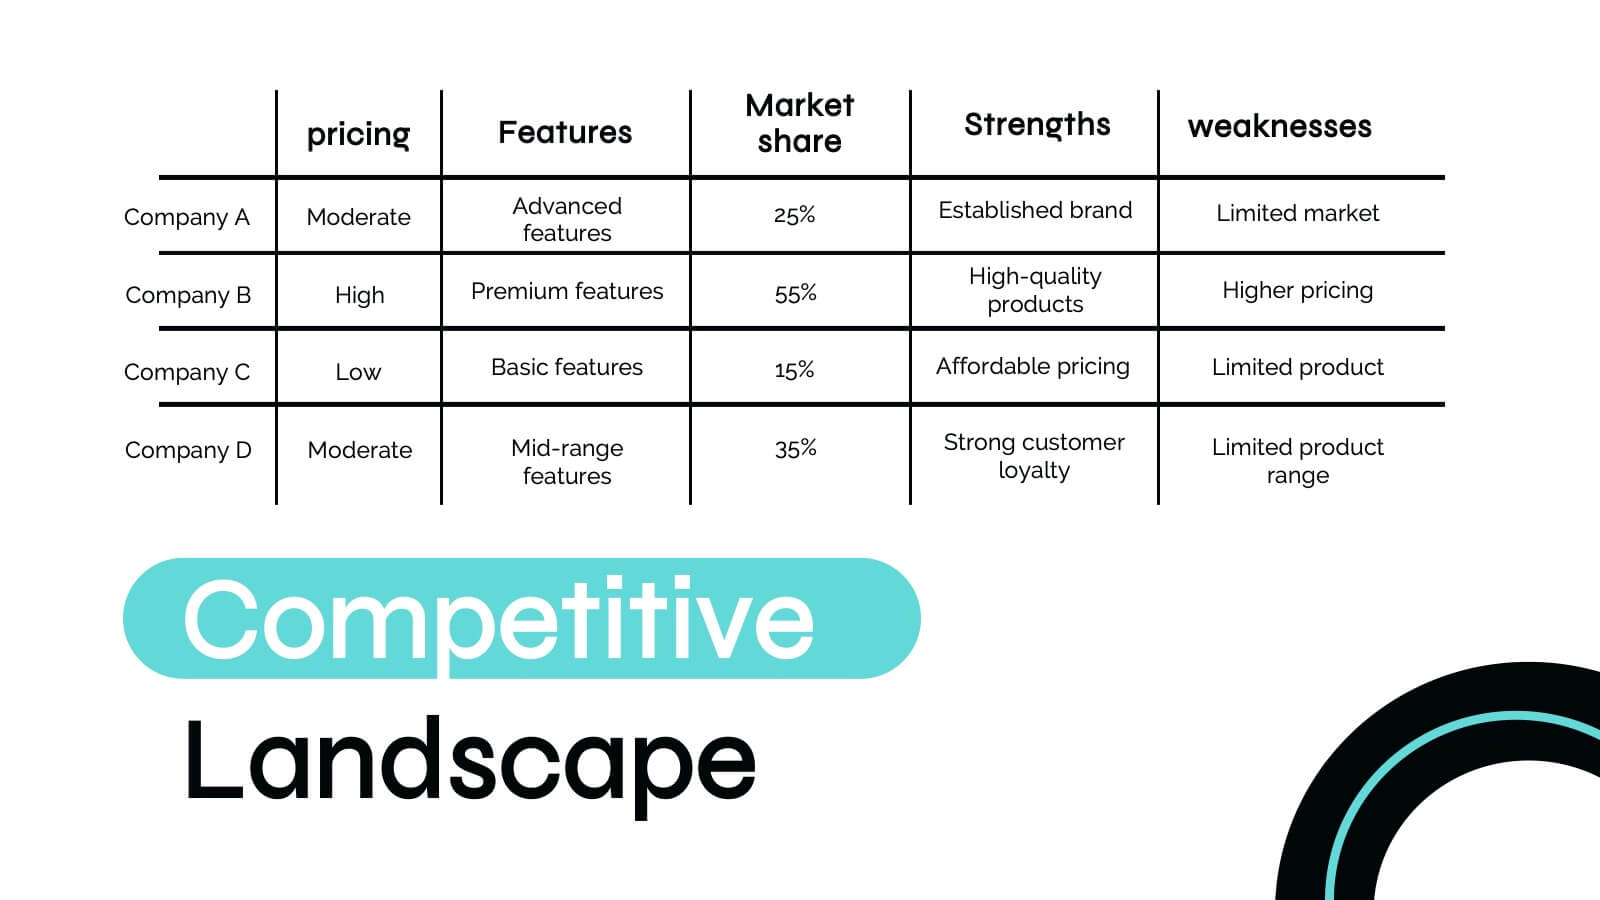
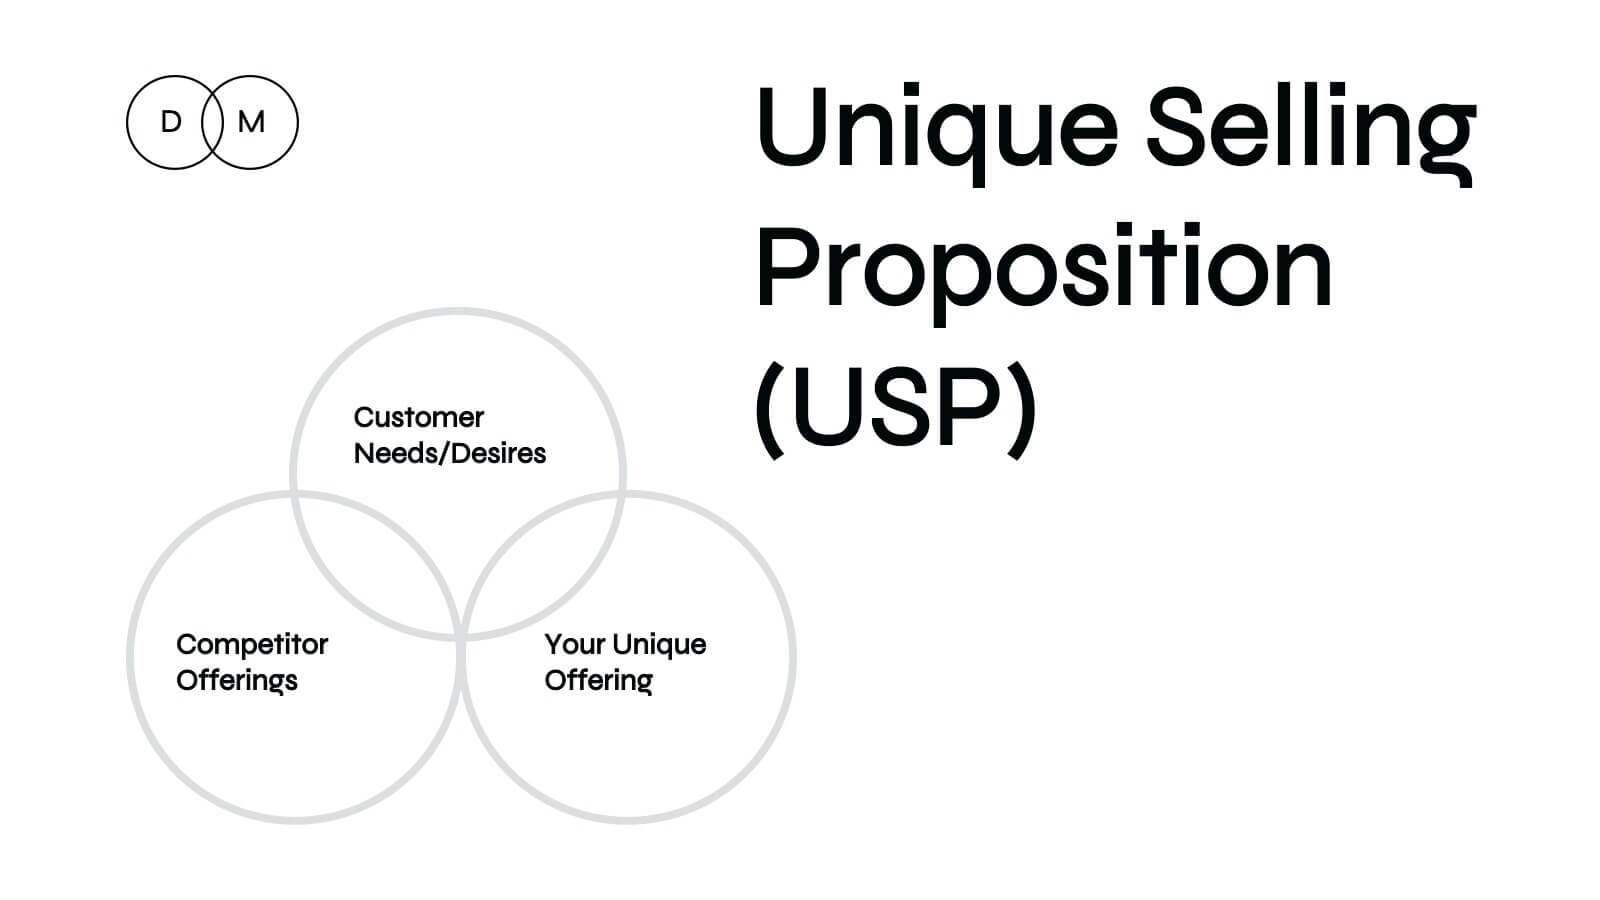
Hercules Digital Marketing Strategy Plan Presentation
Ignite your next marketing presentation with this bold, dynamic template that showcases every key element of your marketing strategy! From company history and target audience insights to competitive landscape analysis, this design makes presenting your marketing message a breeze. Perfect for professionals, it’s fully compatible with PowerPoint, Keynote, and Google Slides for seamless usage across platforms.


7 slides
Step Numbers Infographic
A numbers infographic is a visual representation of data, statistics, or numerical information presented in a clear, concise, and visually appealing manner. This infographic template aims to communicate complex numerical data or figures in a way that is easy to understand and interpret. Compatible with Powerpoint, Keynote, and Google Slides. Utilizes the charts, graphs, icons, and other graphical elements to represent numerical data. These infographic visuals make it easier for viewers to grasp the meaning behind the numbers. This template will allow you to focus on presenting key numerical insights.

22 slides
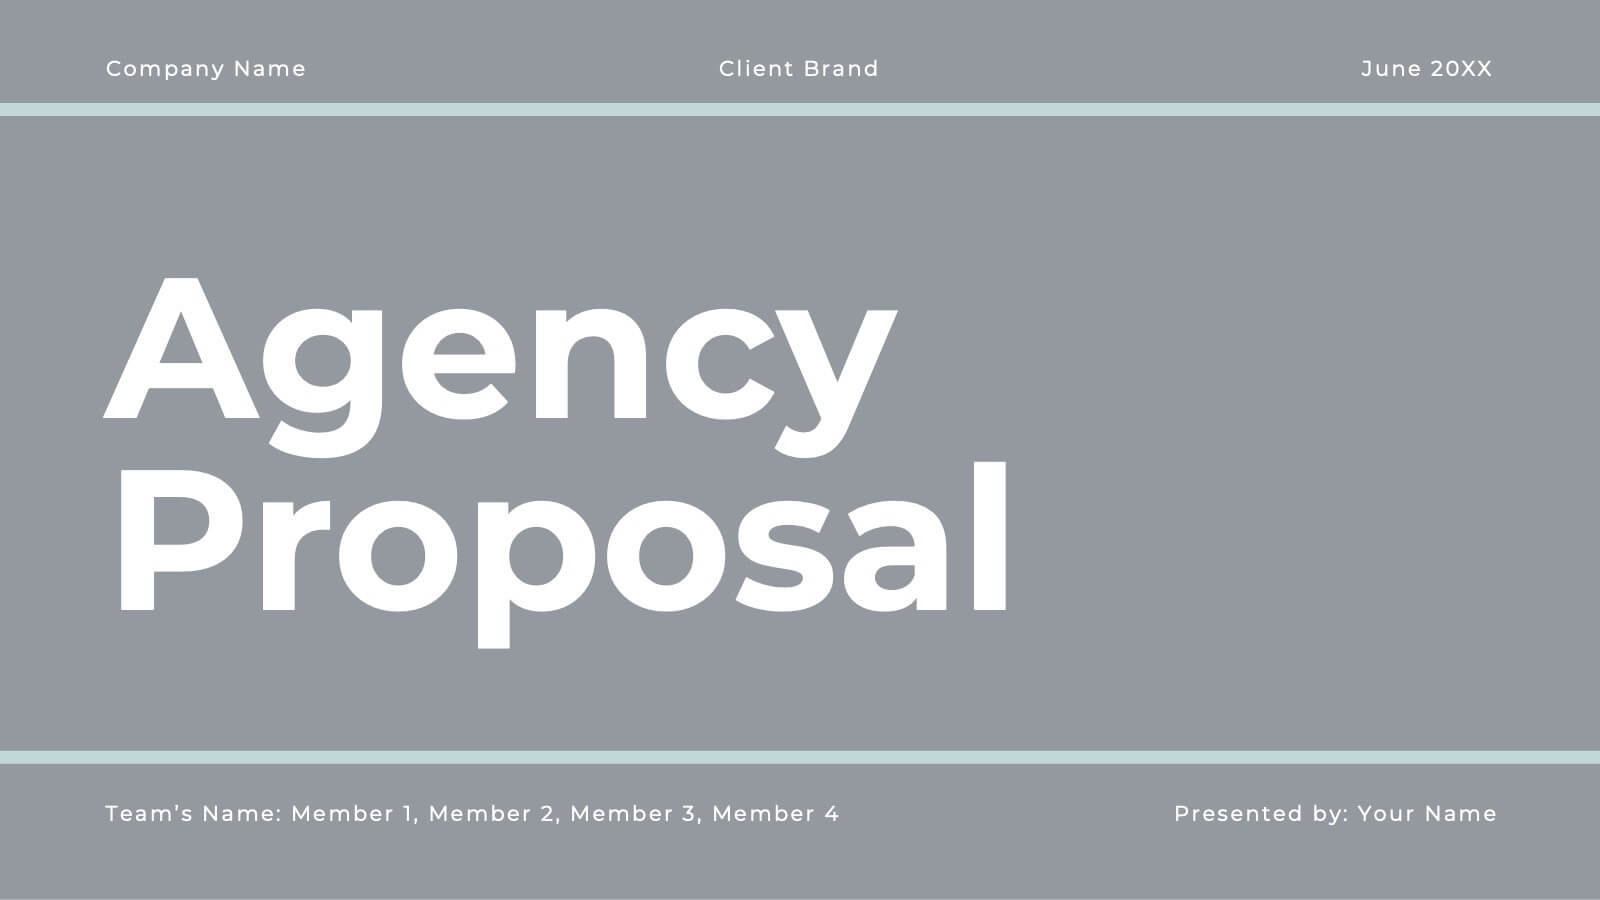
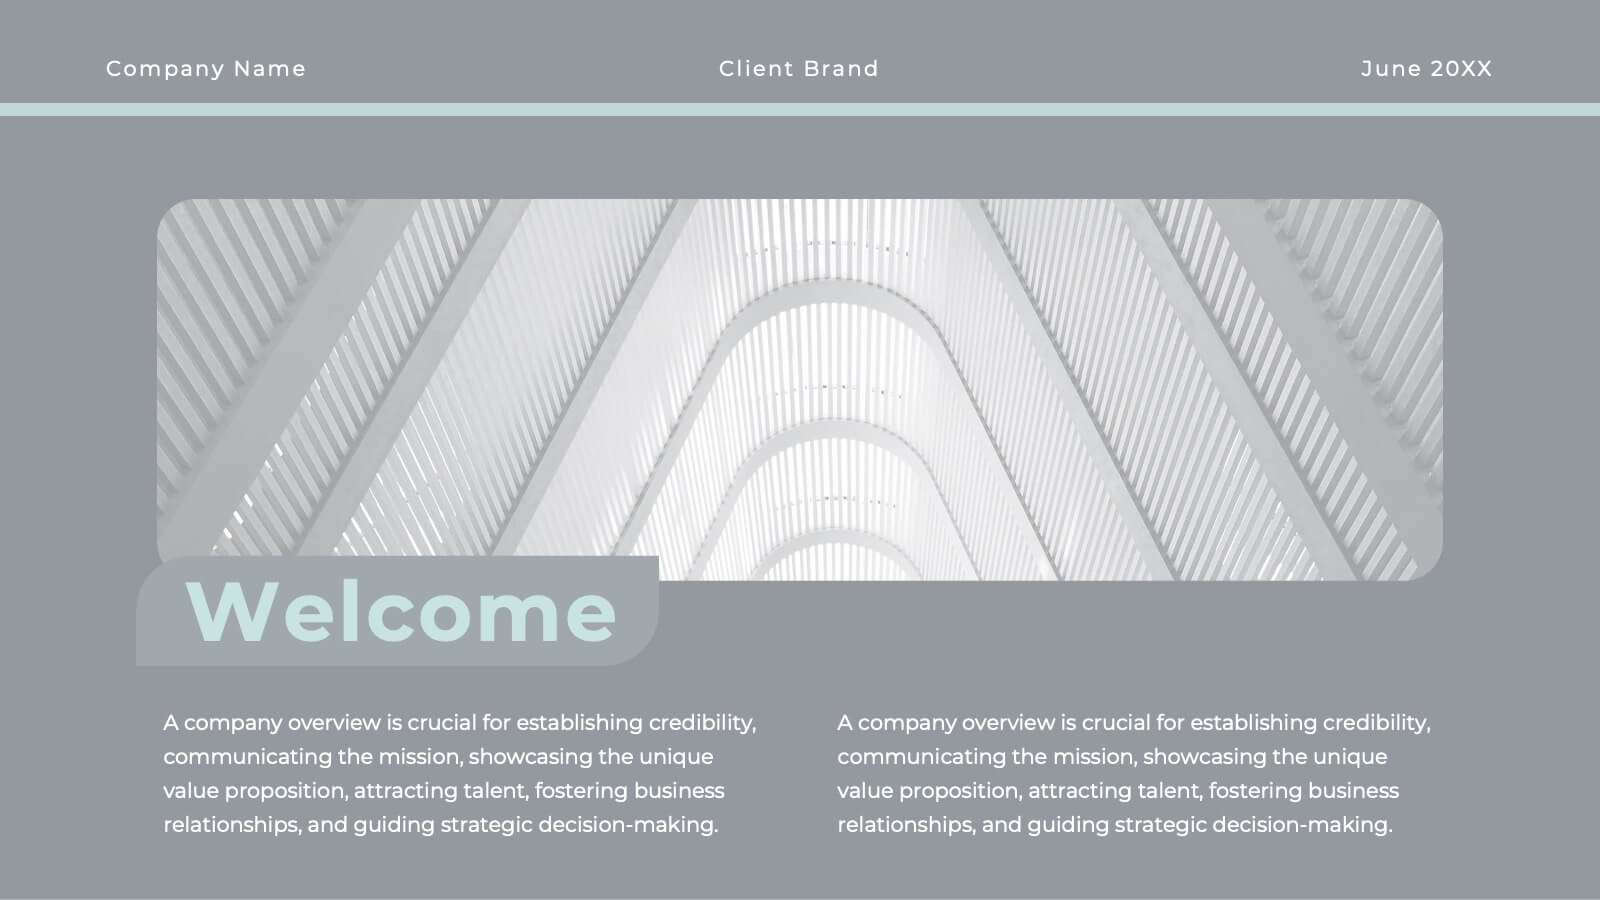
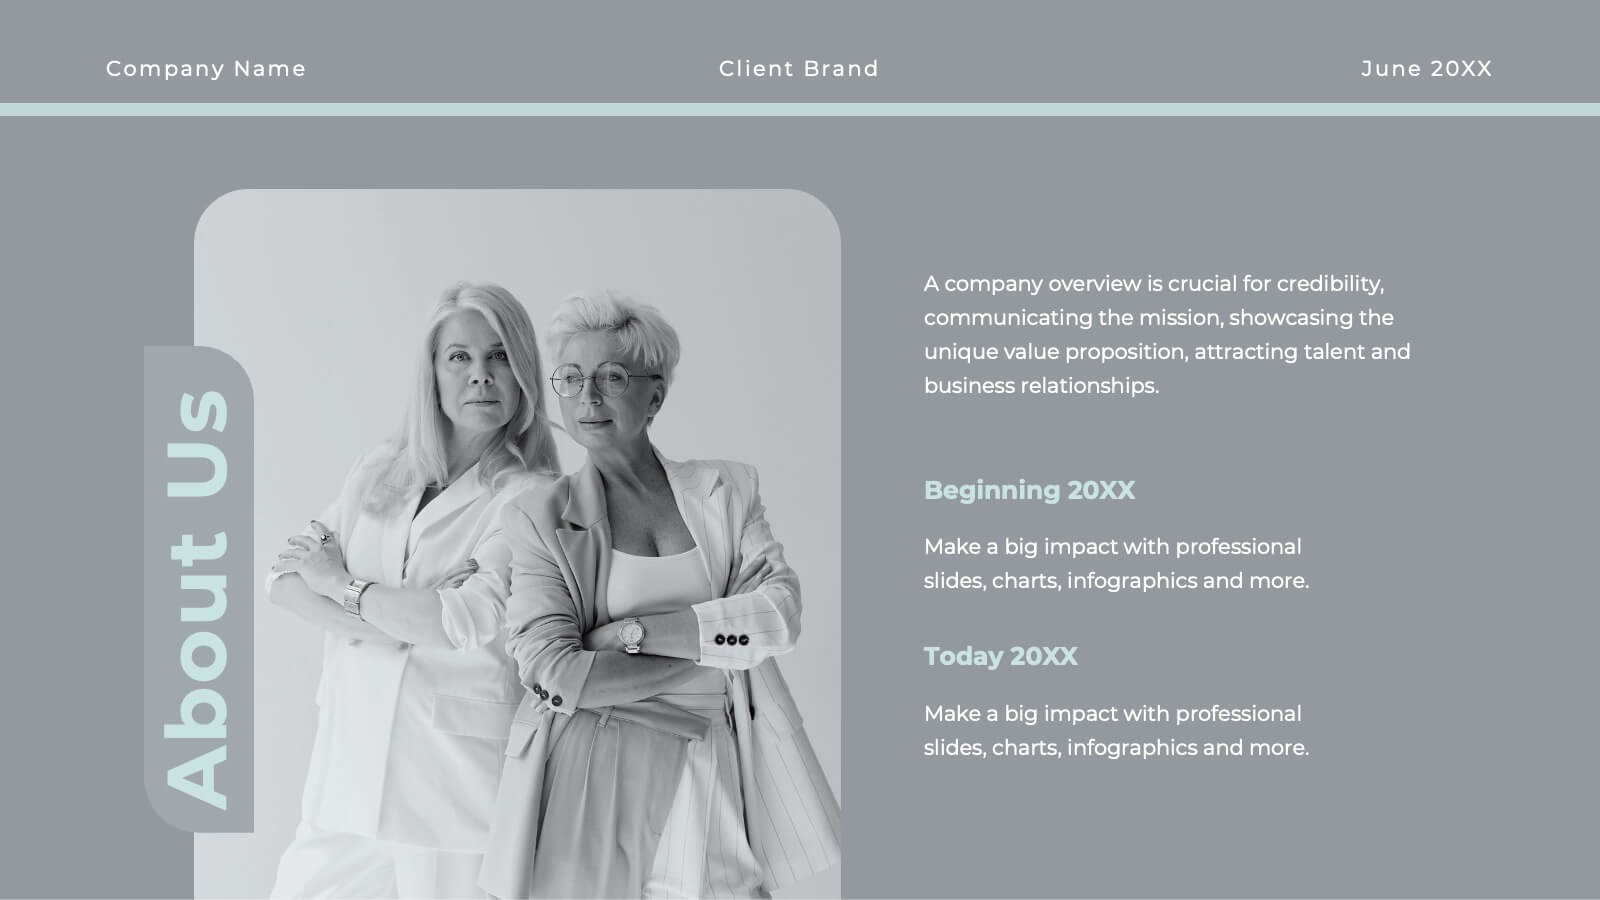
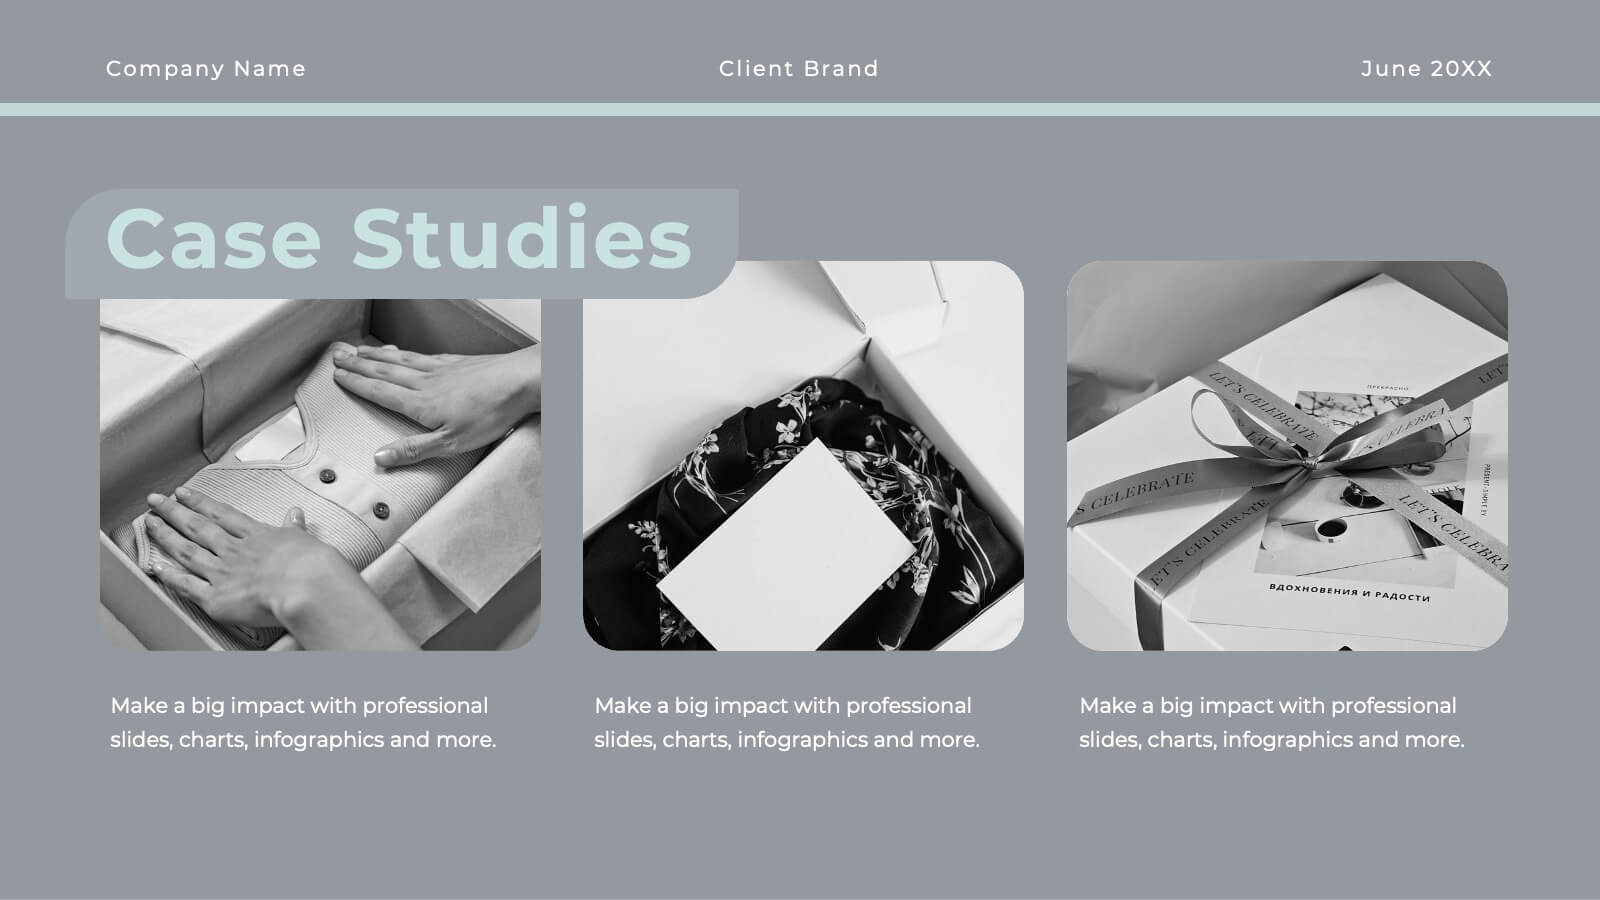
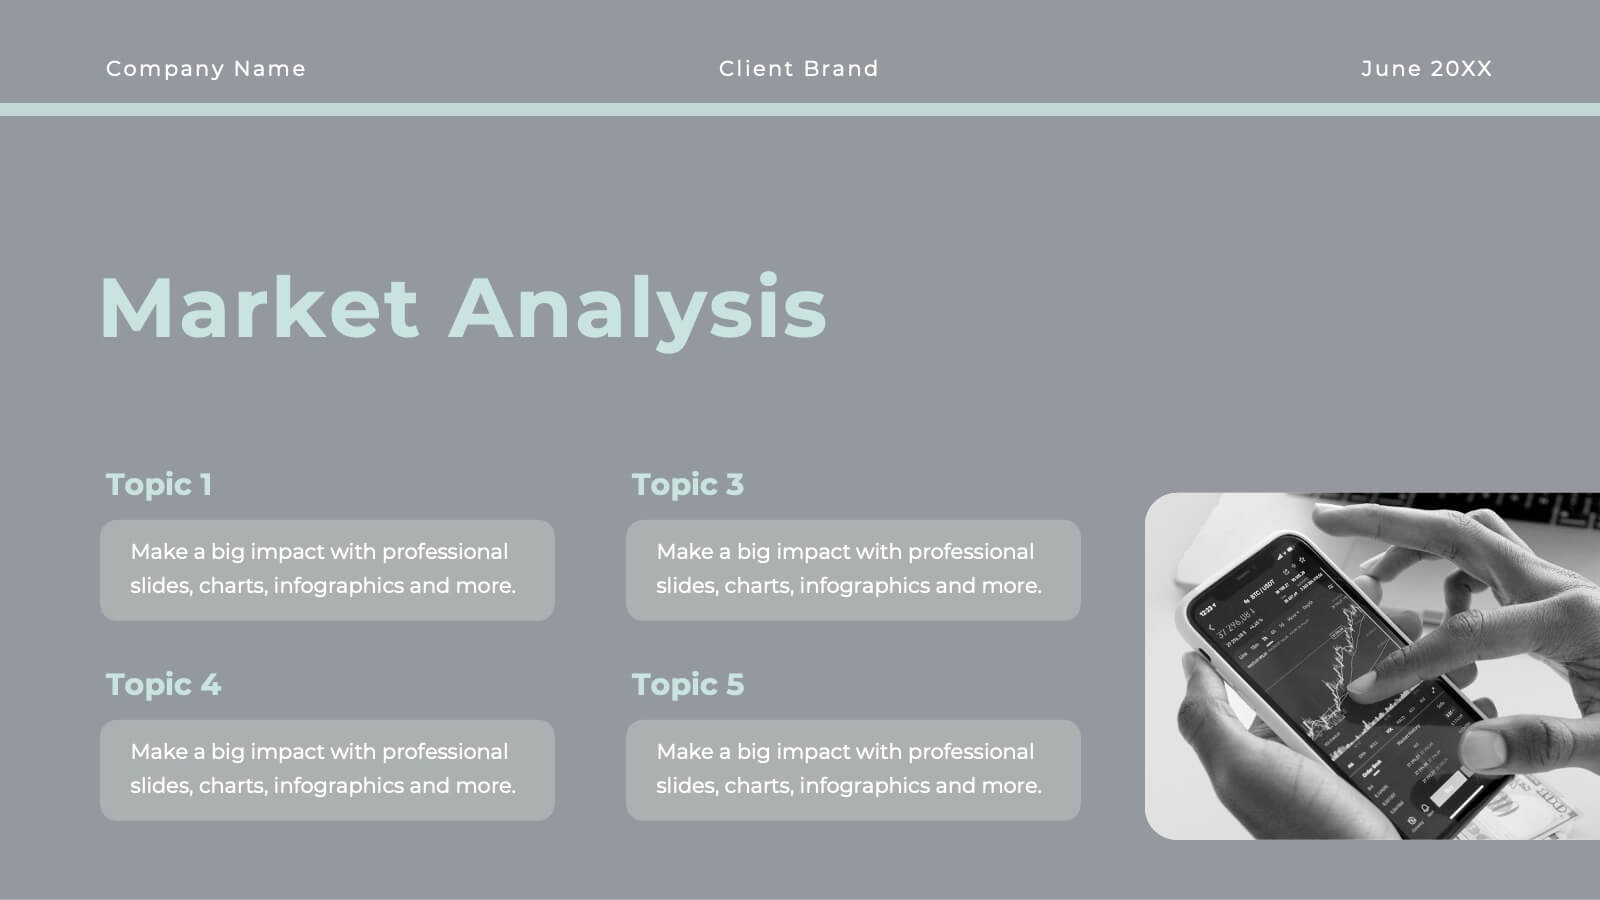
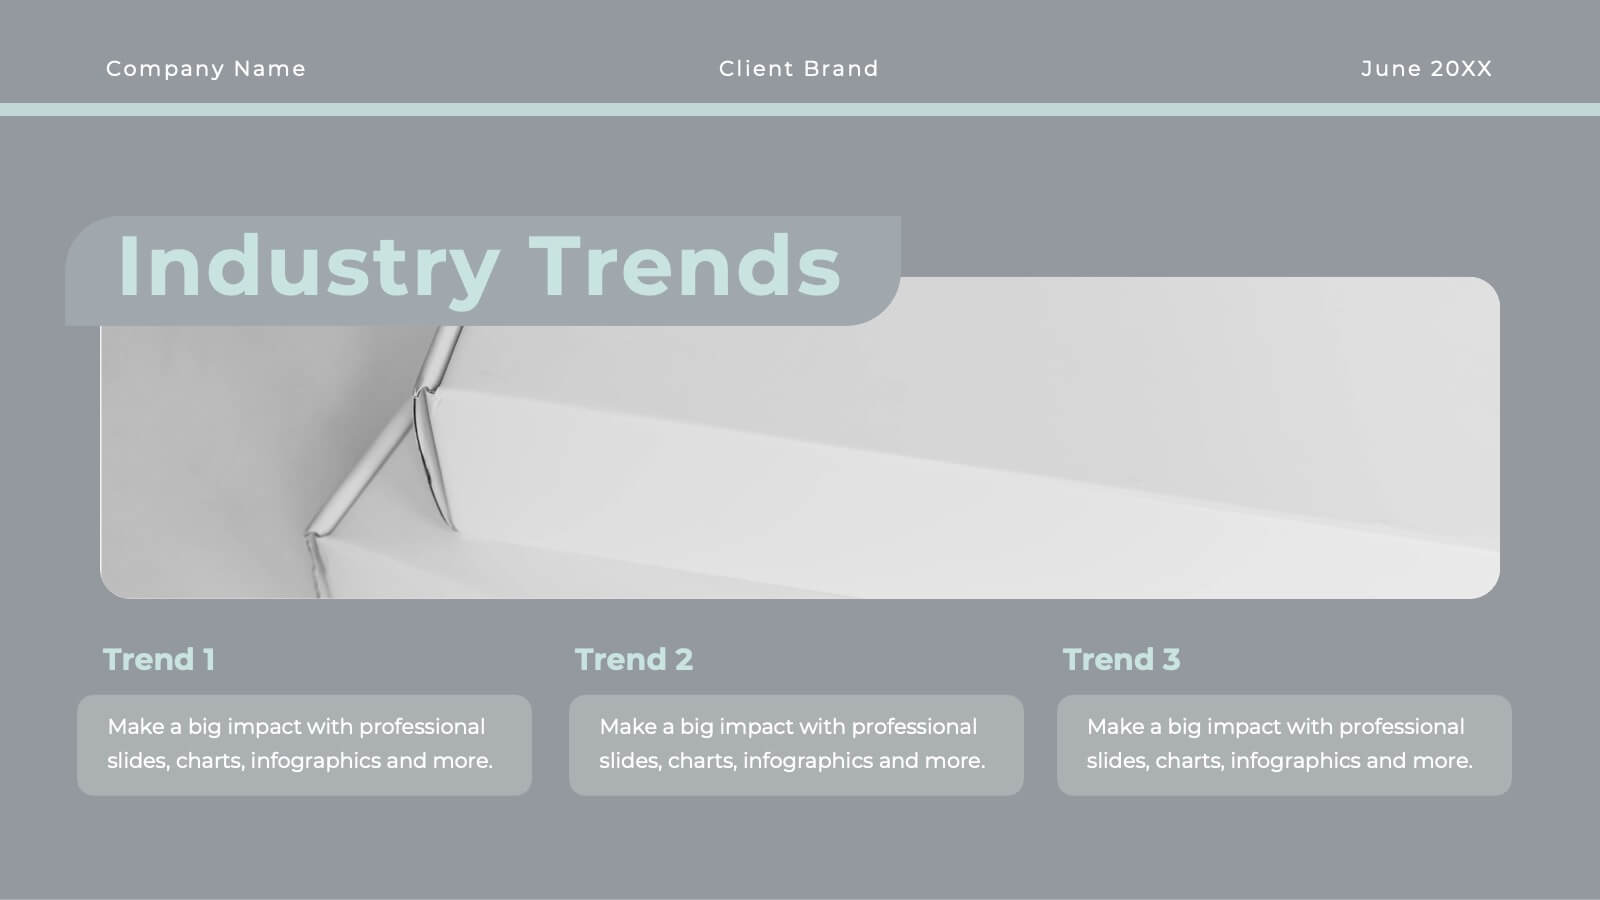
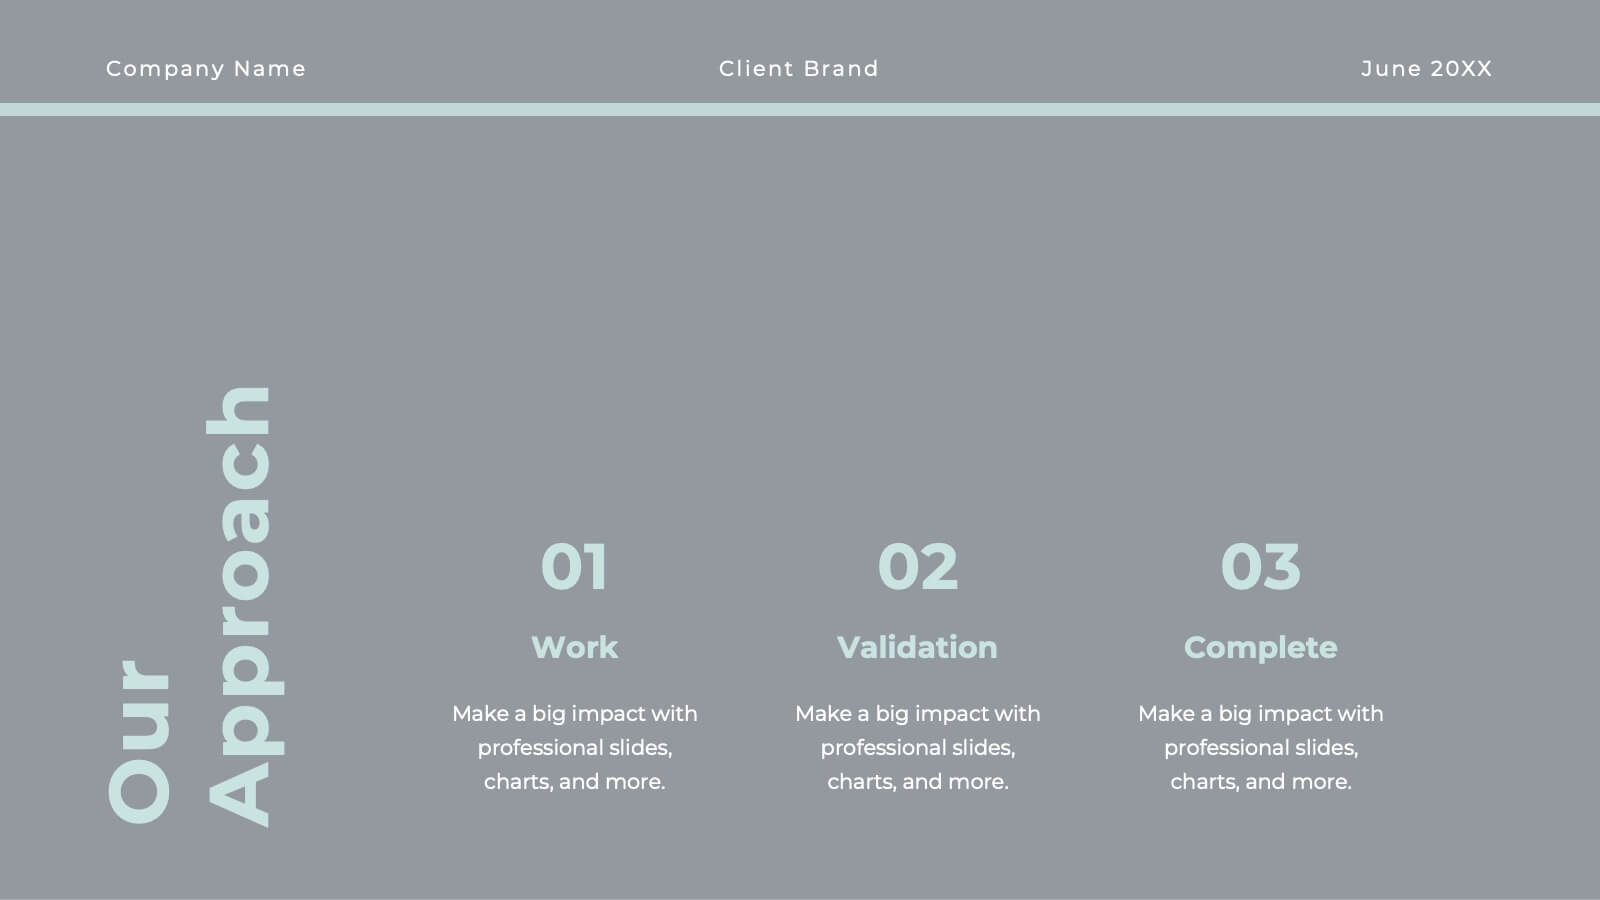
Whirlwind Advertising Agency Proposal Presentation
Get ready to elevate your agency’s game with a proposal template that’s as polished as your services! This sleek and sophisticated design is crafted to make a lasting impression on your clients and partners. From introducing your team’s expertise to showcasing successful case studies, every slide is meticulously designed to reflect professionalism and creativity. The clean, modern layout helps you present your market analysis, industry trends, and strategic approach with clarity and impact. With dedicated sections for client testimonials, campaign development, and partnership opportunities, this template ensures your agency’s value proposition is communicated with confidence and style. Perfectly adaptable to PowerPoint, Keynote, and Google Slides, this proposal template is your go-to tool for sealing deals and building lasting relationships. Your agency’s vision and mission will shine through in a presentation that’s both powerful and persuasive, making your proposals truly unforgettable!


23 slides
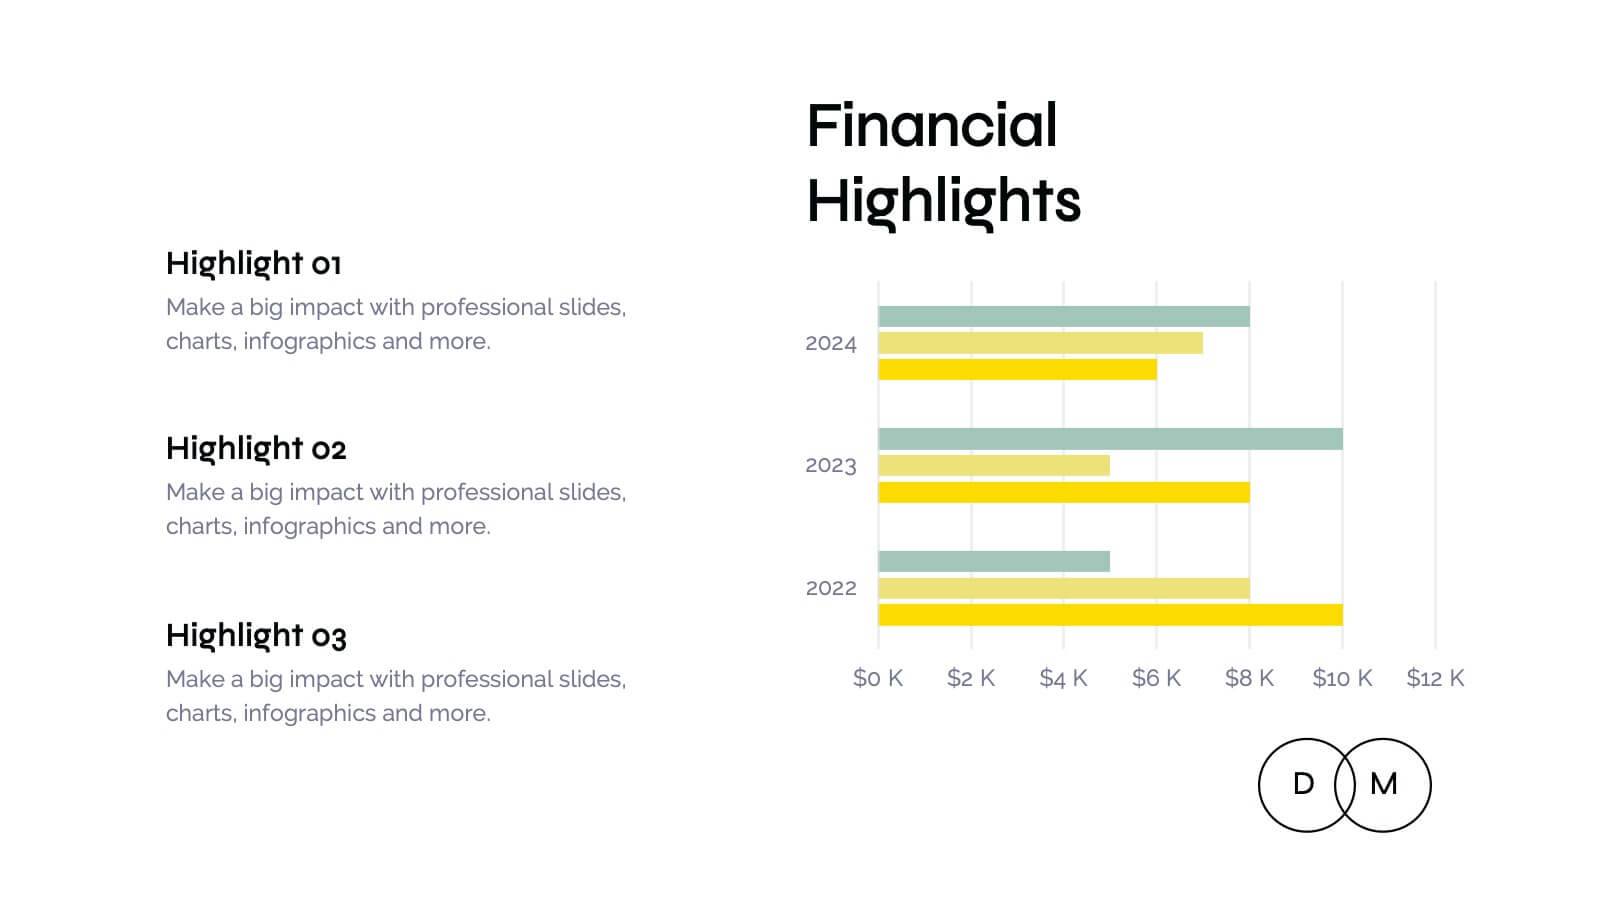
Mystic Small Business Pitch Deck Presentation
Elevate your small business presentations with this sleek, professional pitch deck template! It’s designed to highlight your company's background, market opportunities, and key objectives in a visually appealing format. Perfect for showcasing your products, services, value proposition, and financial performance, this template makes your pitch stand out. Customize it for PowerPoint, Keynote, or Google Slides to suit your needs.


4 slides
Athlete Training and Strategy Presentation
Present training performance and strategy benchmarks with this Athlete Training and Strategy slide. Featuring a sleek runner silhouette and gradient-colored progress bars, this layout lets you showcase four training pillars with accompanying metrics or KPIs. Ideal for coaching sessions, sports science reviews, or athlete development plans. Fully editable in PowerPoint, Keynote, and Google Slides.


5 slides
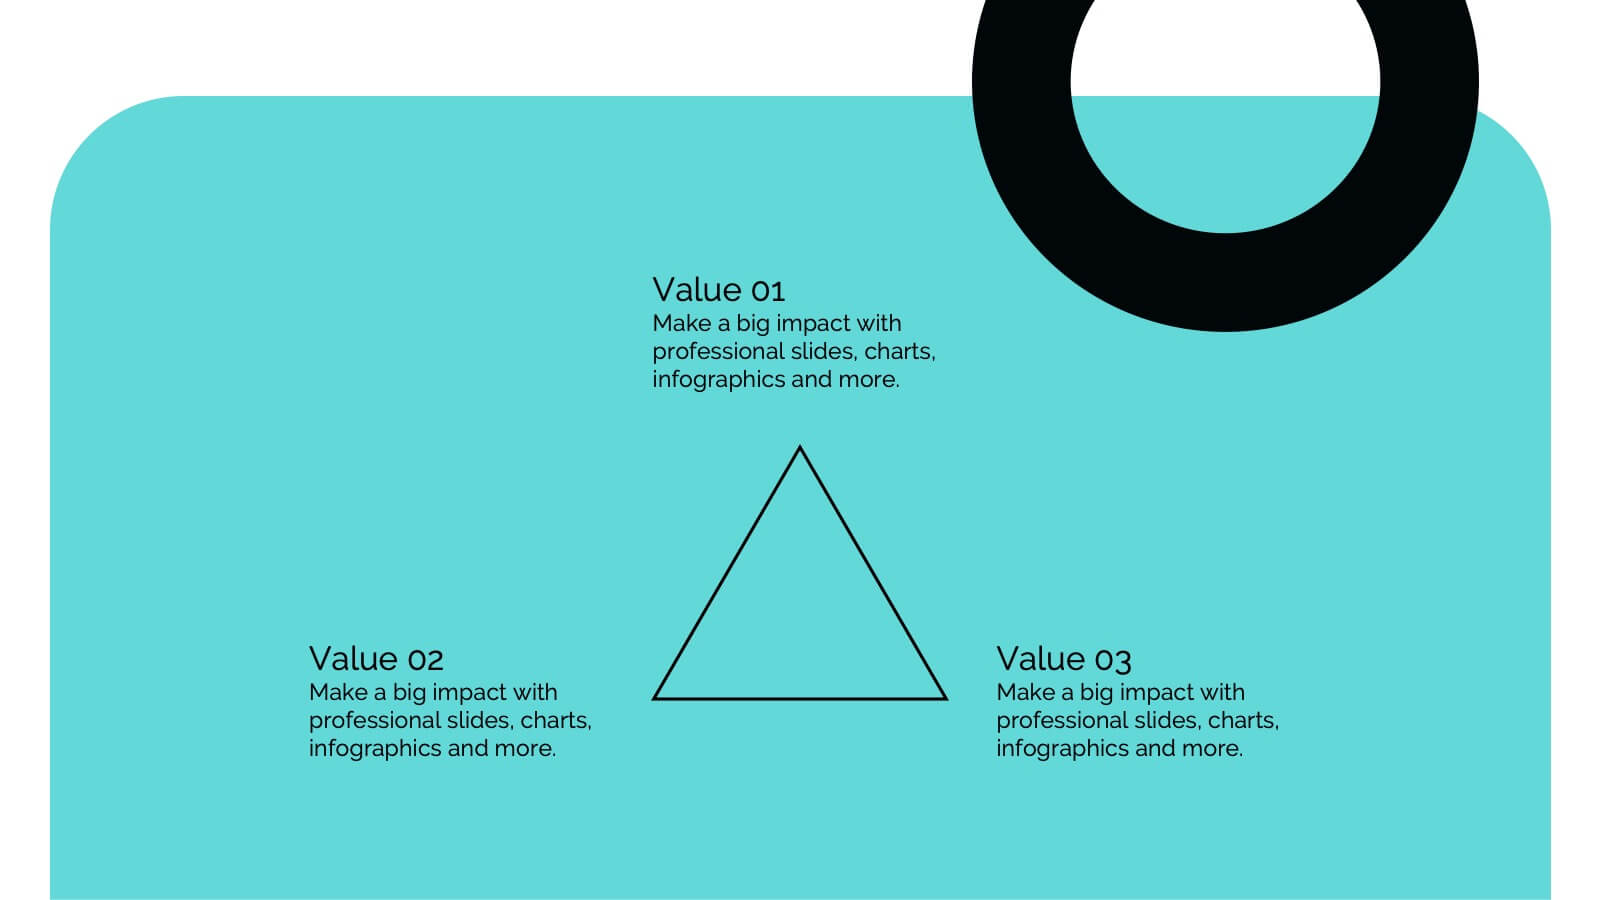
Geometric Design Elements
Make your message stand out with this bold, 3D geometric infographic layout. Ideal for visualizing layered concepts, structural data, or multi-dimensional strategies. Each triangular section is color-coded and fully editable to align with your brand or topic. Compatible with PowerPoint, Keynote, and Google Slides.