


Features
- 4 Unique slides
- Fully editable and easy to edit in Microsoft Powerpoint, Keynote and Google Slides
- 16:9 widescreen layout
- Clean and professional designs
- Export to JPG, PDF or send by email


Do you have any questions?
Recommend


6 slides
Central Idea Spider Layout Presentation
Bring your big idea to life with a sleek, organized layout that keeps every supporting point perfectly connected. This presentation is ideal for mapping strategies, goals, or project concepts in a clear, visual way. Fully customizable and compatible with PowerPoint, Keynote, and Google Slides for effortless editing.


4 slides
Professional Team Member Slides Presentation
Meet your team in a fresh, dynamic way with a layout that highlights personalities, roles, and key contributions at a glance. This presentation helps introduce members clearly, supporting stronger collaboration and professional communication across any project. Fully customizable and compatible with PowerPoint, Keynote, and Google Slides.


5 slides
Dual Axis Butterfly Diagram Presentation
Give your data the spotlight it deserves with a modern layout designed for clarity and balance. This presentation is perfect for comparing two perspectives, processes, or variables side by side in a visually appealing way. Fully customizable and compatible with PowerPoint, Keynote, and Google Slides.


21 slides
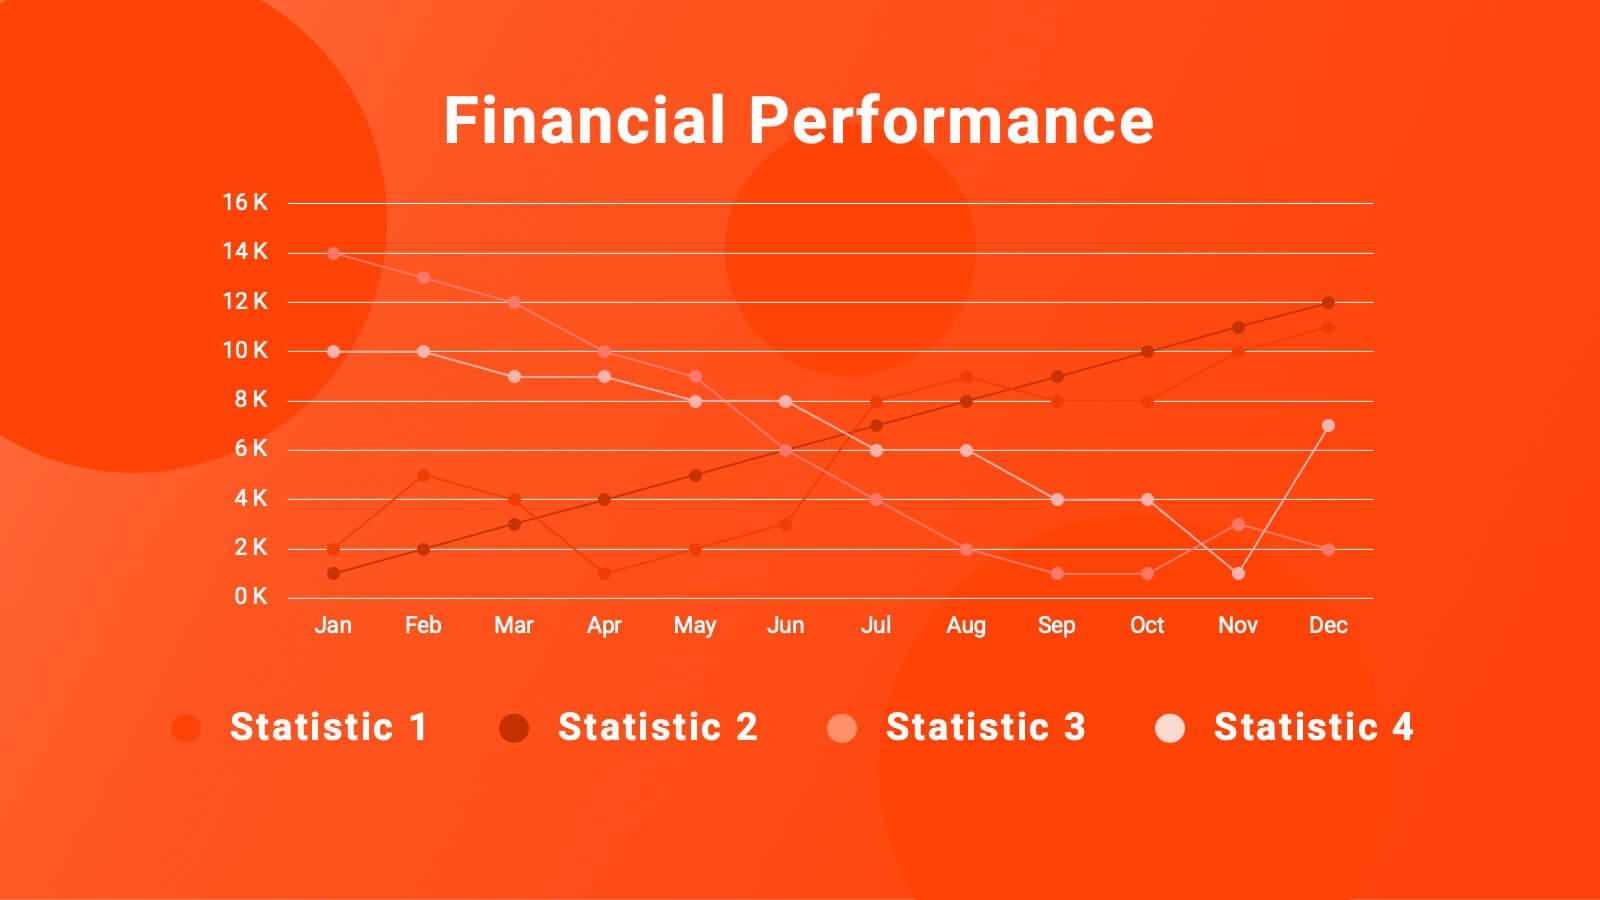
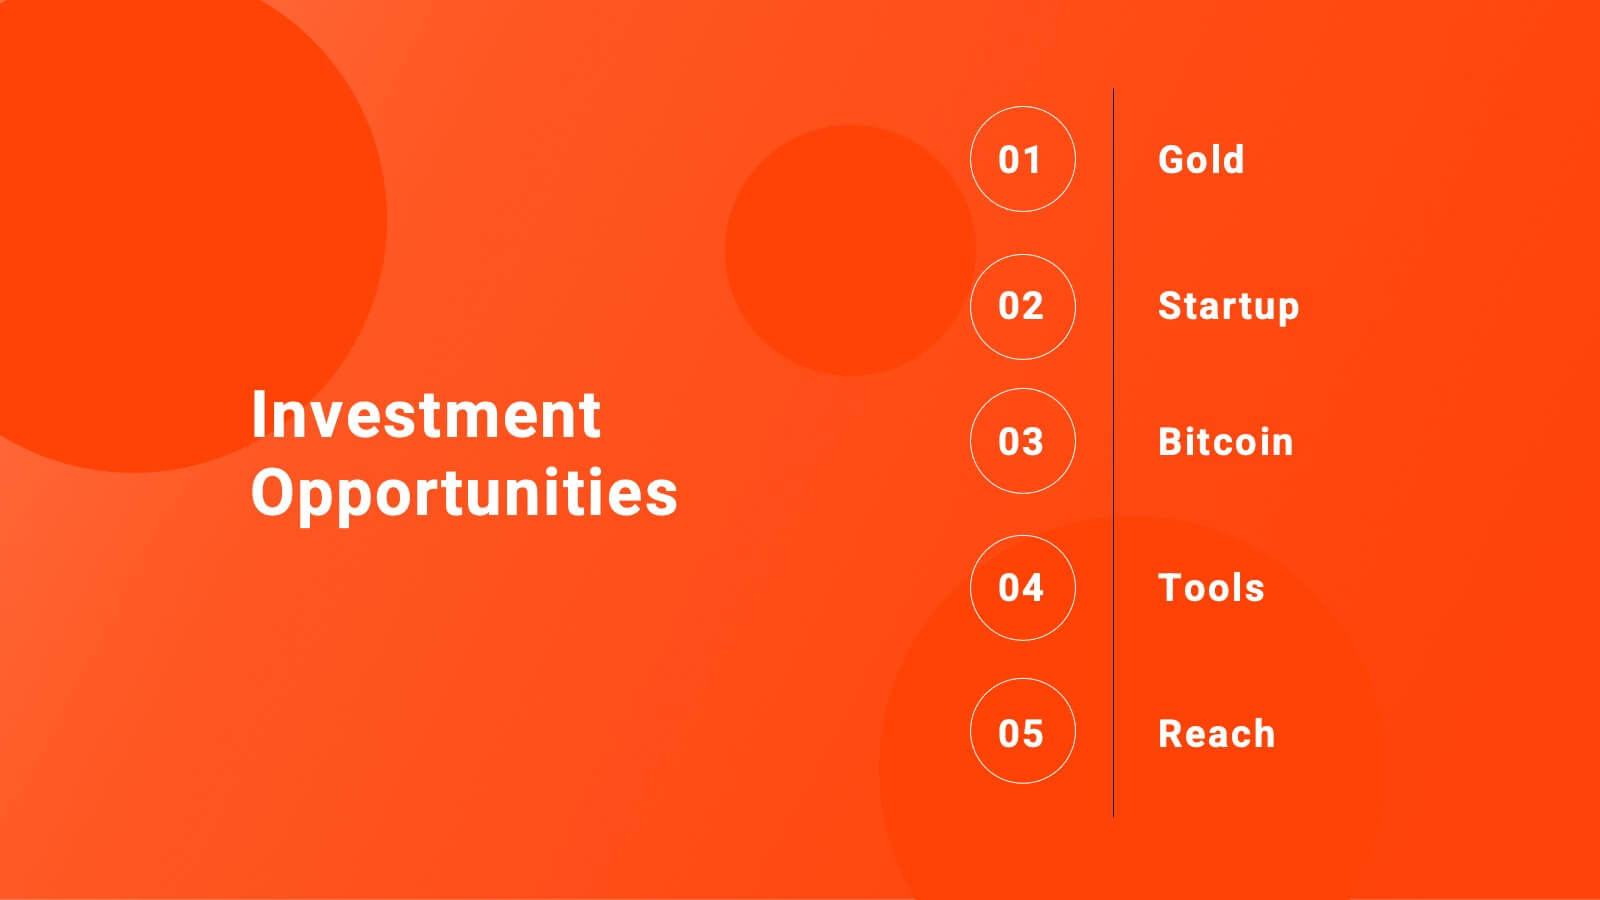
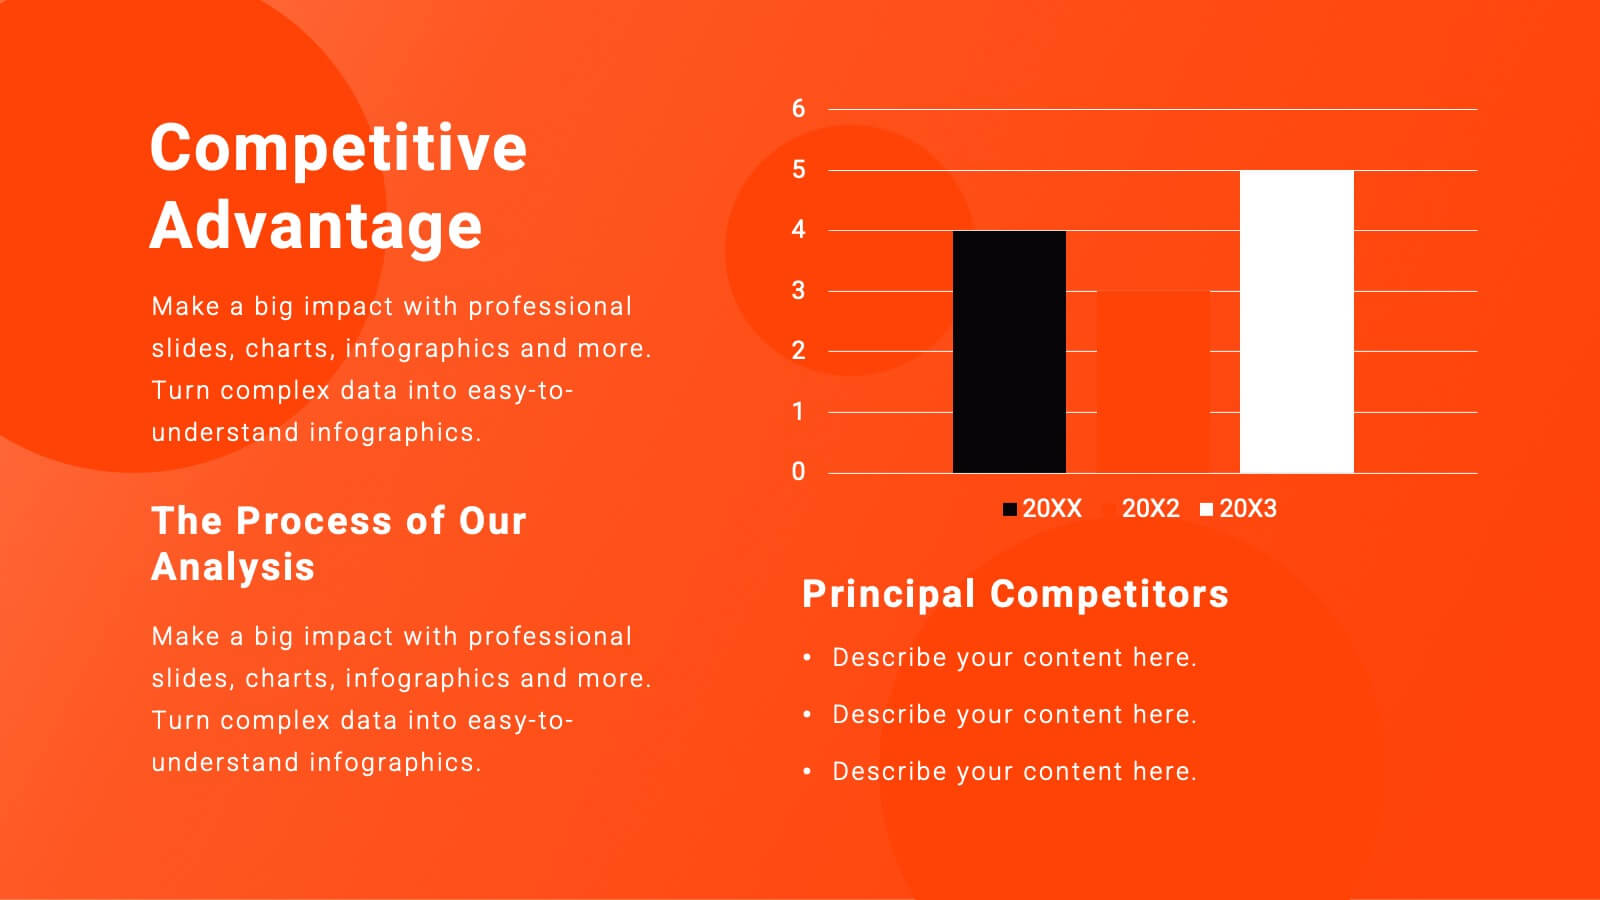
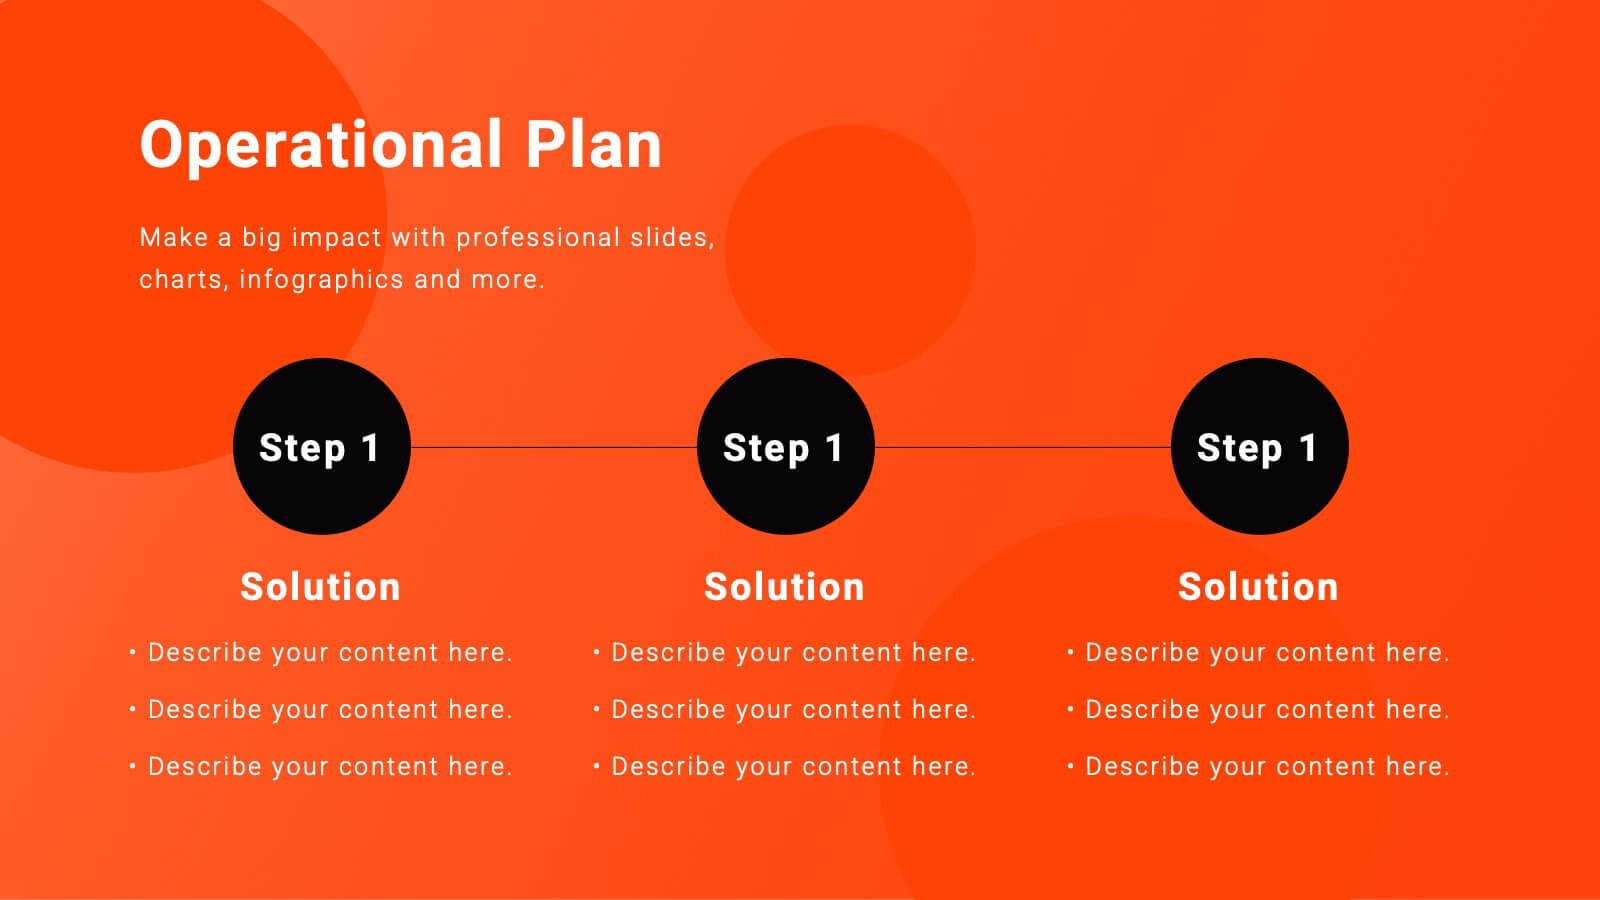
Auster Financial Report Presentation
Present financial insights with clarity using this comprehensive report template. Highlight key metrics, performance, project progress, competitor analysis, and strategic initiatives. Includes sections for team productivity, market trends, goals, and recommendations. Perfect for business reviews and updates. Fully customizable for PowerPoint, Keynote, and Google Slides.


5 slides
New Hire Employee Onboarding Flow Presentation
Make a lasting first impression with a clear, engaging flow that guides new hires through every step of their onboarding journey. Perfect for HR teams and managers, this presentation simplifies complex processes with visual structure and clarity. Fully compatible with PowerPoint, Keynote, and Google Slides for easy customization and use.


10 slides
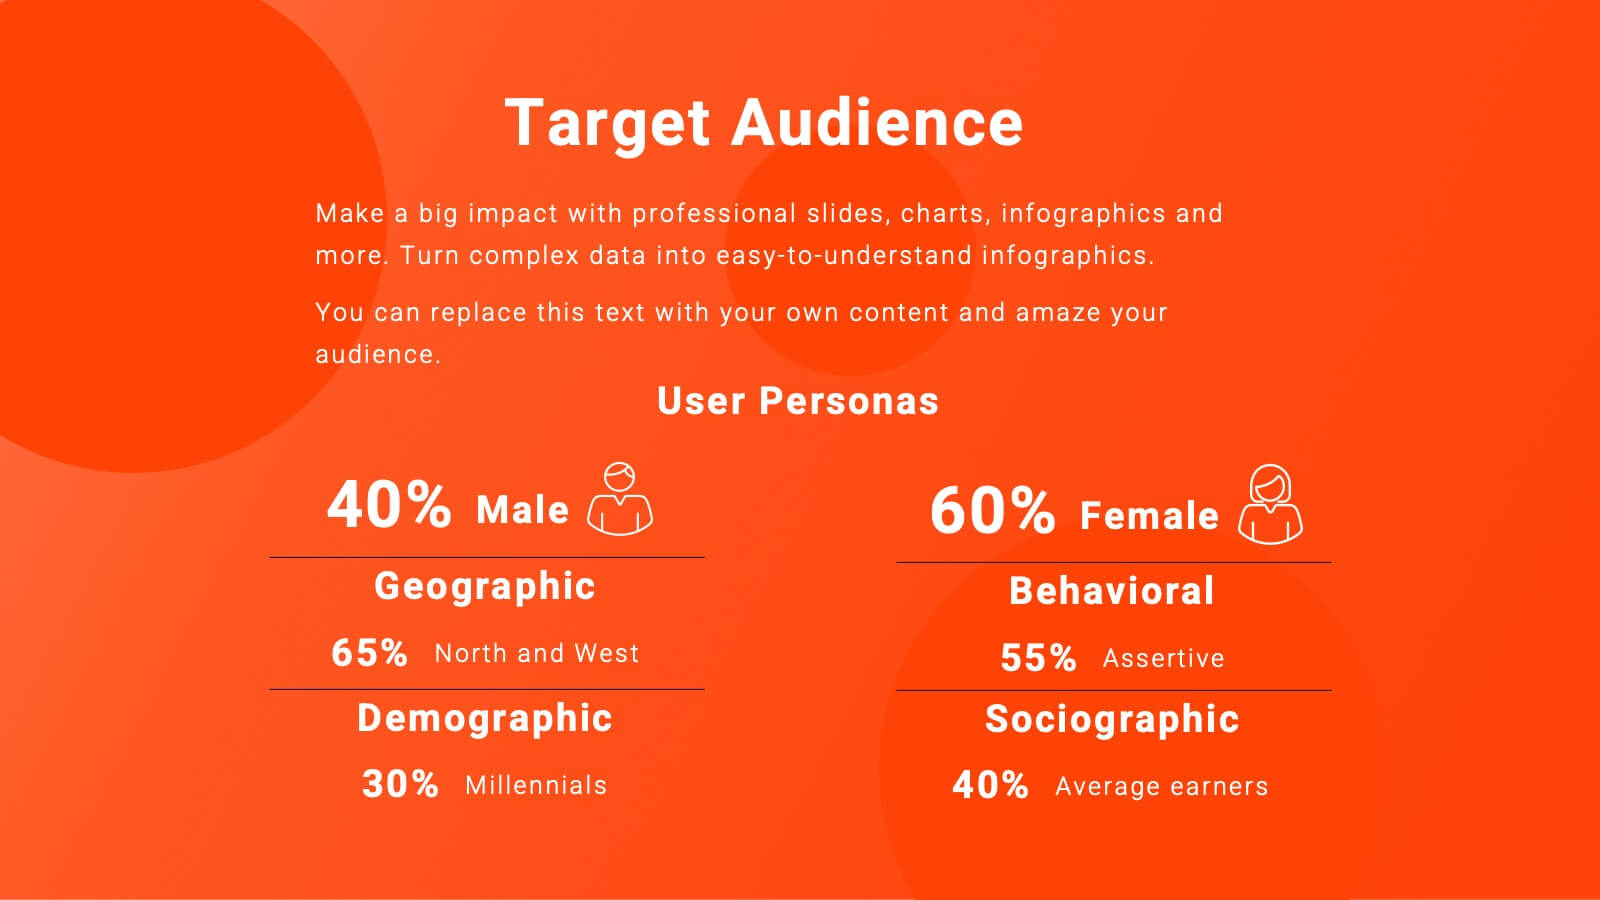
Customer Market Segmentation Strategy Presentation
Define and visualize your audience with the Customer Market Segmentation Strategy Presentation. This slide layout helps you categorize customer types using clean iconography and a central persona model. Ideal for marketing teams, sales strategists, or startup pitches. Customize easily in Canva, PowerPoint, Google Slides, or Keynote.


4 slides
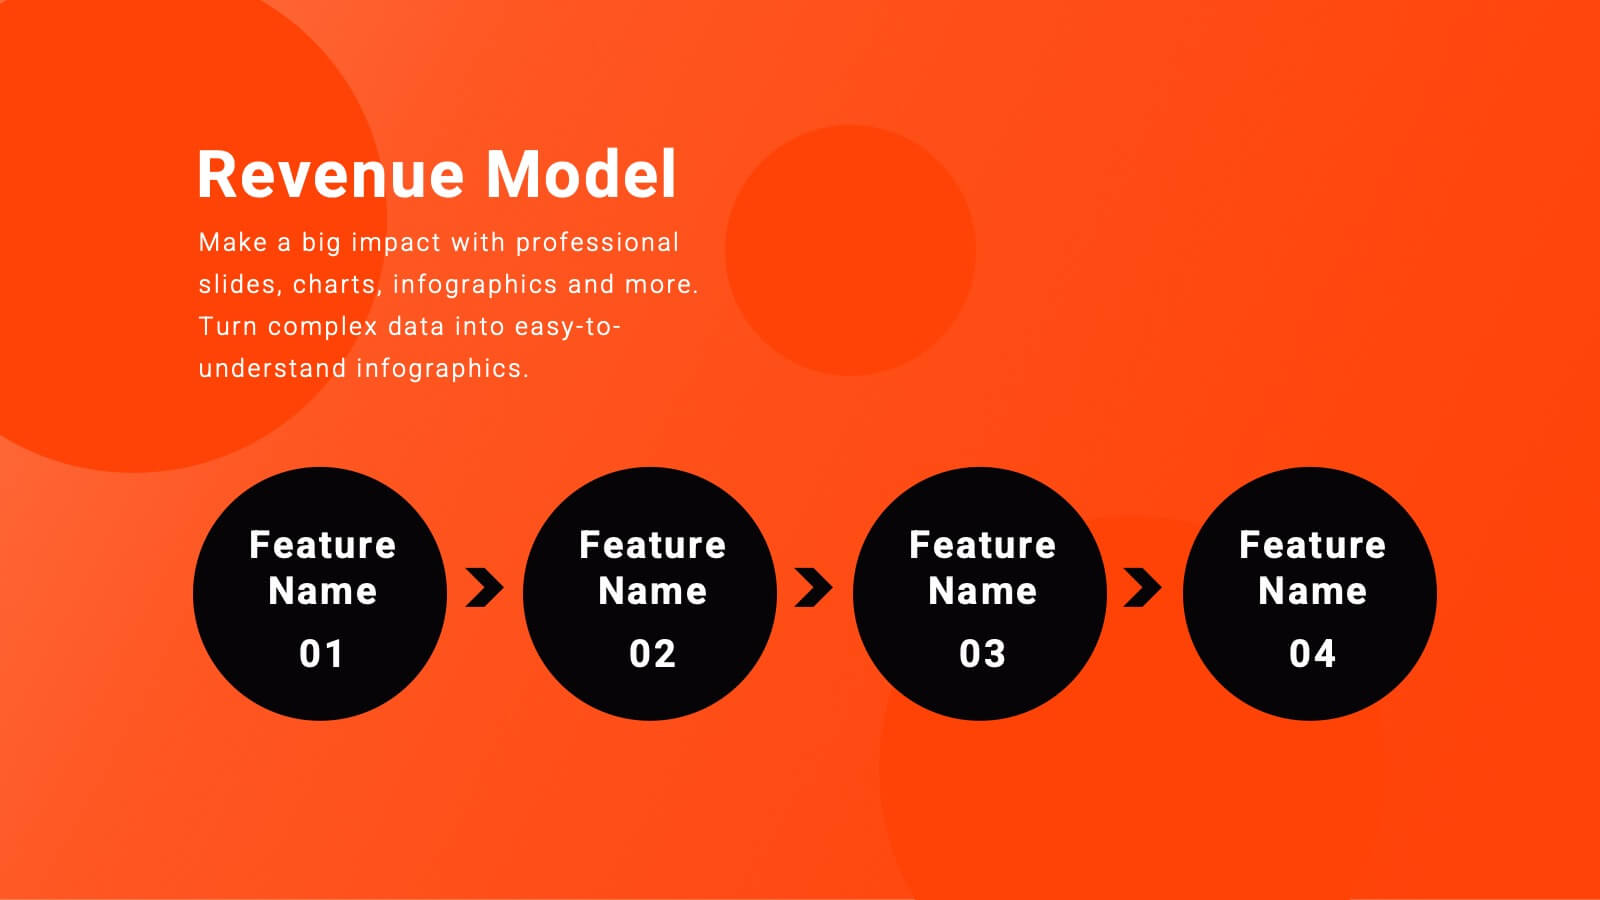
Business Model Value Stream Design Presentation
Clarify complex operations with the Business Model Value Stream Design Presentation. This slide template is perfect for mapping out your business model, identifying value streams, and aligning teams around critical workflows. Its grid-style layout makes it easy to categorize key areas like customer segments, operations, and financial drivers—ideal for strategic planning sessions or executive overviews. Fully editable and compatible with PowerPoint, Keynote, and Google Slides, this design is a smart choice for consultants, business analysts, and operations leaders.


7 slides
Gap Analysis Skills Infographic
Gap analysis in a skills context is a process of evaluating the difference or "gap" between the current skills and competencies of an individual or a team and the desired or required skills for a particular role, project, or goal. This infographic template is a crucial tool for personal and professional development, talent management, and strategic planning within organizations. This captivating visual is designed to help individuals and organizations bridge the skills gap effectively. This infographic serves as a compass, guiding you through the essential steps needed to identify, analyze, and close the skills gaps within your organization.


5 slides
Tips for Recycling Infographics
Recycling is an important practice that helps reduce waste, conserve resources, and protect the environment. These vertical infographics are designed to educate and encourage individuals on effective recycling practices. These provides a comprehensive overview of recycling and offers practical tips to help people incorporate recycling into their daily lives. This aims to educate and inspire individuals to take an active role in recycling and waste reduction. These are the perfect tools to raise awareness about waste management, and encourage sustainable behaviors. Compatible with Powerpoint, Keynote, and Google Slides.


7 slides
Governance Infographics Presentation Template
Our Governance Infographic is designed to present complex information in an easy-to-understand format that is accessible to a wide audience. This template gives you the opportunity to create an infographic that is easy on the eye, but thorough and detailed enough to make sure all the points are covered. This template includes 7 slides that present a comprehensive framework for monitoring and evaluating a company's governance, risk management, and compliance programs. Packed with great content, this presentation tells the story of your governance system. Get started easily by adding your text!


21 slides
Aquamarine Creative Portfolio Presentation
Dive into creativity with this stunning aquamarine-inspired portfolio presentation! Perfect for showcasing your creative work, this template allows you to highlight your projects, skills, and achievements with a refreshing and modern design. Its clean and dynamic layout enhances your portfolio's impact. Compatible with PowerPoint, Keynote, and Google Slides.


4 slides
Investment Analysis Finance Presentation
Target your financial insights with this Investment Analysis Finance Presentation. Designed with a bold bullseye diagram and four labeled pointers, this slide helps communicate core focus areas, ROI, risk zones, or asset distribution. Ideal for pitch decks, portfolio reviews, and financial reports. Fully editable in PowerPoint, Keynote, and Google Slides—perfect for analysts, investors, and finance professionals.


23 slides
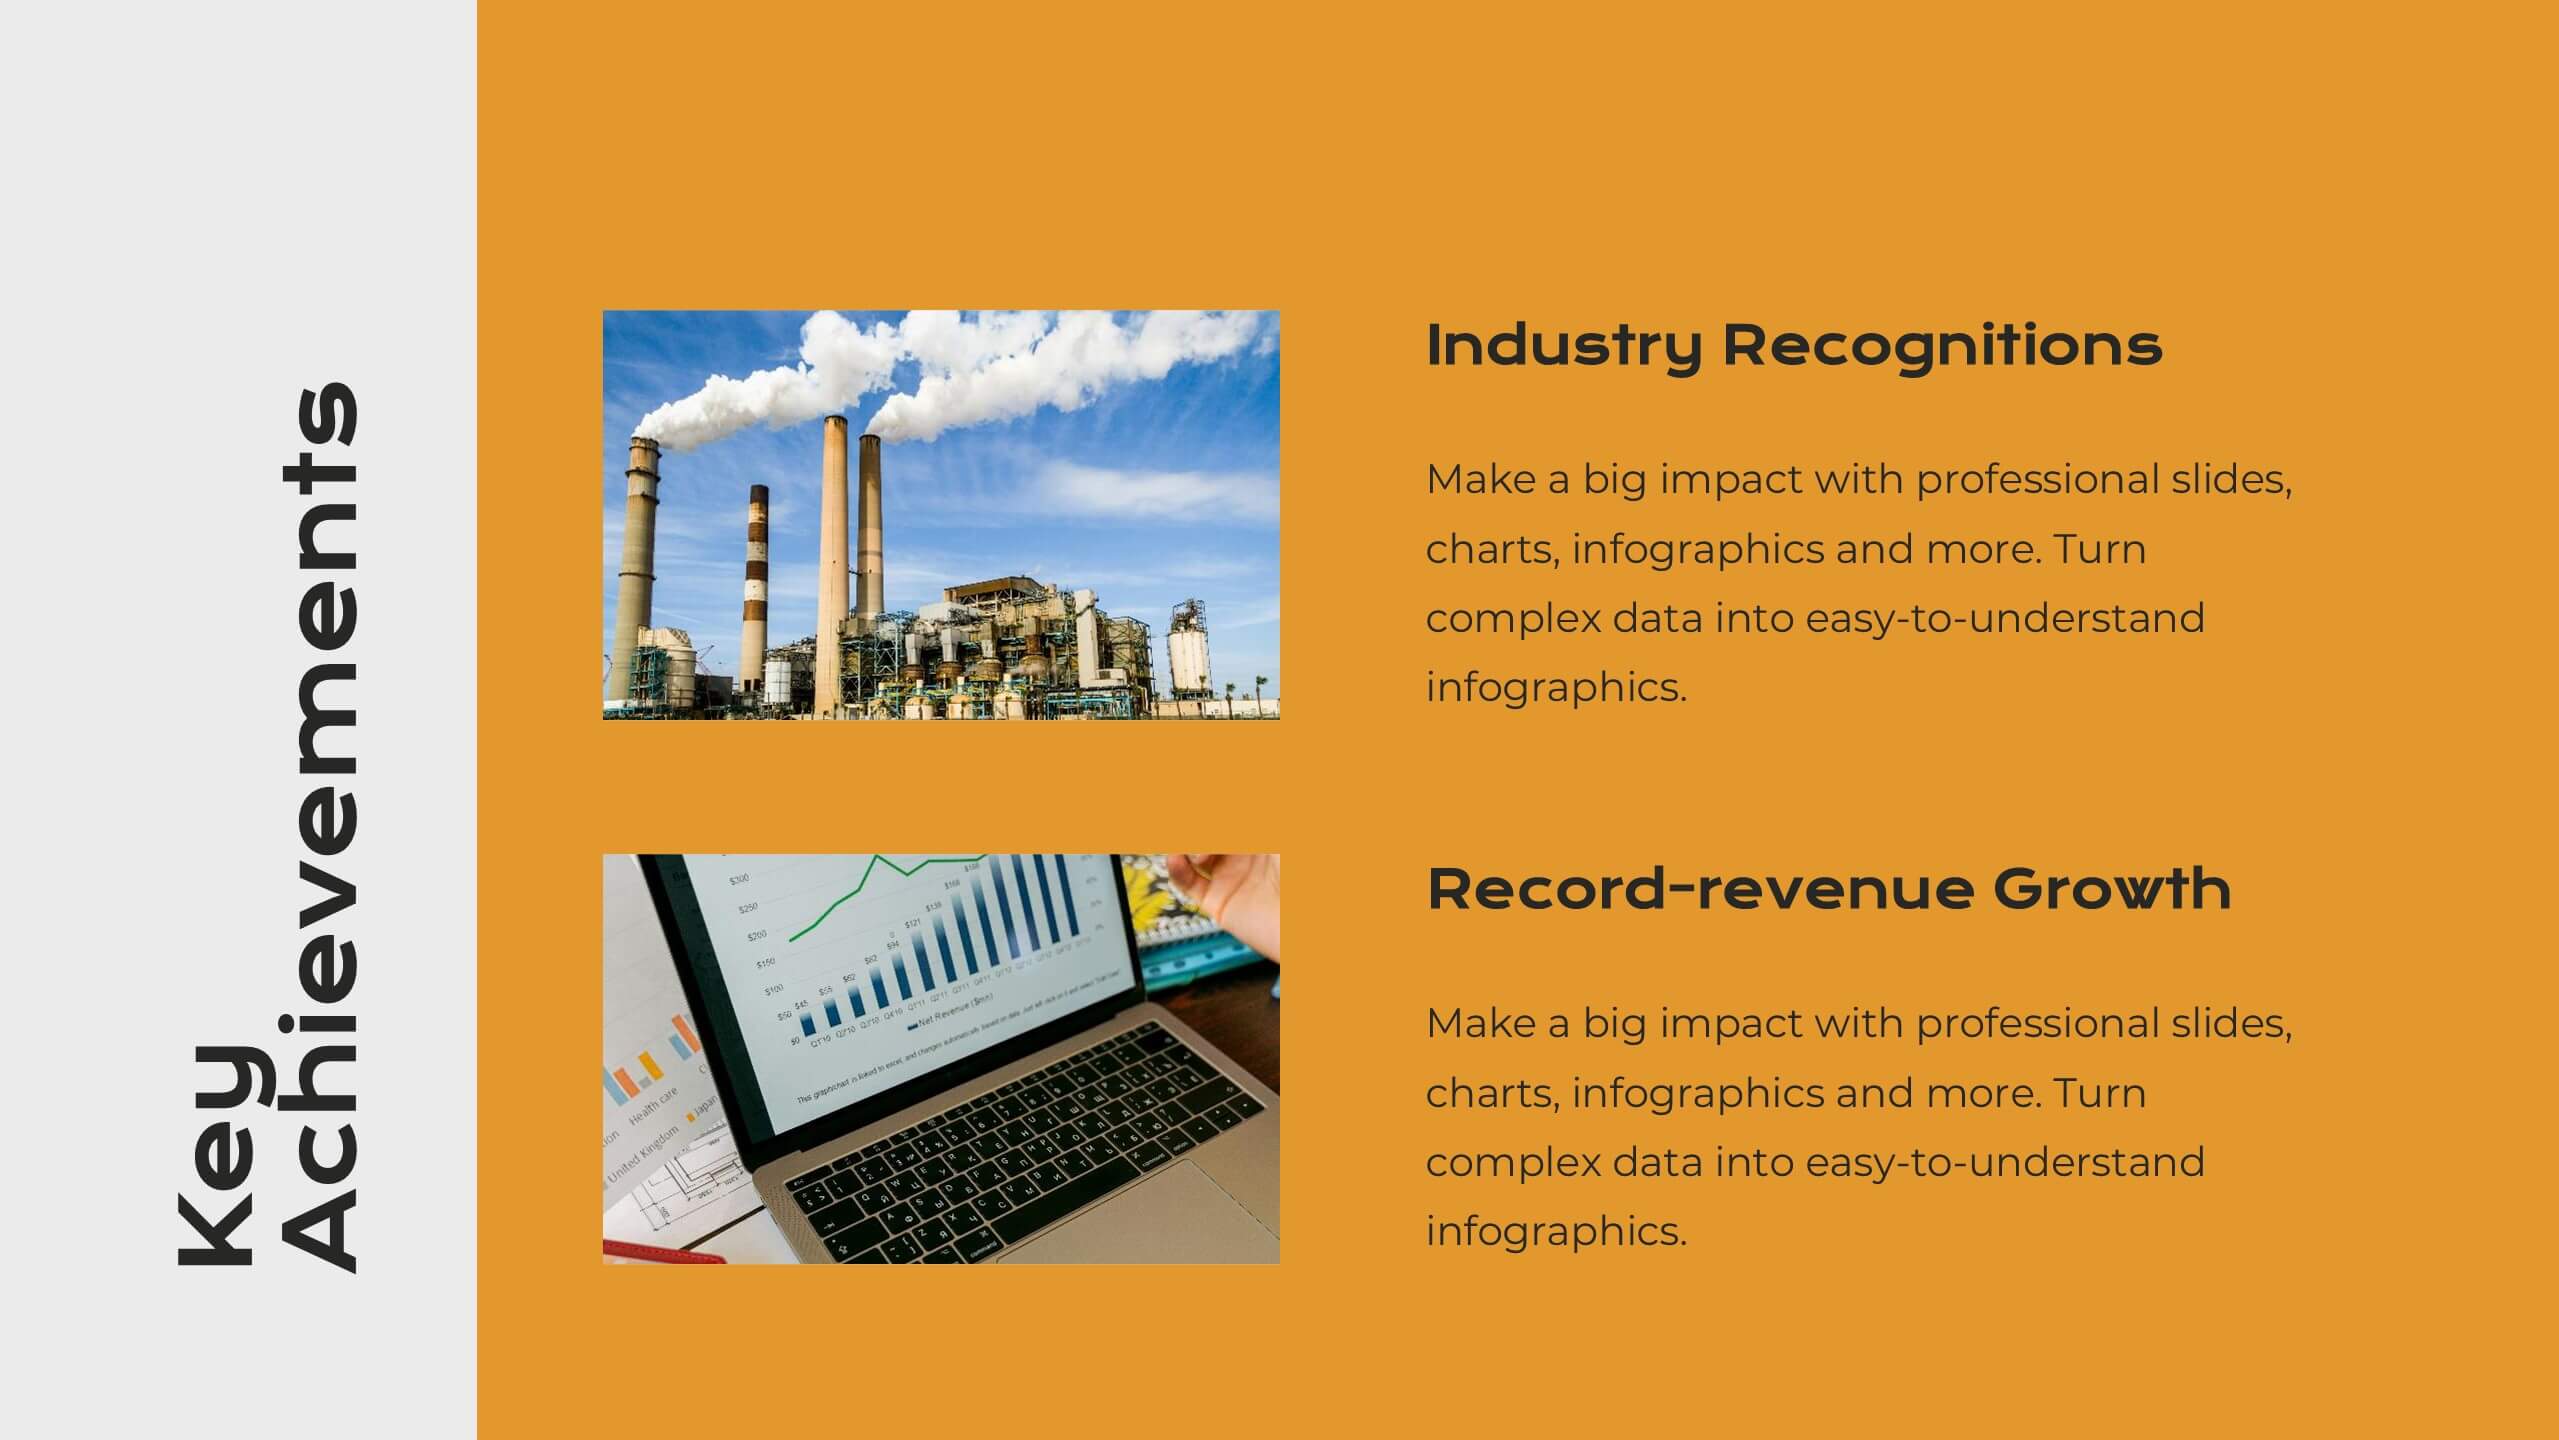
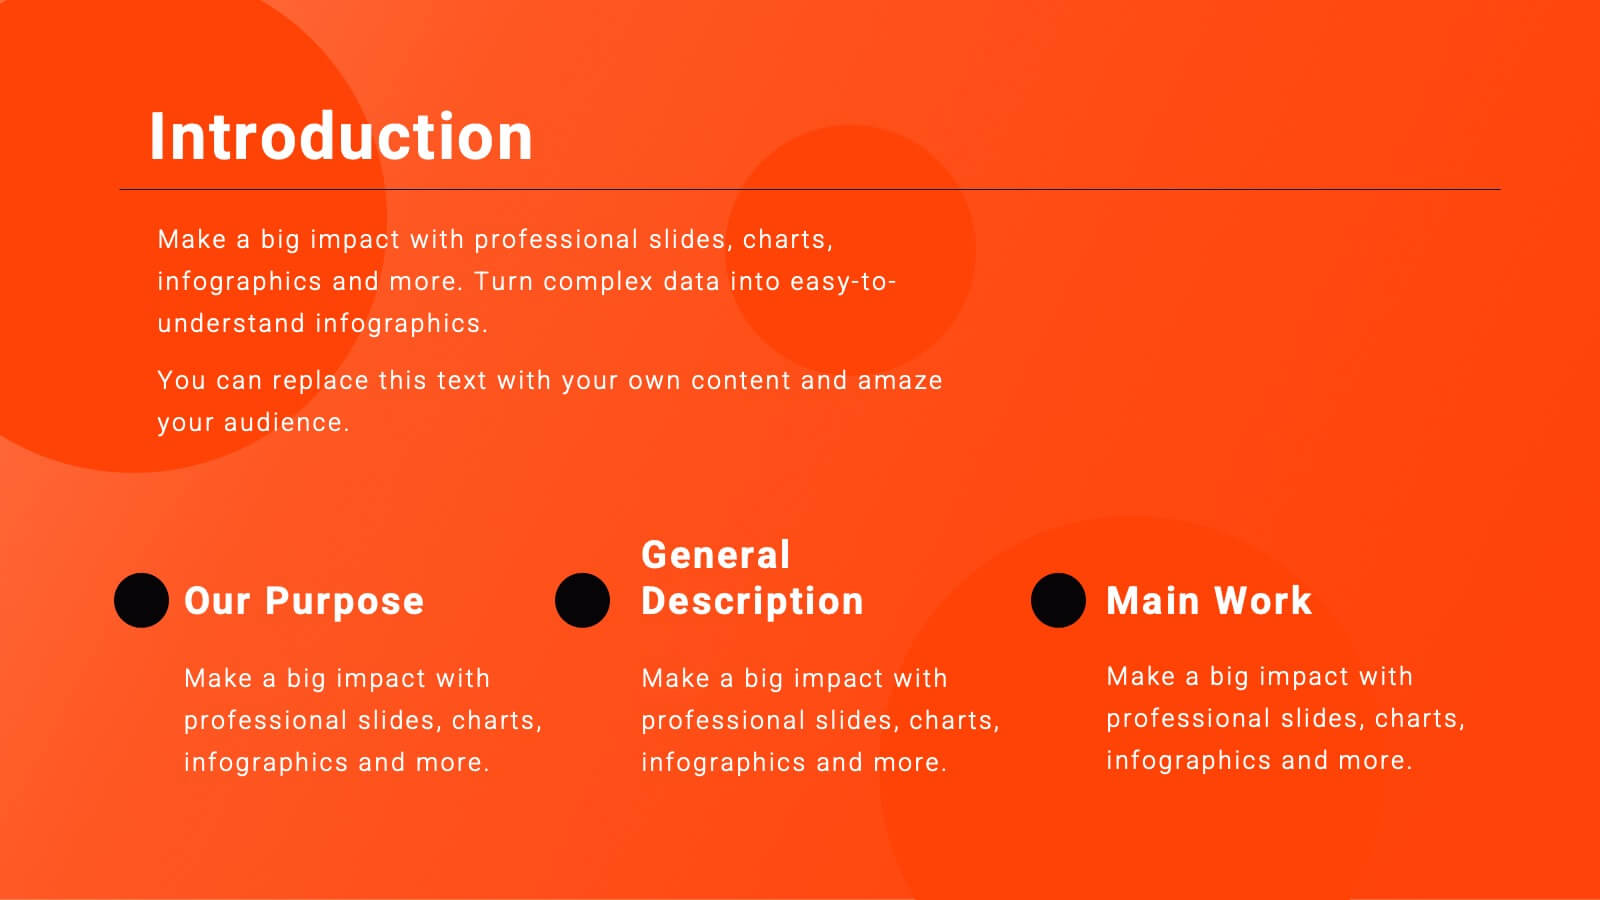
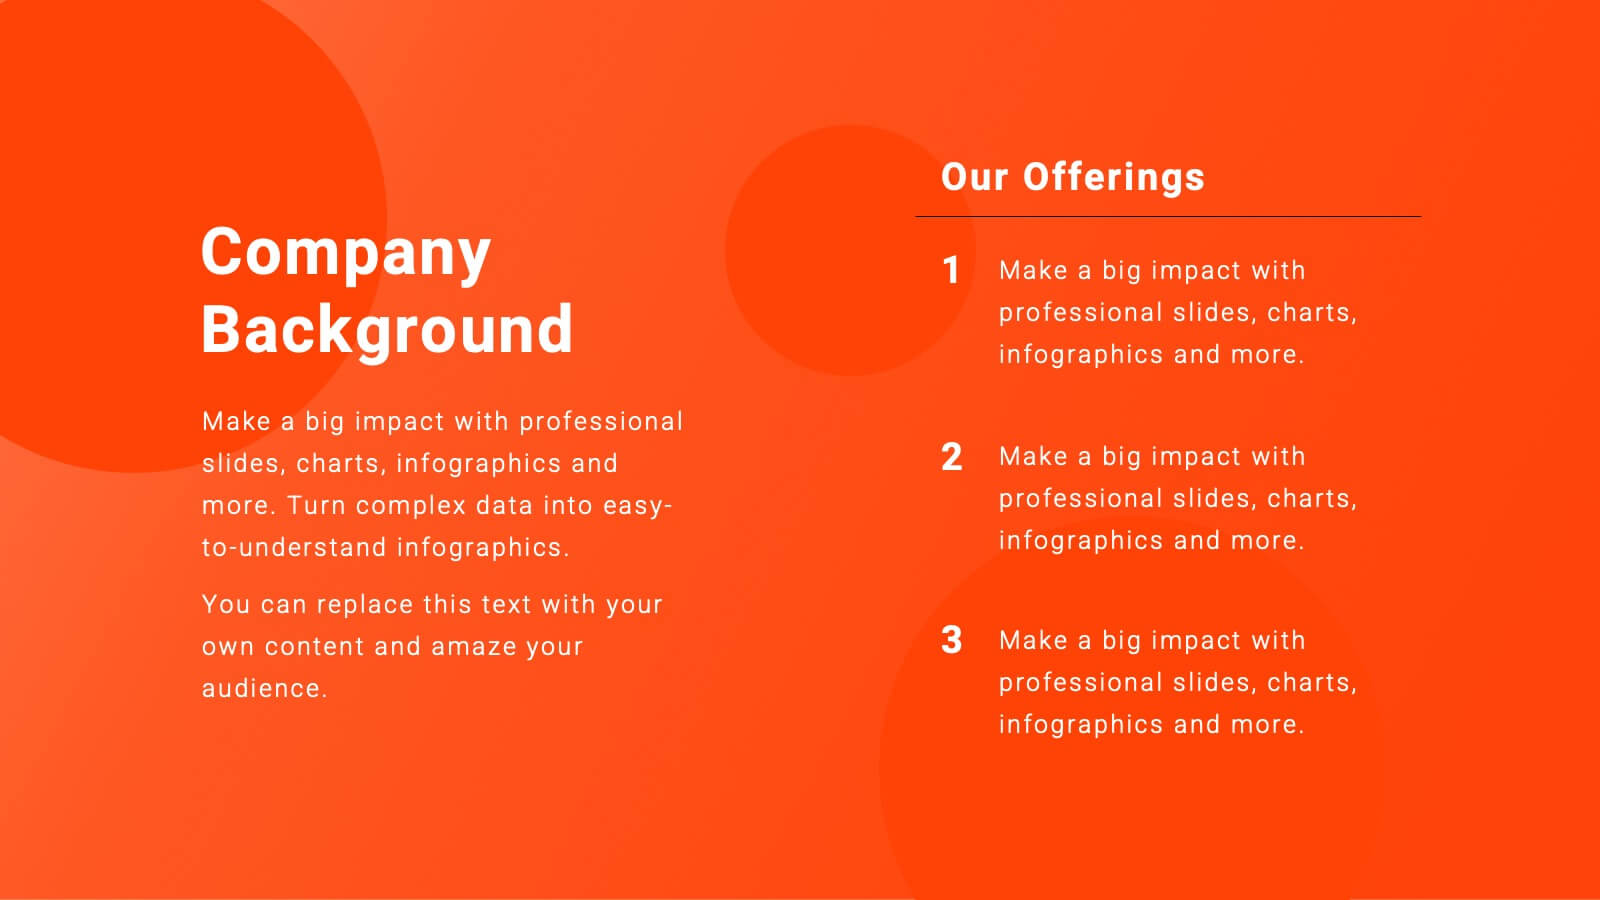
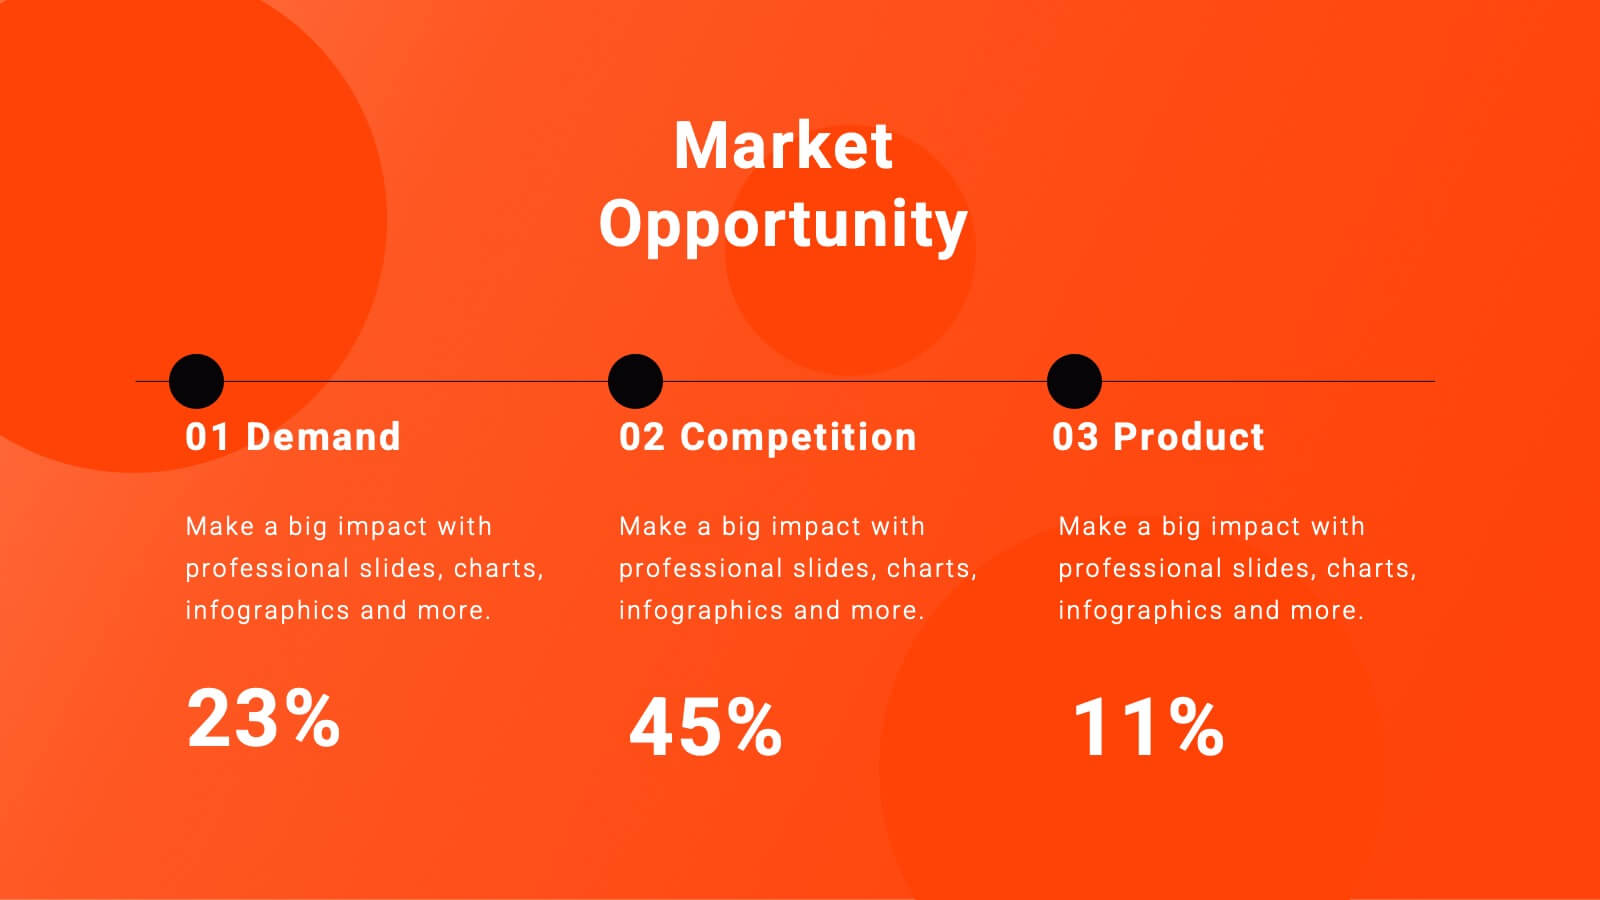
Equinox Business Operations Plan Presentation
Elevate your business operations with this dynamic plan template! Perfect for detailing company background, market opportunities, and strategic objectives. Ideal for business leaders and managers aiming to streamline operations and drive growth. Compatible with PowerPoint, Keynote, and Google Slides, this template ensures your business plan is clear, professional, and impactful. Drive success today!


8 slides
Data Analytics Dashboard Slide Presentation
Turn raw data into visual insights with this clean and modern layout designed to simplify analytics reporting. Perfect for tracking performance metrics, KPIs, and progress updates, it helps make numbers easy to understand at a glance. Fully customizable and compatible with PowerPoint, Keynote, and Google Slides for effortless editing.


26 slides
Operational Efficiency Tips Purple Presentation
Optimize your team's workflow and showcase your strategies for improved performance with this operational efficiency template. The vibrant purples and dynamic design invite viewers into a world where streamlined processes and clear objectives lead to success. Lay out the steps of your action plan, from the CEO's vision to the team's execution, with a variety of slides designed for clear communication. Charts and diagrams turn complex data into easy-to-follow visuals, while mockups provide a real-world view of your tools and platforms. Tailored for use in popular presentation software, this set of slides is an excellent aid for managers and consultants aiming to present plans that boost productivity and cut down waste. It’s all about making the complex simple and achieving more with less, helping your audience see the path to a leaner and more effective operation.


7 slides
Social Hierarchy Infographics
A Social Hierarchy is a way of organizing and ranking individuals or groups within a society based on factors such as social status, wealth, power, and prestige. This template features a powerful message about the difference in power between different groups, a stylish design and is fully customizable. Designed for use in Powerpoint, Google Slides and Keynote. Use this template to make your point clear in a meaningful way that really sticks with your audience. This hierarchy themed infographic is best suited for presentations about company structure, business hierarchies and office politics.


5 slides
RAPID Decision-Making Model
Take the guesswork out of group decisions with this bold and clear template. It’s designed around the RAPID framework—Recommend, Agree, Perform, Input, Decide—to help teams define roles and make faster, more accountable choices. Perfect for leadership, strategy, and project planning sessions. Fully compatible with PowerPoint, Keynote, and Google Slides.