


Features
- 6 Unique slides
- Fully editable and easy to edit in Microsoft Powerpoint, Keynote and Google Slides
- 16:9 widescreen layout
- Clean and professional designs
- Export to JPG, PDF or send by email


Do you have any questions?
Recommend


3 slides
Credit Card Comparison Chart Presentation
Make financial decisions feel clearer and more visual with this clean comparison-focused layout designed to highlight key features side by side. It helps you simplify data, explain differences, and guide smarter choices with confidence. Fully editable and compatible with PowerPoint, Keynote, and Google Slides.


4 slides
Collaborative Team Workflow Presentation
Visualize seamless collaboration with the Collaborative Team Workflow Presentation. This slide design features team icons, branching layouts, and a clean structure to showcase group dynamics and process flow. Perfect for teamwork strategies, HR initiatives, or cross-functional planning. Fully editable in PowerPoint, Keynote, and Google Slides for tailored communication.


4 slides
Athlete Training and Strategy Presentation
Present training performance and strategy benchmarks with this Athlete Training and Strategy slide. Featuring a sleek runner silhouette and gradient-colored progress bars, this layout lets you showcase four training pillars with accompanying metrics or KPIs. Ideal for coaching sessions, sports science reviews, or athlete development plans. Fully editable in PowerPoint, Keynote, and Google Slides.


5 slides
Medical Anatomy Chart Slide Presentation
Present body systems or organ-related topics with this anatomy chart slide. Designed with pinpoint callouts linked to a human silhouette, it helps explain up to four body parts or functions. Ideal for health, biology, or patient education presentations. Fully editable in PowerPoint, Keynote, or Google Slides for clean, visual storytelling.


20 slides
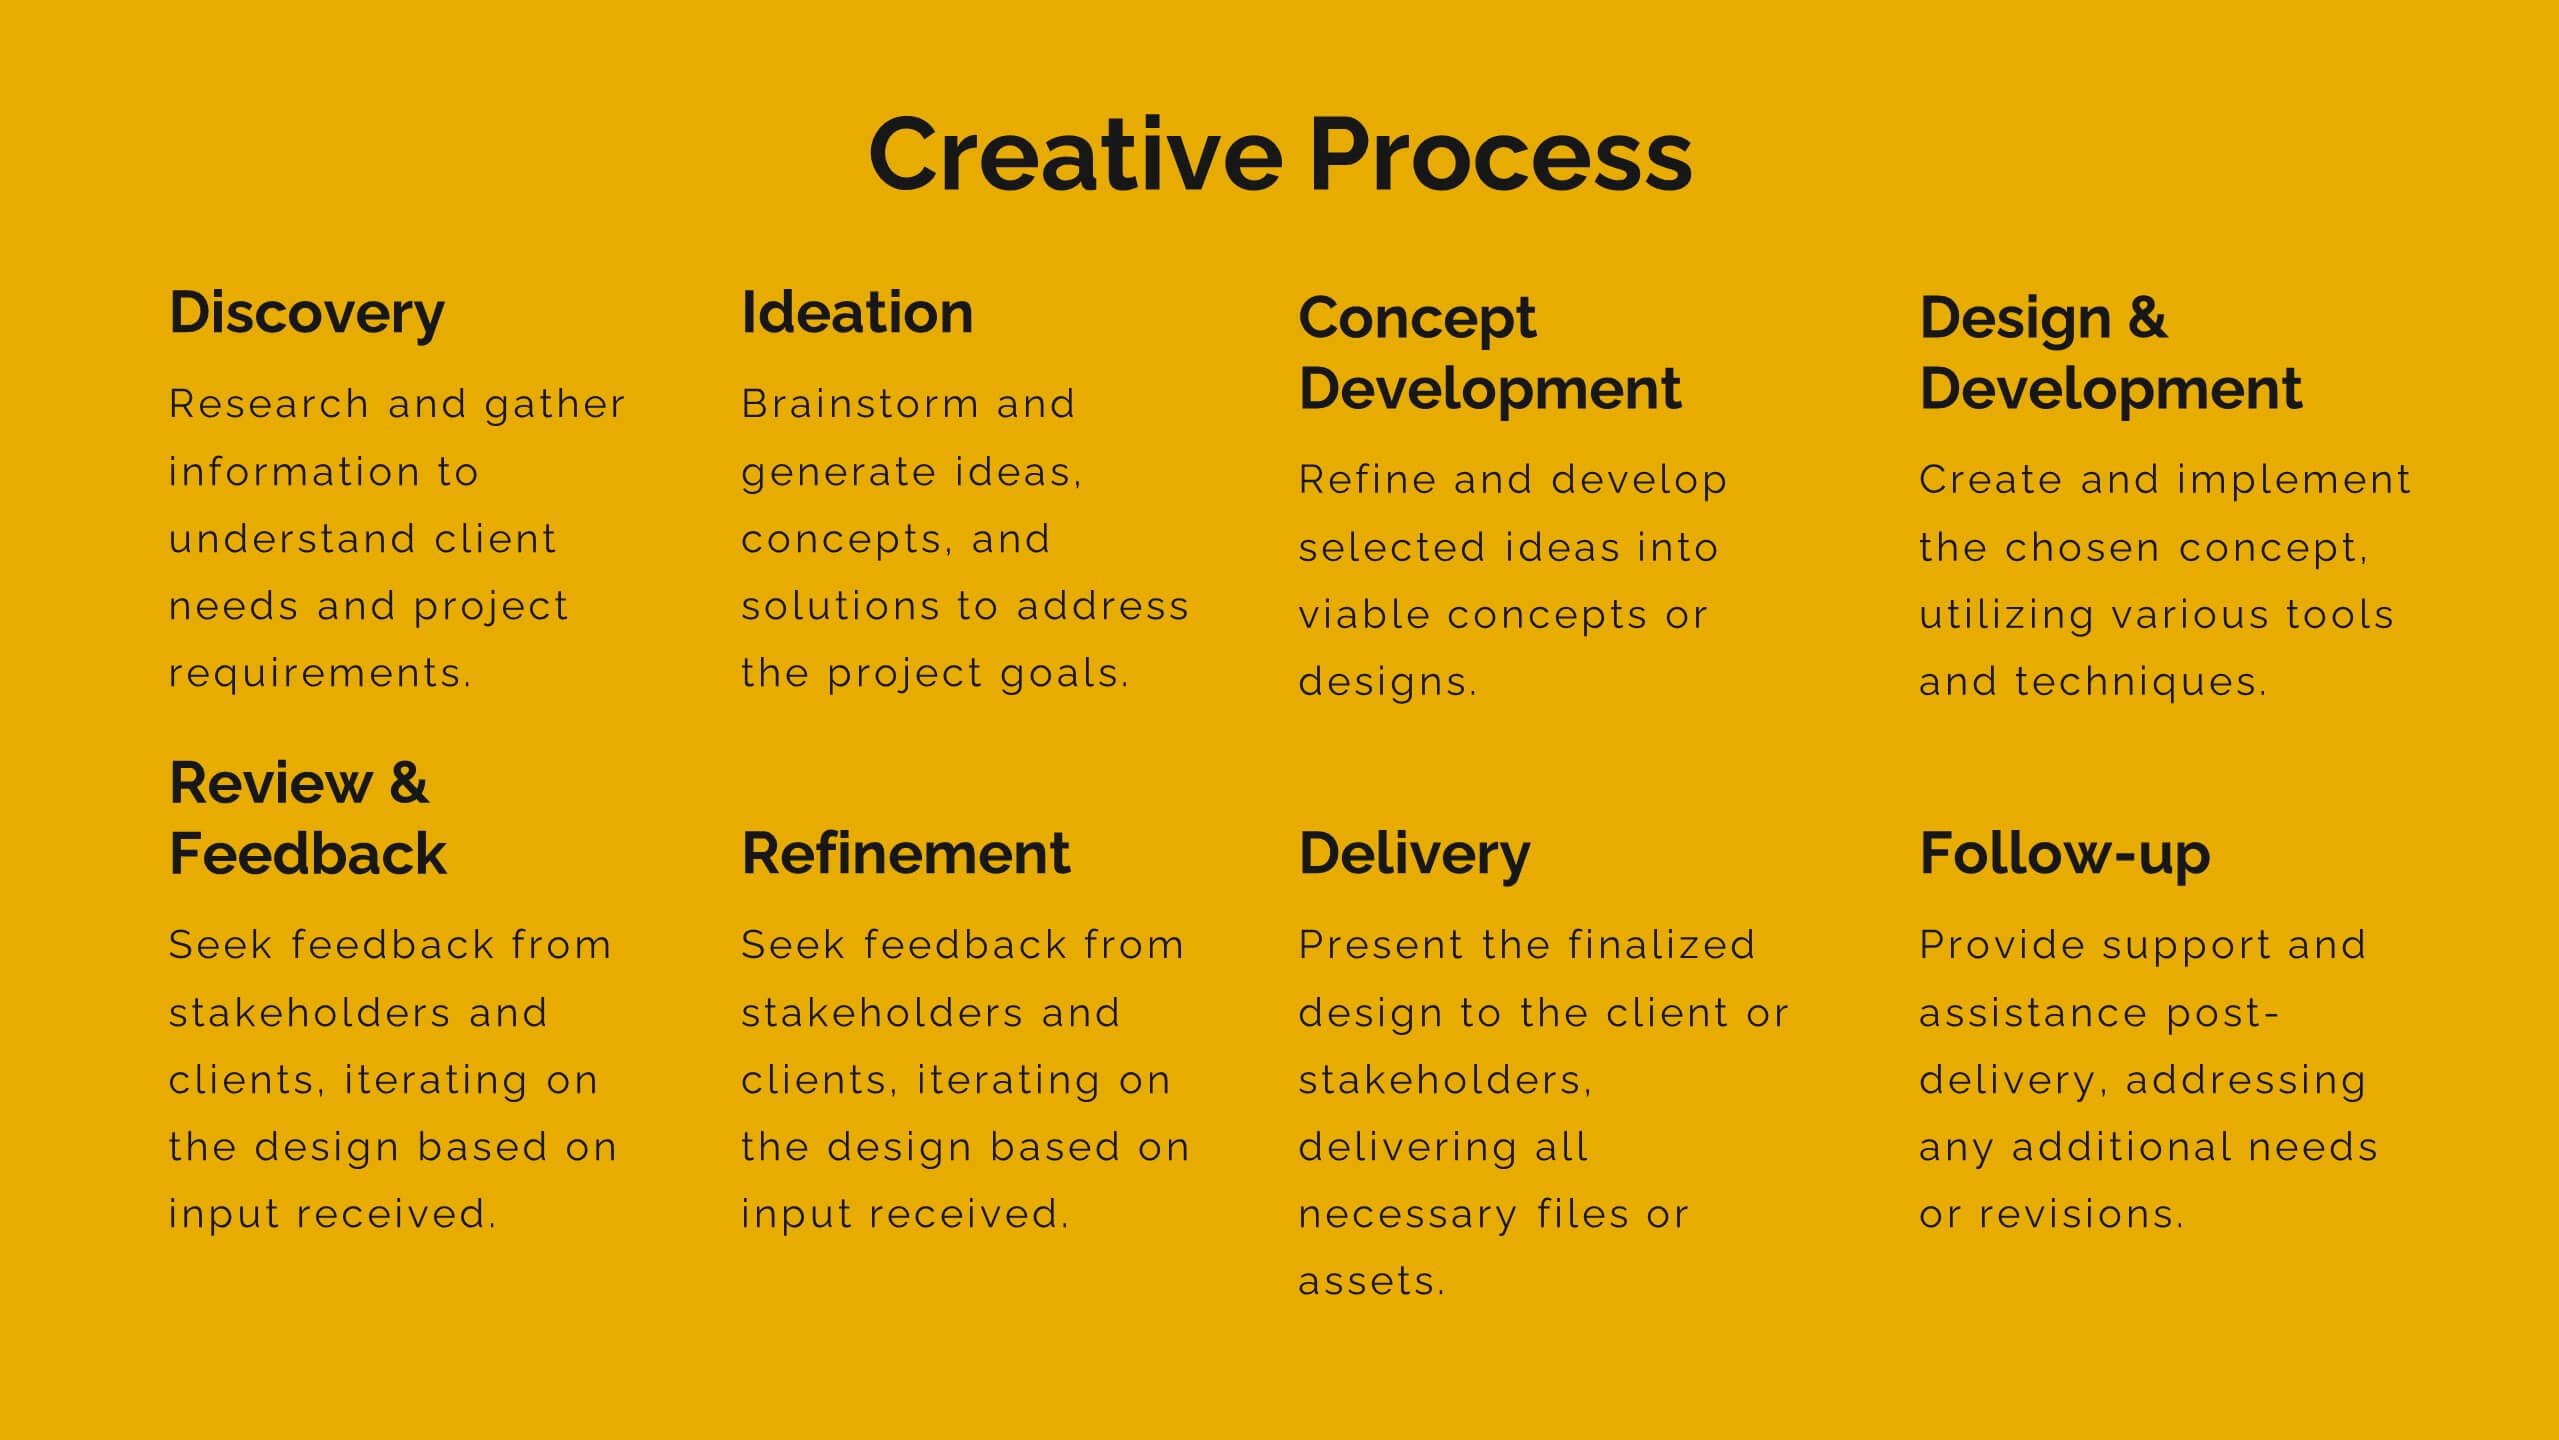
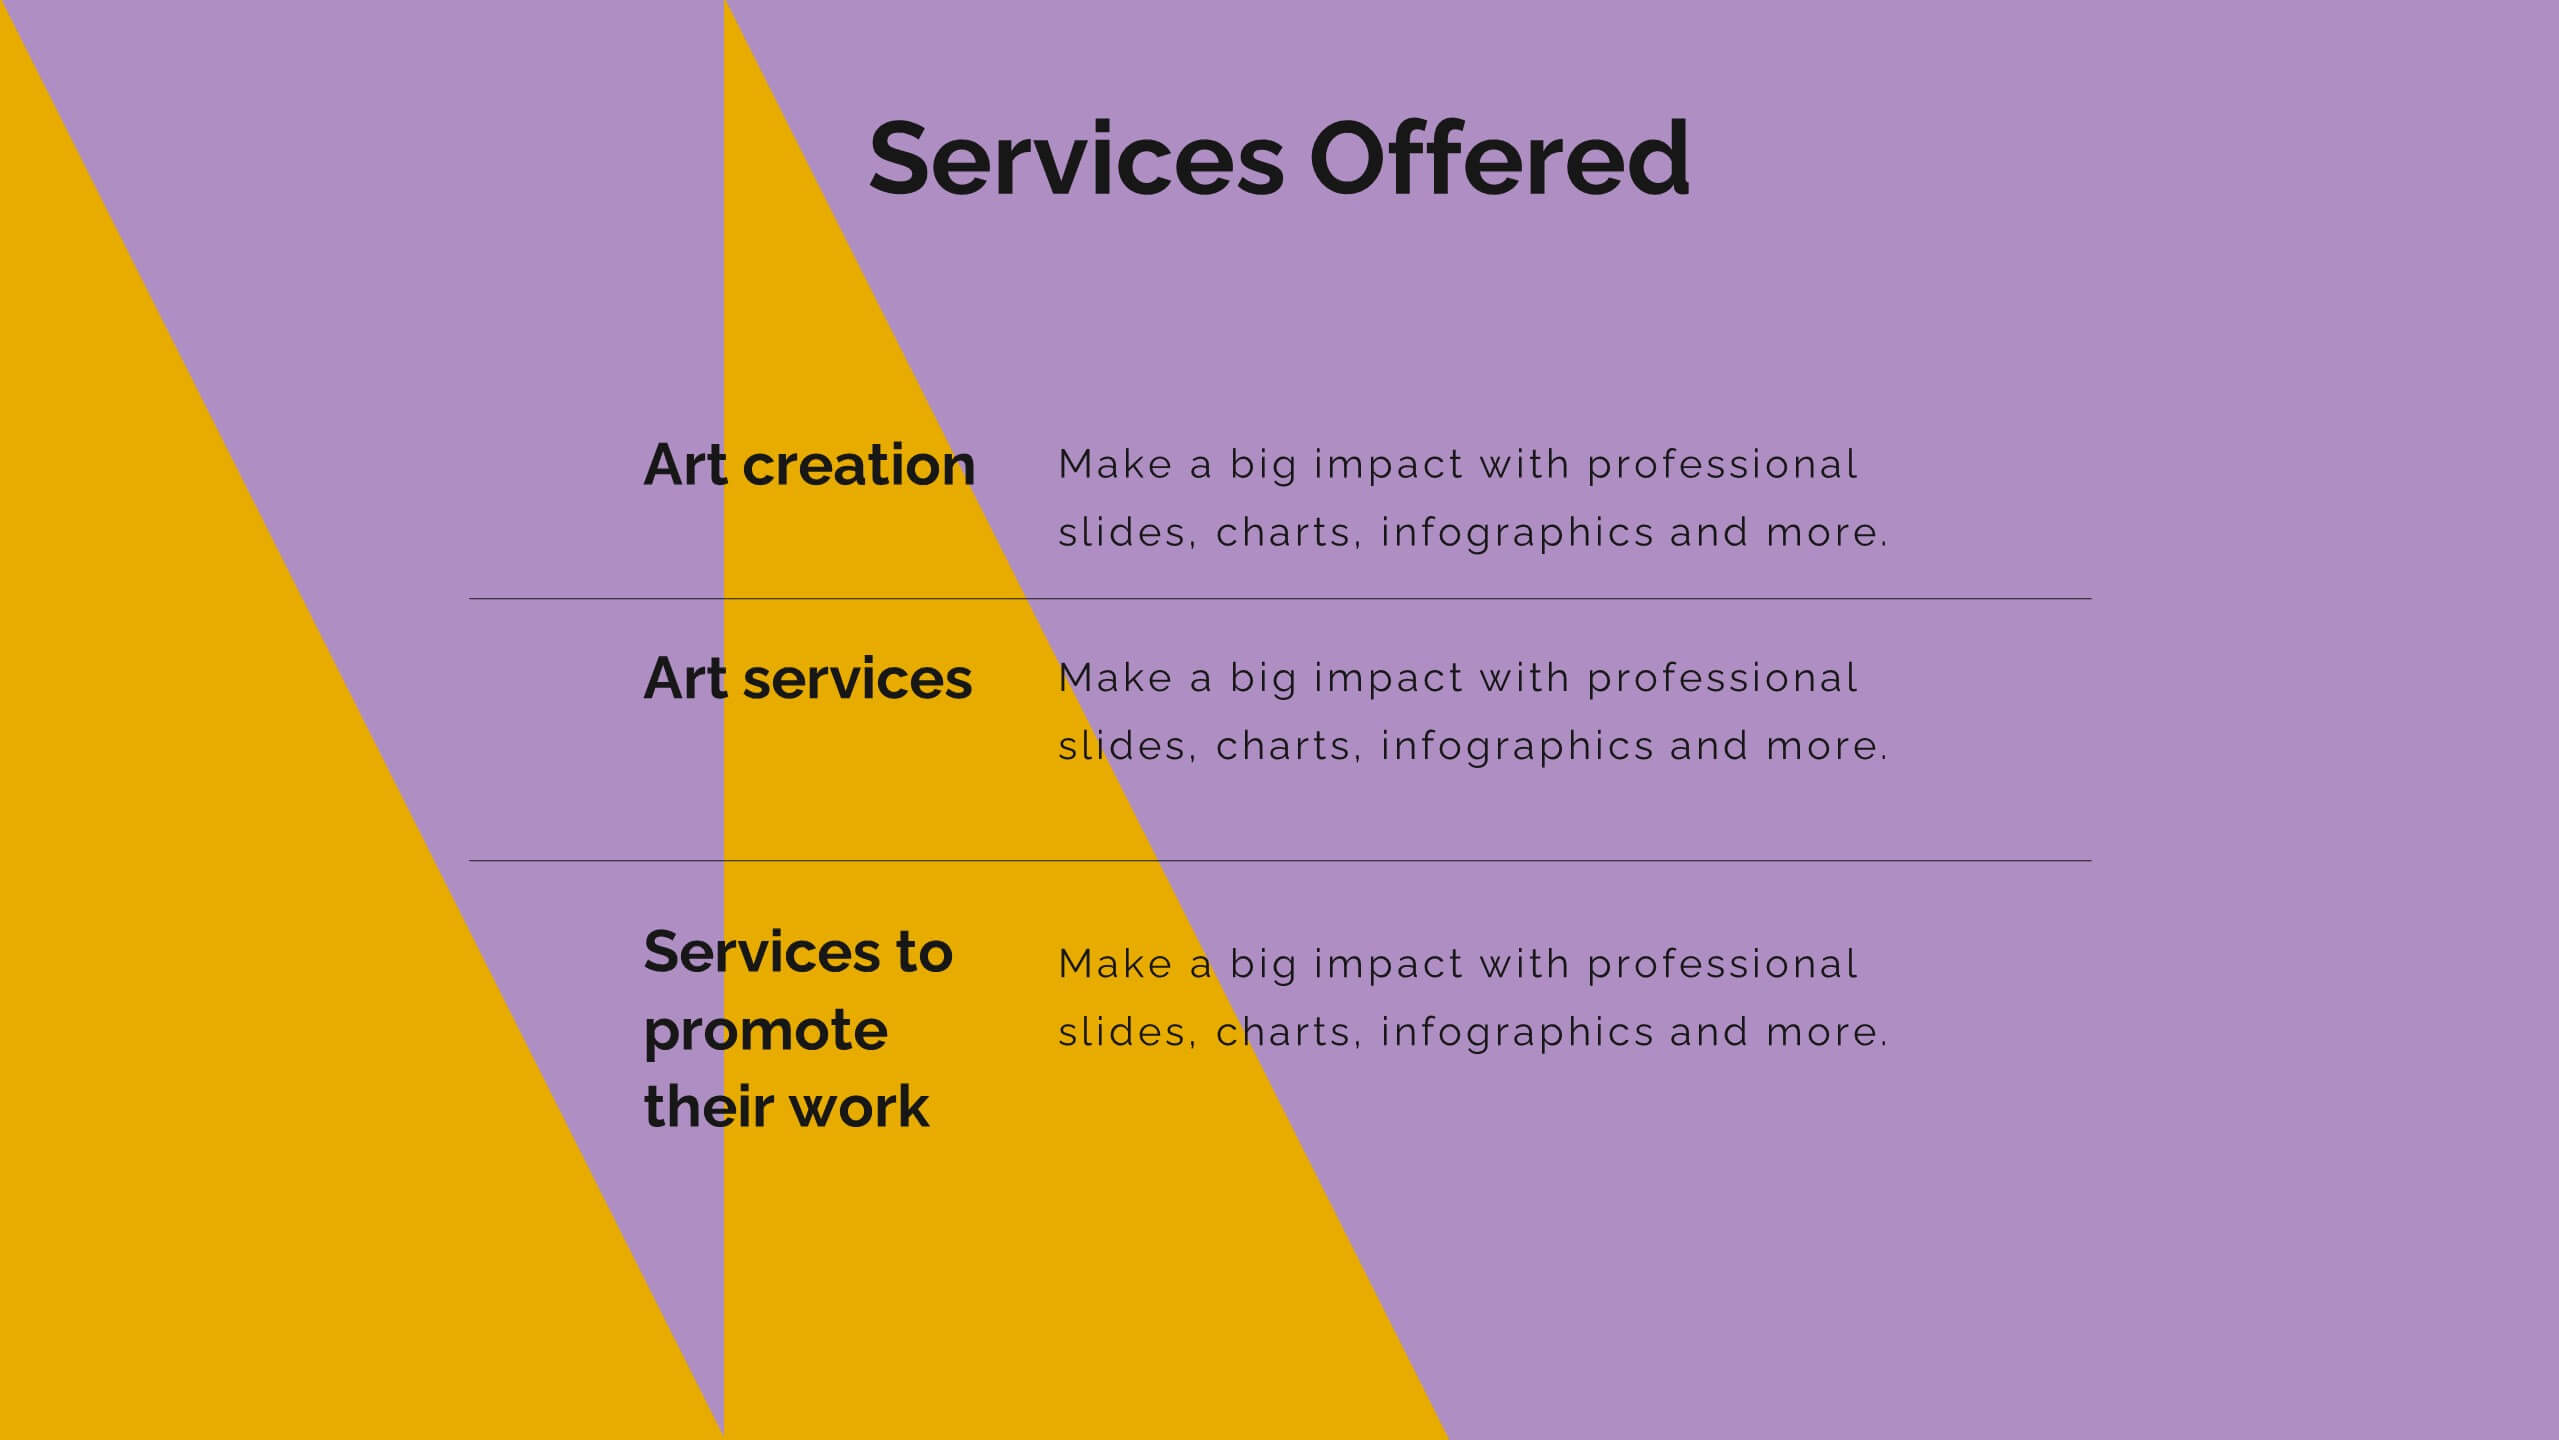
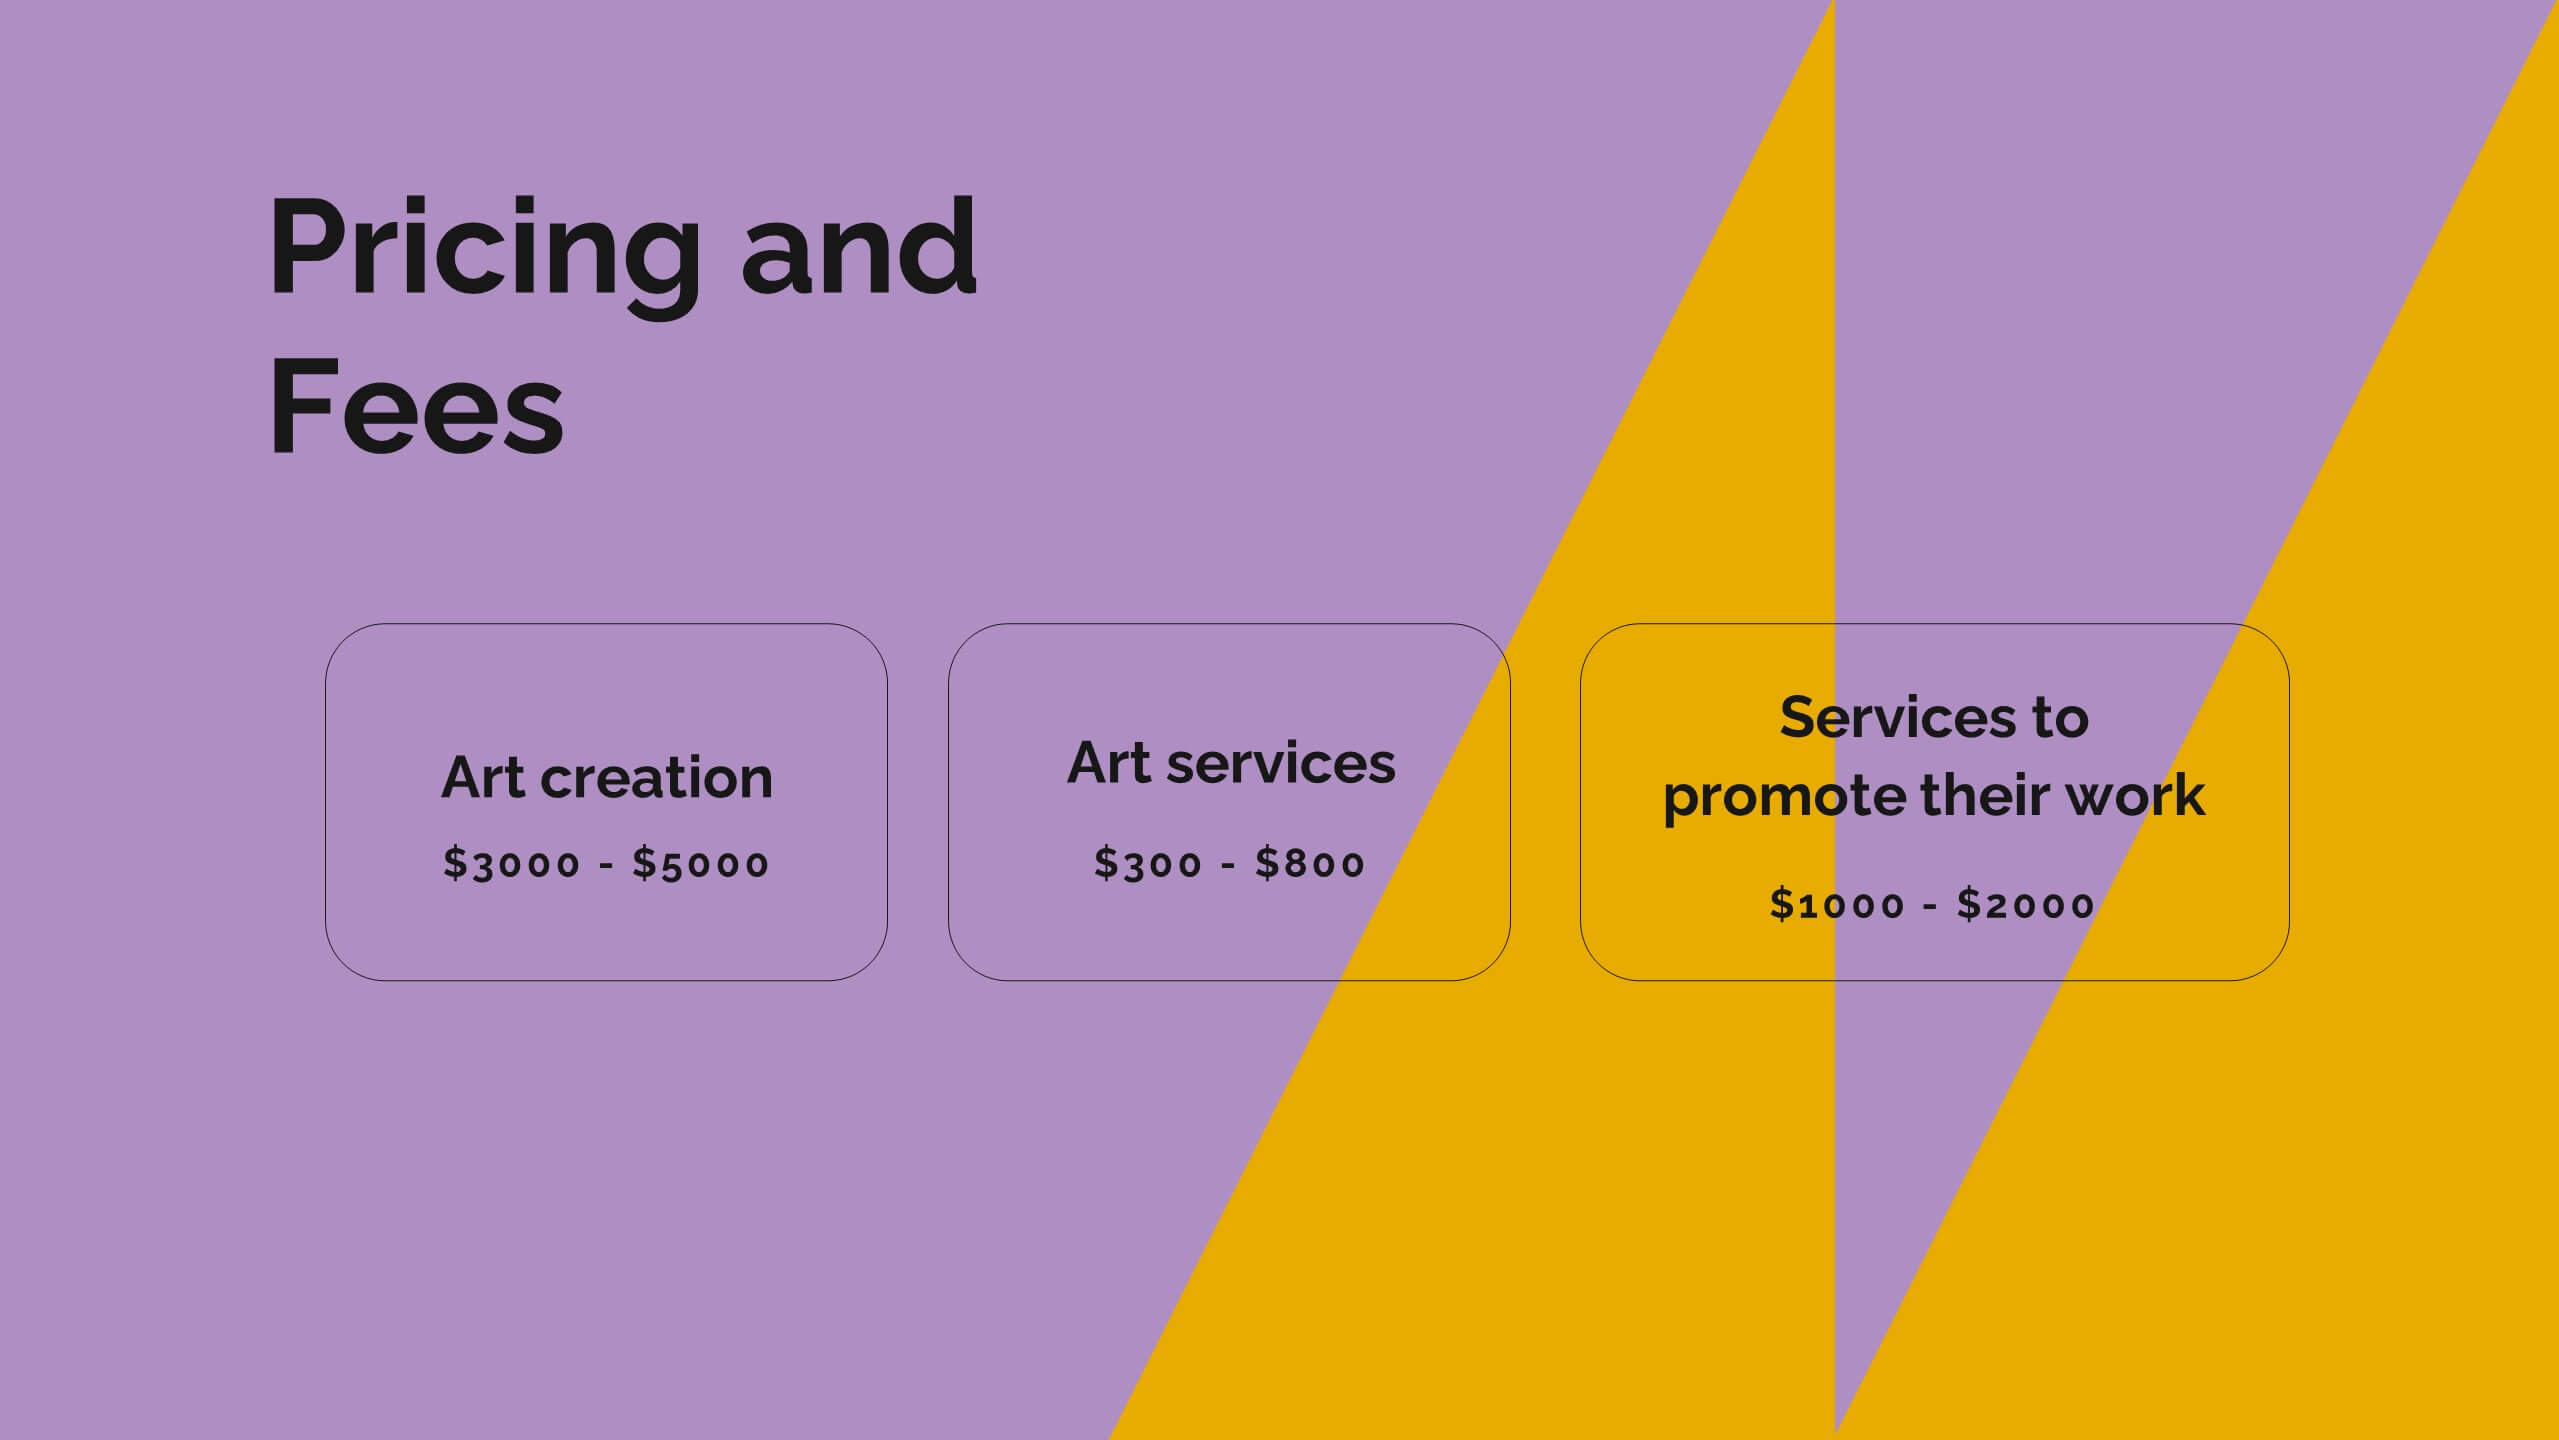
Vortex Artist Portfolio Template Presentation
Showcase your artistic brilliance with this eye-catching portfolio presentation template! Perfect for highlighting your projects, creative process, and awards, it features vibrant slides for your philosophy, collaborations, and client testimonials. Impress potential clients and collaborators with a stunning, well-organized portfolio. Compatible with PowerPoint, Keynote, and Google Slides for seamless presentations on any platform.


21 slides
Flare Creative Portfolio Presentation
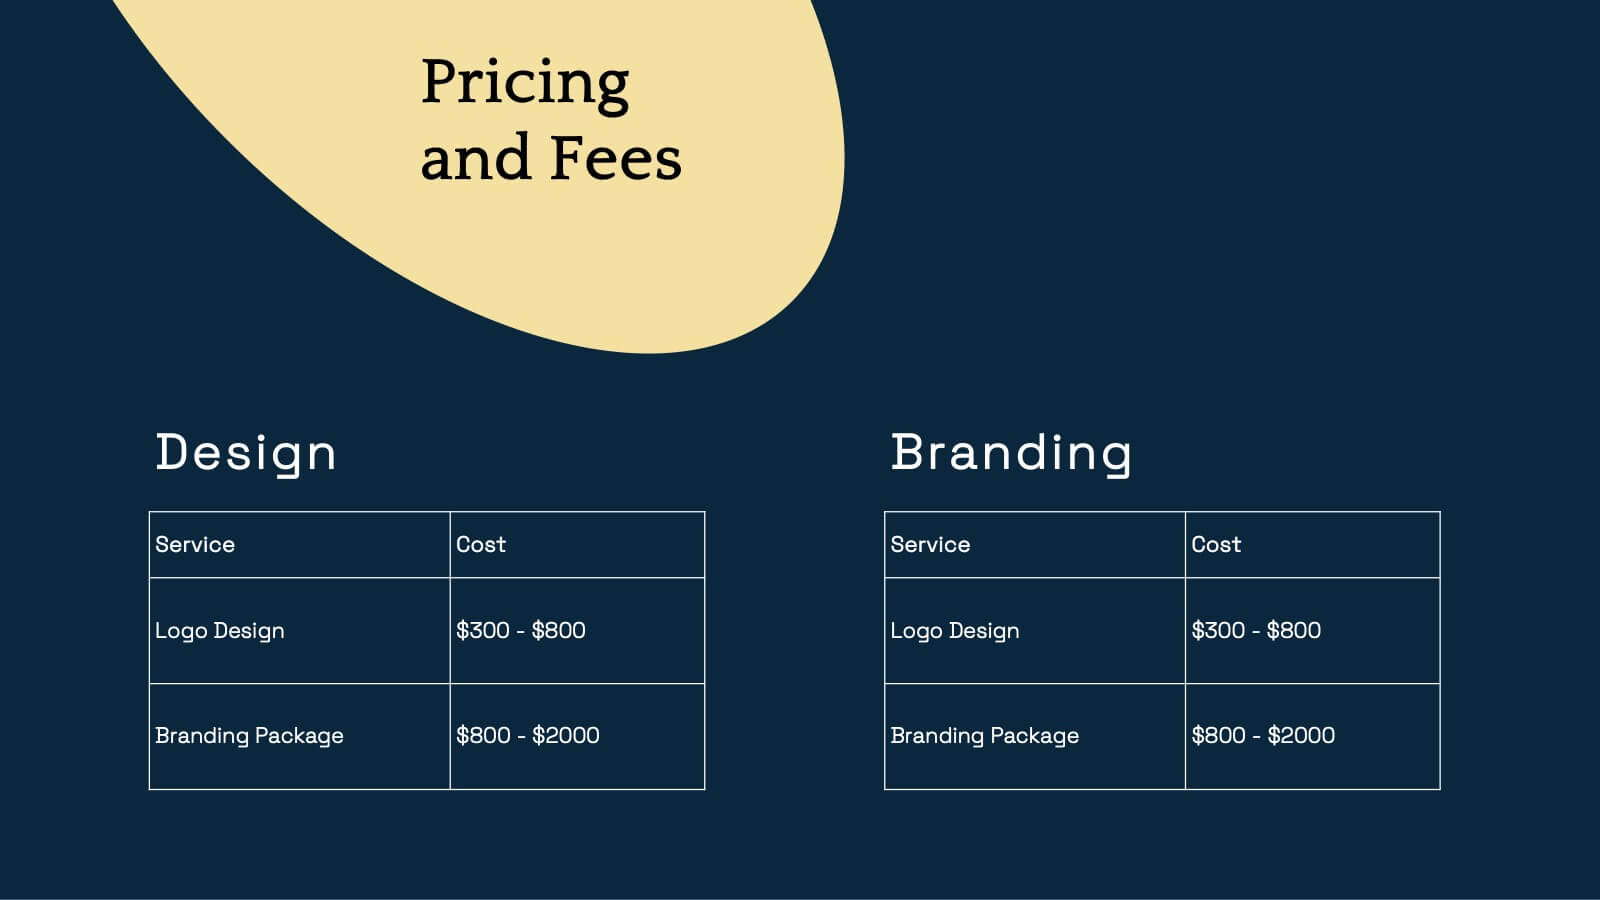
Showcase your creative work with this elegant portfolio template! Perfect for highlighting projects, client testimonials, and services offered. Ideal for artists, designers, and creatives aiming to impress clients and collaborators. Compatible with PowerPoint, Keynote, and Google Slides, this template ensures your portfolio is clear, professional, and visually stunning. Make your work shine!


6 slides
Key Business Milestones Presentation
Showcase your company’s journey with this dynamic and professional presentation design. Perfect for highlighting achievements, key phases, and growth stages, it helps you visualize progress with clarity and impact. Fully editable and compatible with PowerPoint, Keynote, and Google Slides, making milestone storytelling simple and visually compelling.


7 slides
Marketing Strategy Wheel Infographic
Our Marketing Strategy Wheel Infographic is an invaluable asset for marketers, strategists, and business leaders. This visual tool is designed to outline the multi-faceted approach required for a successful marketing strategy, incorporating various elements that contribute to a comprehensive marketing plan. The infographic displays sections like market analysis, goal setting, budget allocation, and action plans in a circular layout, symbolizing the interconnected nature of marketing efforts. By presenting these components, the infographic serves as a guide for developing a balanced and effective marketing strategy. You can tailor this infographic to include specific tactics, channels, and metrics relevant to your organization, making it a versatile tool for internal strategy sessions, client presentations, or marketing education. This SEO-optimized graphic is crafted to communicate complex marketing plans in an accessible and engaging manner. Use our Marketing Strategy Wheel Infographic to visually communicate your marketing plan's structure and components, ensuring a holistic approach to reaching your business objectives.


5 slides
Business Opportunity in Europe Map Presentation
Identify key growth areas across Europe with this clean, data-driven presentation. Highlight business potential using country-based color coding and progress indicators. Perfect for market analysis, investment pitches, or strategic expansion reports. Fully editable and compatible with PowerPoint, Keynote, and Google Slides for effortless customization and professional presentation delivery.


6 slides
Funding Request Project Proposal
Visually communicate your project's financial needs using this tiered Funding Request Project Proposal slide. With a stacked layout ideal for outlining budget categories or funding stages, it’s perfect for grant applications, investor decks, or internal pitches. Fully customizable in PowerPoint, Keynote, and Google Slides.


5 slides
Strategic Roadmap with Milestone Tracks
Chart your progress with clarity using the Strategic Roadmap with Milestone Tracks Presentation. This visual template showcases a dotted milestone path connecting key yearly events or business phases—perfect for illustrating timelines, strategic goals, and transformation journeys. Fully editable in PowerPoint, Keynote, and Google Slides.


4 slides
4-Quadrant SWOT Matrix Presentation
Spark strategic clarity with a bold, visual layout designed to organize strengths, weaknesses, opportunities, and threats in a clean, engaging way. This presentation helps teams analyze key factors, compare insights, and plan smarter with structured guidance. Ideal for business strategy and decision-making. Fully compatible with PowerPoint, Keynote, and Google Slides.


7 slides
Anatomy Infographic Presentation Template
Anatomy infographics are visual representations of the different systems and structures of the human body. They are designed to convey complex information in an easily manner and visually appealing way. Our anatomy template include images, diagrams, and text to provide an overview of the different systems of the human body, such as the skeletal, muscular, and cardiovascular systems. Our template can be used for a variety of purposes, including education, medical training, and patient education. The text, colors and images can be easily modified to suit your needs and preferences!


4 slides
Infrastructure and Construction Industry Presentation
Showcase key developments in the Infrastructure and Construction Industry with this visually structured template. Ideal for project managers, urban planners, and engineers, it highlights construction phases, investment data, and industry insights. Fully customizable and compatible with PowerPoint, Keynote, and Google Slides for seamless integration into your professional presentations.


8 slides
Annual Business Performance Report Presentation
Visualize your company’s progress with the Annual Business Performance Report Presentation. This sleek, data-driven template combines donut charts and bar graphs to showcase KPIs, milestones, and key achievements. Perfect for year-end summaries and stakeholder updates. Fully editable in Canva, PowerPoint, and Google Slides for easy customization and professional results.


6 slides
Six Sigma DMAIC Cycle Overview Presentation
Present each phase of the DMAIC methodology with the Six Sigma DMAIC Cycle Overview Presentation. This clean and professional layout walks through Define, Measure, Analyze, Improve, and Control in a clear, easy-to-follow structure. Perfect for Six Sigma professionals, quality managers, and operational teams. Fully editable in Canva, PowerPoint, Keynote, and Google Slides.


6 slides
Academy Sports Infographic
Sports are physical activities or games that involve individual or team competition and are typically governed by specific rules. This infographic template highlights key aspects of sports and physical activities in an academy setting. Whether it's a school sports program, a community sports academy, or a professional training institute, this infographic provides a comprehensive overview of the benefits, programs, and facilities offered by an academy sports institution. This template is compatible with Powerpoint, Keynote, and Google Slides making it easy to navigate and can be easily customized to fit your presentation needs.