


Features
- 8 Unique slides
- Fully editable and easy to edit in Microsoft Powerpoint, Keynote and Google Slides
- 16:9 widescreen layout
- Clean and professional designs
- Export to JPG, PDF or send by email


Do you have any questions?
Recommend


6 slides
Onboarding 30-60-90 Day Roadmap Presentation
Get your team excited from day one with this colorful, easy-to-follow visual layout! This presentation template helps clearly map out onboarding goals and key activities across 30, 60, and 90 days. Perfect for HR professionals and team leads, it's fully editable and works with PowerPoint, Keynote, and Google Slides.


10 slides
National Distribution Network in the US Presentation
Present your logistics strategy with clarity using the National Distribution Network in the US Presentation. This slide visually maps out your key distribution hubs across the country, pairing each location with a numbered label and space for insights or logistics data. Ideal for supply chain overviews, retail operations, or partner briefings. Fully editable in Canva, PowerPoint, and Google Slides.


7 slides
Organizational Structure with 7S Model Presentation
Bring your organizational framework to life with a clean, modern layout that makes complex relationships easy to understand. This presentation helps you explain key elements, show how they connect, and guide strategic discussions with clarity and structure. Fully editable and compatible with PowerPoint, Keynote, and Google Slides.


10 slides
Key Business Insights Executive Summary Presentation
Showcase your strategic insights effectively with the 'Key Business Insights Executive Summary' template. This visually appealing tool highlights critical data points and metrics, enabling a clear presentation of business achievements and forecasts. Perfectly tailored for use in PowerPoint, Keynote, and Google Slides, it ensures your executive summaries are both comprehensive and compelling.


12 slides
Market Research Data Insights Presentation
Gain Valuable Market Insights! The Market Research Data Insights Presentation is designed to help businesses analyze trends, customer behavior, and competitive landscapes. Featuring a structured circular layout, this template ensures data is easy to interpret and present. Fully customizable and compatible with PowerPoint, Keynote, and Google Slides for seamless editing.


5 slides
Insurance Policy Structure Presentation
Add a touch of creativity to your financial reports with this clean and modern presentation design. Perfect for explaining coverage breakdowns, risk management strategies, or policy frameworks, it simplifies complex ideas through visuals. Fully editable and compatible with PowerPoint, Keynote, and Google Slides for a seamless presentation experience.


8 slides
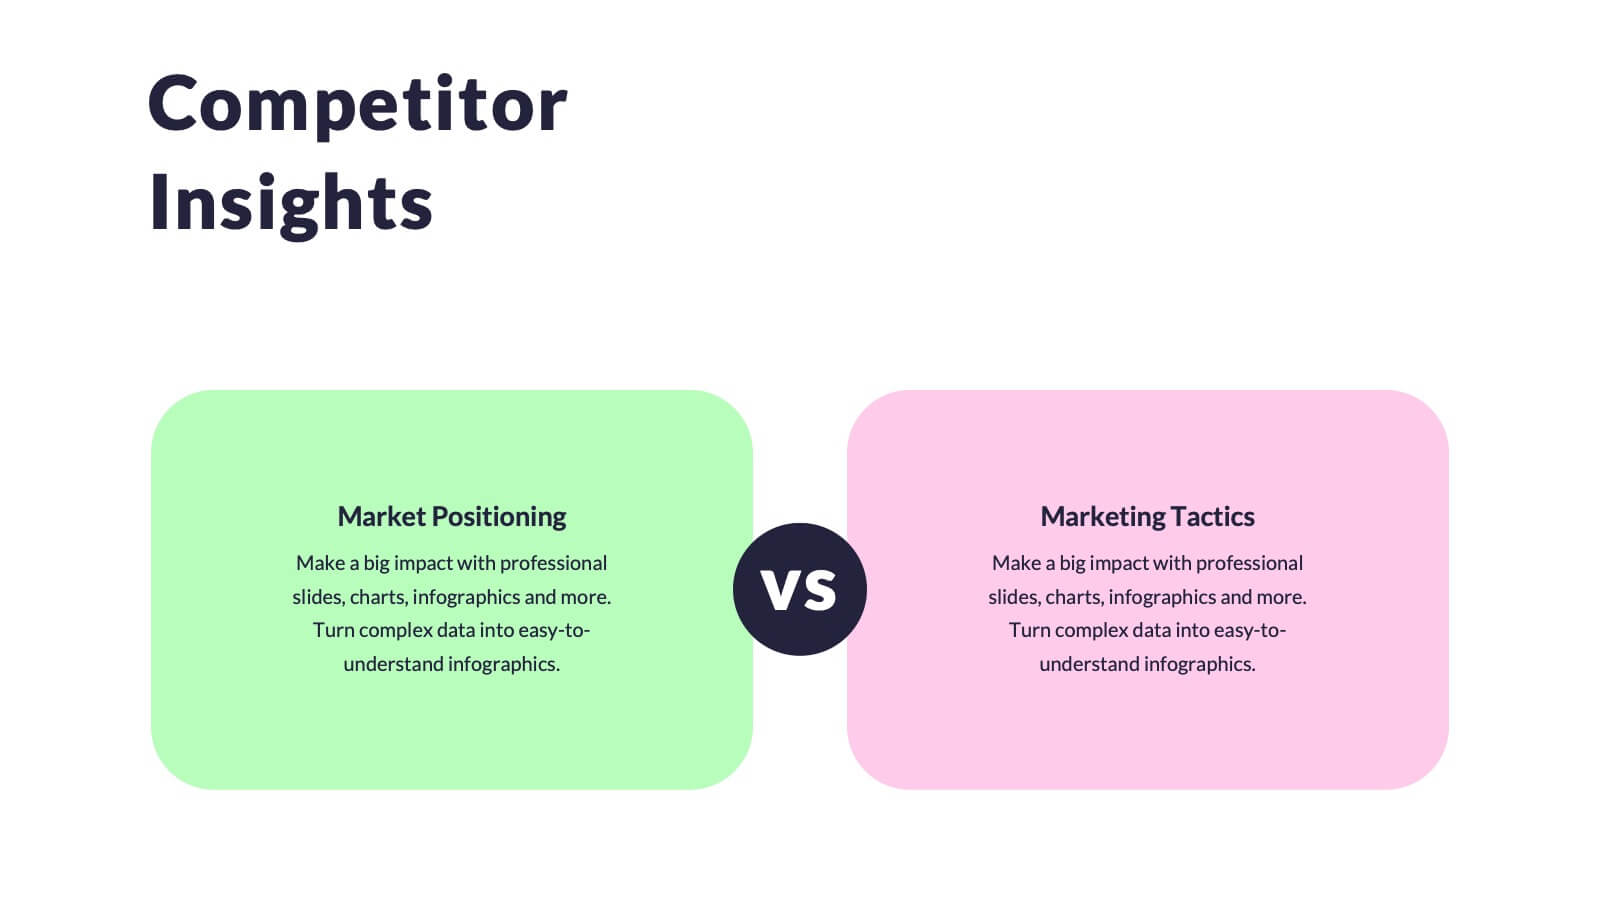
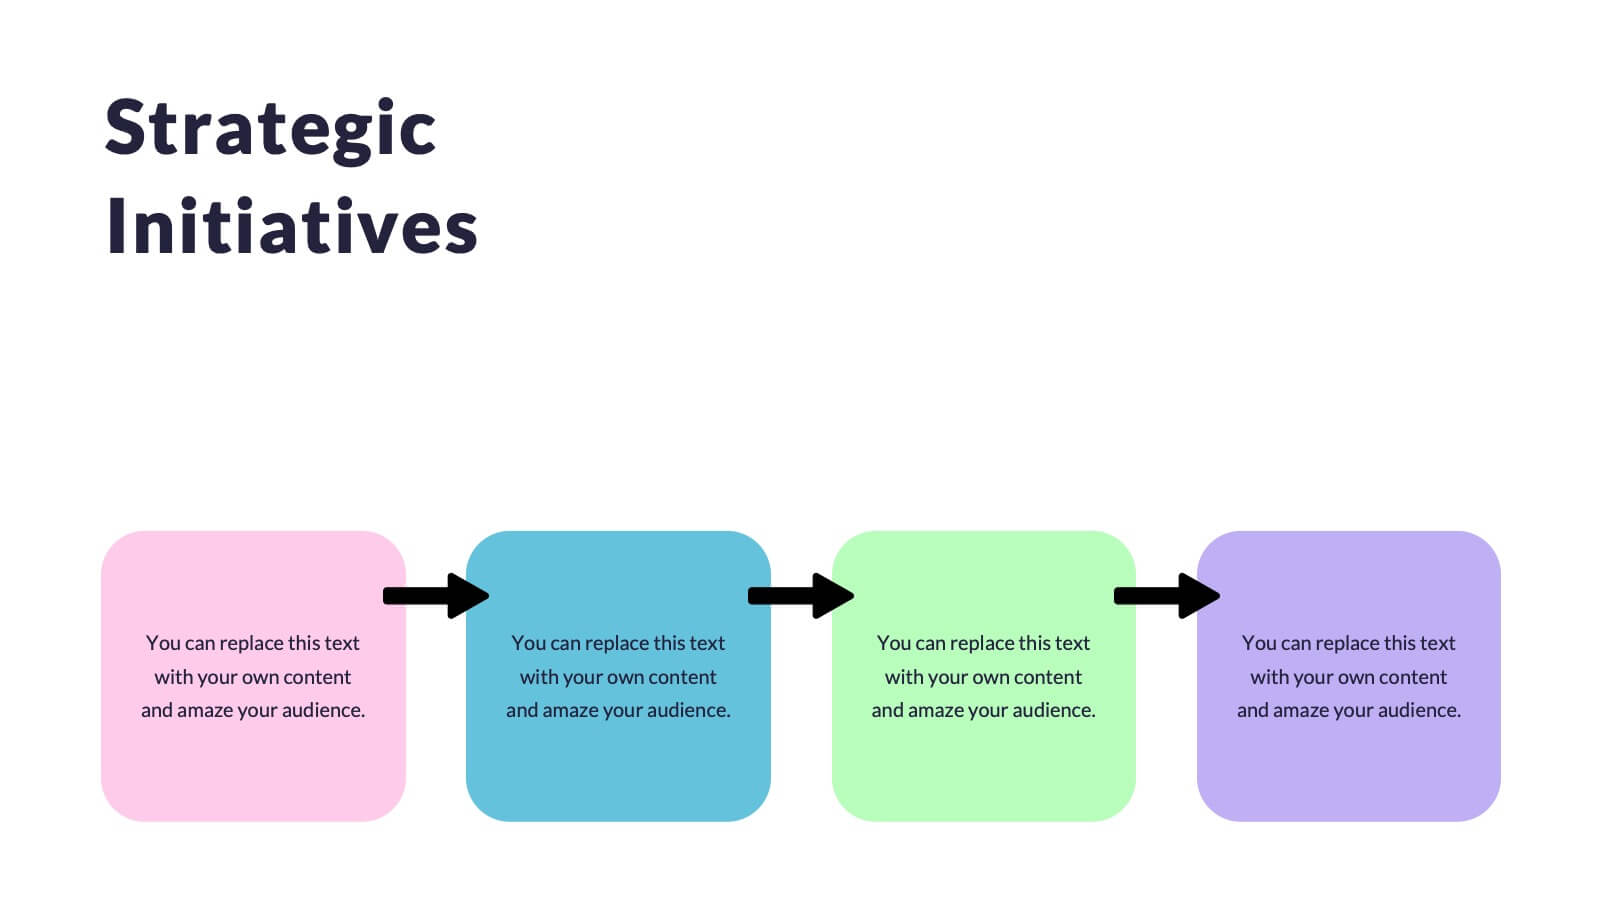
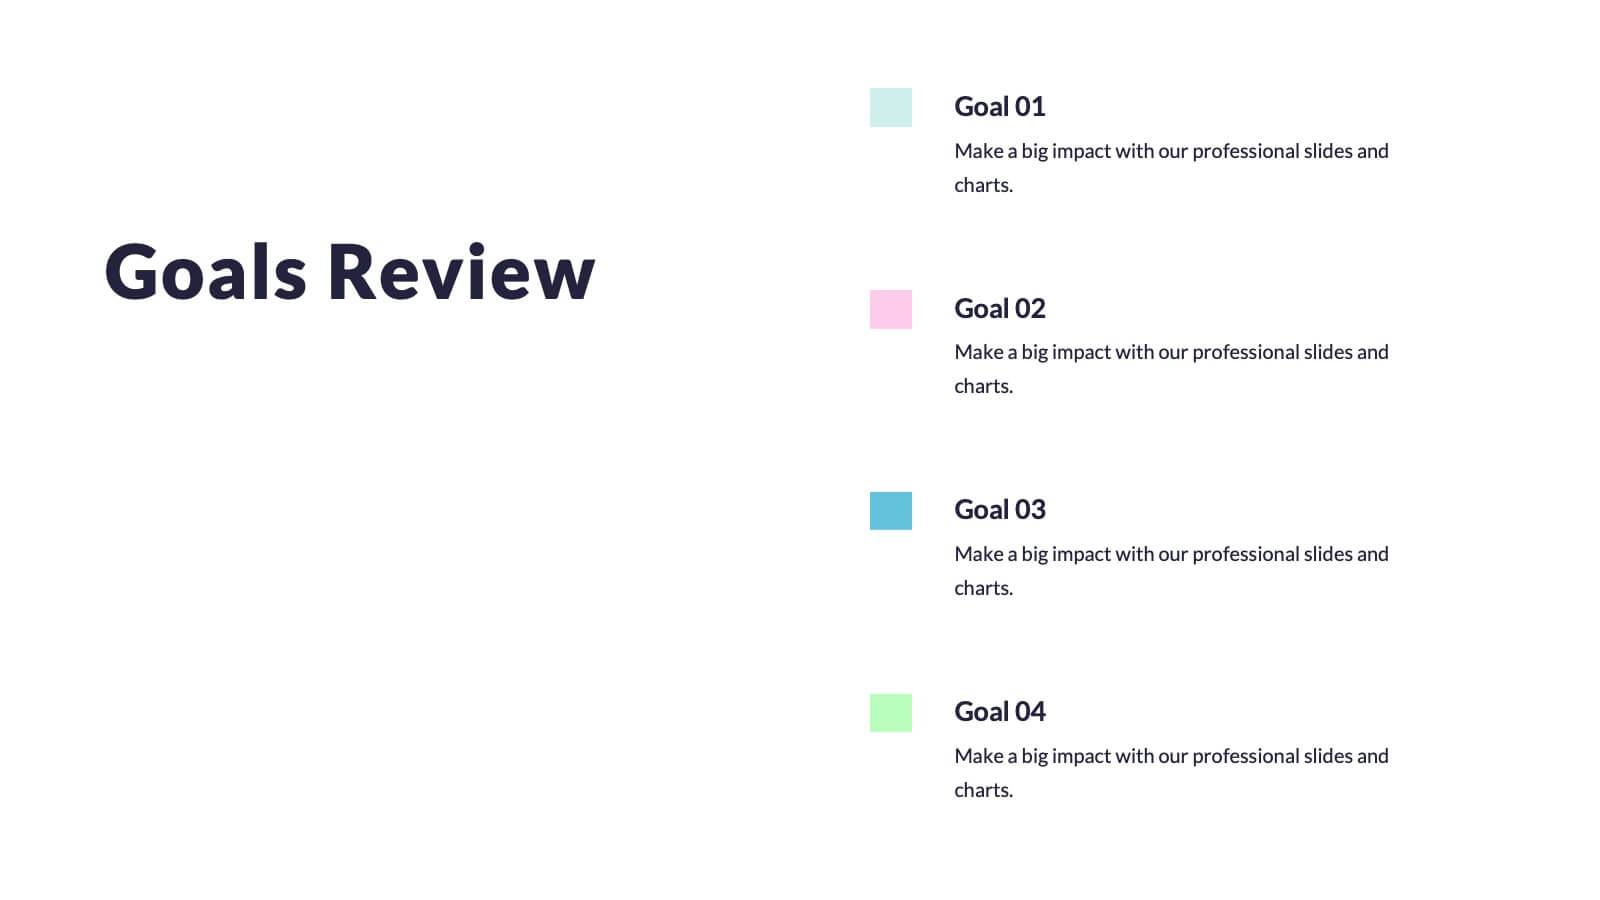
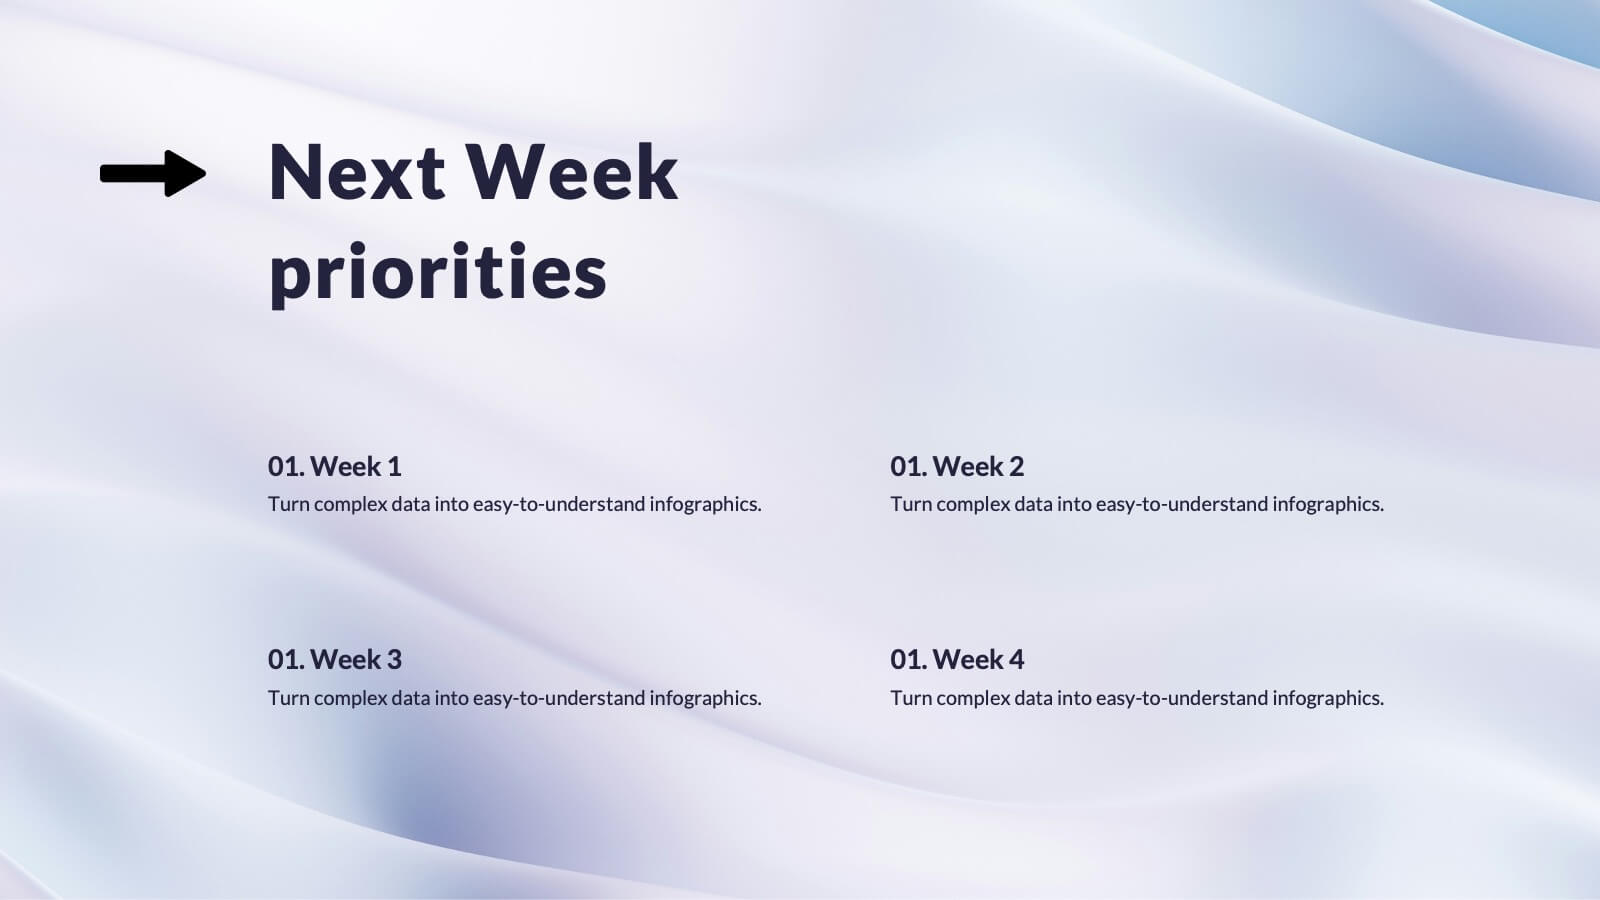
Value Creation Strategy
Present your strategic pillars with clarity using this linear, milestone-style layout. Ideal for business consultants, growth strategists, and product teams aiming to showcase value drivers, innovation stages, or competitive differentiators. Fully editable in PowerPoint, Keynote, and Google Slides—customize icons, colors, and text for a branded, professional finish.


22 slides
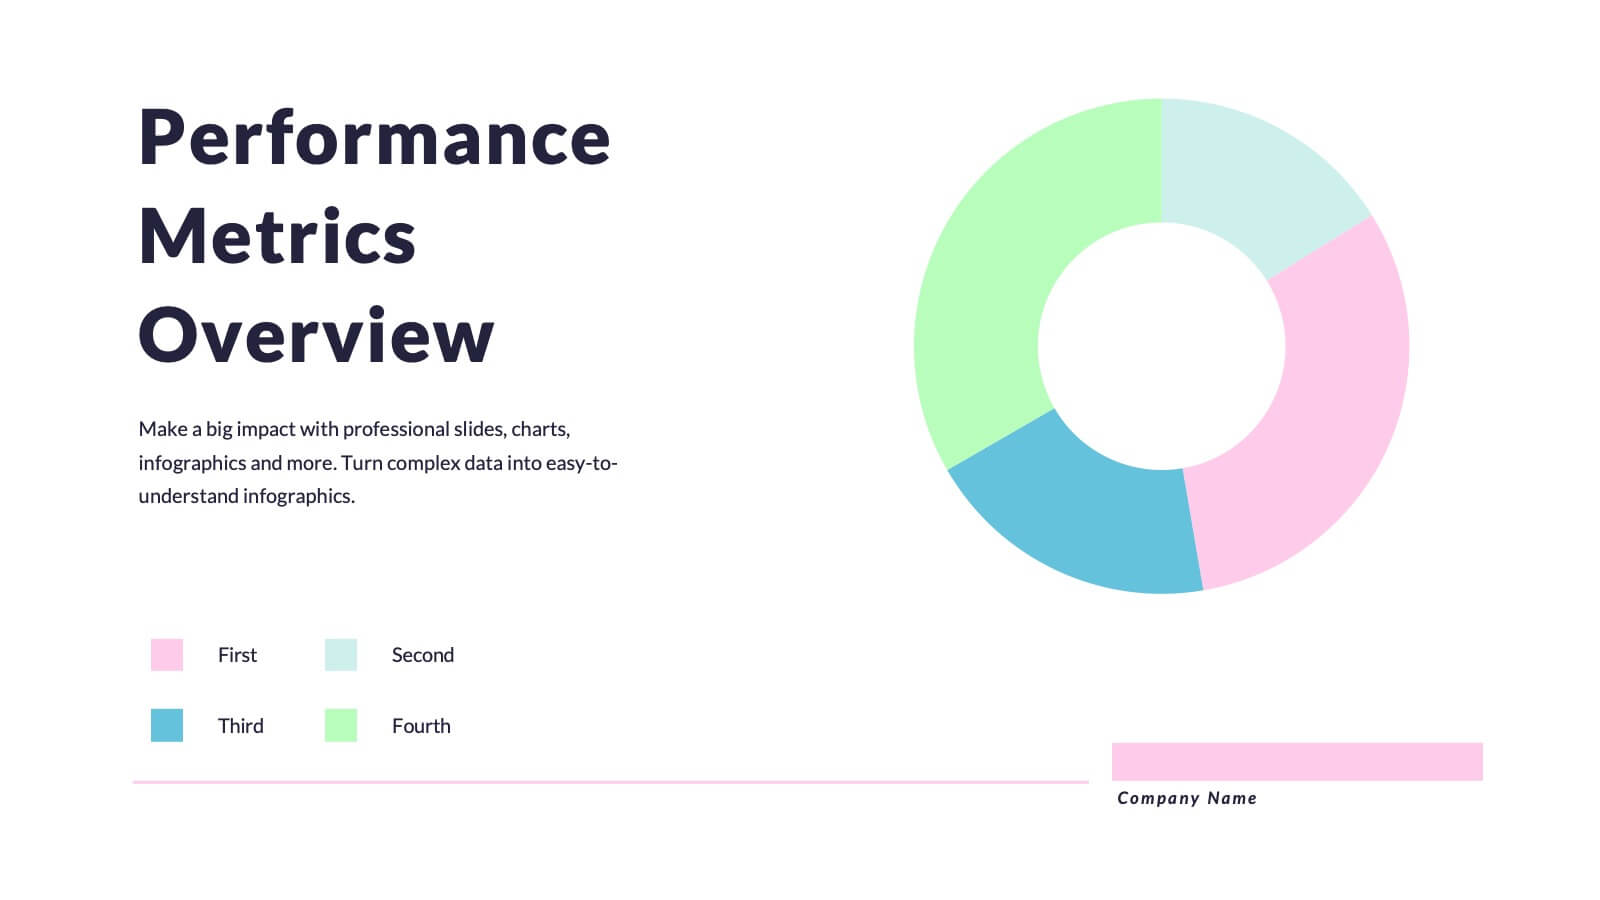
Quantum Research Findings Report Presentation
Discover insights like never before with this vibrant presentation template! Perfect for showcasing research findings, it includes slides for key findings, performance metrics, and market trends. Clearly present data and engage your audience with visually appealing graphics. Compatible with PowerPoint, Keynote, and Google Slides, making it easy to use on any platform.


4 slides
Daily Time Planning and Scheduling Presentation
Stay organized and maximize productivity with this Daily Time Planning and Scheduling template. Featuring a structured hourly schedule, task folders for tomorrow’s plans and to-do lists, and a dedicated notes section, this slide is designed for professionals, students, and busy individuals. Customize effortlessly to track daily tasks, set priorities, and manage time effectively. Fully compatible with PowerPoint, Keynote, and Google Slides for seamless integration.


21 slides
Starchime UX Case Study Presentation
Showcase your UX design process with this case study template, covering research, user journey mapping, wireframes, and usability testing. Ideal for presenting design insights and outcomes. Compatible with PowerPoint, Keynote, and Google Slides, it’s perfect for a clear, professional, and impactful UX design presentation.


7 slides
Loves Travel Infographic Presentation
Travel is an opportunity to get out of our comfort zones and be inspired to try new things, it changes our perspective on the world. Use this template to give your audience an overview of a trip and prepare them for what they will be experiencing. This template features an infographic style design, with plenty of room to describe the locations and activities as well as instructions and tips. Build your own infographic with this template, and add it to your presentations. You can easily add your own content in PowerPoint, Keynote, or Google slides and turn it into a fun presentation in minutes.


5 slides
Large Scale Data Insights Presentation
A clean, modern slide that makes complex information feel surprisingly easy to explain, this layout helps you break down large-scale data in a way your audience can instantly understand. Use it to outline key insights, visualize processes, or highlight system components. Fully compatible with PowerPoint, Keynote, and Google Slides.


4 slides
Healthcare Procedure and Diagnosis Presentation
Simplify medical communication with the Healthcare Procedure and Diagnosis Presentation. Featuring clean visuals like syringes, hearts, and med kits, this layout is ideal for outlining treatment stages, clinical processes, or patient care steps. Perfect for hospitals, clinics, or healthcare startups. Fully editable in PowerPoint, Keynote, Google Slides, and Canva.


7 slides
Customer Journey Stages Infographic Presentation
A Customer Journey consists of a series of interactions that occur over time between your company and the customer. Our template uses a colorful color scheme and style to present a customer journey. This communicates how the customer moves through their process. The layout allows you to customize each text box with your own text. The stages are color coded, making it easy for you to identify them. This template is designed to provide the most up-to-date research and analytical data so you can effectively engage and connect with your audience. Capture your customer's journey with this template!


7 slides
Harvey Ball Charts Infographic
A Harvey Ball is a simple, round graphic used for visual representation and communication of qualitative information. This infographic template harnesses the power of Harvey Balls, those simple yet potent icons, to convey information and insights in a visually striking manner. Highlight strategies to engage the audience effectively using Harvey Balls. Fully customizable and compatible with Powerpoint, Keynote, and Google Slides. This infographic allows you to explore the ability to customize Harvey Balls, varying in size, color, and style to suit your unique data representation needs.


5 slides
Nonprofit Organizations Infographics
Nonprofit Organizations are organizations that are established to pursue a particular social cause or provide a service that benefits the public, rather than generate a profit. These infographic templates are designed to visually present information about nonprofit organizations. They feature bright, colorful and engaging designs with icons and illustrations that represent different aspects of nonprofit organizations, such as fundraising, volunteers, and social impact. The template includes customizable graphs and text boxes to allow users to easily present data about nonprofits, including their structure, goals, impact, and funding sources.


4 slides
3-Step Supply Chain and Logistics Planning Presentation
Bring your workflow to life with a clean three-stage visual that makes your process feel fast, simple, and smart. This slide helps explain planning steps, logistics timelines, and supply chain actions in a way that’s easy for any audience to follow. Fully compatible with PowerPoint, Keynote, and Google Slides.