


Features
- 5 Unique slides
- Fully editable and easy to edit in Microsoft Powerpoint, Keynote and Google Slides
- 16:9 widescreen layout
- Clean and professional designs
- Export to JPG, PDF or send by email


Do you have any questions?
Recommend


6 slides
How to Master Time Management Presentation
Make every minute count with this sleek and dynamic template built to visualize productivity, efficiency, and planning. Perfect for showcasing workflows, priorities, or time allocation, it helps communicate structure with clarity and style. Fully customizable and compatible with PowerPoint, Keynote, and Google Slides for effortless editing and presentation.


4 slides
Effective Team Management Presentation
Present your management insights with clarity using this puzzle-style Effective Team Management template. Ideal for breaking down leadership functions, collaboration elements, or role responsibilities across four segments. The modular puzzle format adds a creative visual touch while staying professional. Fully editable in PowerPoint, Keynote, and Google Slides.


22 slides
Quantum Research Findings Report Presentation
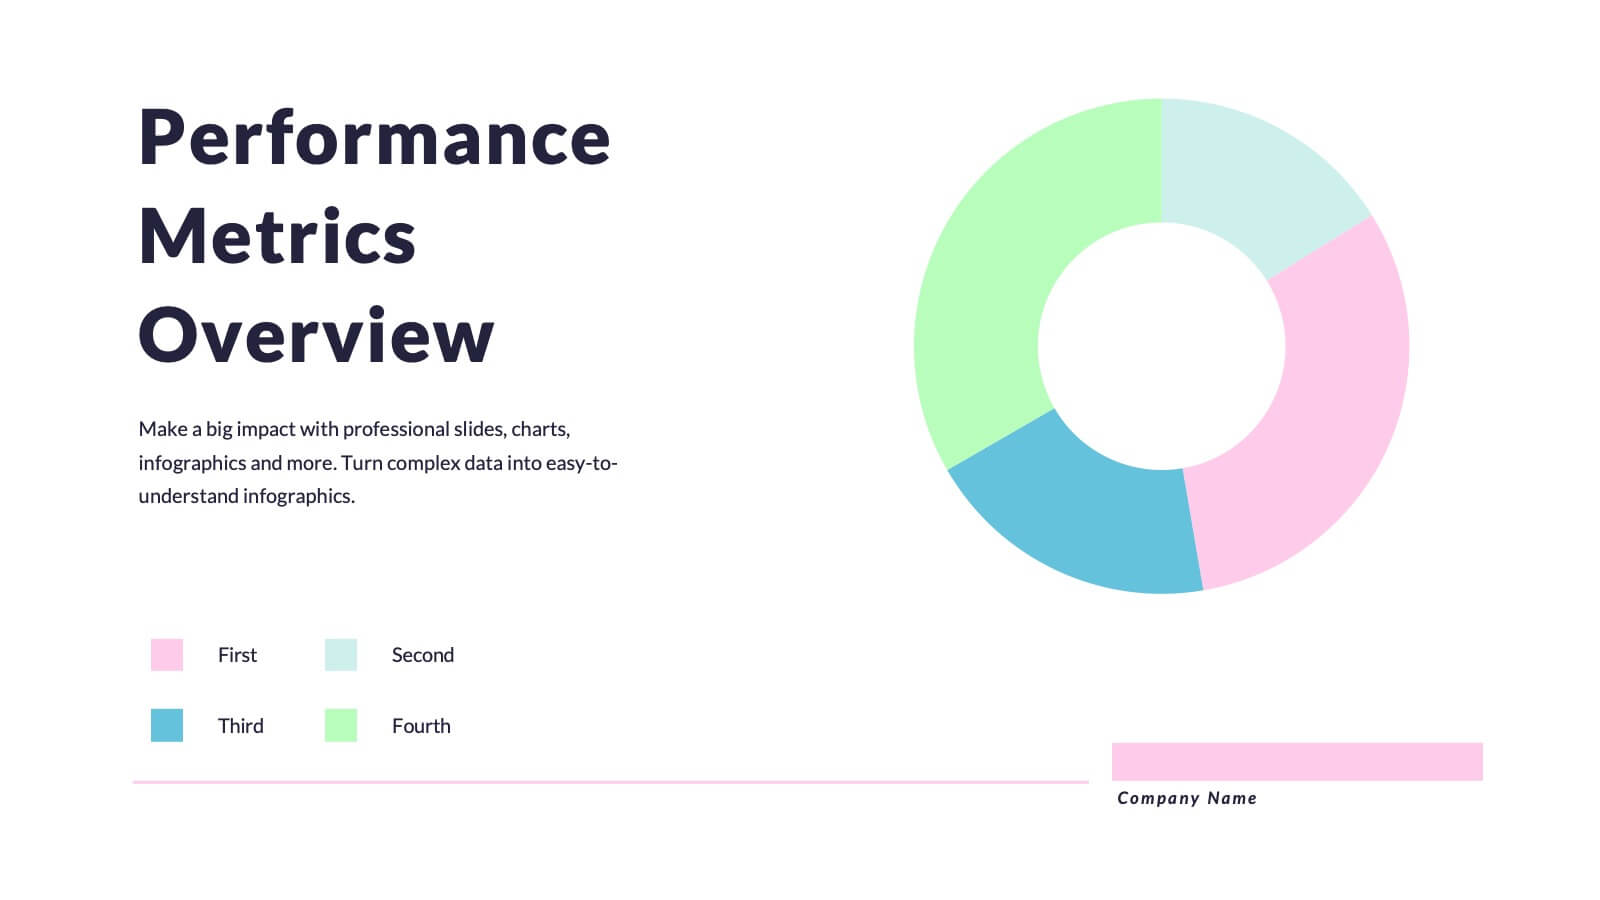
Discover insights like never before with this vibrant presentation template! Perfect for showcasing research findings, it includes slides for key findings, performance metrics, and market trends. Clearly present data and engage your audience with visually appealing graphics. Compatible with PowerPoint, Keynote, and Google Slides, making it easy to use on any platform.


6 slides
Aviation Safety and Efficiency Presentation
Take your audience to new heights with this modern aviation-themed infographic layout. Perfect for illustrating flight performance, safety systems, and operational improvements, it combines clarity with sleek visual flow to enhance understanding. Fully customizable and compatible with PowerPoint, Keynote, and Google Slides for effortless professional presentations.


5 slides
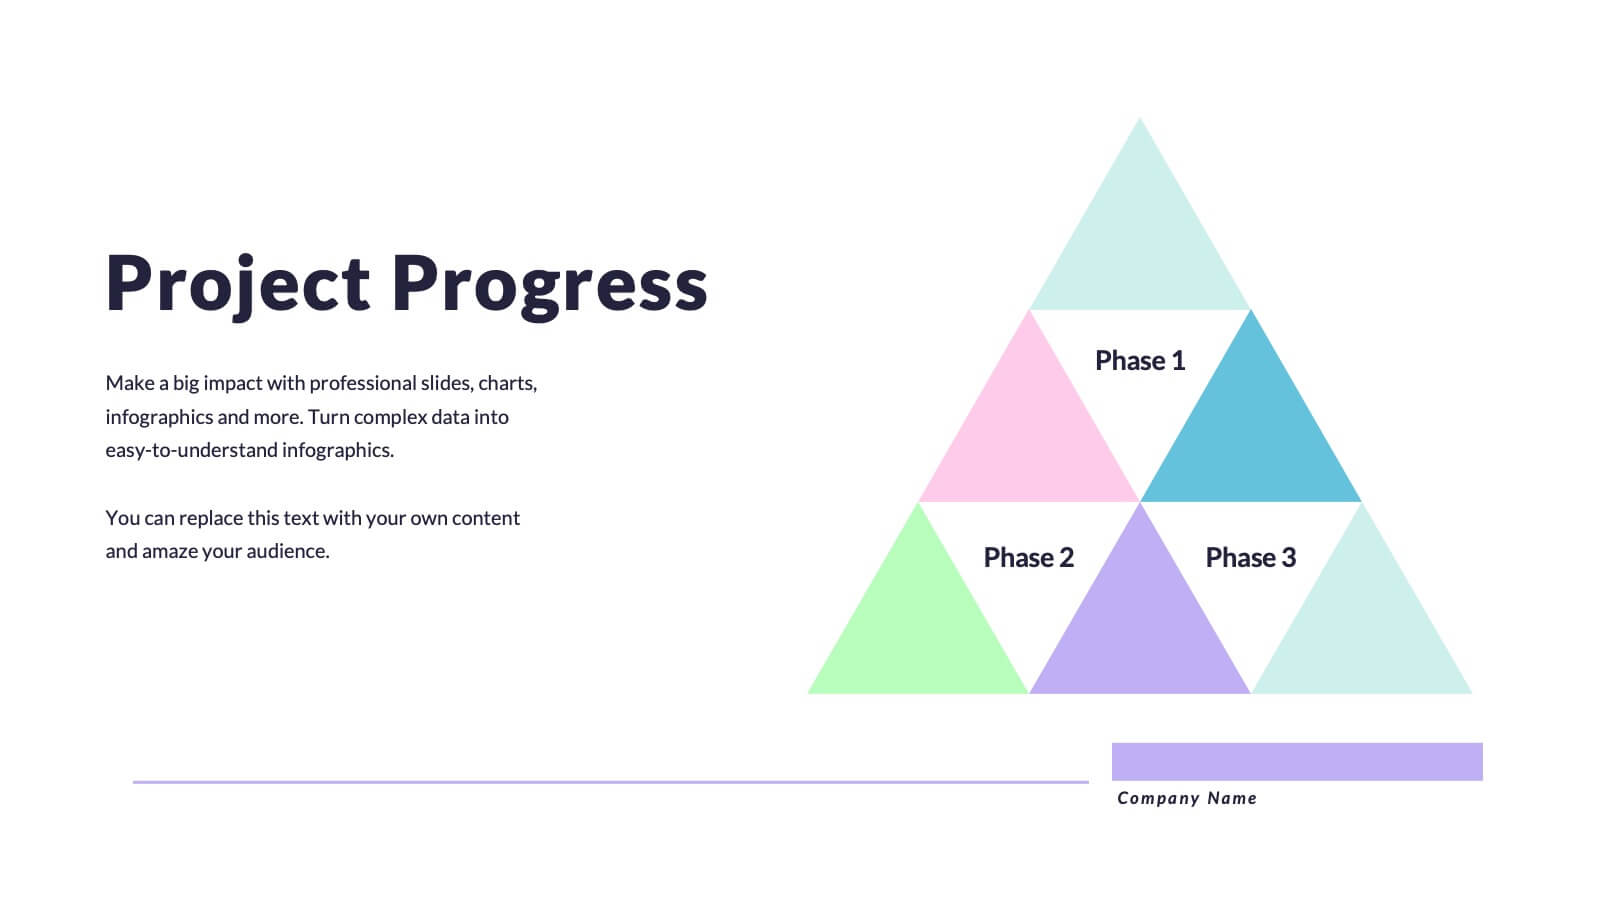
Scalability Metrics for Business Growth Presentation
Visualize business growth stages with this tiered pyramid-style slide. Each layer highlights key performance metrics with editable percentage labels, perfect for scaling strategies or KPI reports. Simple, structured, and impactful—ideal for business planning, team briefings, or investor updates. Fully customizable in PowerPoint, Keynote, and Google Slides for seamless editing.


6 slides
Market Structure Infographics
Explore market structure effectively with our Market Structure infographic template. This template is fully compatible with popular presentation software like PowerPoint, Keynote, and Google Slides, allowing you to easily customize it to illustrate and communicate various aspects of market structures. The Market Structure infographic template offers a visually engaging platform to explain different types of market structures, including perfect competition, monopolistic competition, oligopoly, and monopoly. Whether you're a student, economist, business professional, or anyone interested in economics and market dynamics, this template provides a user-friendly canvas to create informative presentations and educational materials. Deepen your understanding of market structure with this SEO-optimized infographic template, thoughtfully designed for clarity and ease of use. Customize it to showcase the characteristics, examples, and implications of each market structure, ensuring that your audience gains valuable insights into how markets function. Start crafting your personalized infographic today to explore the world of market structure in economics.


6 slides
Business Strategy Wheel Presentation
Bring your ideas full circle with this dynamic and colorful presentation design. Perfect for illustrating key strategies, continuous improvement cycles, or interconnected business concepts, it transforms complex processes into simple, engaging visuals. Fully customizable and compatible with PowerPoint, Keynote, and Google Slides for effortless editing and professional presentation.


5 slides
Health Awareness Campaign Presentation
Bright and uplifting, this slide brings awareness to important health causes through a clean ribbon-focused layout that’s easy to read and visually engaging. It helps present key messages, statistics, or campaign steps clearly while keeping the design calm and supportive. Fully compatible with PowerPoint, Keynote, and Google Slides.


4 slides
Economic Trends and Analysis of North America Map Presentation
Present key regional insights with this North America economic analysis map. Compare up to four locations using percentage stats and customizable titles. Ideal for showcasing market trends, financial metrics, or growth data. Fully editable in PowerPoint, Keynote, and Google Slides—perfect for economic forecasts, business reports, or strategy meetings.


3 slides
Financial Planning and Budget Forecast Presentation
Present your financial goals with clarity using the Financial Planning and Budget Forecast Presentation. This modern, minimalist layout helps you break down percentage allocations, forecast future spending, and visualize budget insights with eye-catching graphics. Perfect for finance teams, startups, and consultants. Fully customizable in PowerPoint, Google Slides, Keynote, and Canva.


26 slides
Company Profile Geometric Presentation
A company profile is a document or presentation that provides an overview of a business or organization. This presentation template serves as a marketing tool to showcase the company's strengths, capabilities, products, history, and achievements. Use this template to effectively showcases your company's identity, values, and services. The presentation is designed to leave a lasting impression on potential clients, partners, investors, and stakeholders. With its clean lines and geometric elements, the template exudes a sense of sophistication and contemporary style. Compatible with Powerpoint, Keynote, and Google Slides.


5 slides
Brain Chemistry Infographics
Brain chemistry refers to the complex interplay of chemicals, also known as neurotransmitters, that are responsible for transmitting signals within the brain. These infographic templates are designed to illustrate the intricate workings of brain chemistry. They aim to explain complex concepts in a clear and engaging way, making it suitable for educational settings, psychology courses, neuroscience presentations, or any context where understanding brain chemistry is essential. These templates set the foundation for exploring various aspects of brain chemistry. Colorful illustrations and icons help visualize the neurotransmitters and their impact.


6 slides
SEO Services Infographic
Search Engine Optimization services are specialized strategies and practices aimed at improving a website's visibility and ranking in search engine results pages. The goal of SEO is to increase organic traffic to a website by optimizing various elements, such as content, keywords, website structure, and more. This template is designed to provide an overview of the different aspects of SEO that the agency specializes in. This Infographic is a valuable tool for SEO agencies to showcase their expertise, services, and track record to potential clients. This template is compatible with Powerpoint, Keynote, and Google Slides.


4 slides
Financial Budget Forecasting Presentation
Predict and manage your financial future with our 'Financial Budget Forecasting' template, perfect for visualizing quarterly budget allocations and expectations. This versatile tool aids in creating clear, concise, and visually engaging financial presentations, and is compatible with PowerPoint, Keynote, and Google Slides, making it a must-have for finance professionals and budget planners.


4 slides
Investment Analysis Finance Presentation
Target your financial insights with this Investment Analysis Finance Presentation. Designed with a bold bullseye diagram and four labeled pointers, this slide helps communicate core focus areas, ROI, risk zones, or asset distribution. Ideal for pitch decks, portfolio reviews, and financial reports. Fully editable in PowerPoint, Keynote, and Google Slides—perfect for analysts, investors, and finance professionals.


7 slides
Executive Summary Infographic Presentation Template
An Executive Summary is a document that provides an overview of the main points of a larger report. It is often written to share with individuals who may not have time to review the entire report. The executive summary provides a summary that sets out what's in the report, who it is written for, what it covers and why it's important. Use this template to create a powerful summary, which makes it easier to communicate your engagement results and outline your most important points. This template was designed to suggest a number of ways to enhance your executive summary and make it more persuasive.


4 slides
Aviation Logistics and Scheduling Presentation
Coordinate timelines and optimize operations with the Aviation Logistics and Scheduling presentation. This layout uses a control tower illustration to visualize four key scheduling points—ideal for showcasing flight operations, airport coordination, or air traffic planning. Great for logistics teams, airline operations managers, or aviation consultants. Fully editable in PowerPoint, Keynote, and Google Slides.