


Features
- 7 Unique slides
- Fully editable and easy to edit in Microsoft Powerpoint, Keynote and Google Slides
- 16:9 widescreen layout
- Clean and professional designs
- Export to JPG, PDF or send by email


Do you have any questions?
Recommend


7 slides
Bowtie Strategy Mapping Presentation
Turn your strategies into a clear visual roadmap with a bold, connected flow that highlights every stage of your process. This presentation helps you organize goals, actions, and outcomes in a structured, engaging layout. Fully editable and compatible with PowerPoint, Keynote, and Google Slides for seamless customization.


6 slides
RAPID Framework for Business Strategy Presentation
Unveil a dynamic approach to strategic decision-making with the RAPID Framework for Business Strategy template. This structured layout covers the Recommend, Agree, Perform, Input, and Decide stages, offering a comprehensive toolkit for business planning and execution. This versatile template is essential for teams aiming to enhance strategic planning and is compatible with PowerPoint, Keynote, and Google Slides, making it accessible for a wide range of business professionals.


4 slides
AI Trends and Use Cases Presentation
Step into the future with a clean, modern layout that makes complex technology easy to grasp and exciting to explore. This presentation helps you break down emerging innovations, real-world applications, and industry opportunities using clear visuals and structured sections. Fully customizable and compatible with PowerPoint, Keynote, and Google Slides.


5 slides
Banking Services Infographics
Banking Services refer to the financial and investment services provided by banks to individuals, businesses, and other organizations. These Infographics are visual representations of information about different types of banking services provided by various financial institutions. This infographic provides an overview of the key features, benefits, and drawbacks of each service, such as checking/saving accounts, credit cards, and online banking. Included are statistics, charts, and other visual aids to convey data more effectively. The aim is to help individuals make informed decisions about the right banking services for their needs.


4 slides
Skills Development Training Schedule Presentation
Organize learning paths with clarity using the Skills Development Training Schedule Presentation. This structured grid layout helps you map out training modules by skill category and timeline. Ideal for internal workshops, L&D planning, or certification programs. Fully editable in PowerPoint, Keynote, Google Slides, or Canva for seamless customization.


4 slides
Root Cause Analysis for Problem Solving
Tackle problems from the inside out with this structured and easy-to-follow layout. This root cause analysis template helps you clearly map out underlying issues and visualize their impact in one slide. Ideal for team discussions, audits, and presentations—fully editable in PowerPoint, Keynote, and Google Slides for maximum flexibility.


5 slides
Scientific Research Presentation
Break down complex processes with clarity using this Scientific Research Presentation Template. Featuring a modern lab flask visual segmented into four stages, it’s perfect for illustrating experimental phases, research progress, or scientific data. Ideal for educators, researchers, and science-based companies. Fully compatible with PowerPoint, Keynote, and Google Slides for effortless editing.


4 slides
Comparison Table Slide Presentation
Quickly highlight the differences between options with the Comparison Table Slide Presentation. This layout features a clean, structured table with checkmarks and Xs to visually compare features, services, or product tiers. Ideal for pricing plans, feature breakdowns, or side-by-side evaluations. Each column is color-coded for clarity and impact. Fully customizable in PowerPoint, Keynote, and Google Slides.


7 slides
Buyer Persona Guide Infographic
Elevate your marketing strategy with our Buyer Persona Guide Infographic Template, designed to distill complex customer data into stunning, easy-to-understand visual profiles. This template is a canvas for creativity, allowing marketers to paint detailed portraits of their ideal customers using a mix of vibrant colors, engaging layouts, and succinct text. Craft each persona with care, detailing demographics, preferences, behaviors, and needs, all laid out in an aesthetically pleasing format that makes data pop off the page. Whether you're presenting to stakeholders, guiding your content strategy, or training your sales team, these visuals serve as your roadmap to deeper customer connections. Fully customizable to reflect your brand's unique voice and style, this template adapts seamlessly to your needs, ensuring that every insight into your audience is not just informative but also visually captivating. It's an essential tool for anyone looking to enhance their understanding of their market and refine their approach to meet customer demands.


5 slides
Corporate Goal Alignment and Execution Presentation
Drive strategic clarity with this streamlined Corporate Goal Alignment and Execution slide. This template visually connects key initiatives with execution pathways and end goals, using a funnel-style layout that highlights the flow from strategic inputs to measurable outcomes. Perfect for aligning teams, reporting progress, or visualizing OKRs. Fully customizable in PowerPoint, Keynote, and Google Slides.


7 slides
Company Profile History Infographic
This collection of templates is meticulously designed to detail a company's historical growth and significant milestones, ensuring that stakeholders can grasp the evolution and achievements of the business effectively. Each template varies in design, from sleek, minimalistic layouts to more robust, data-intensive presentations, making it versatile for different corporate needs and preferences. Included features range from detailed timelines and milestone markers to percentage breakdowns, which not only aid in visualizing the company's journey but also emphasize important events such as key product launches, expansion milestones, and significant shifts in company strategy. Additionally, these templates allow for customization, including the ability to incorporate company-specific branding elements like logos, color schemes, and typography. Ideal for shareholder meetings, investor pitches, and internal strategy discussions, these templates serve as a powerful tool for companies to showcase their historical context, financial growth, market expansion, and customer engagement over the years, aligning past achievements with future goals in a clear and structured format.


6 slides
User Satisfaction Scoring System
Showcase user feedback with this vibrant User Satisfaction Scoring System Presentation. Featuring a semi-circle scale with expressive icons, it's perfect for visualizing survey results or customer experience insights. Fully editable in PowerPoint, Keynote, and Google Slides, this slide helps simplify scoring metrics while keeping your presentation clear, engaging, and professional


5 slides
Productivity and Time Optimization Presentation
Visualize time-saving strategies and workflow efficiency with this hourglass-themed productivity template. Ideal for illustrating phased progress, deadlines, or time distribution, this design breaks your message into four clear sections with engaging visuals. Fully editable in PowerPoint, Keynote, and Google Slides.


5 slides
Food Industry Trends Presentation
Stay ahead of the curve with this visual presentation designed to spotlight key developments in the food industry. Featuring a creative pie chart integrated with food icons and utensils, this layout is perfect for data storytelling, market insights, or trend analysis. Fully editable in PowerPoint, Keynote, and Google Slides.


7 slides
Performance Infographics Presentation Template
This Performance Infographic template was created with the intention of highlighting business and organizational performance in a visually appealing manner. You can create a stunning and captivating infographic that conveys your message effectively. This template was designed for professionals in organizations needing to share essential information about their organizations, goals and progress. This template is a high quality infographic presentation design made in 7 slides. This template can be used in any kind of business, school, or service and is compatible with powerpoint.


5 slides
Workforce Alignment Strategy Presentation
Energize your strategy conversations with a clean, modern layout that makes team alignment feel clear, structured, and actionable. This presentation helps you break down goals, track priorities, and visualize key initiatives in a simple, intuitive flow. Ideal for planning sessions and leadership updates. Fully compatible with PowerPoint, Keynote, and Google Slides.
20 slides
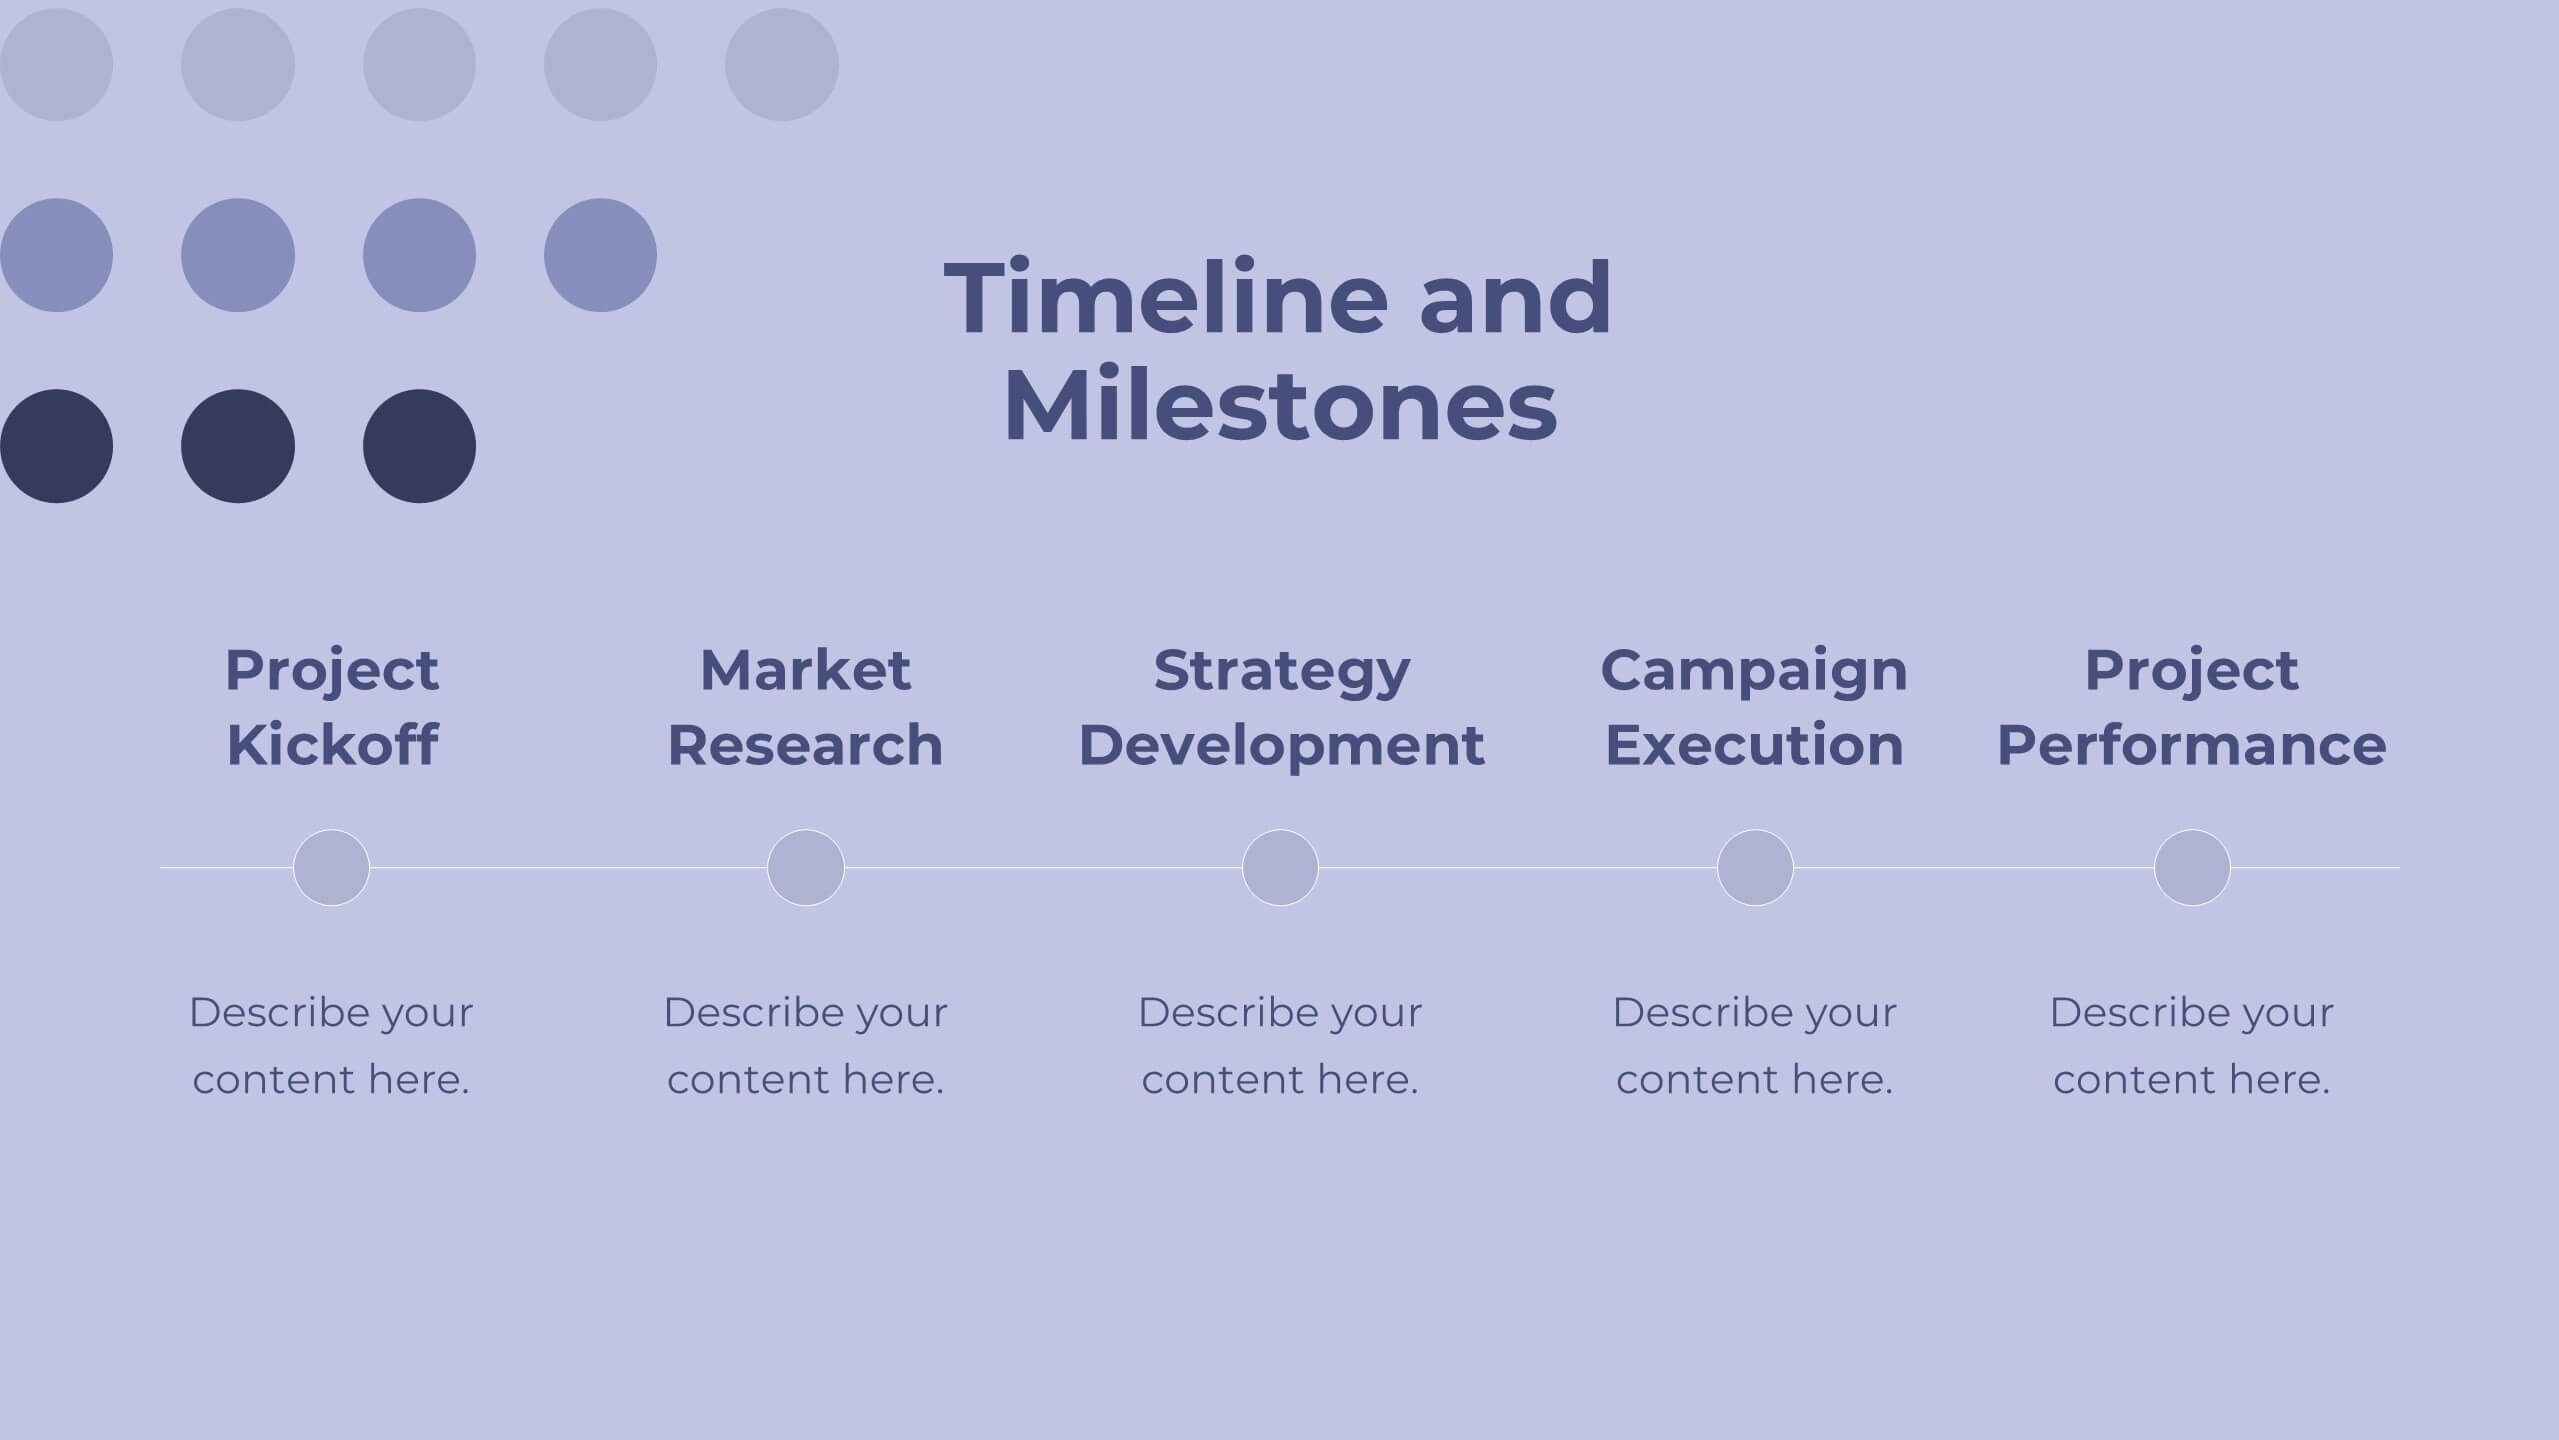
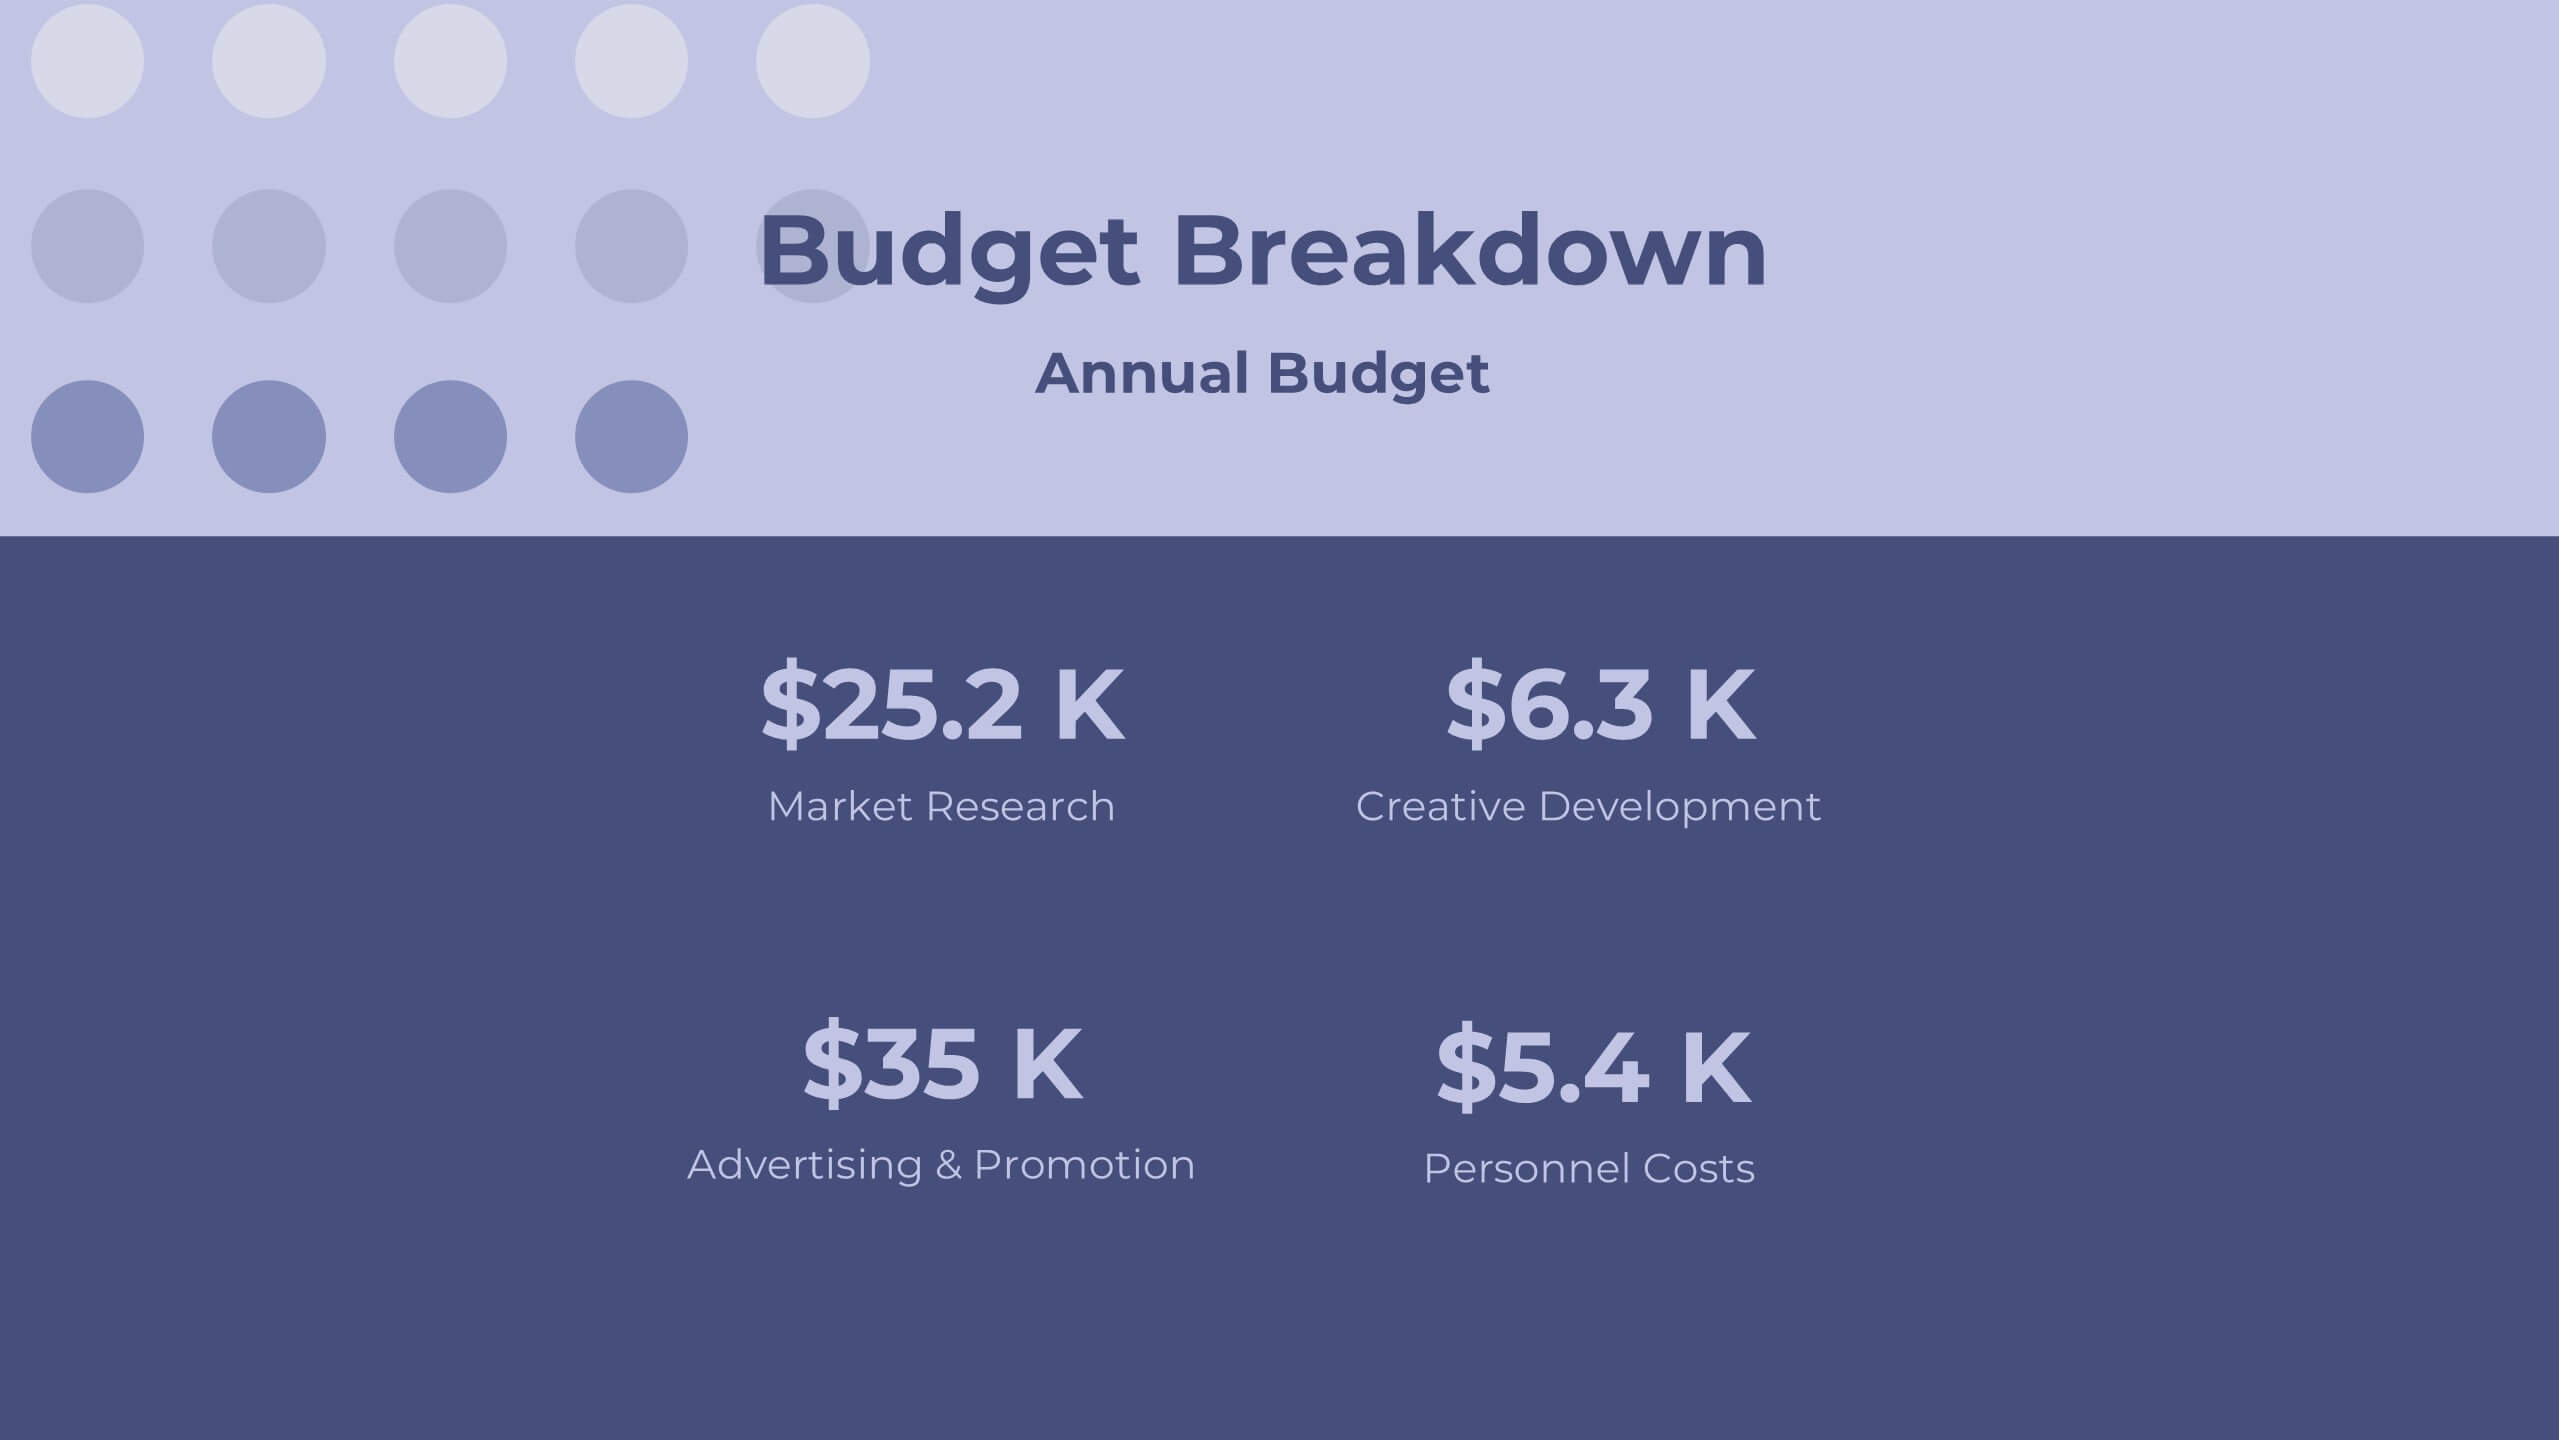
Labyrinth Project Proposal Presentation
Present your project proposal with this clean and professional template! Covering sections such as objectives, scope of work, timeline, and budget breakdown, it helps you convey your plan clearly and effectively. Fully customizable and compatible with PowerPoint, Keynote, and Google Slides, it’s perfect for delivering impactful proposals to clients.