


Features
- 6 Unique slides
- Fully editable and easy to edit in Microsoft Powerpoint, Keynote and Google Slides
- 16:9 widescreen layout
- Clean and professional designs
- Export to JPG, PDF or send by email


Do you have any questions?
Recommend


12 slides
Strategic Planning with Strategy Wheel Presentation
Visualize your roadmap with this sleek strategy wheel template. Perfect for showcasing up to six strategic stages, this layout highlights progression while keeping your content organized and engaging. Ideal for business plans, project development, or performance cycles. Fully editable in PowerPoint, Keynote, and Google Slides.


10 slides
Milestone Roadmap Infographic Presentation
Track progress with clarity using this Milestone Roadmap Infographic template. Designed to highlight key achievements and project phases, it’s perfect for presentations, team updates, and strategic planning. Editable in PowerPoint, Keynote, and Google Slides, it's an efficient way to visualize goals, timelines, and accomplishments.


7 slides
North America Language Map Infographic
Embark on a visual odyssey across the vast terrains of North America with our expertly crafted map infographic. Painted in the expansive blue, the lush green, the vibrant yellow, and the warm orange, our template captures the essence of North America's diverse geographies and cultures. Adorned with accurate infographics, distinct icons, and region-specific image placeholders, it provides a panoramic view of the continent's multifaceted landscape. Flawlessly tailored for Powerpoint, Keynote, or Google Slides. An indispensable tool for educators, travelers, geographers, or businesses targeting the North American market. Navigate with purpose; let every slide be a step into North America's captivating expanse.


5 slides
Business Executive Summary Report Presentation
Simplify your executive reporting with this 'Business Executive Summary Report' template, designed to present critical insights at a glance. This template streamlines complex data into digestible parts, ensuring clarity and impact in every slide. Perfect for executives and managers using PowerPoint, Keynote, and Google Slides.


3 slides
Company Mission Overview Presentation
Bring your message to life with a bright, modern slide that highlights purpose, direction, and organizational goals in a clean, engaging layout. This presentation helps you communicate mission-driven insights with clarity and visual impact, making it ideal for internal teams or stakeholders. Fully compatible with PowerPoint, Keynote, and Google Slides.


5 slides
Employee Lifecycle Management Presentation
Visualize every stage of the employee journey with the Employee Lifecycle Management template. Featuring a streamlined process flow, this layout is ideal for showcasing recruitment, onboarding, development, retention, and offboarding strategies. Fully editable in Canva, PowerPoint, and Google Slides, allowing seamless customization to align with your HR goals and branding.


6 slides
Stages of the Product Life Cycle Presentation
Illustrate the evolution of a product from launch to decline with the Stages of the Product Life Cycle presentation. This vibrant, segmented chart template visualizes key phases—Introduction, Growth, Maturity, and Decline—making it perfect for marketers, product managers, and strategists. Each stage is color-coded and icon-marked to enhance clarity and engagement. Fully customizable in PowerPoint, Keynote, and Google Slides.


26 slides
Austin Presentation Template
Sports photography captures the essence of sports and its participants by conveying a strong image. The photographer needs to carefully plan the timing of taking these photos. The Austin Template is perfect for displaying information about your products and services. Vivid and bold colors draw your audience's attention, while the creative sections provide all the relevant details. With an appealing layout and stylish design, you can present yourself in the best light possible. This template will give your site the professional look it deserves, and be sure to stand out to your clients.


4 slides
Onboarding 30-60-90 Roadmap Presentation
Simplify your onboarding strategy with the Onboarding 30–60–90 Roadmap Presentation. This clean, visual layout breaks down employee integration into three distinct timeframes—30, 60, and 90 days—each with space for goals, tasks, or milestones. Perfect for HR teams, managers, and trainers. Fully editable in Canva, PowerPoint, Keynote, and Google Slides.


19 slides
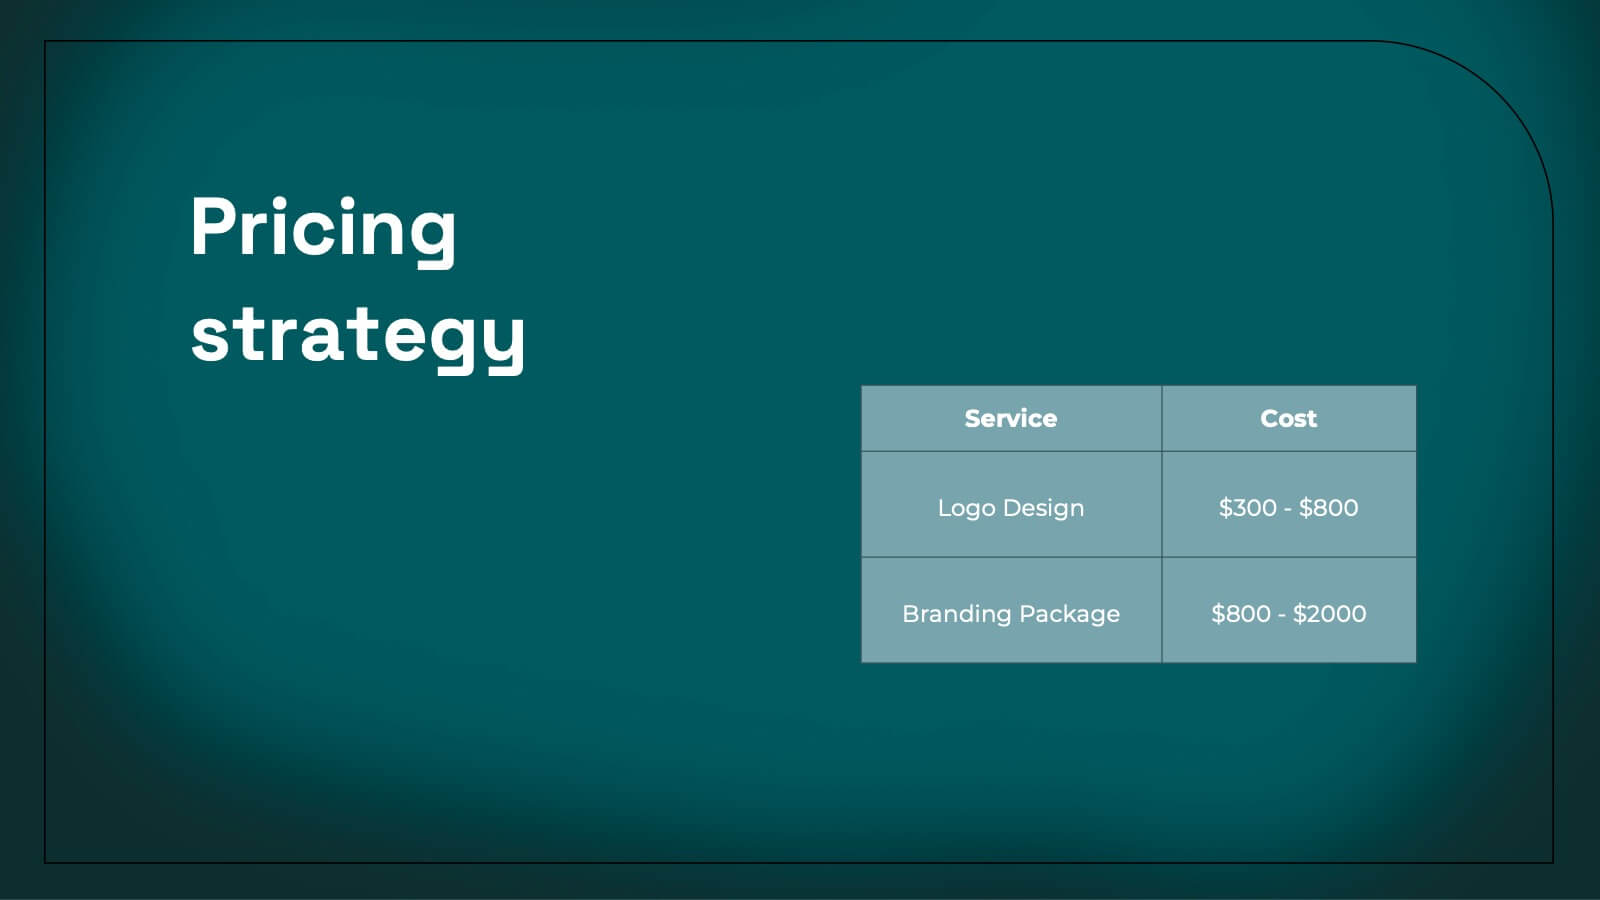
Kale Product Strategy Report Presentation
Unleash the power of your product with this bold and dynamic product strategy report template! Elevate your presentation with eye-catching designs that showcase product features, competitive analysis, and pricing strategies like never before. Captivate your audience from start to finish and leave a lasting impression. Fully compatible with PowerPoint, Keynote, and Google Slides!


6 slides
Employment Law Infographic
Employment law, also known as labor law, is a legal framework that governs the rights, responsibilities, and relationships between employers and employees in the workplace. This infographic template can be an effective way to convey key information about various aspects of employment law in a visually engaging manner. This template allows you to illustrate the importance of workplace safety regulations and the employer's responsibility to provide a safe working environment. The goal of this infographic is to educate and inform your audience about important aspects of employment law while maintaining a visually engaging and easily digestible format.


4 slides
New Hire Orientation Program Presentation
Set new hires up for success with a structured onboarding journey. This New Hire Orientation Program template visually represents key onboarding steps, ensuring clarity and consistency. Ideal for HR professionals and managers. Fully editable and compatible with PowerPoint, Keynote, and Google Slides for seamless customization.


6 slides
Budget Planning Spreadsheet Slide Presentation
Visualize your spending strategy with a clean, circular layout that turns complex financial data into simple, engaging visuals. This modern design helps you outline expenses, track categories, and showcase progress effectively in meetings or reports. Fully editable and compatible with PowerPoint, Keynote, and Google Slides for effortless customization.


8 slides
Card Services Comparison Layout Presentation
Highlight key differences in financial products with this Card Services Comparison Layout Presentation. Featuring a sleek smartphone-centered design, this template allows you to clearly compare up to three card types or financial service features. Perfect for fintech presentations, banking pitches, or product feature breakdowns. Fully customizable in PowerPoint, Keynote, and Google Slides.


4 slides
Watercolor Style Infographic Presentation
Bring an artistic flair to your data storytelling with this Watercolor Style Infographic Presentation. Featuring elegant, hand-painted flower visuals labeled A–D, this template is perfect for showcasing ideas in a soft, organic, and creative way. Ideal for branding presentations, product highlights, or educational content. Compatible with PowerPoint, Keynote, and Google Slides. Fully customizable and easy to use.


7 slides
Agriculture Infographics Presentation Template
Our Agriculture Infographic template is a great way to present your information about the structure, process and procedures of agricultural. This template includes a set of slides with illustrations and charts that will help you make an eye-catching presentation in just minutes. This template has been designed for use in PowerPoint, and is well-suited for both personal and business use. This infographic template is a perfect choice for presenting the statistical data about agriculture, such as product and service, market share and revenue, production levels and other information.


34 slides
Validation Pitch Deck
A Validation Pitch Deck, is a visual presentation that provides an overview of a startup company's business idea, market opportunity, value proposition, and progress towards validation of its concept or product. This template consists of a series of slides that are designed to convey the key elements of your business model in a concise and persuasive manner. Use this template as a tool to communicate your vision, market opportunity, and progress to potential investors or other stakeholders. Compatible with PowerPoint, Keynote, and Google Slides. The color scheme and design elements can be easily customized to match your brand or business.