


Features
- 5 Unique slides
- Fully editable and easy to edit in Microsoft Powerpoint, Keynote and Google Slides
- 16:9 widescreen layout
- Clean and professional designs
- Export to JPG, PDF or send by email


Do you have any questions?
Recommend


6 slides
Business Triangle Model Presentation
Visualize the core components of business success with the Business Triangle Model template. This structured framework highlights three interconnected elements, making it ideal for strategic planning, risk assessment, and performance analysis. Customize it effortlessly to suit your needs. Compatible with PowerPoint, Keynote, and Google Slides for seamless integration.


6 slides
Stages of the Product Life Cycle Presentation
Illustrate the evolution of a product from launch to decline with the Stages of the Product Life Cycle presentation. This vibrant, segmented chart template visualizes key phases—Introduction, Growth, Maturity, and Decline—making it perfect for marketers, product managers, and strategists. Each stage is color-coded and icon-marked to enhance clarity and engagement. Fully customizable in PowerPoint, Keynote, and Google Slides.


6 slides
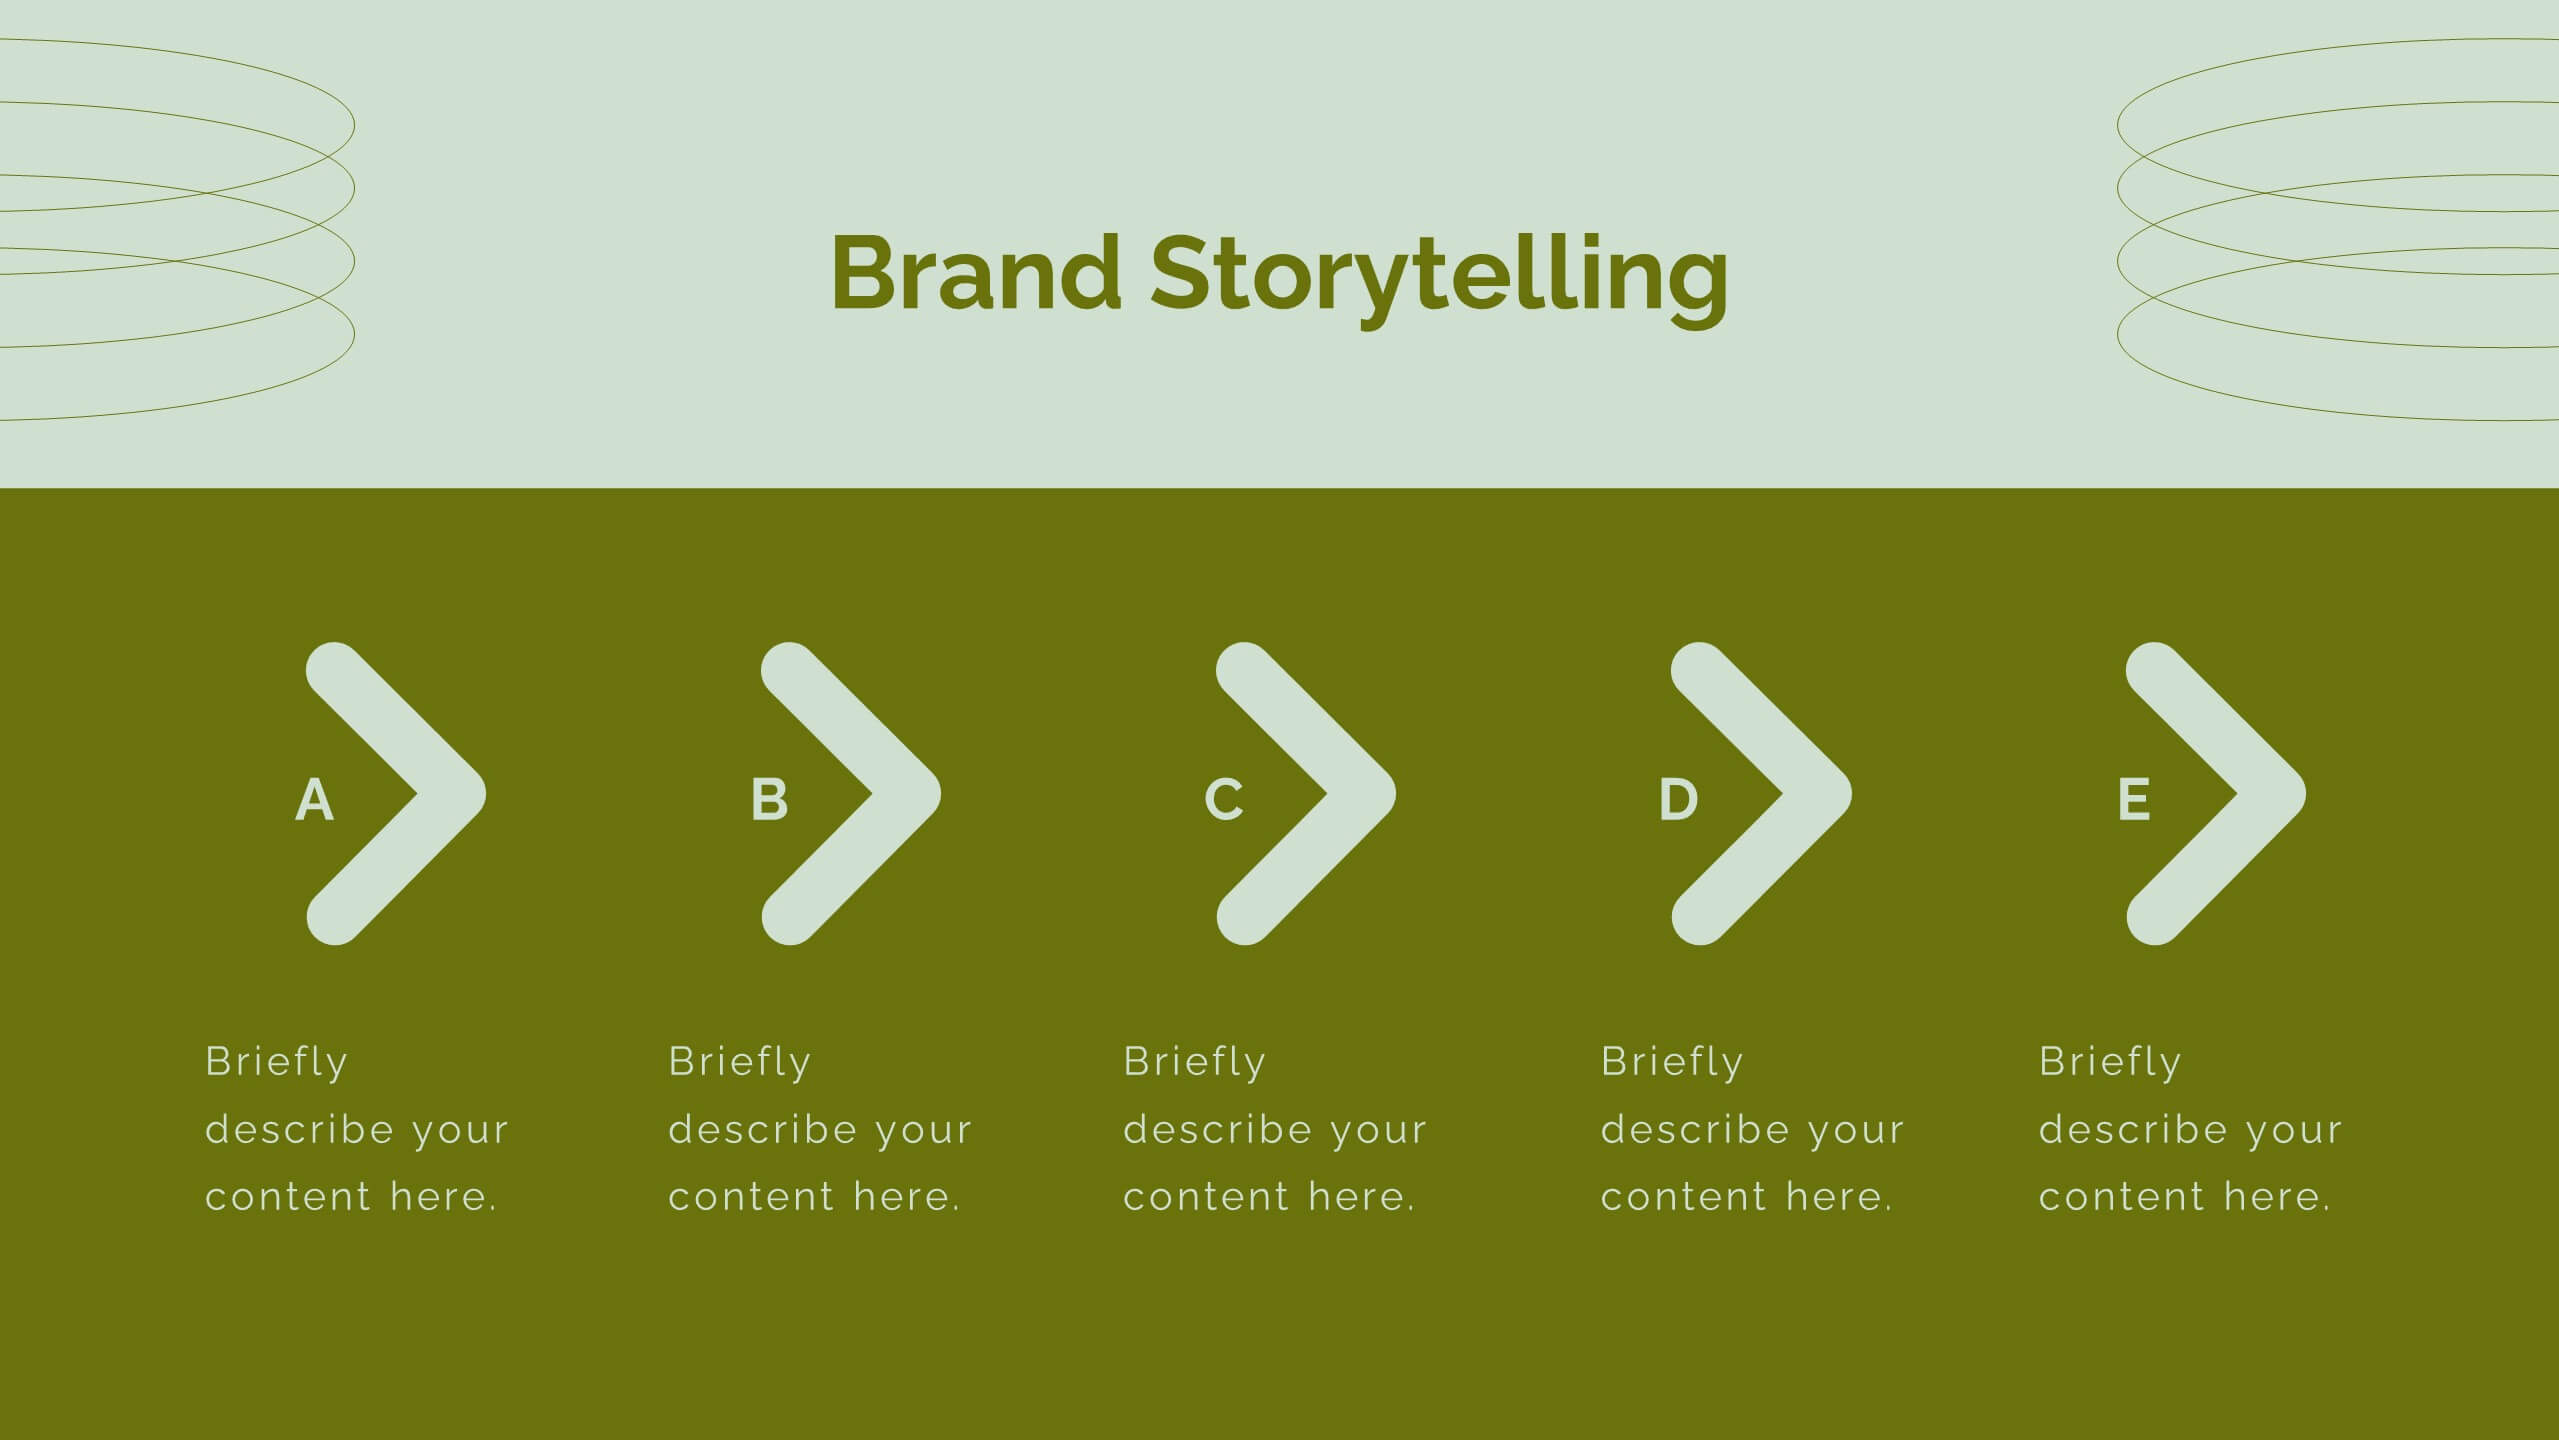
Tactical Planning for Clear Objectives Presentation
Break down your action plan with this Tactical Planning for Clear Objectives slide. Using a simple A–E step structure paired with a lightbulb visual, this layout helps present business goals or strategy stages clearly and engagingly. Easily customize it in PowerPoint, Google Slides, or Canva to fit your content.
8 slides
OKR Strategy Tracker Presentation
Bring your goals to life with a dynamic, structured layout that tracks objectives, measures results, and keeps teams aligned from start to finish. Ideal for strategic planning, quarterly reviews, or business updates, this presentation makes performance tracking effortless. Compatible with PowerPoint, Keynote, and Google Slides for full customization.


6 slides
Problem-Solving with Design Thinking
Communicate your innovation process with clarity using the Problem-Solving with Design Thinking Presentation. This slide visualizes the six key phases of the design thinking methodology (e.g., Empathize, Define, Ideate, Prototype, Test, Implement) arranged in a dynamic hexagonal loop. Each section is color-coded and icon-labeled for easy navigation, with editable titles and space for explanatory text. Ideal for creative workshops, team brainstorming, innovation strategy, and agile process presentations. Fully editable in PowerPoint, Keynote, and Google Slides.


6 slides
Six Sigma Process Infographic
Dive into the world of process improvement with our six sigma process infographic. Crafted with a harmonious blend of blue, yellow, and white, this infographic elucidates the principles of Six Sigma methodology in an engaging manner. Ideal for business analysts, quality assurance teams, and corporate trainers, it delineates the DMAIC process in vivid detail. The design encapsulates the rigorous methodology of Six Sigma, providing clarity and fostering knowledge retention. This versatile template is a perfect fit for PowerPoint, Keynote, and Google Slides, making your presentations both captivating and insightful.


5 slides
Sports Performance Analysis Presentation
Visualize athletic metrics and improvement strategies with this Sports Performance Analysis slide layout. Designed around a dynamic running figure, it uses labeled circular markers (A–D) to clearly break down four key insights or action points. Perfect for sports reviews, training breakdowns, or coaching sessions. Fully editable in PowerPoint, Keynote, and Google Slides.


4 slides
Real Estate and Housing Market Presentation
Turn market insights into visual stories that captivate investors and clients alike. This sleek and modern presentation helps you illustrate property trends, housing data, and real estate growth with clarity and confidence. Fully customizable and compatible with PowerPoint, Keynote, and Google Slides for easy editing and professional results.


7 slides
IT Enterprise Architecture Infographic
IT Architecture, is a structured framework used to conceptualize software, hardware, network infrastructure, and related technology components and their relationships within an organization. This infographic template serves as a visual compass navigating the intricate realm of Information Technology architecture. Compatible with Powerpoint, Keynote, and Google Slides. Let the elegant design and comprehensive content guide you through the foundational pillars of digital excellence. Present an architectural framework illustration, outlining the fundamental structure that supports an organization's digital journey.


6 slides
Business Framework Strategy Presentation
Dive into strategic planning with our Business Framework Strategy presentation template. This design brilliantly visualizes the essentials of business frameworks, guiding users through critical insights with a visually appealing, color-coded process. Ideal for strategists and planners, it offers a streamlined way to present complex information effectively. Compatible with PowerPoint, Keynote, and Google Slides, this template is a versatile tool for delivering impactful business strategies.


5 slides
Business Issue Root Cause Identification
Pinpoint the real reasons behind business challenges with this clear and visual layout. This root cause identification template breaks down effects and traces them back to their sources, making it easier to align your team and propose actionable solutions. Fully customizable in PowerPoint, Keynote, and Google Slides.


20 slides
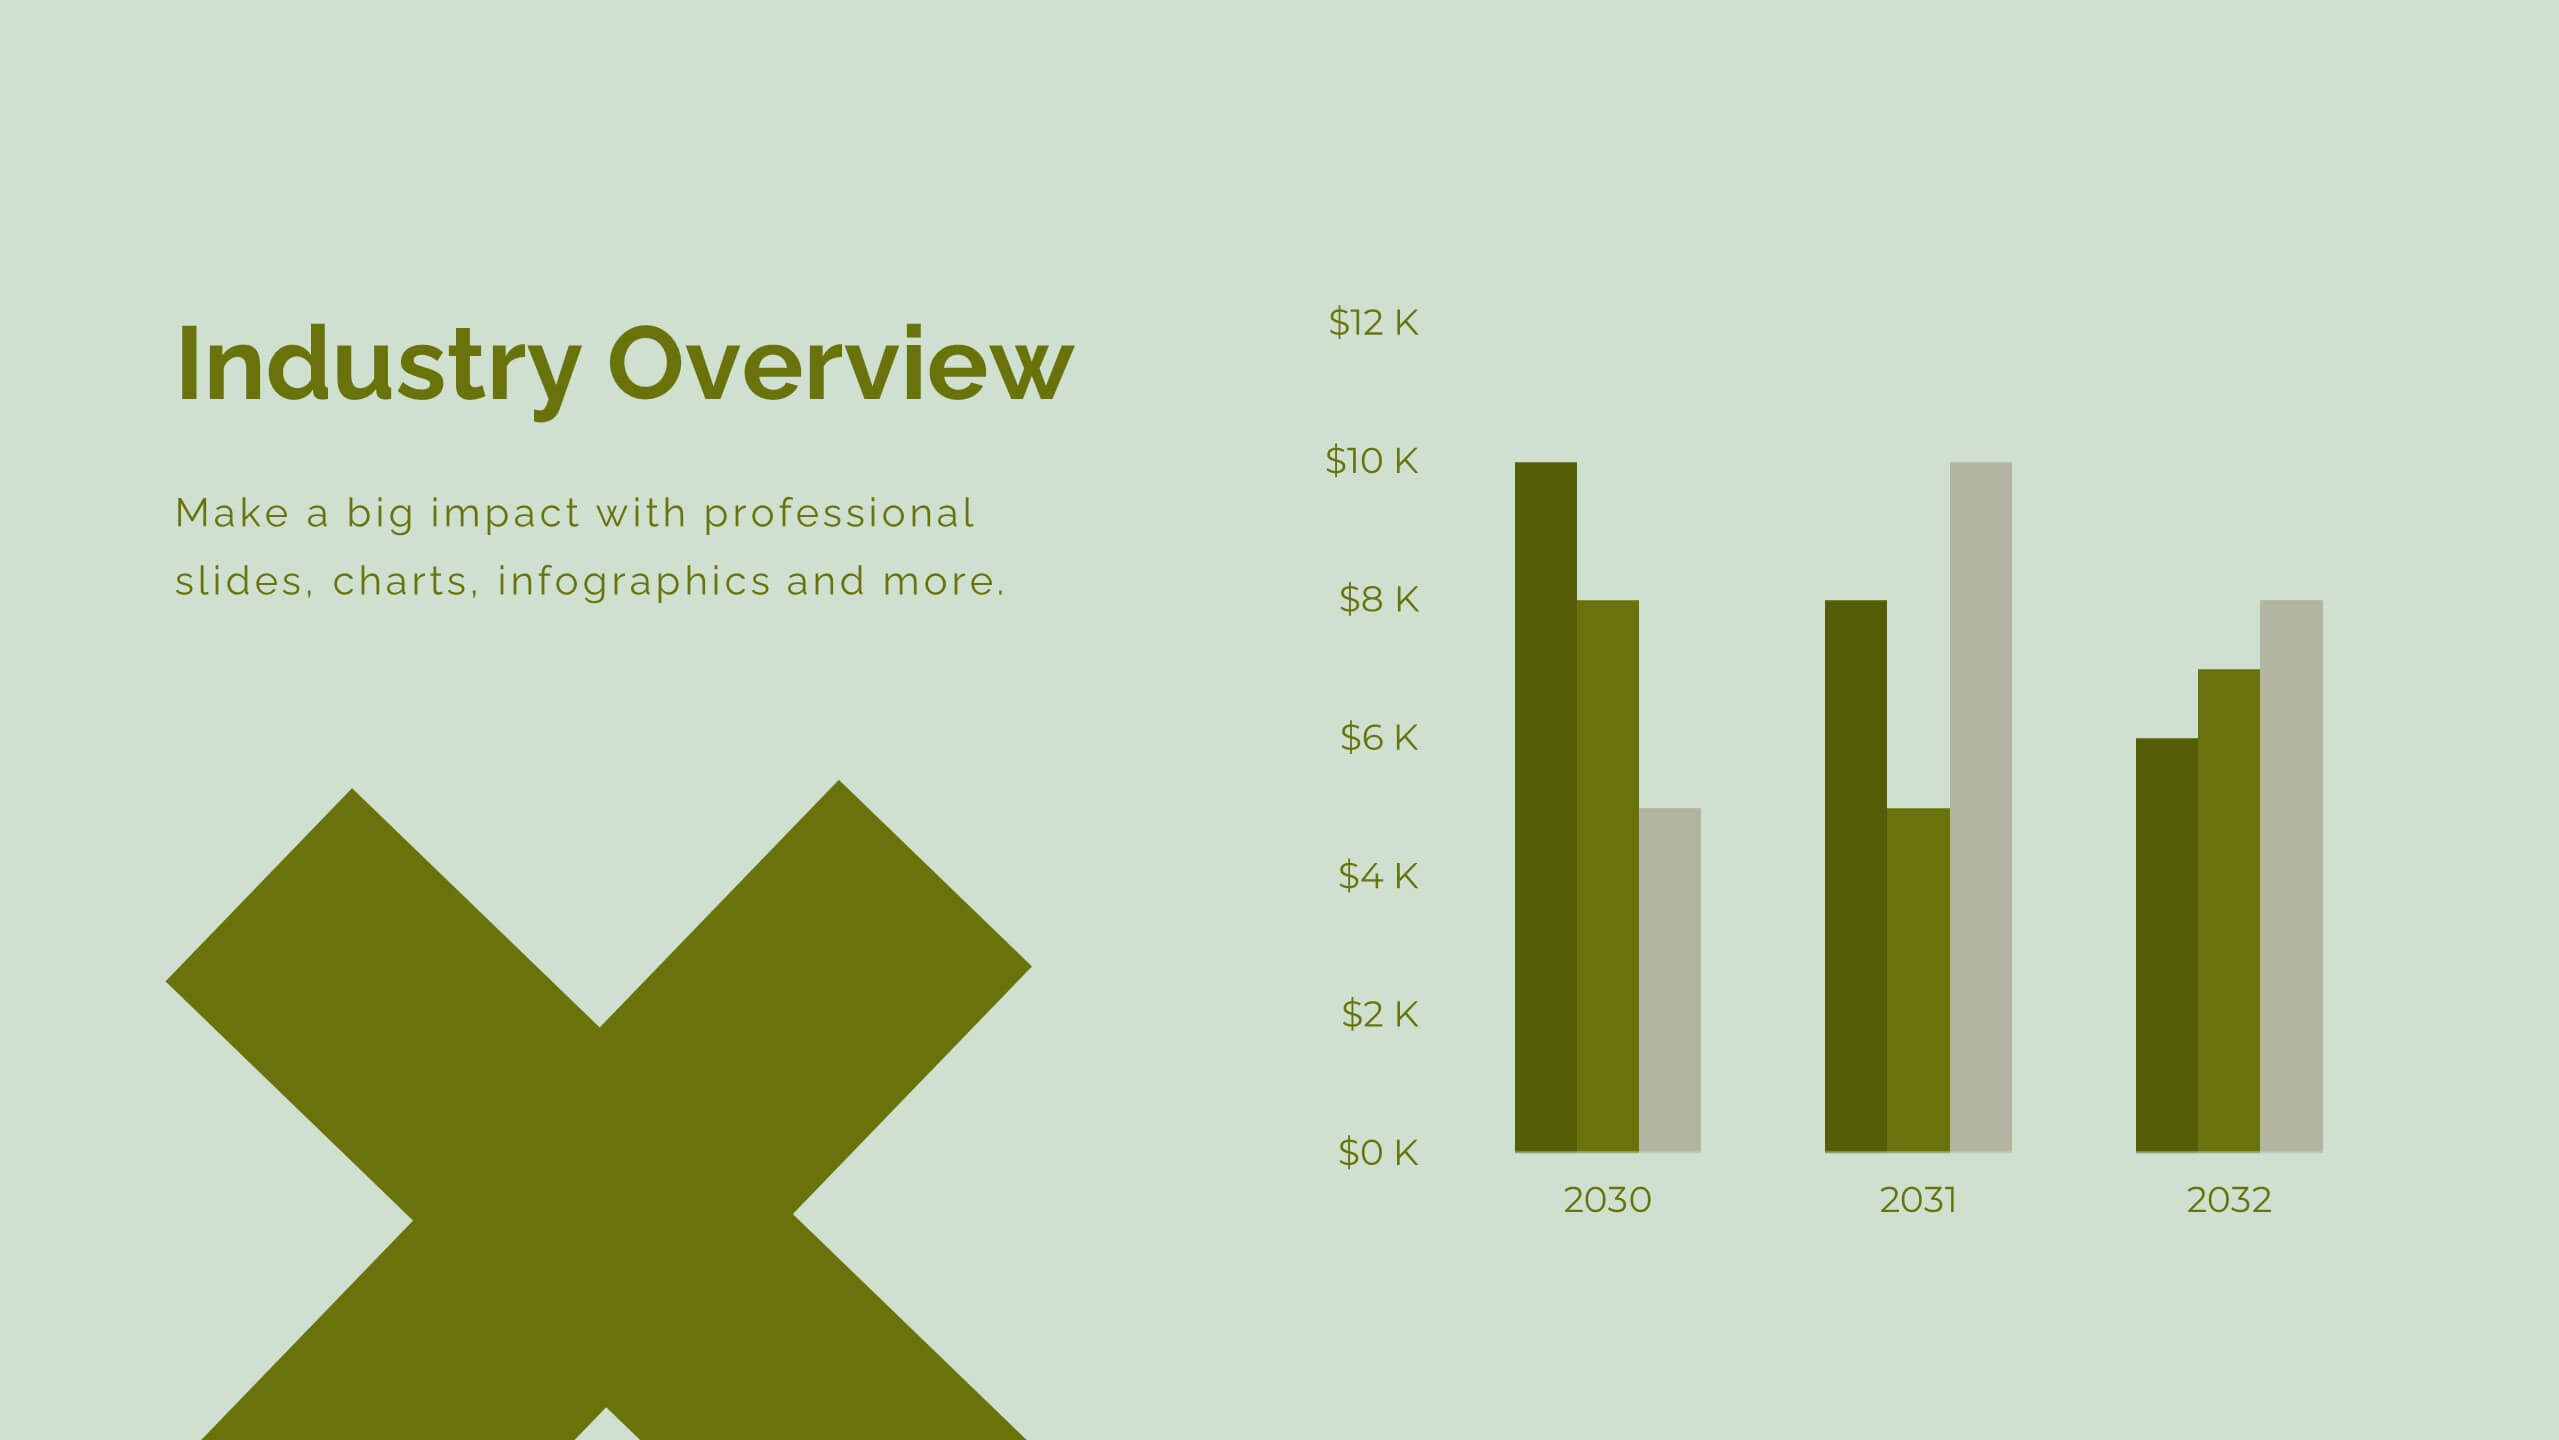
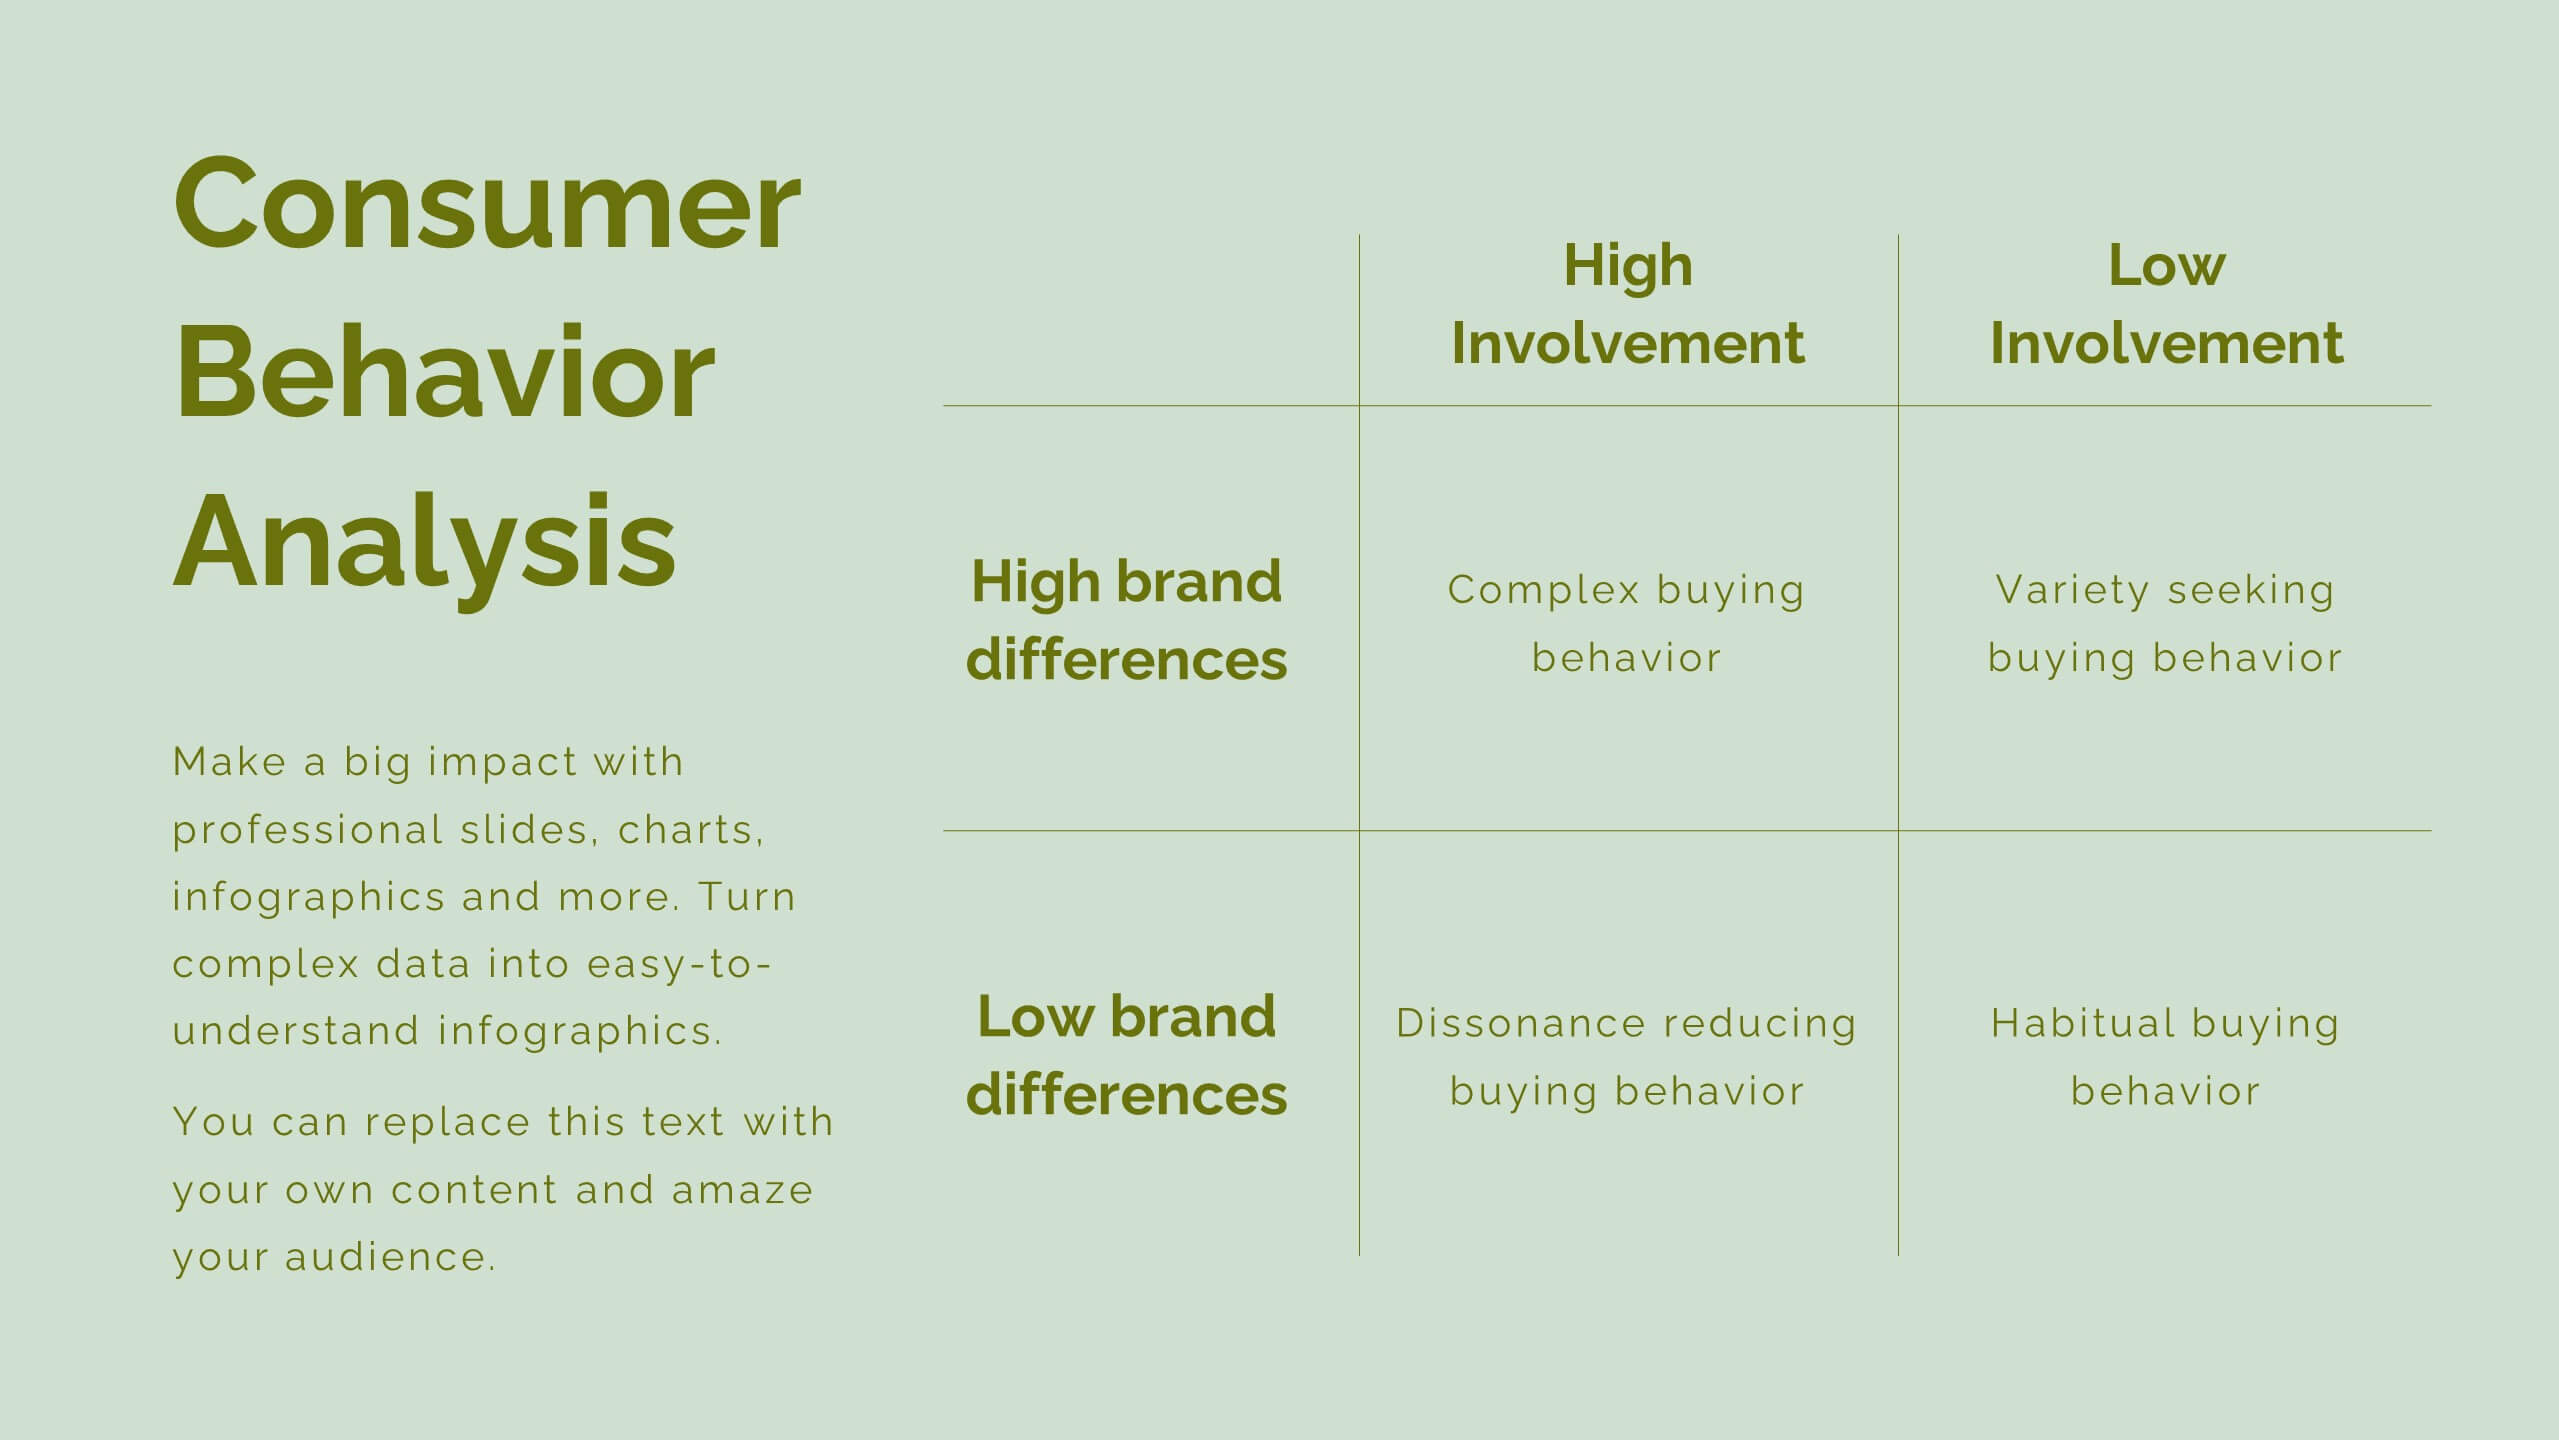
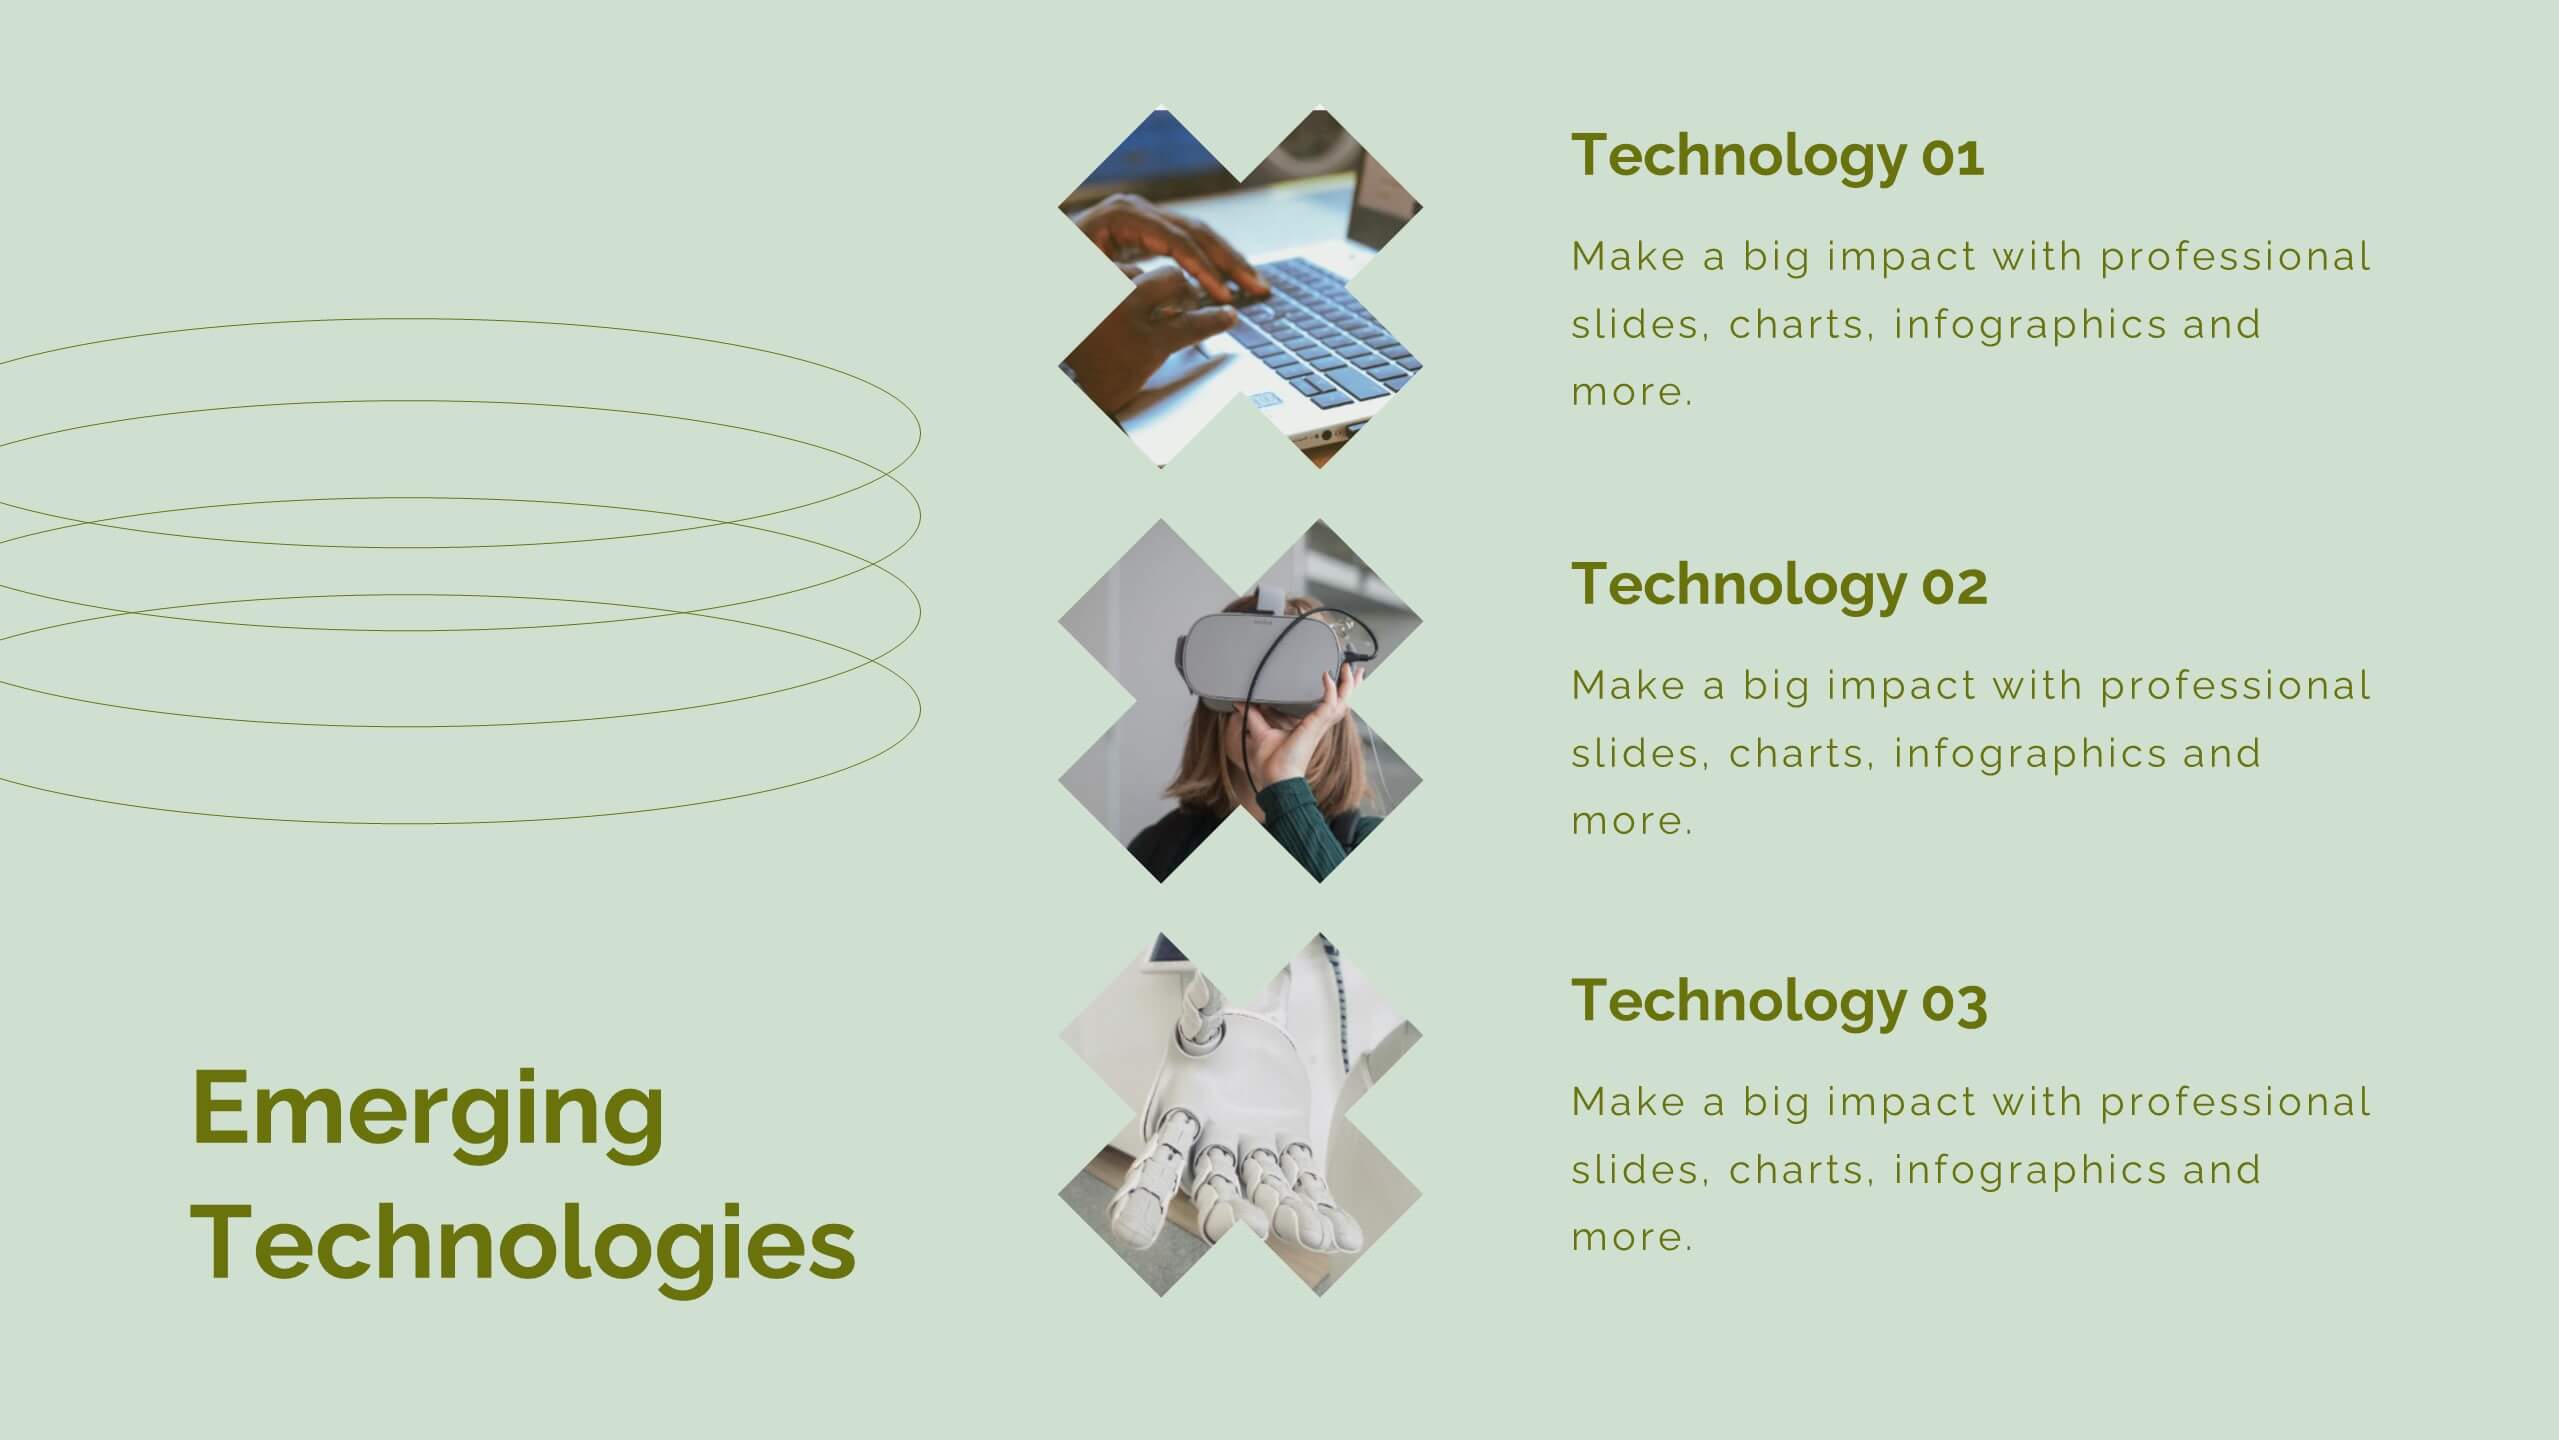
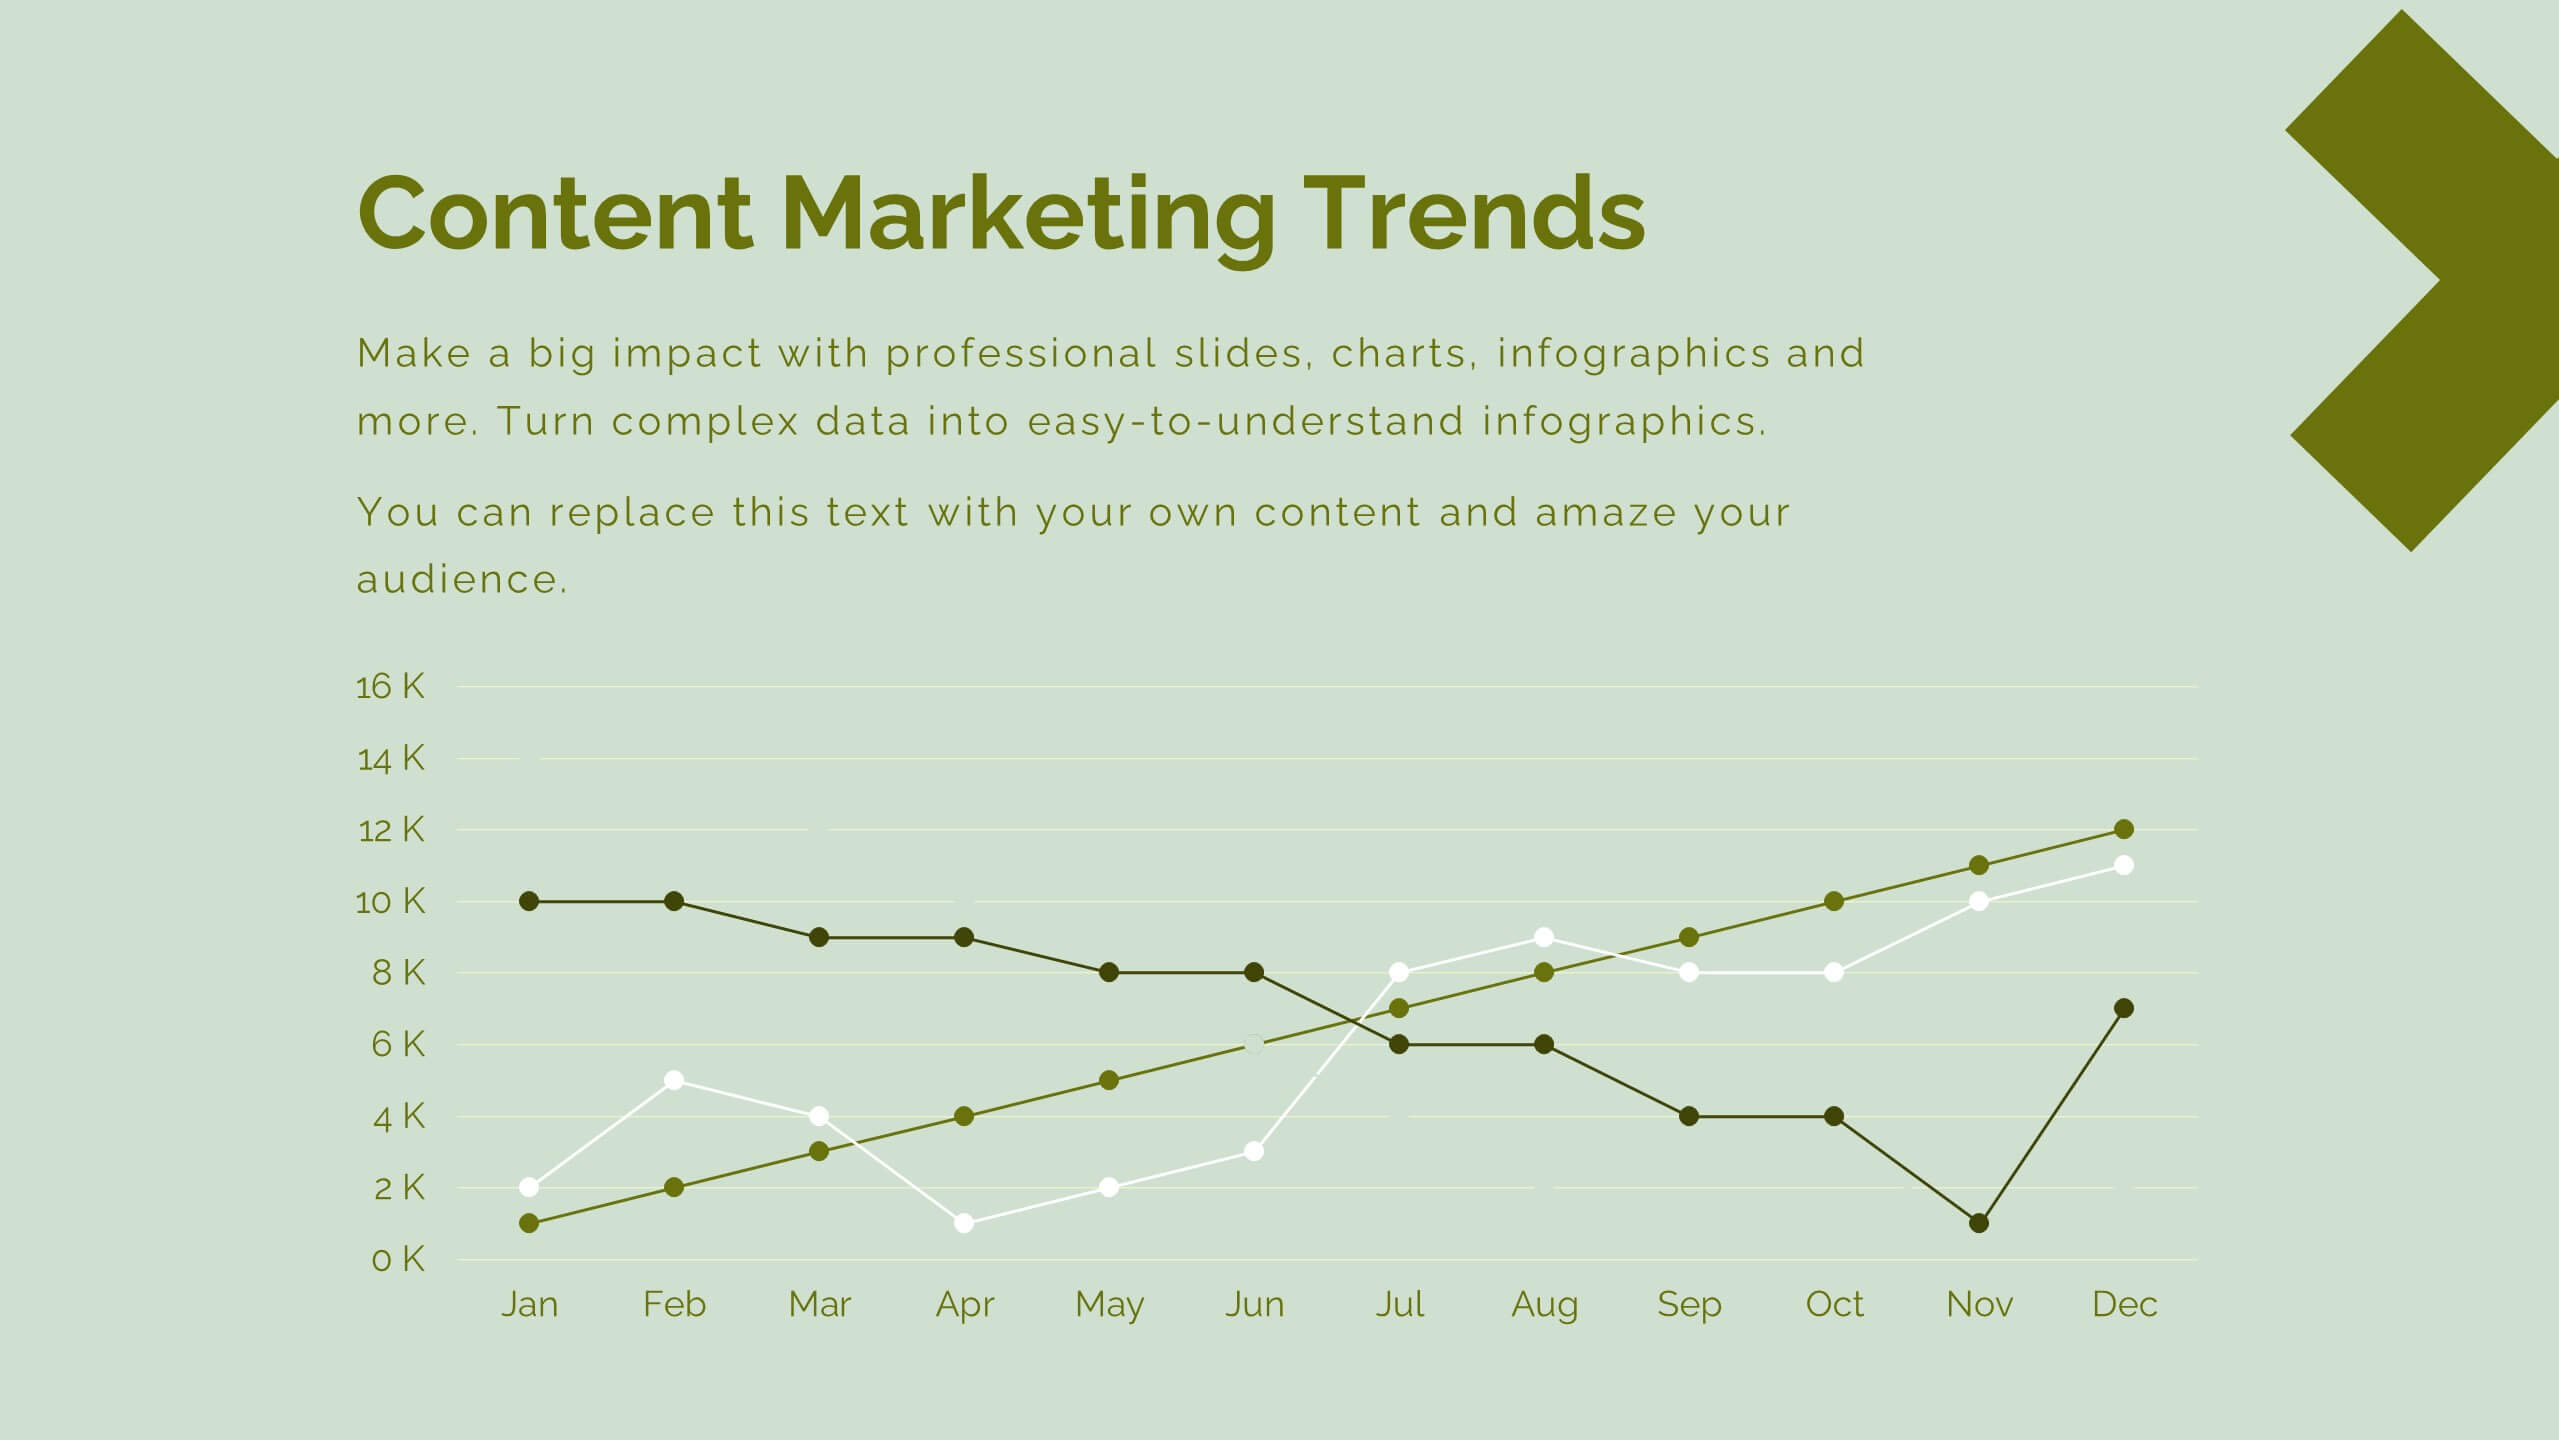
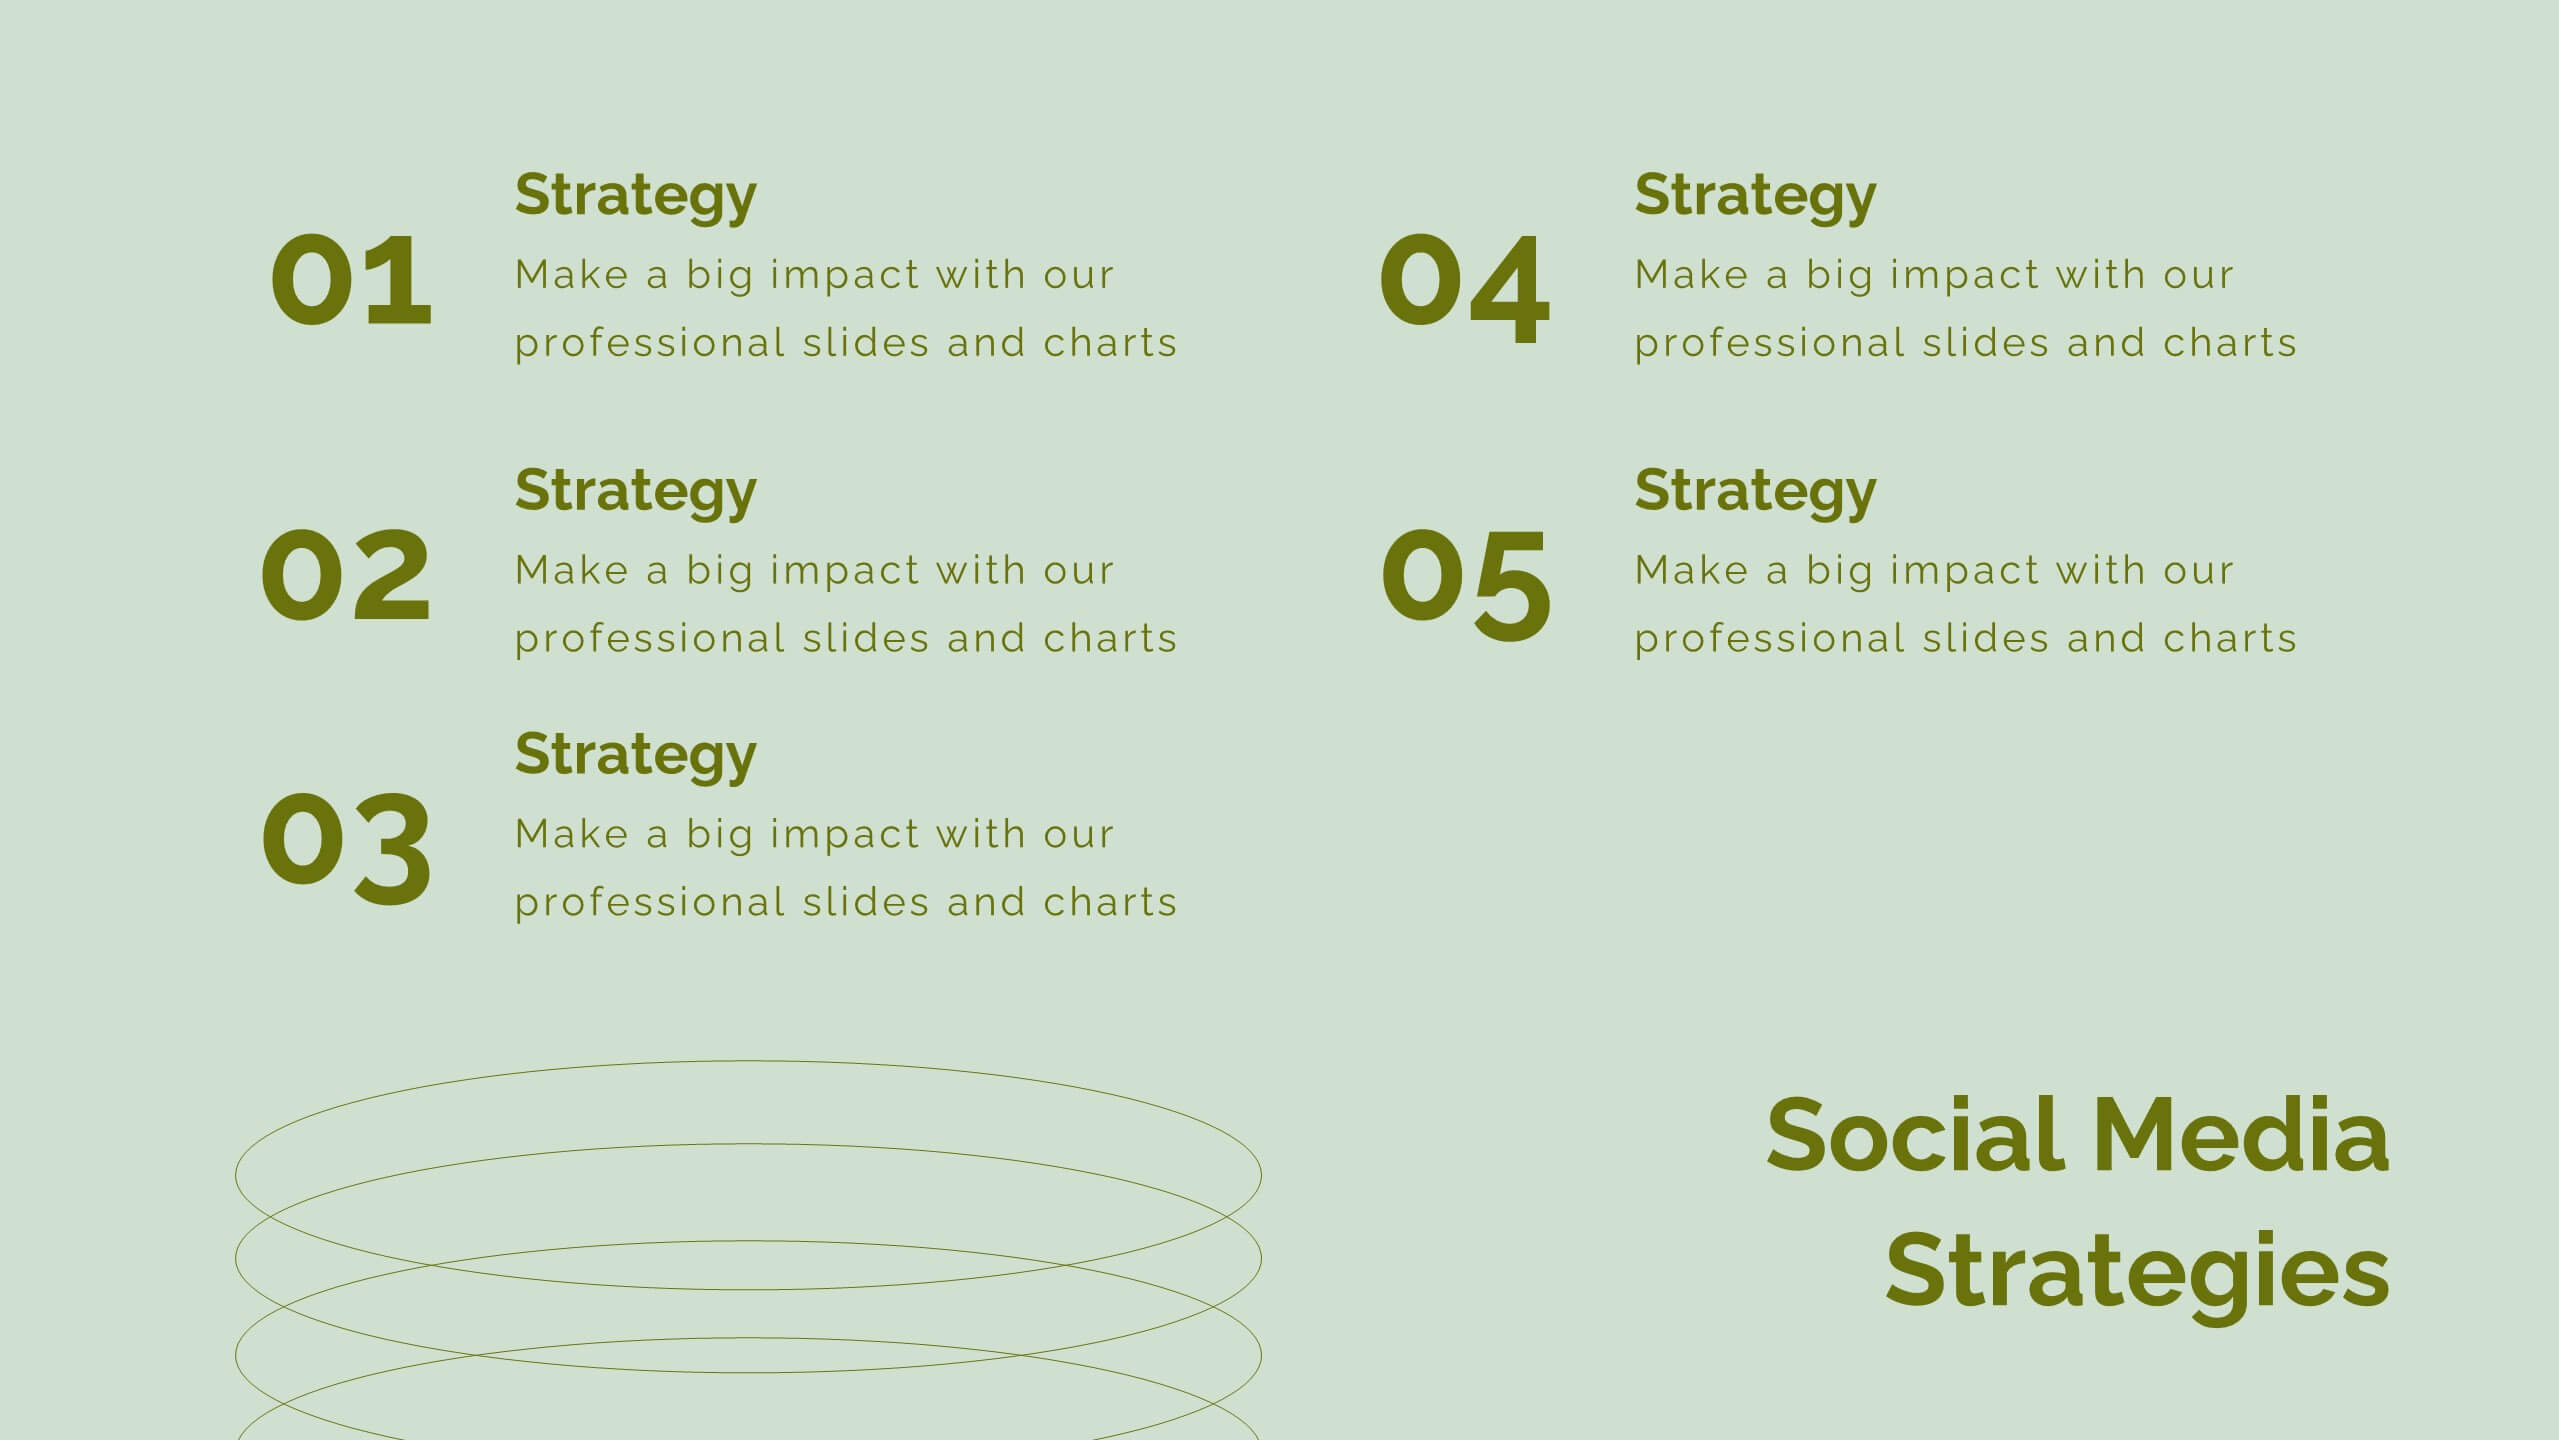
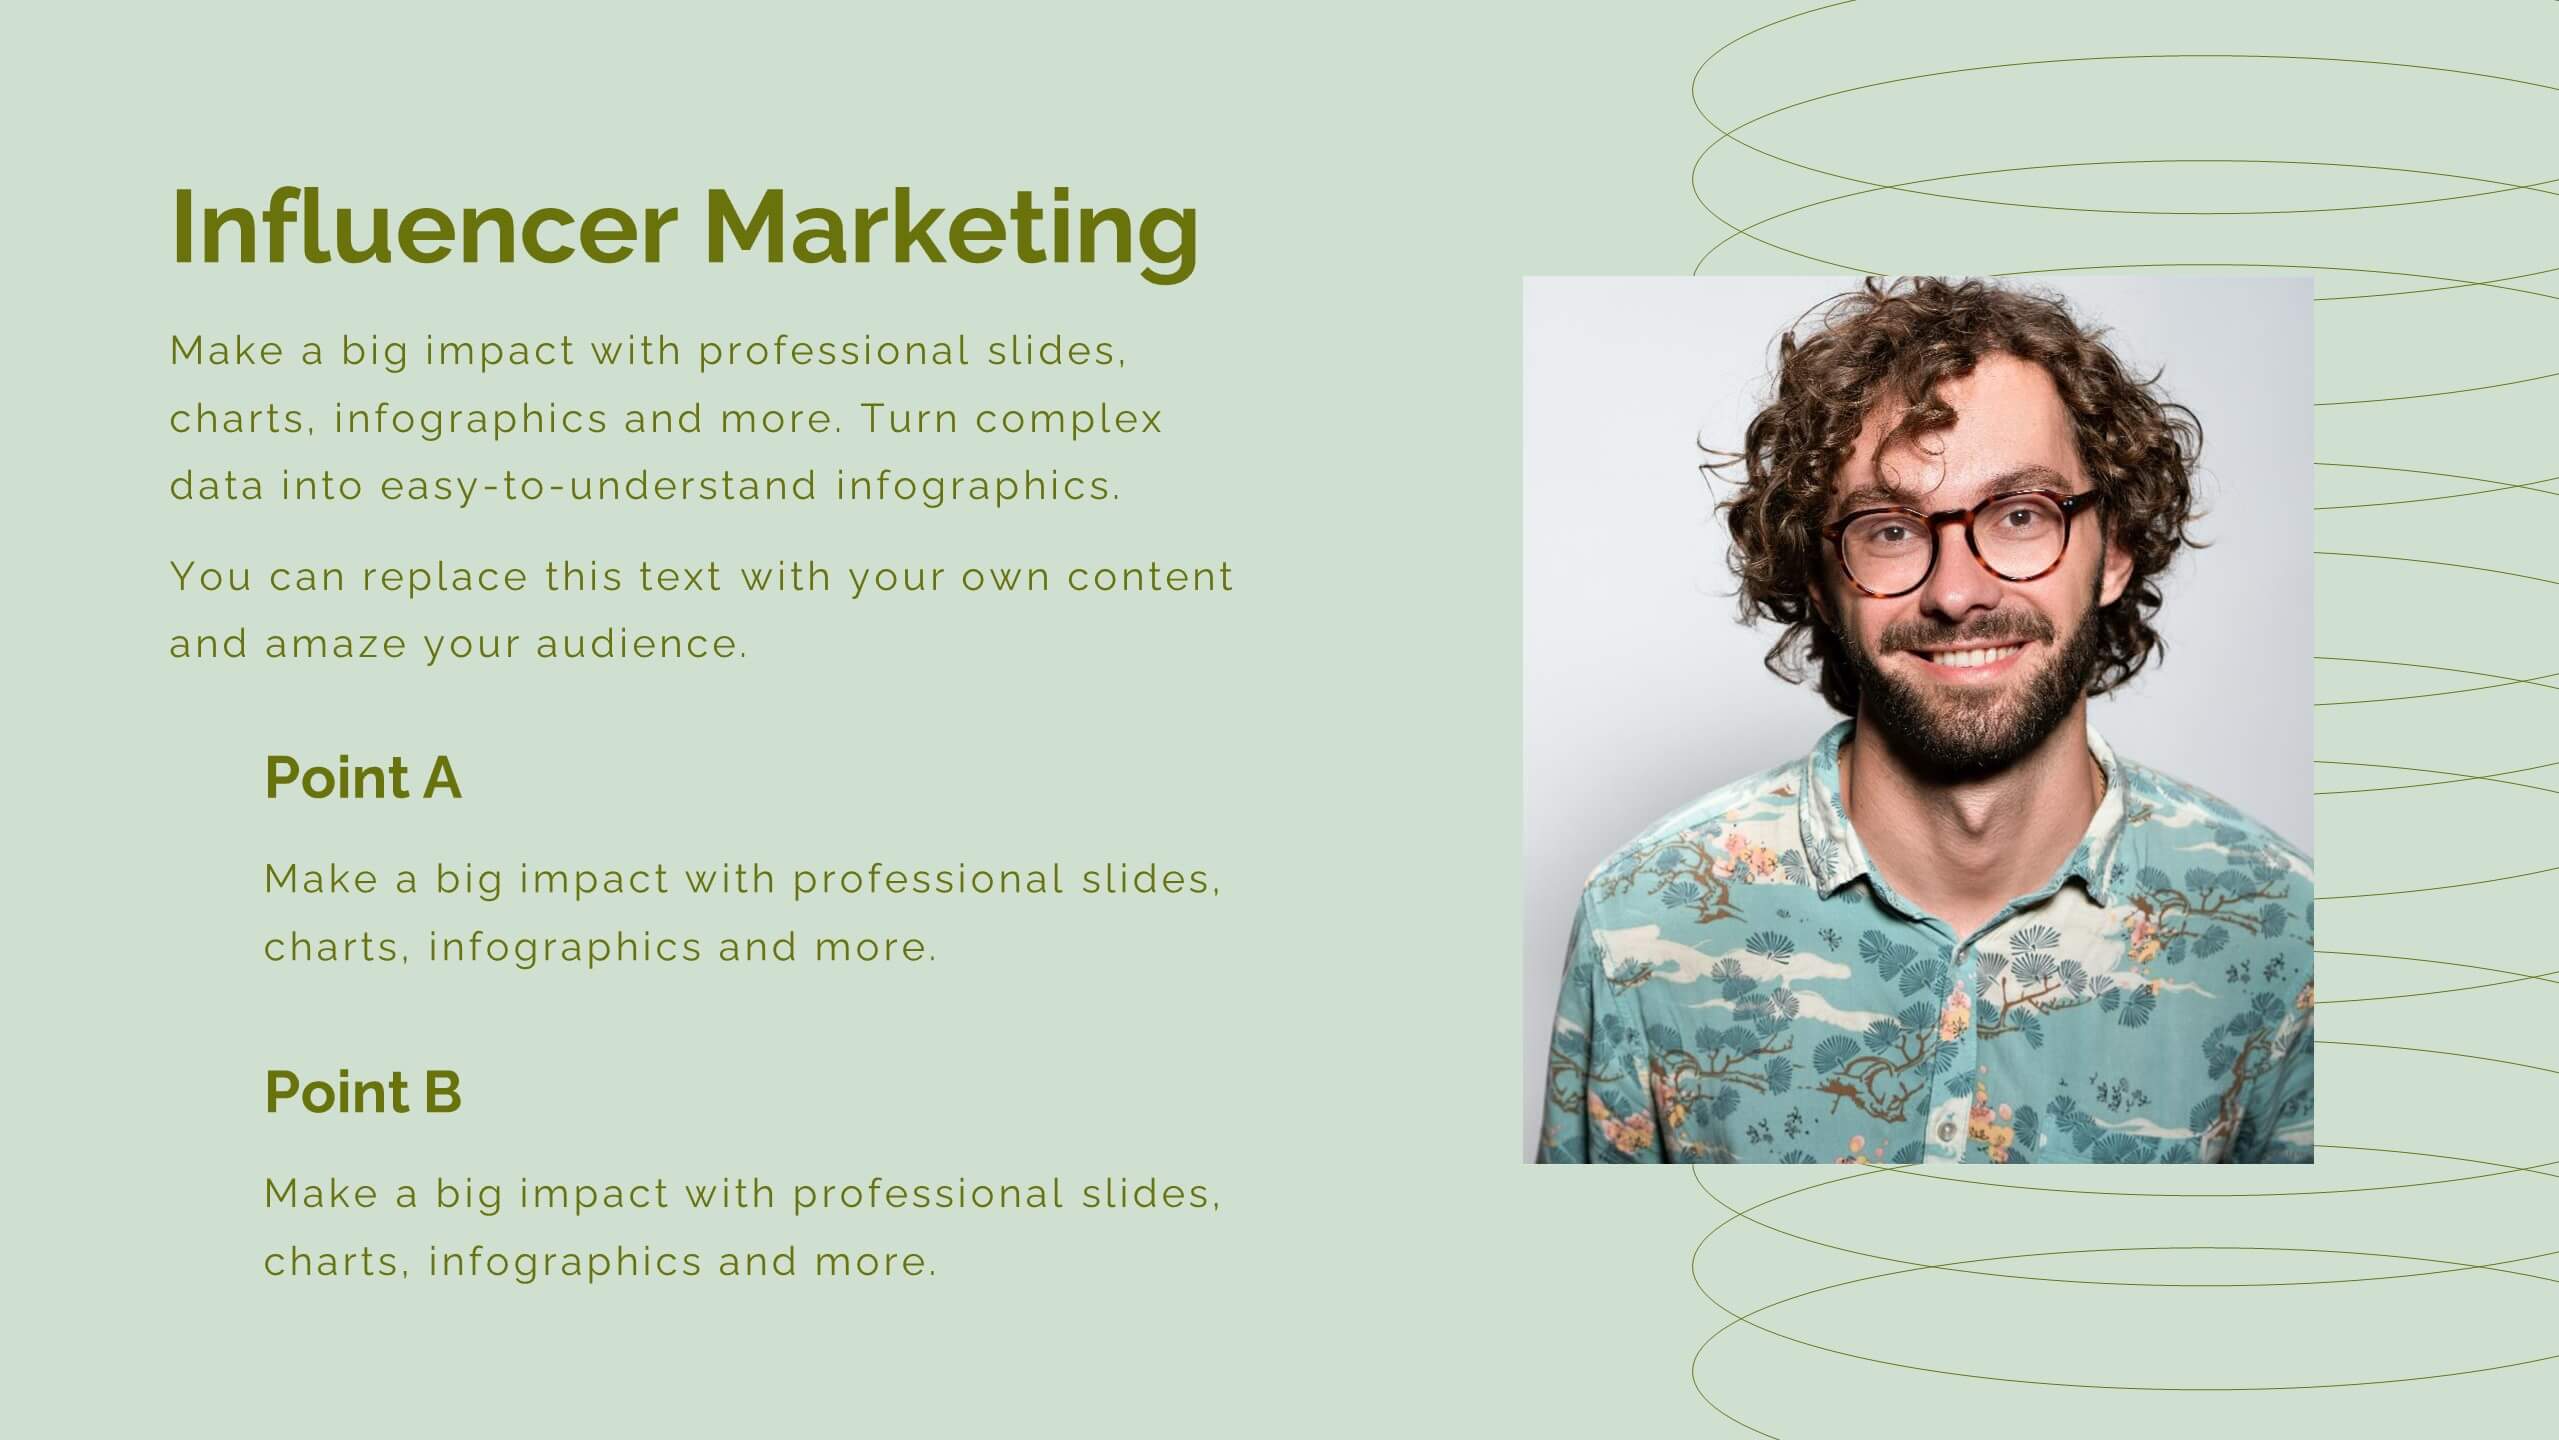
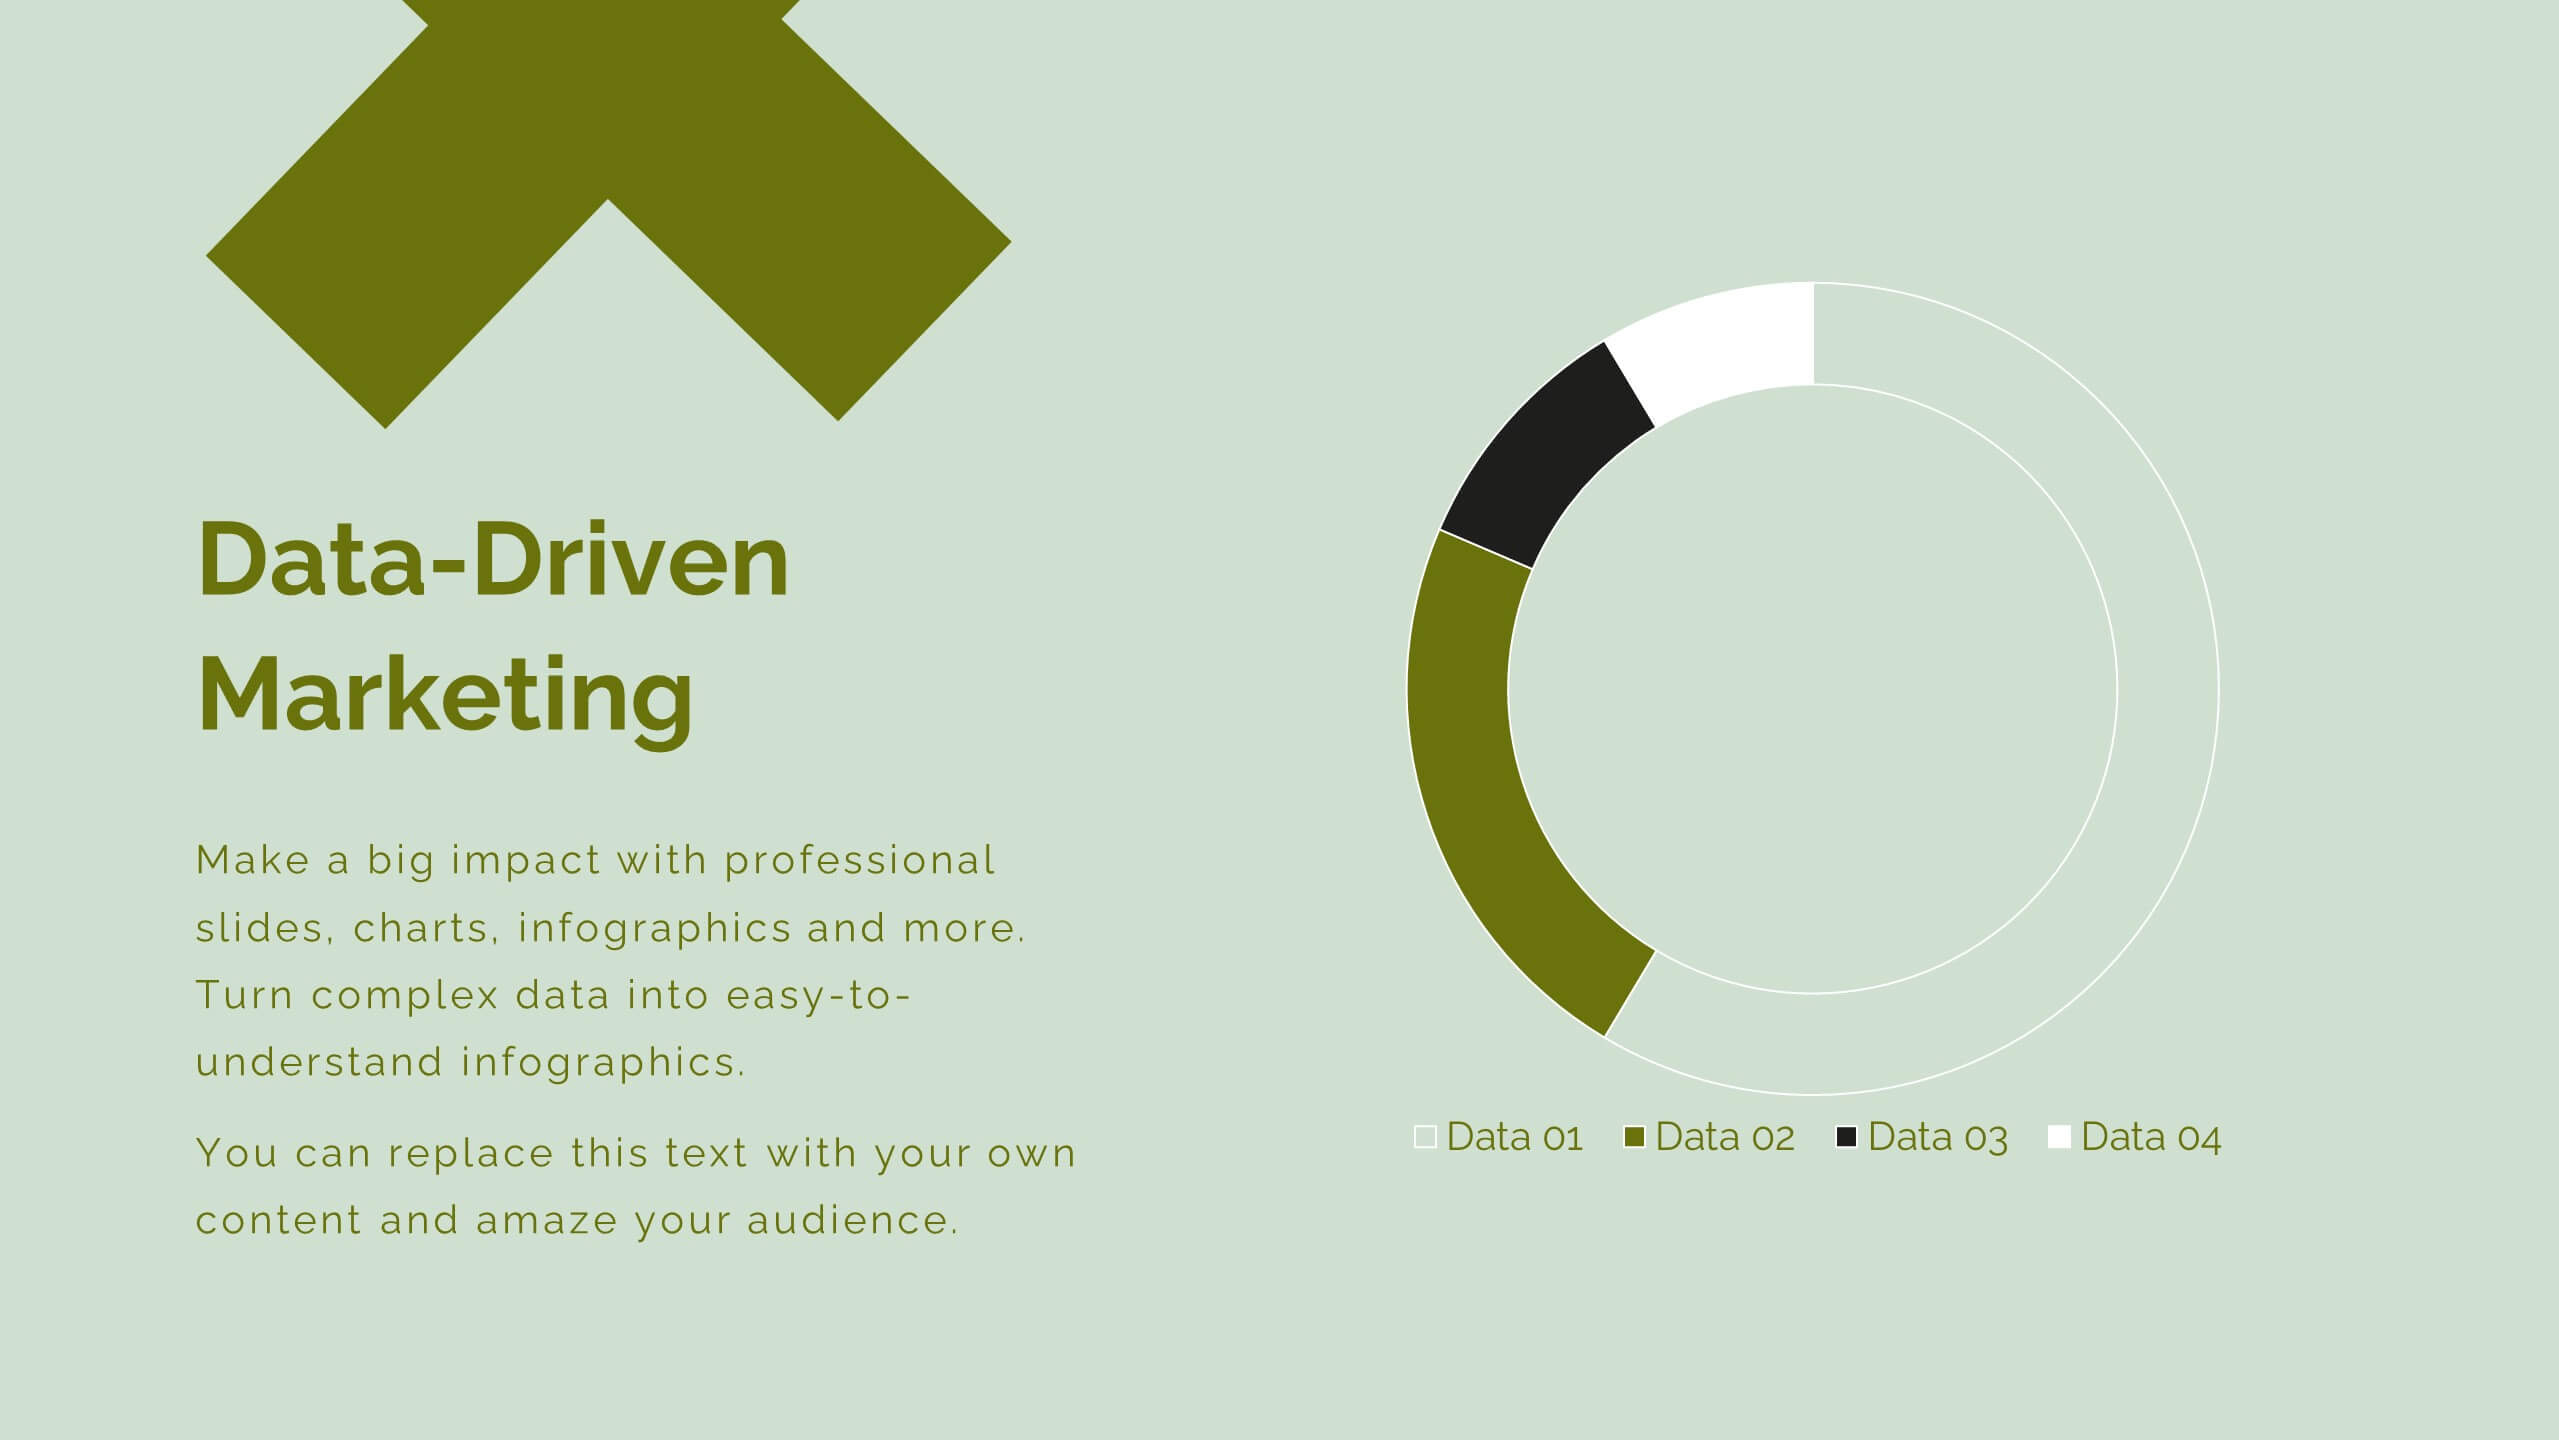
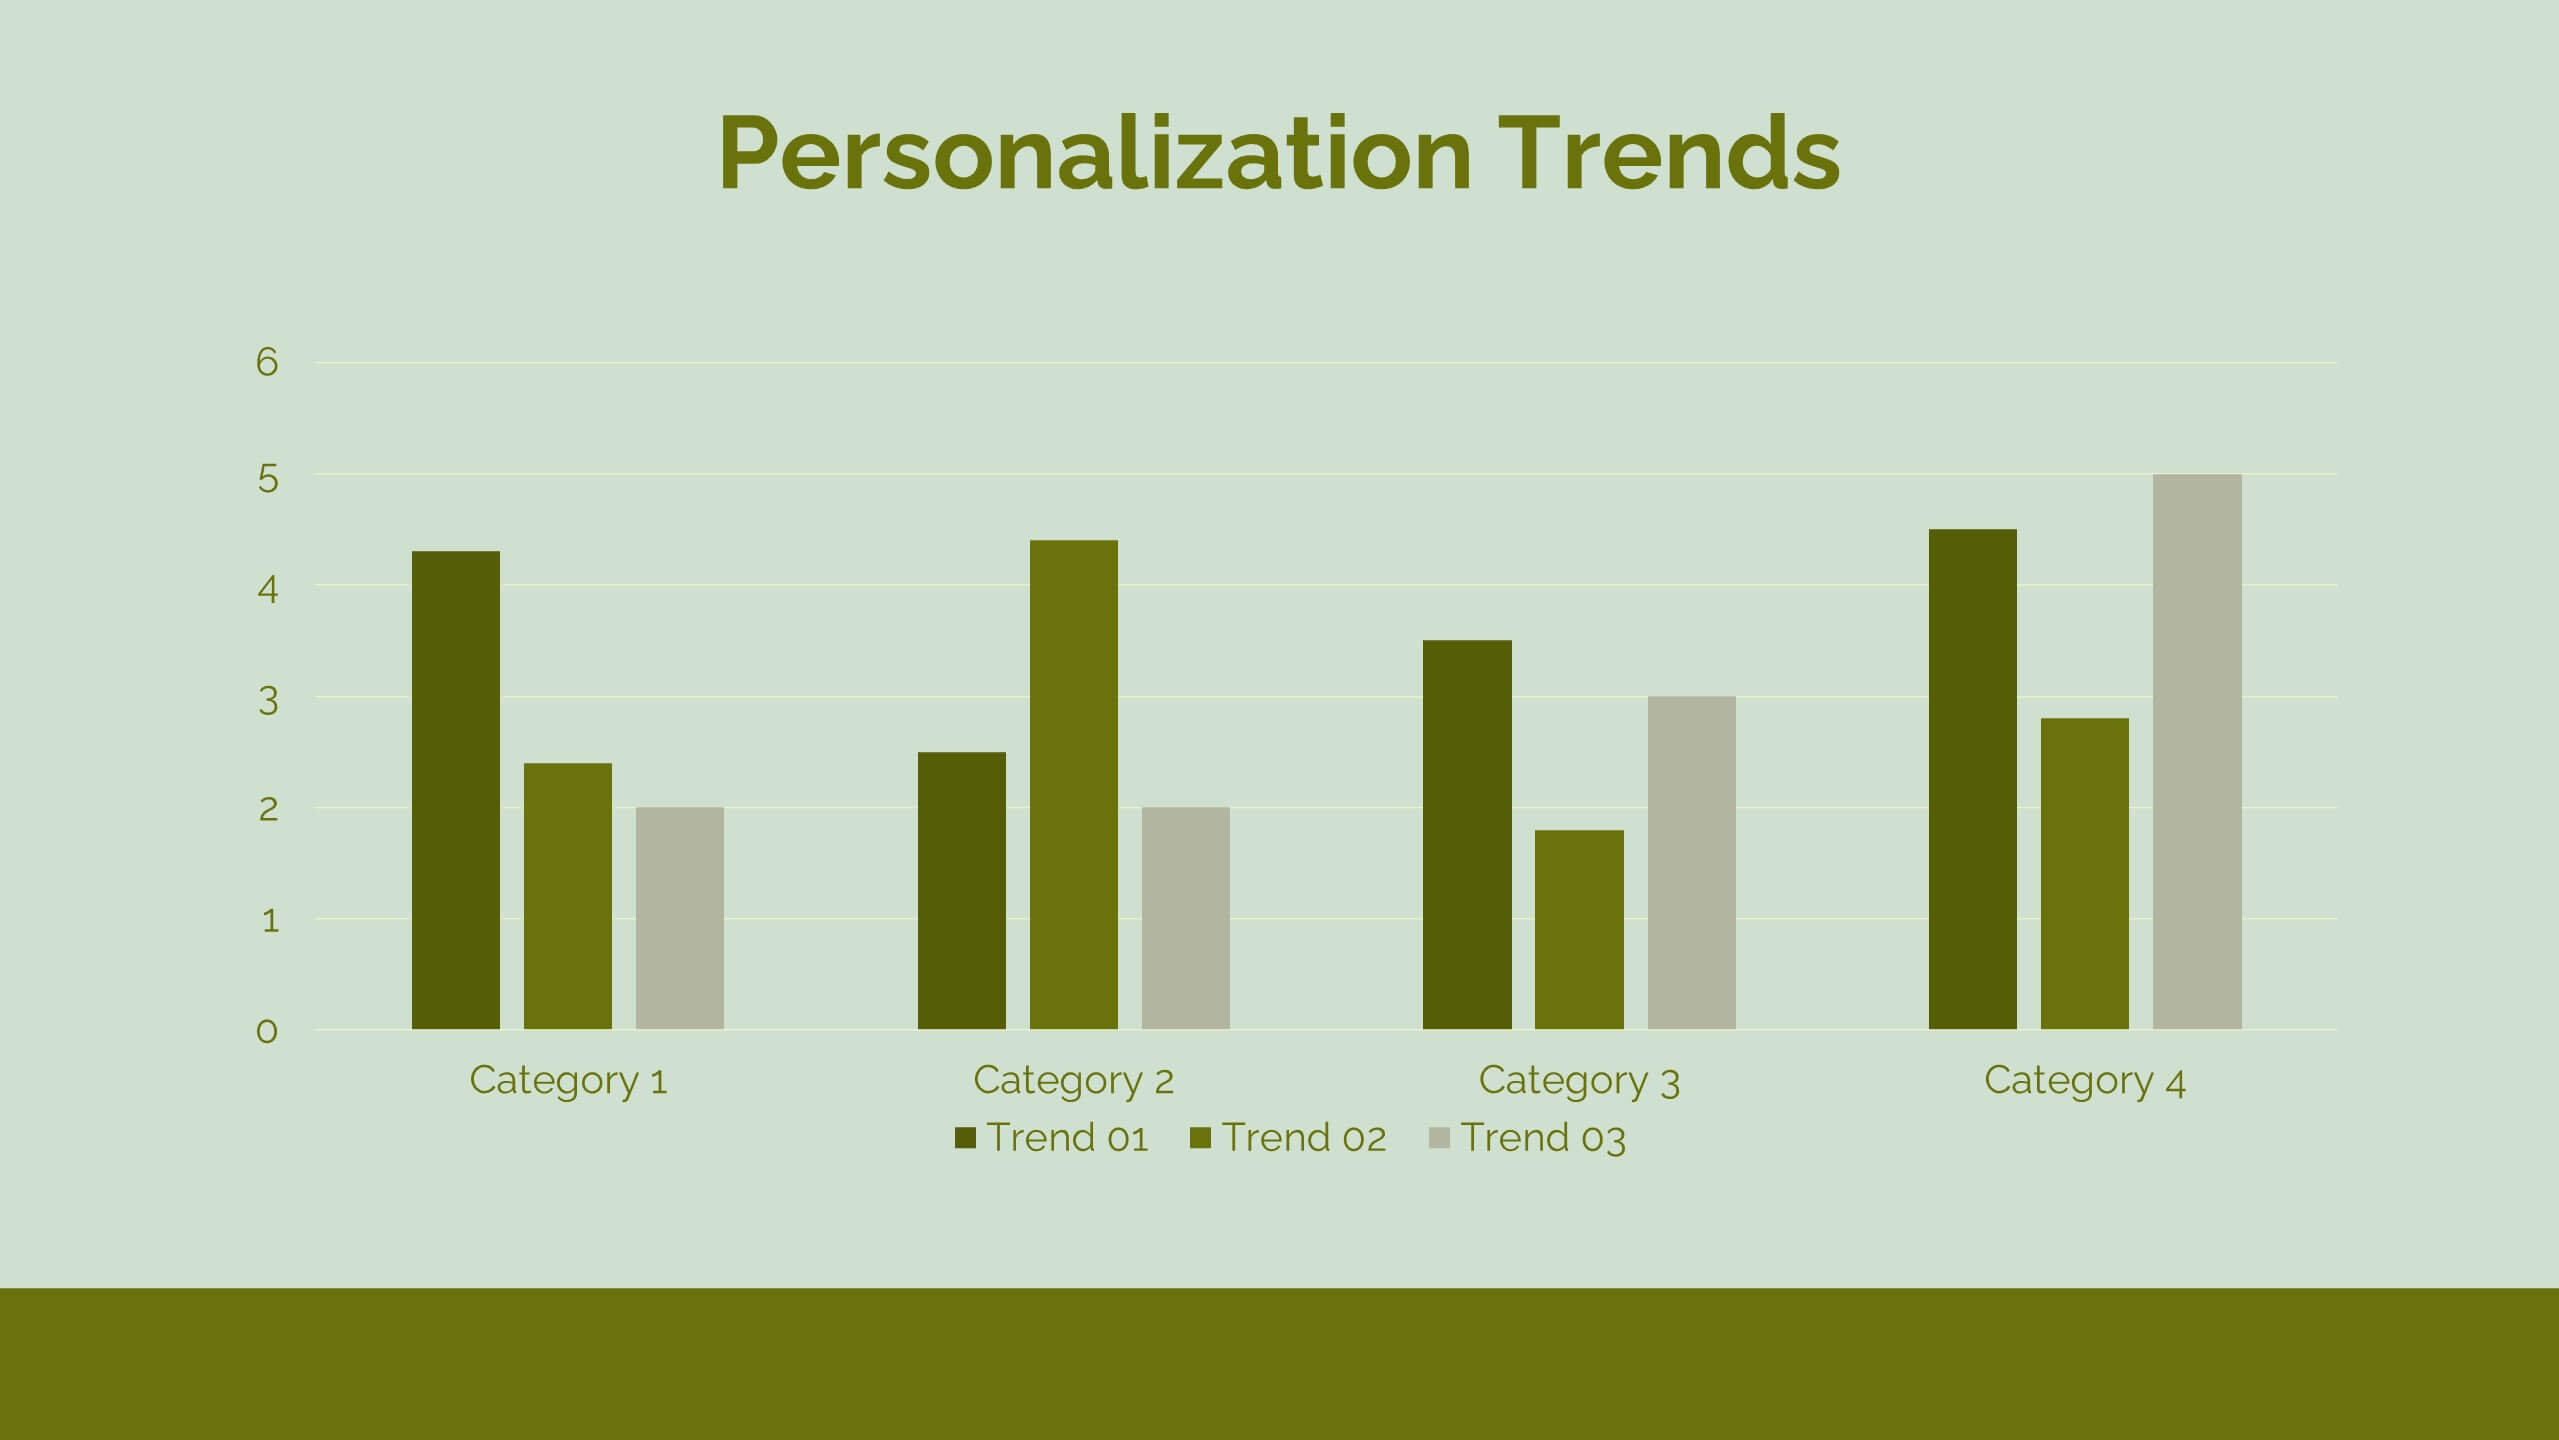
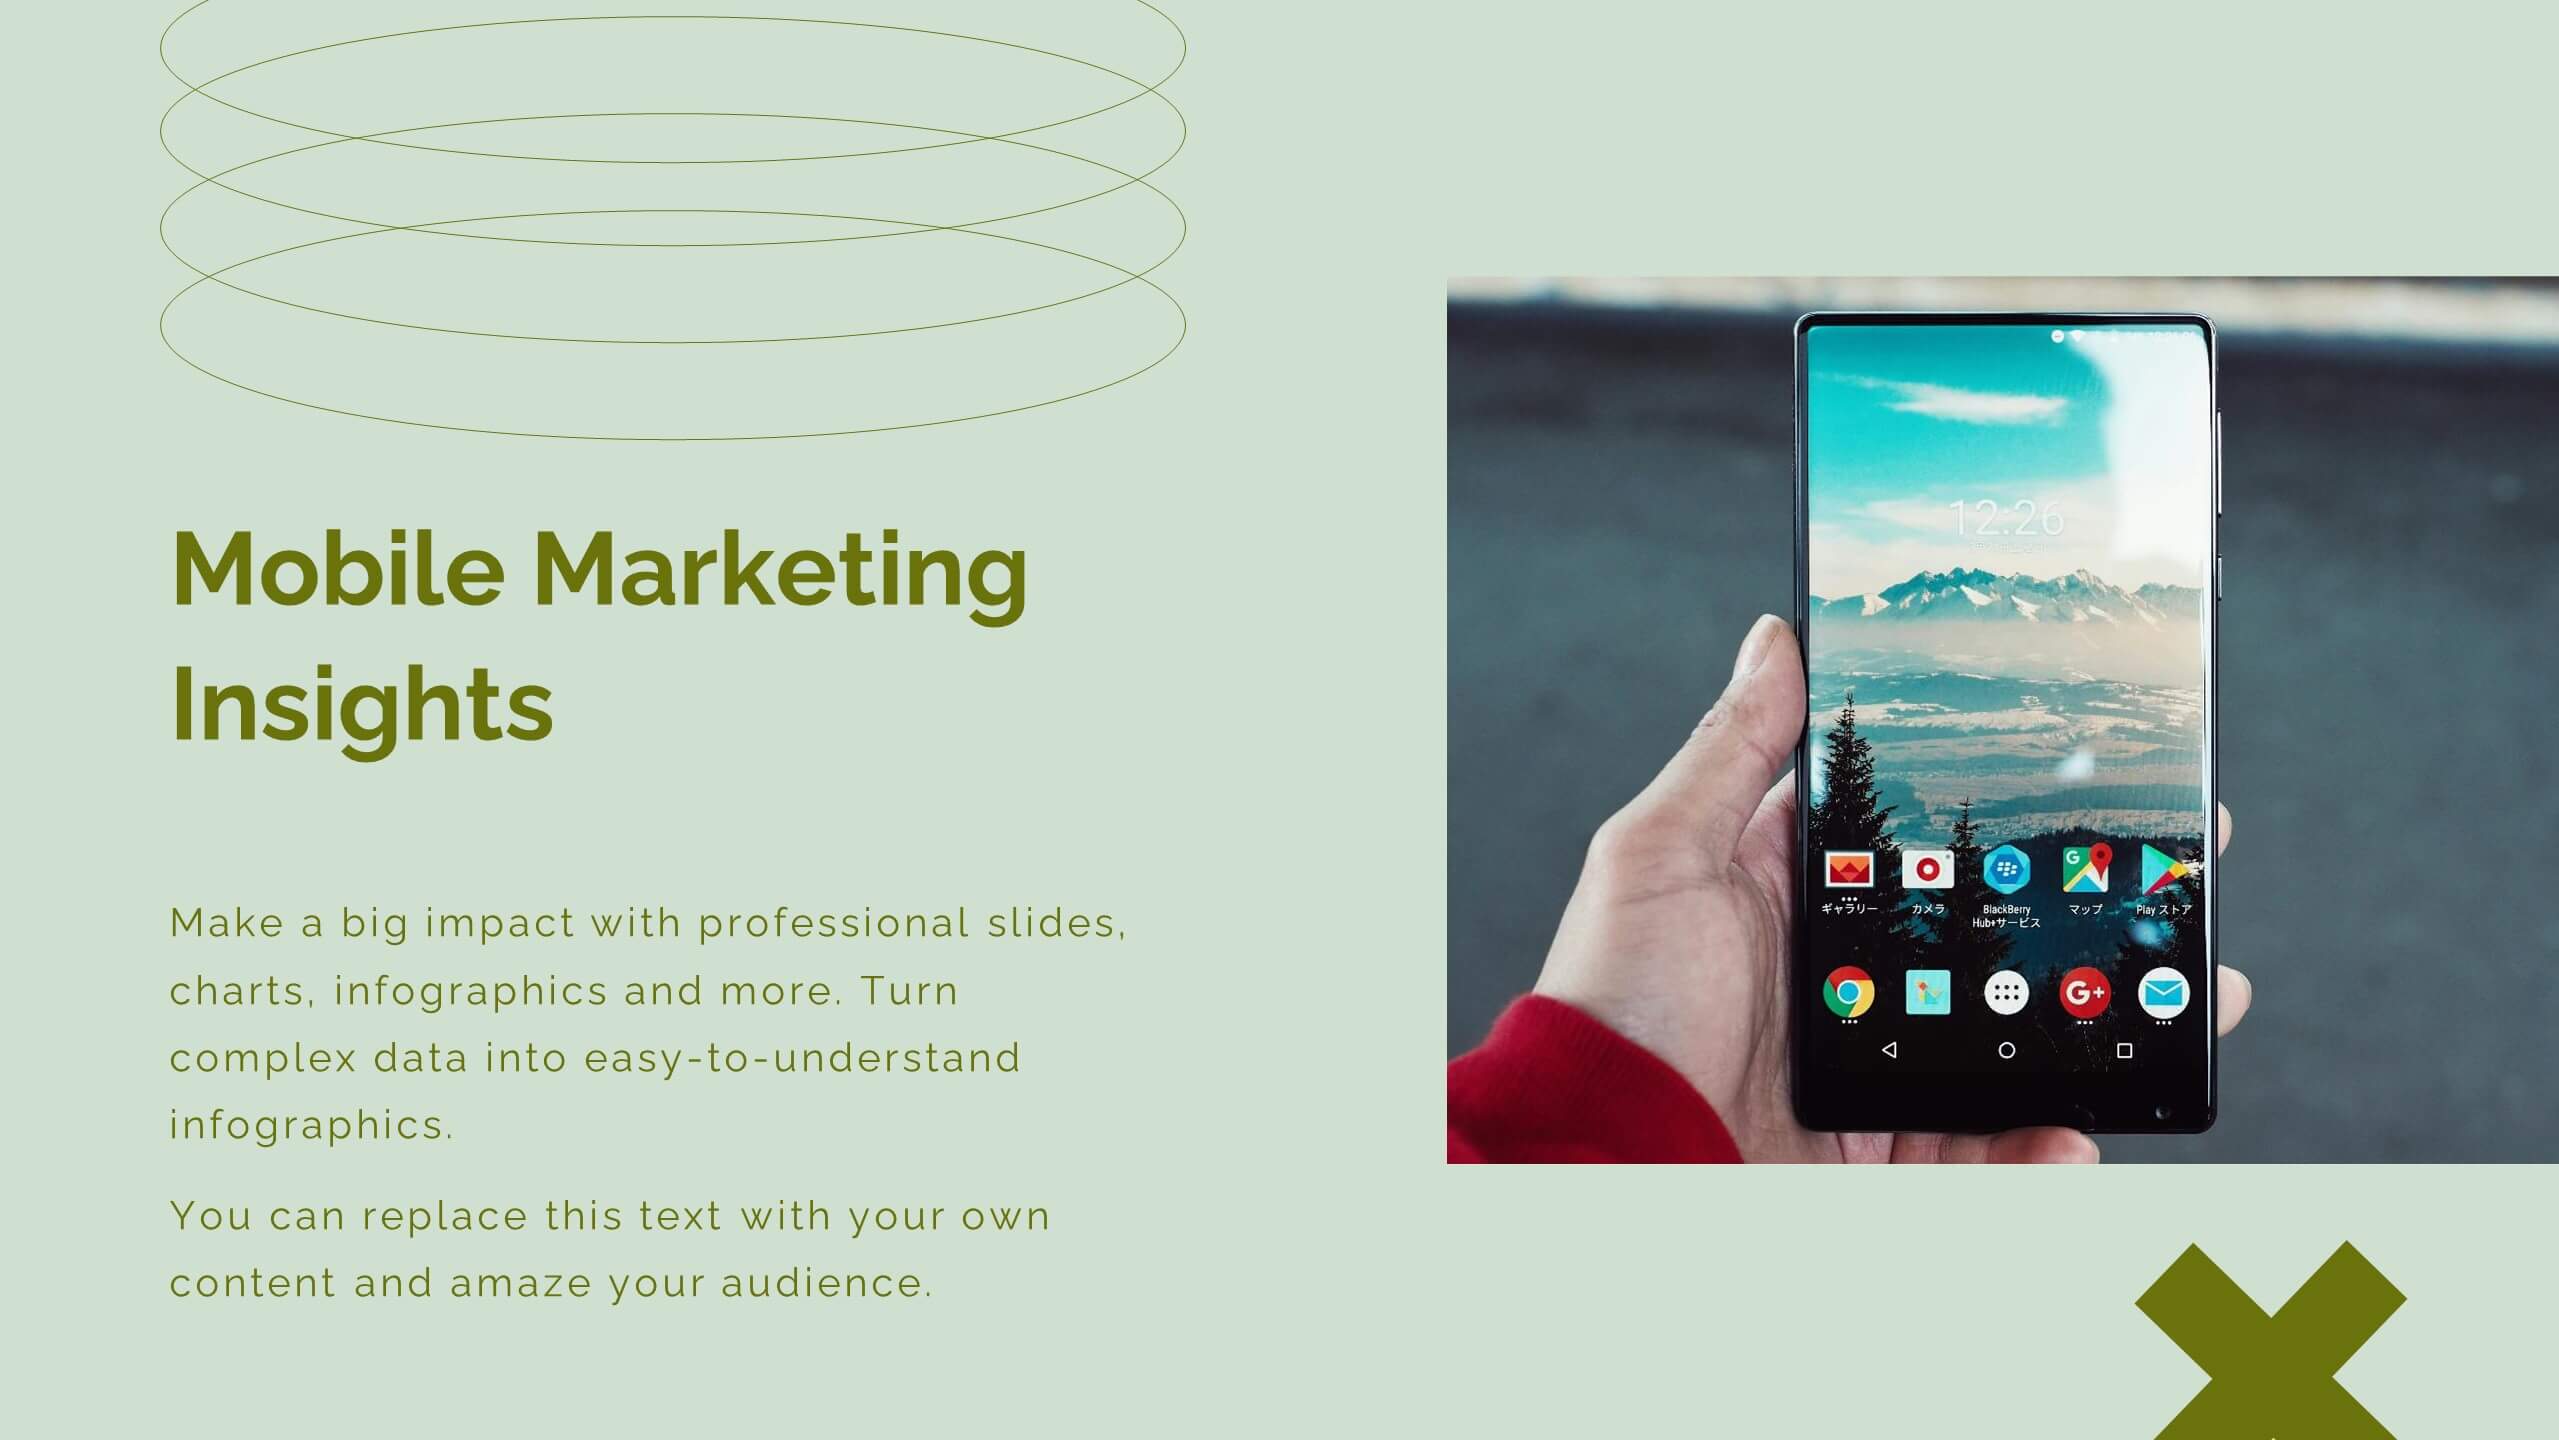
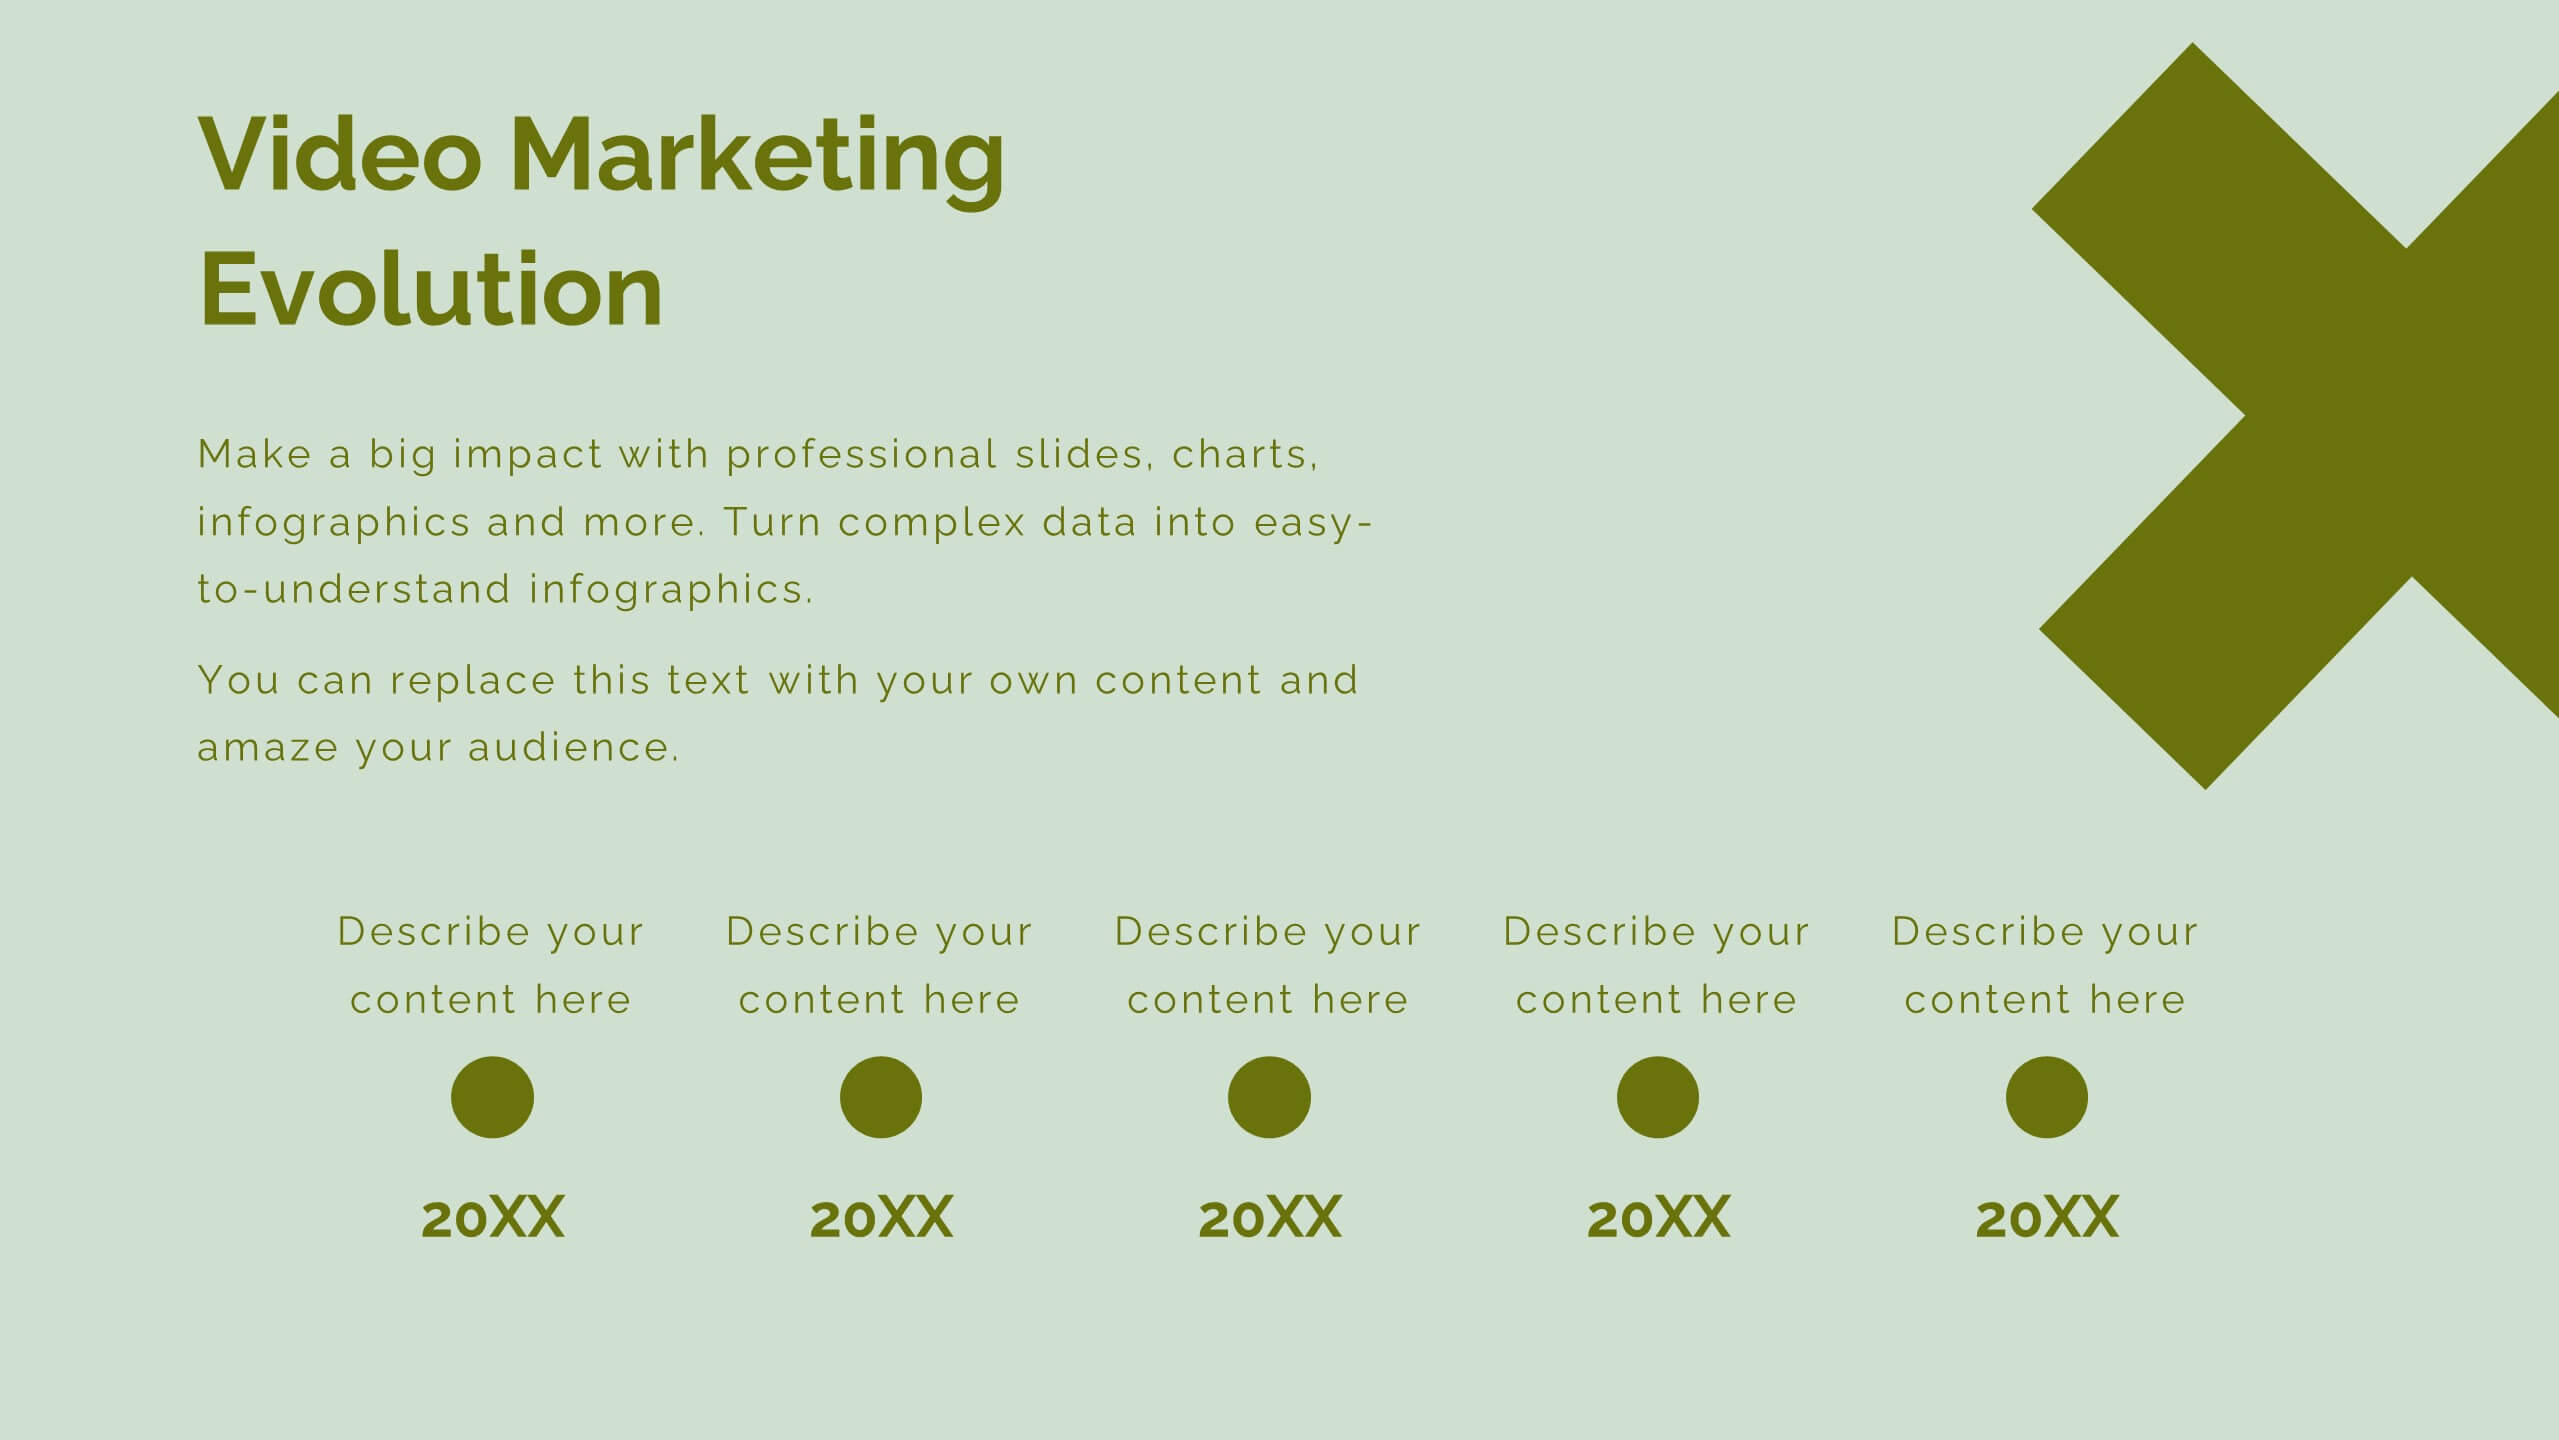
Aura Digital Marketing Strategy Plan Presentation
Revamp your digital marketing strategies with this dynamic template! Covering everything from industry overviews and consumer behavior analysis to emerging technologies and social media strategies, this template has it all. Perfect for creating compelling presentations that highlight data-driven marketing and brand storytelling. Compatible with PowerPoint, Keynote, and Google Slides.


6 slides
Human Resources Project Infographics
This series of infographics from a Human Resources (HR) presentation provides a visual breakdown of key HR functions and strategies. The slides encompass various elements critical to effective HR management: Adoption & Integration: Showcases the initial stages of HR processes, including adoption rates and integration strategies for new systems or policies. Training & Development: Highlights the importance of ongoing employee development through training programs, critical for fostering employee skills and organizational growth. Retention & Maintenance: Focuses on strategies to retain talent within the organization, such as engagement initiatives and competitive compensation structures. Performance & Evaluation: Details the methods for assessing employee performance and the criteria used for evaluations, ensuring alignment with organizational goals. Recruitment to Retirement: Outlines the employee lifecycle from recruitment to retirement, showing the comprehensive approach of HR in managing employee journeys. Each slide utilizes charts, process diagrams, and bullet points to clearly communicate the steps and processes involved, making it easier for the audience to grasp complex HR activities. These visuals are crucial for HR professionals aiming to improve workplace efficiency and employee satisfaction.


6 slides
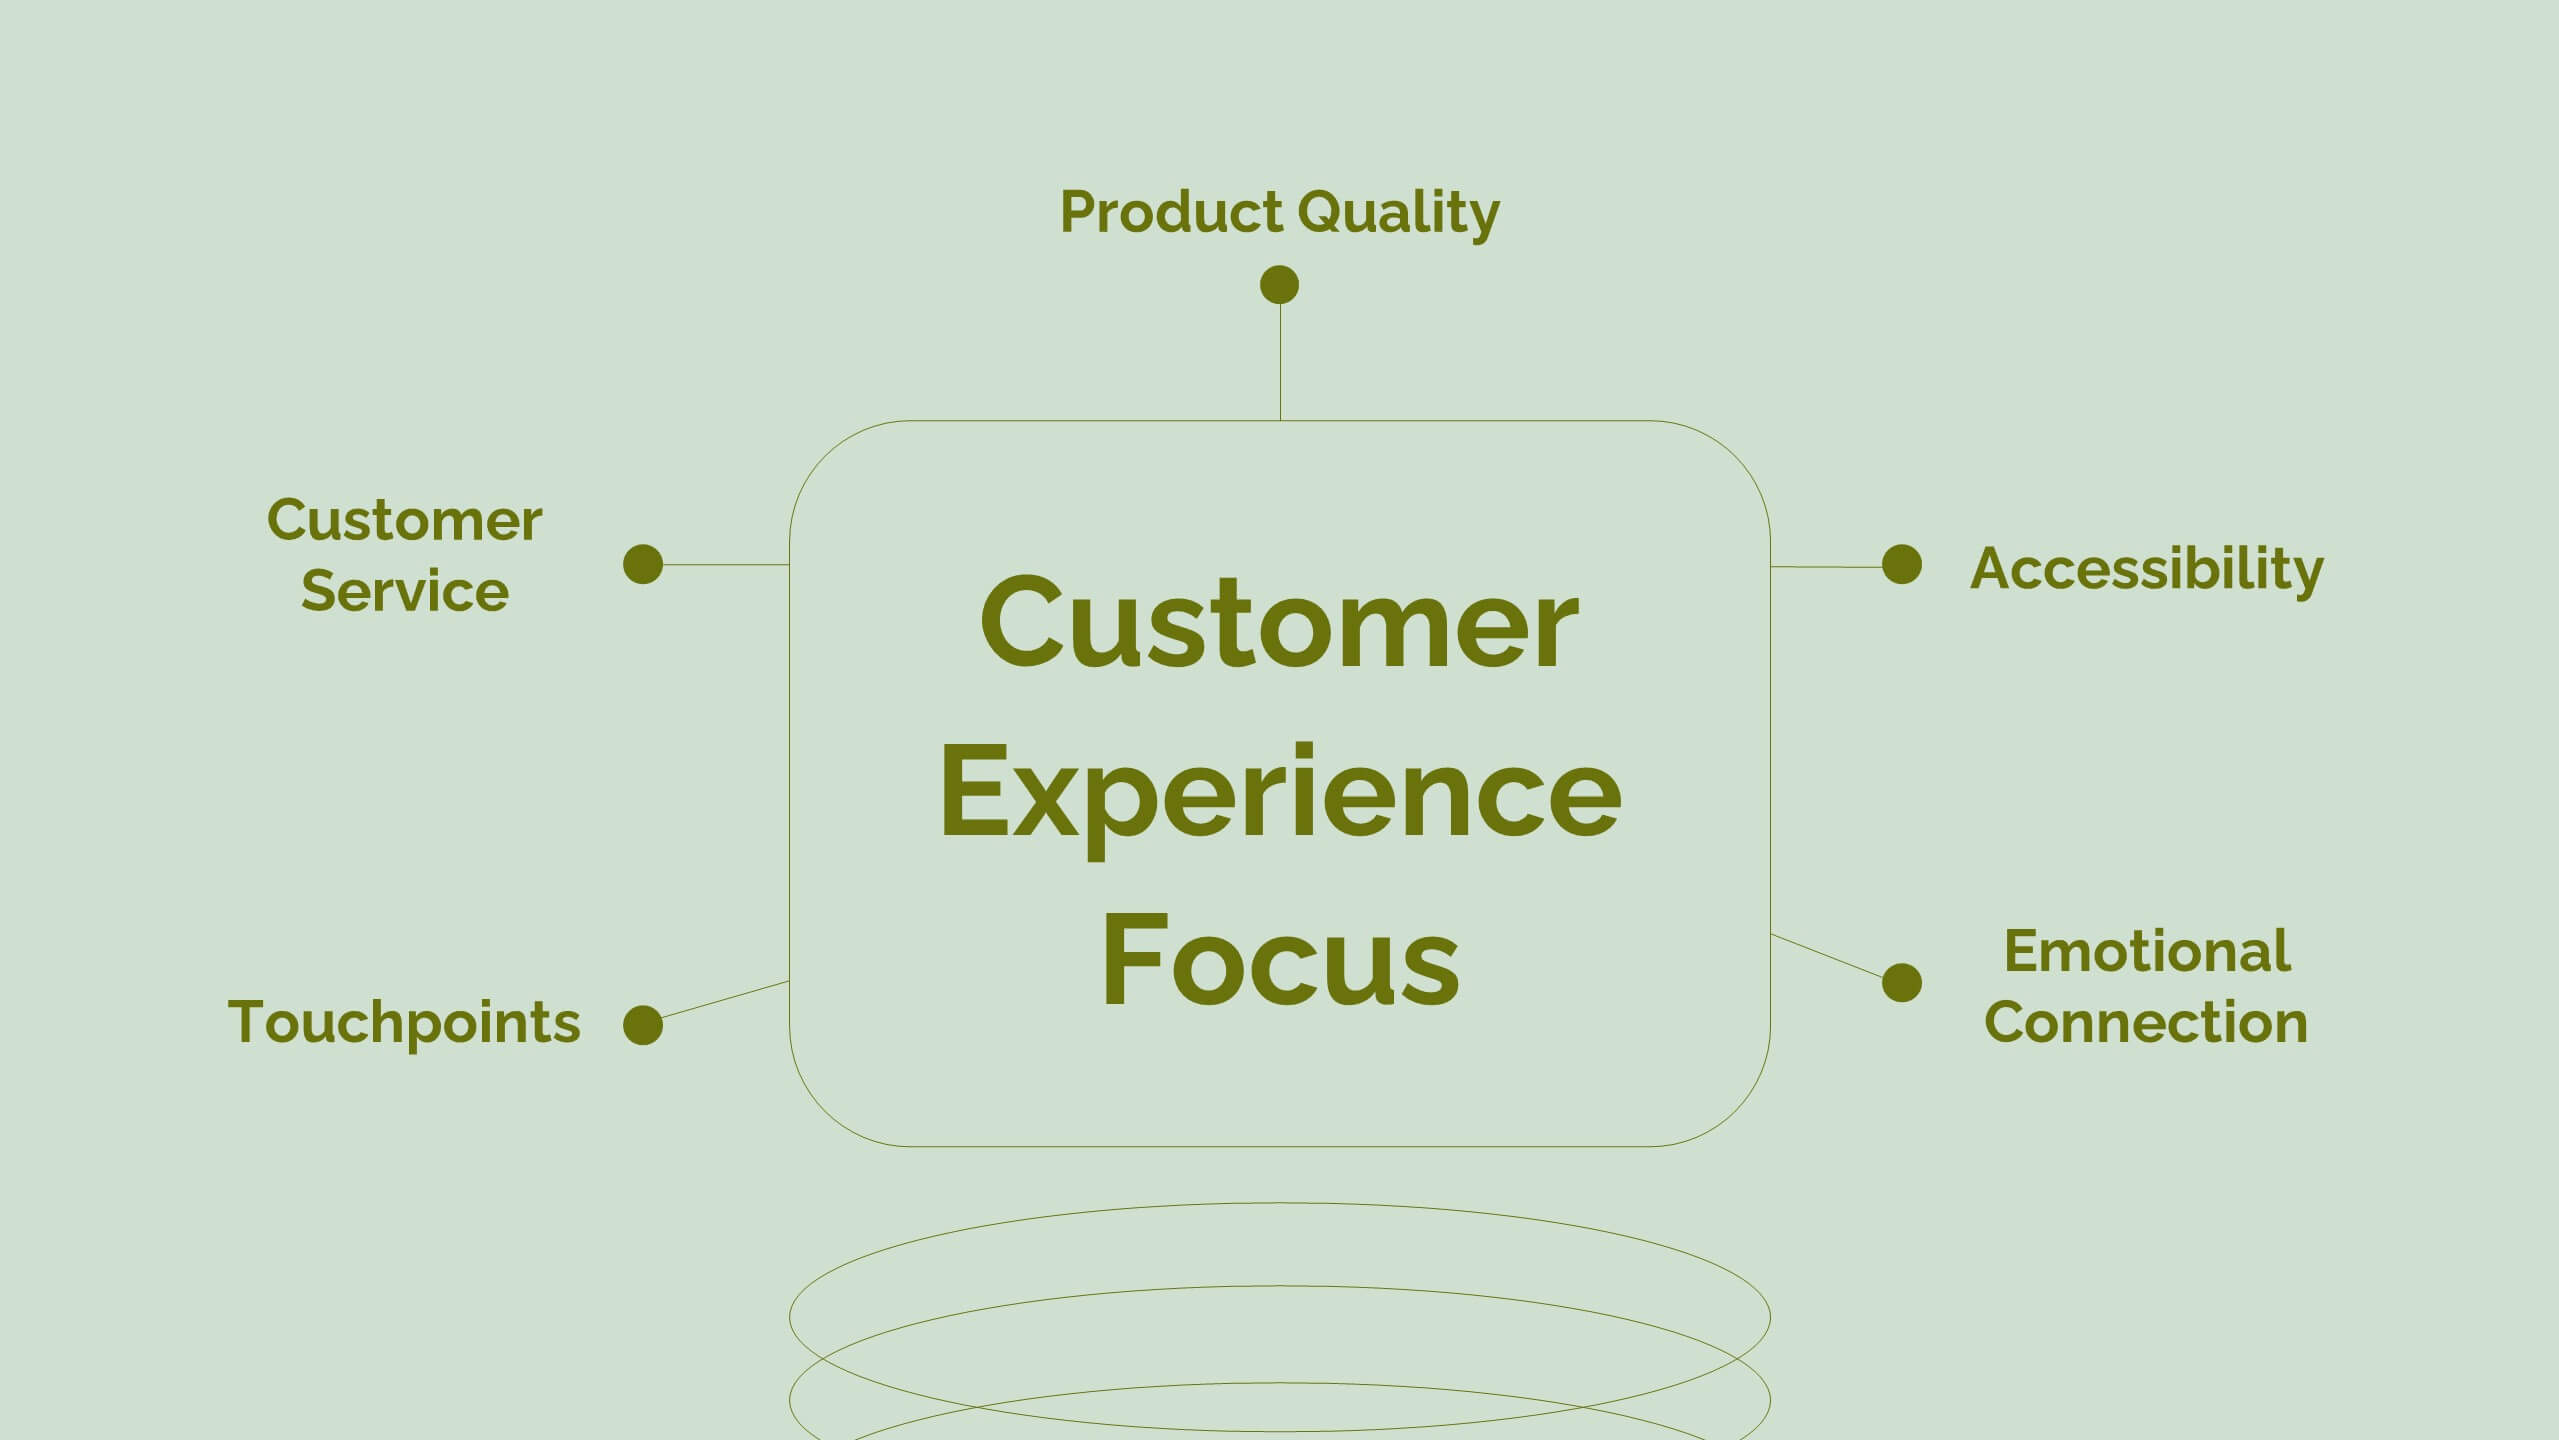
Core Focus Areas in Strategic Wheel Model Presentation
Showcase your business's key focus areas using this five-part strategic wheel layout. Each segment is paired with corresponding labels and editable text fields for streamlined messaging. Ideal for strategy, operations, or team planning. Fully customizable and compatible with PowerPoint, Keynote, and Google Slides to suit any brand style.


21 slides
Glacieron Financial Report Presentation
This Financial Report Presentation Template is a professional and visually engaging tool to showcase financial performance, key metrics, and strategic initiatives. It includes slides for performance metrics, financial summaries, competitor insights, and future goals, making it ideal for business reviews and stakeholder meetings. Compatible with PowerPoint, Keynote, and Google Slides for easy customization.

21 slides
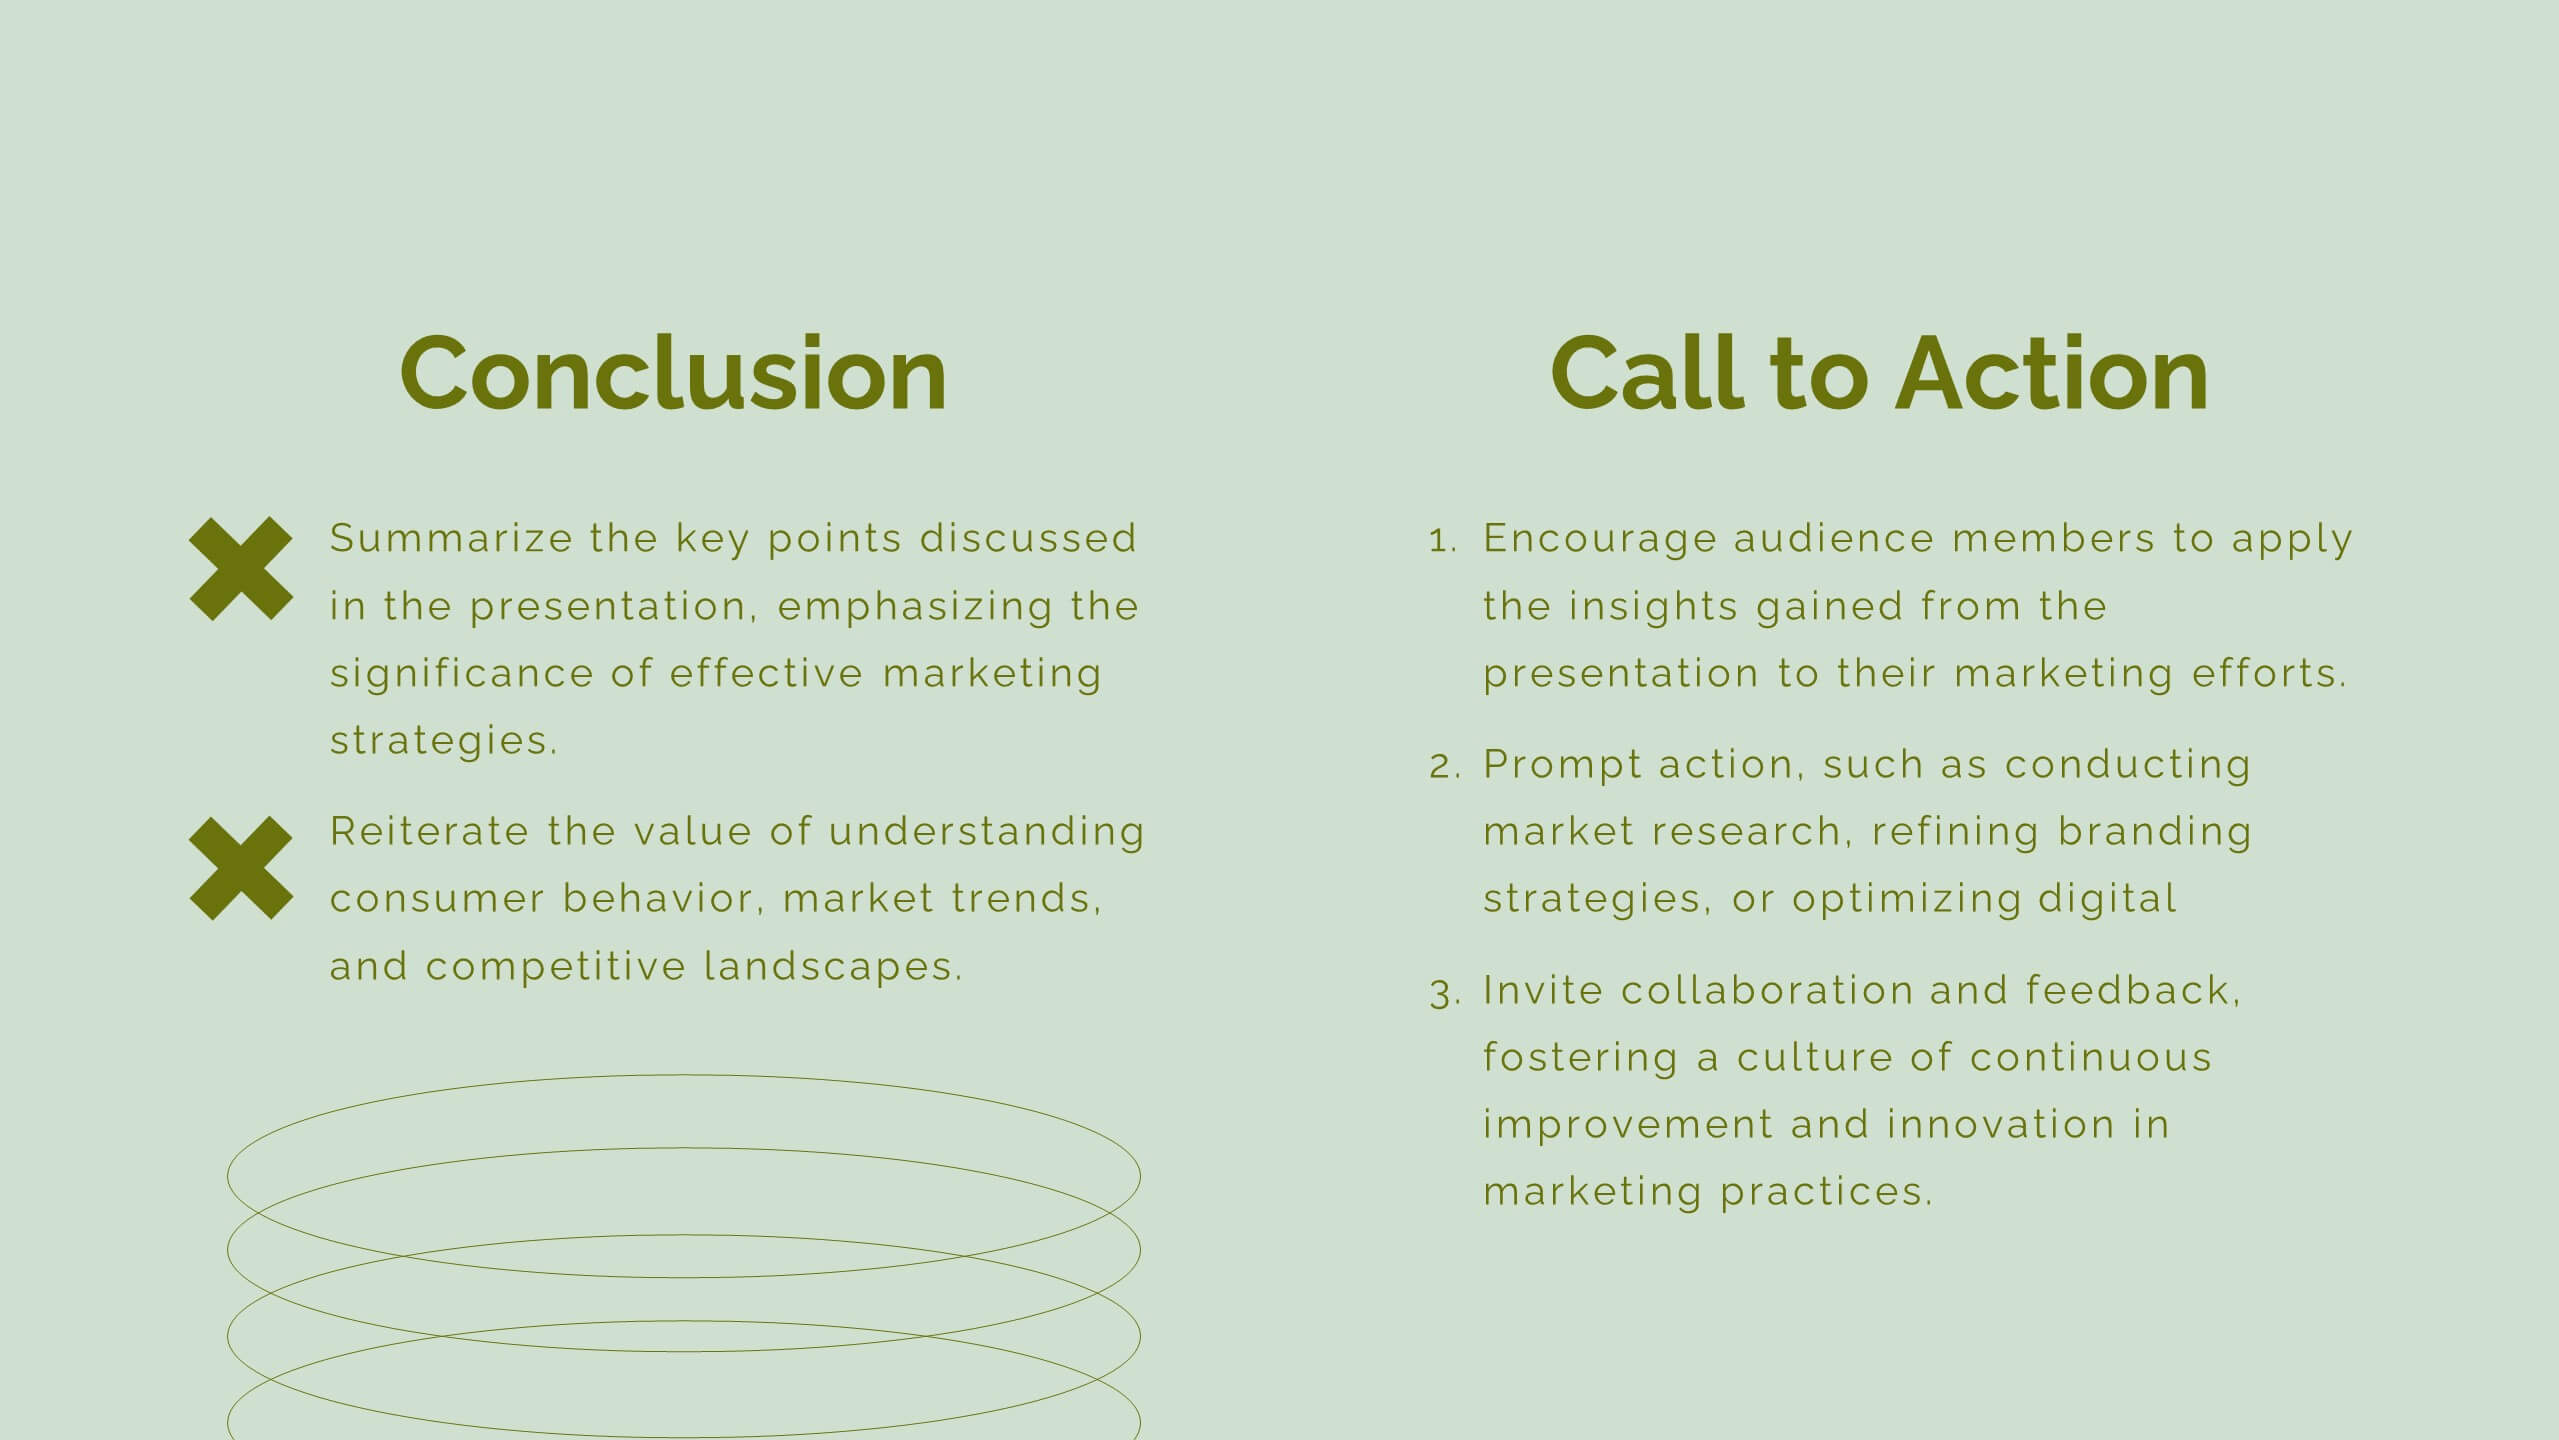
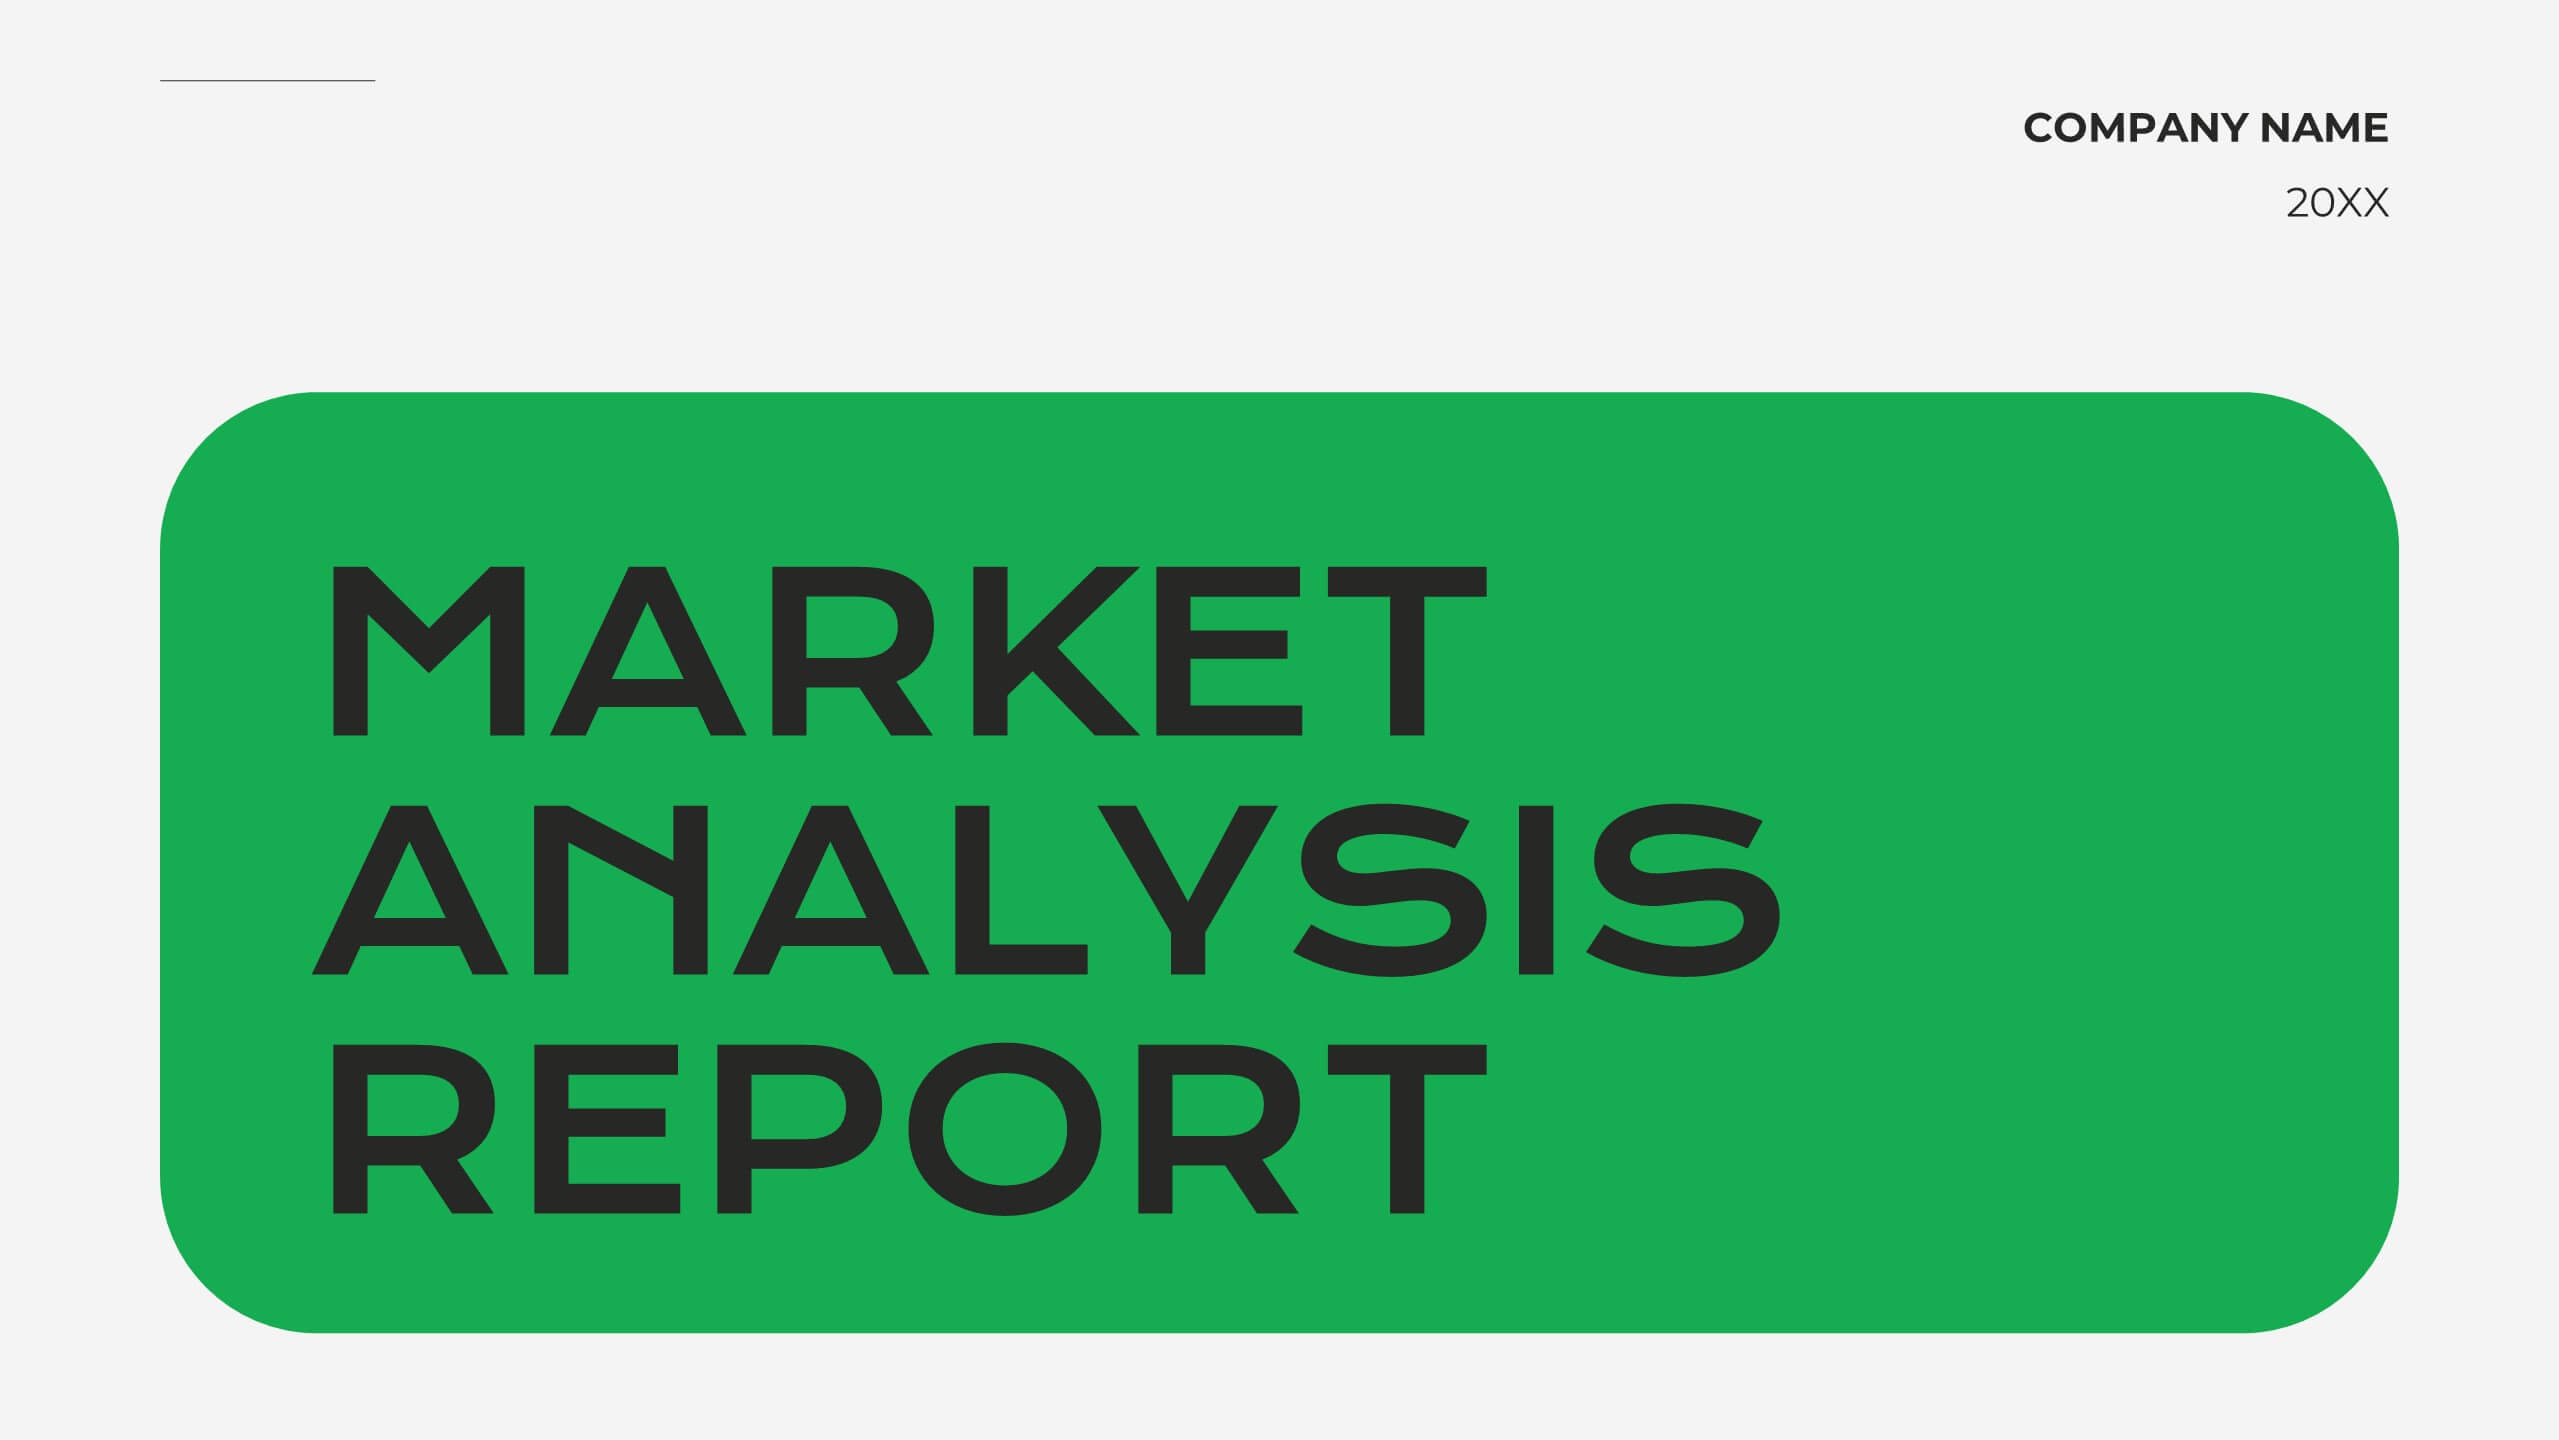
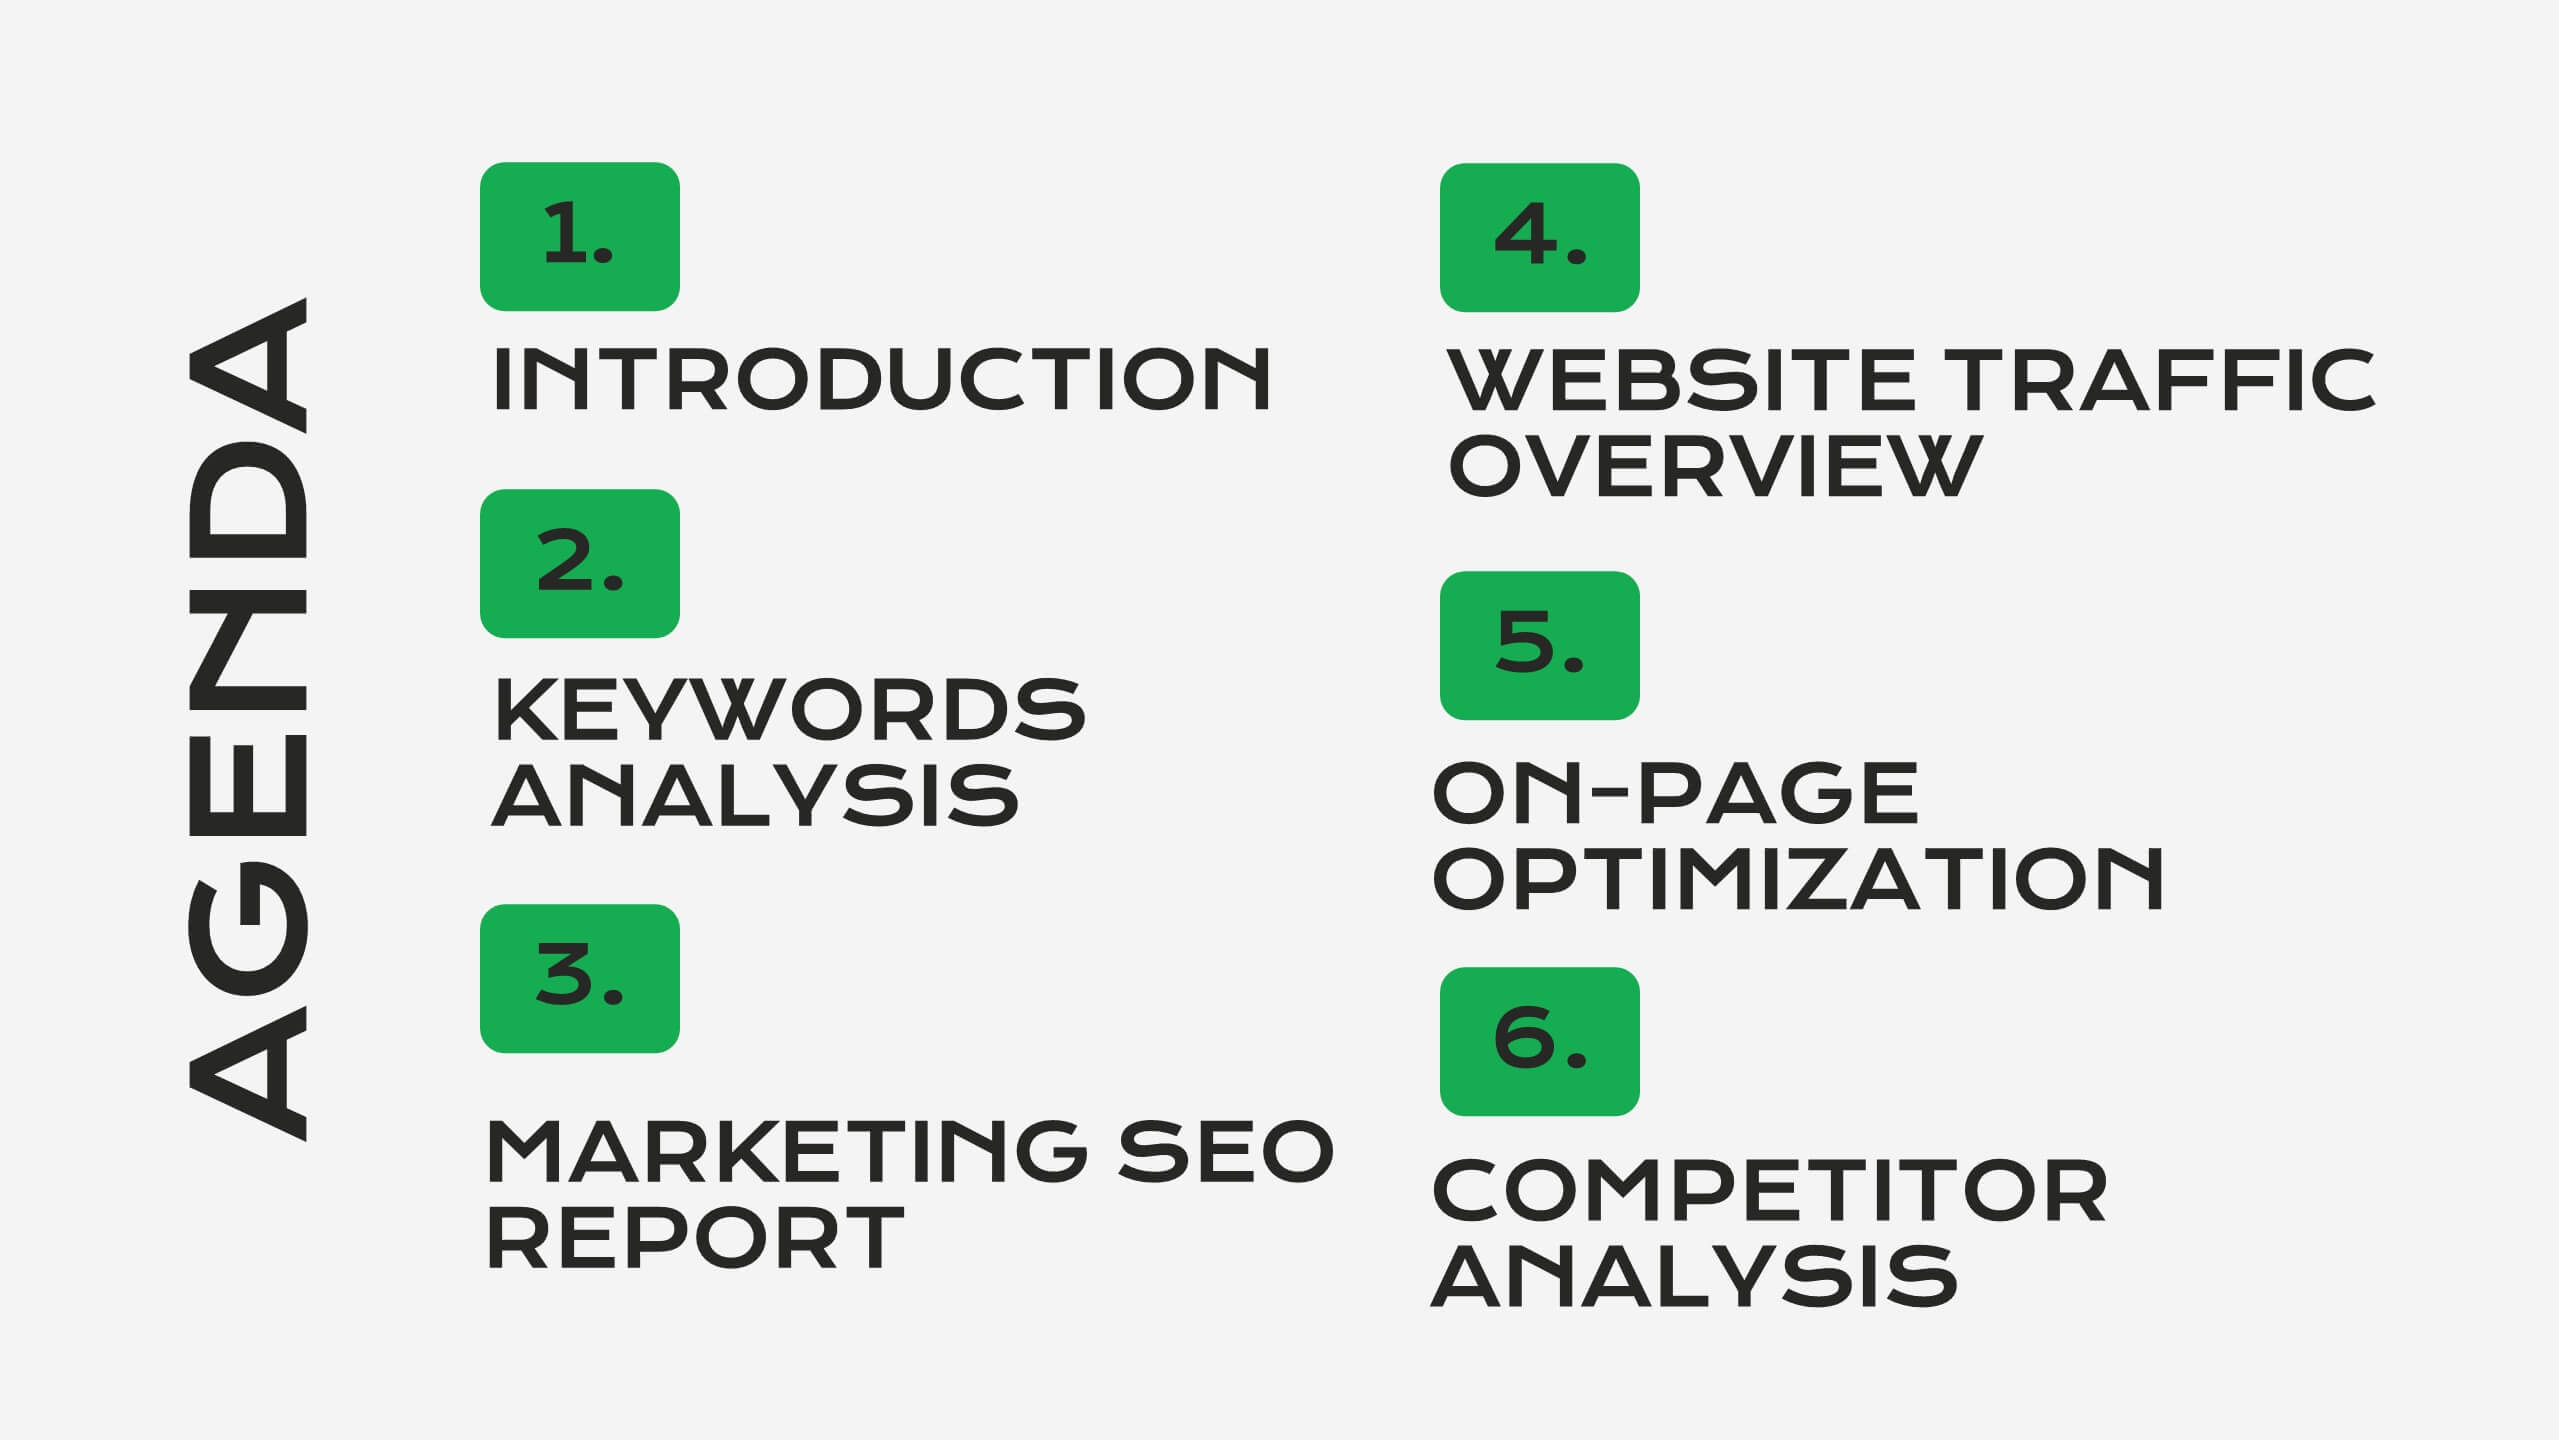
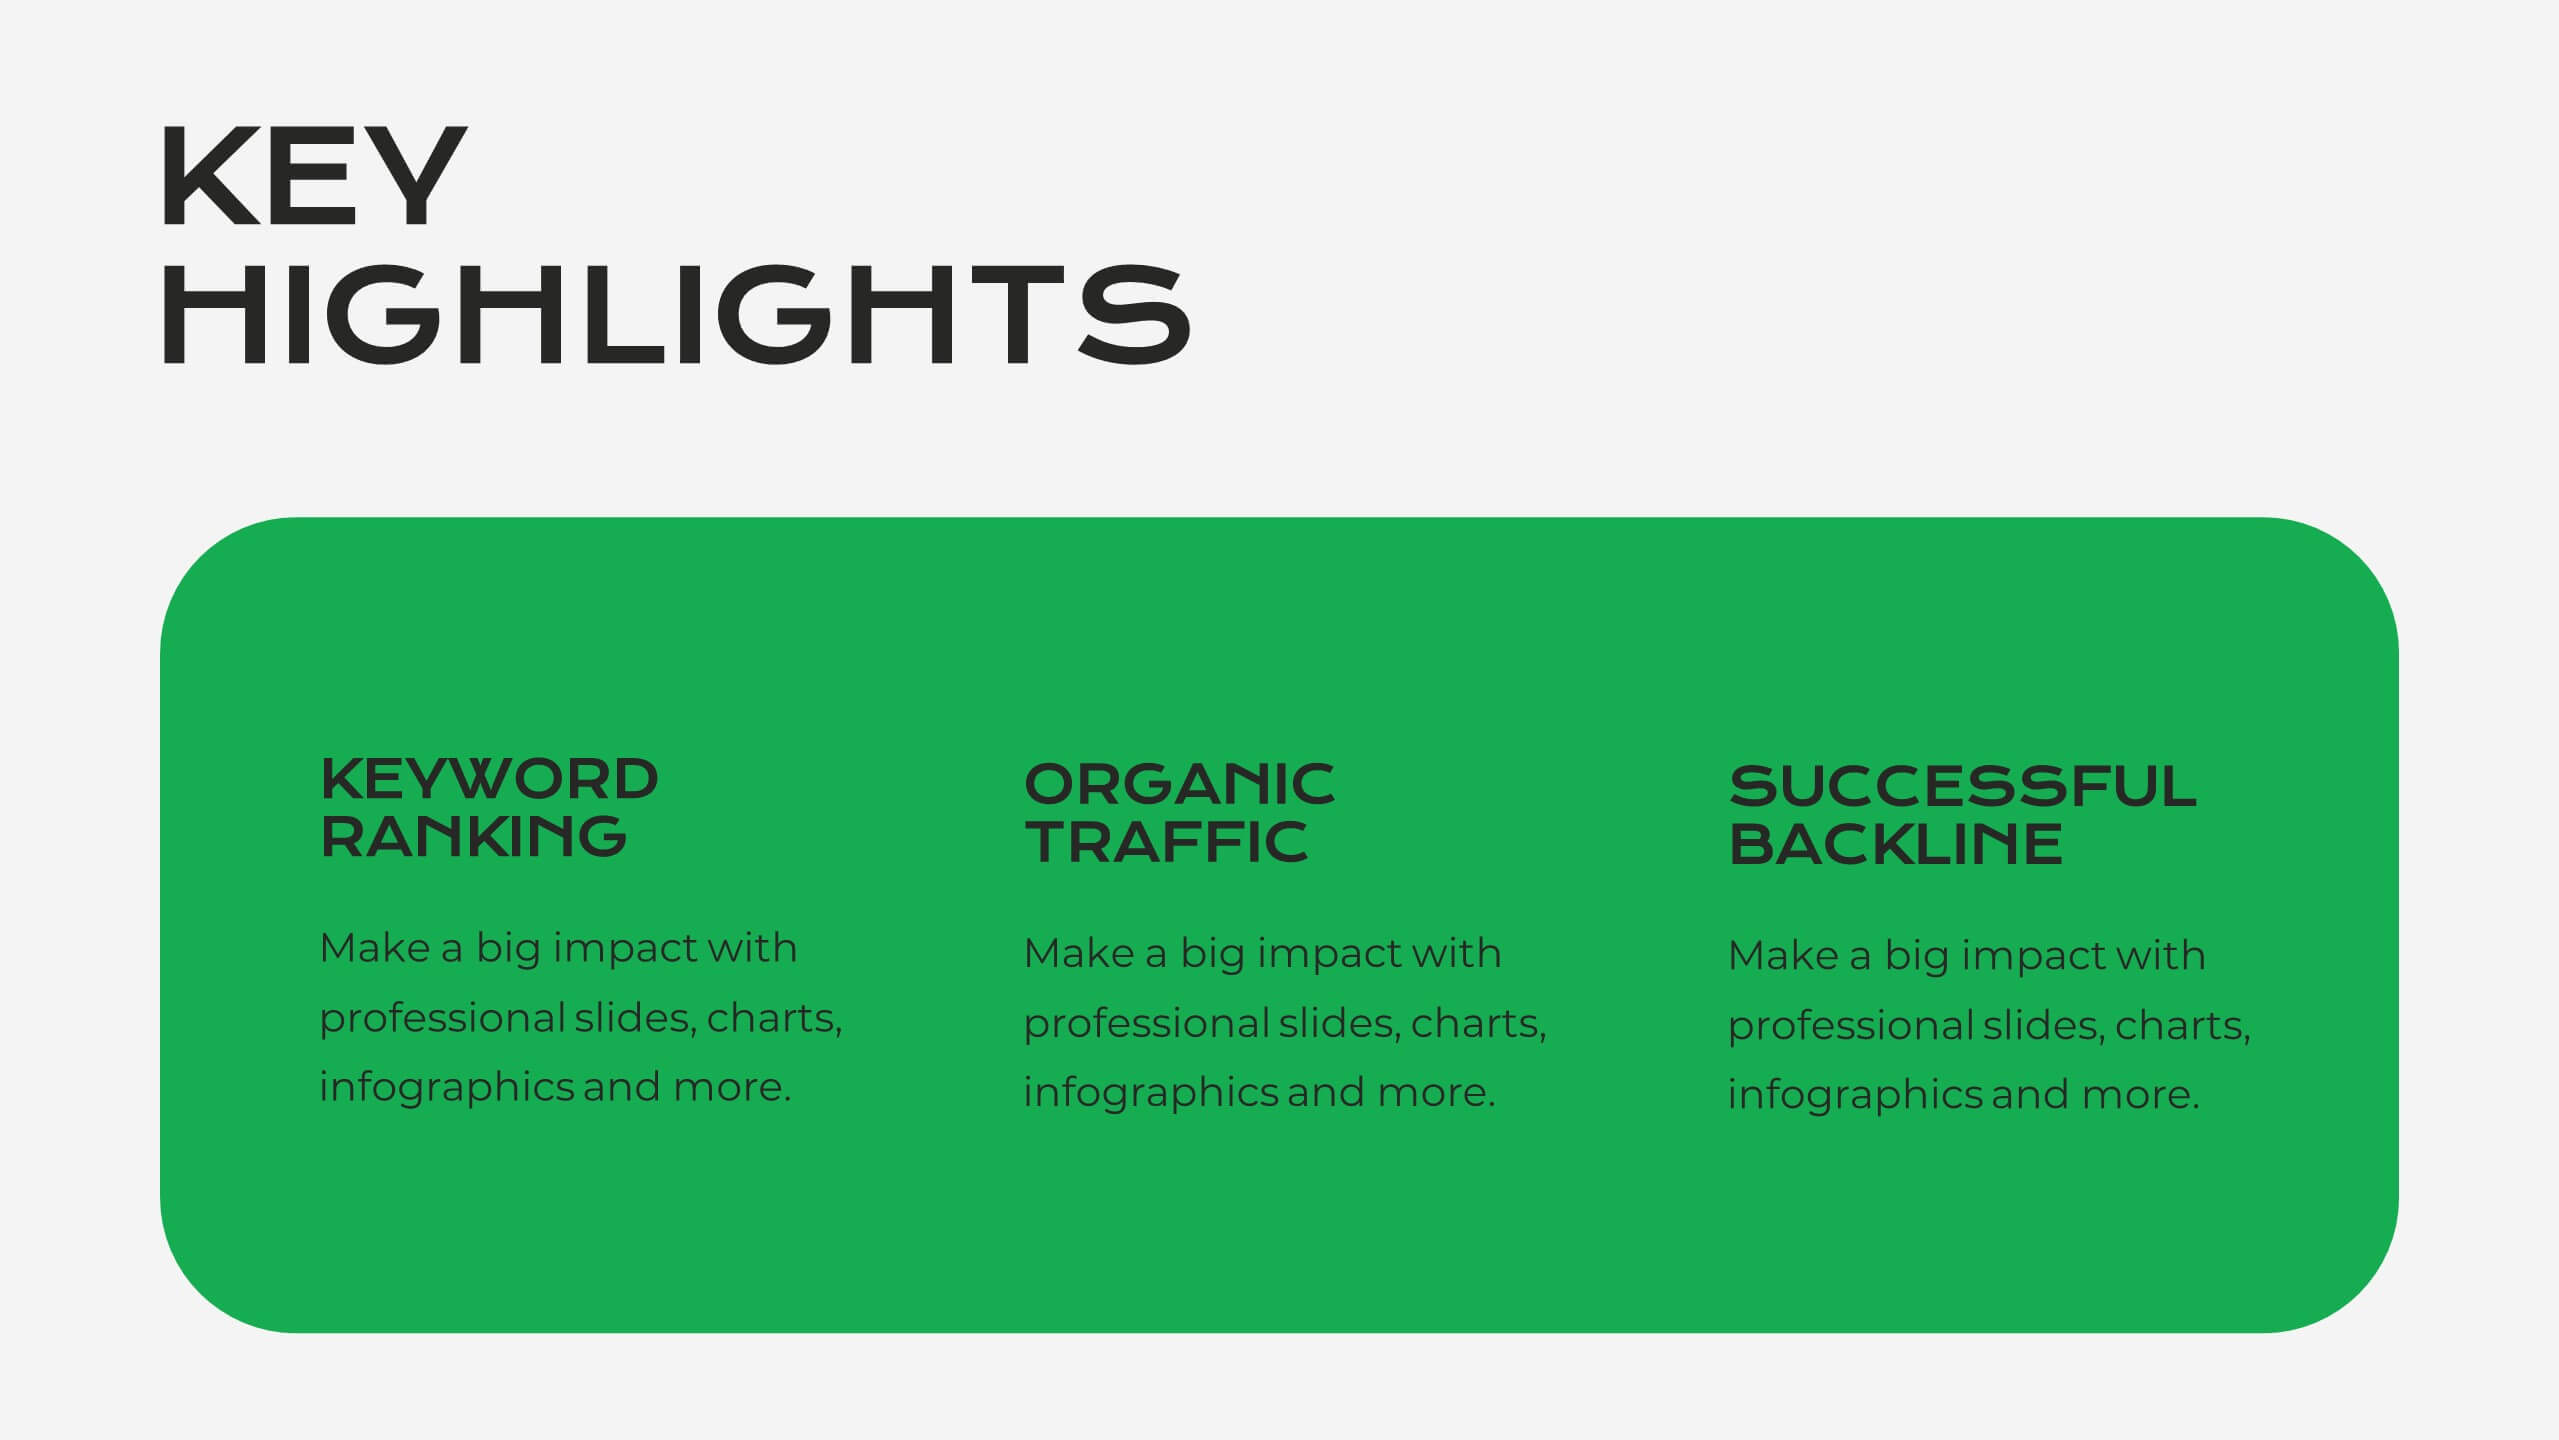
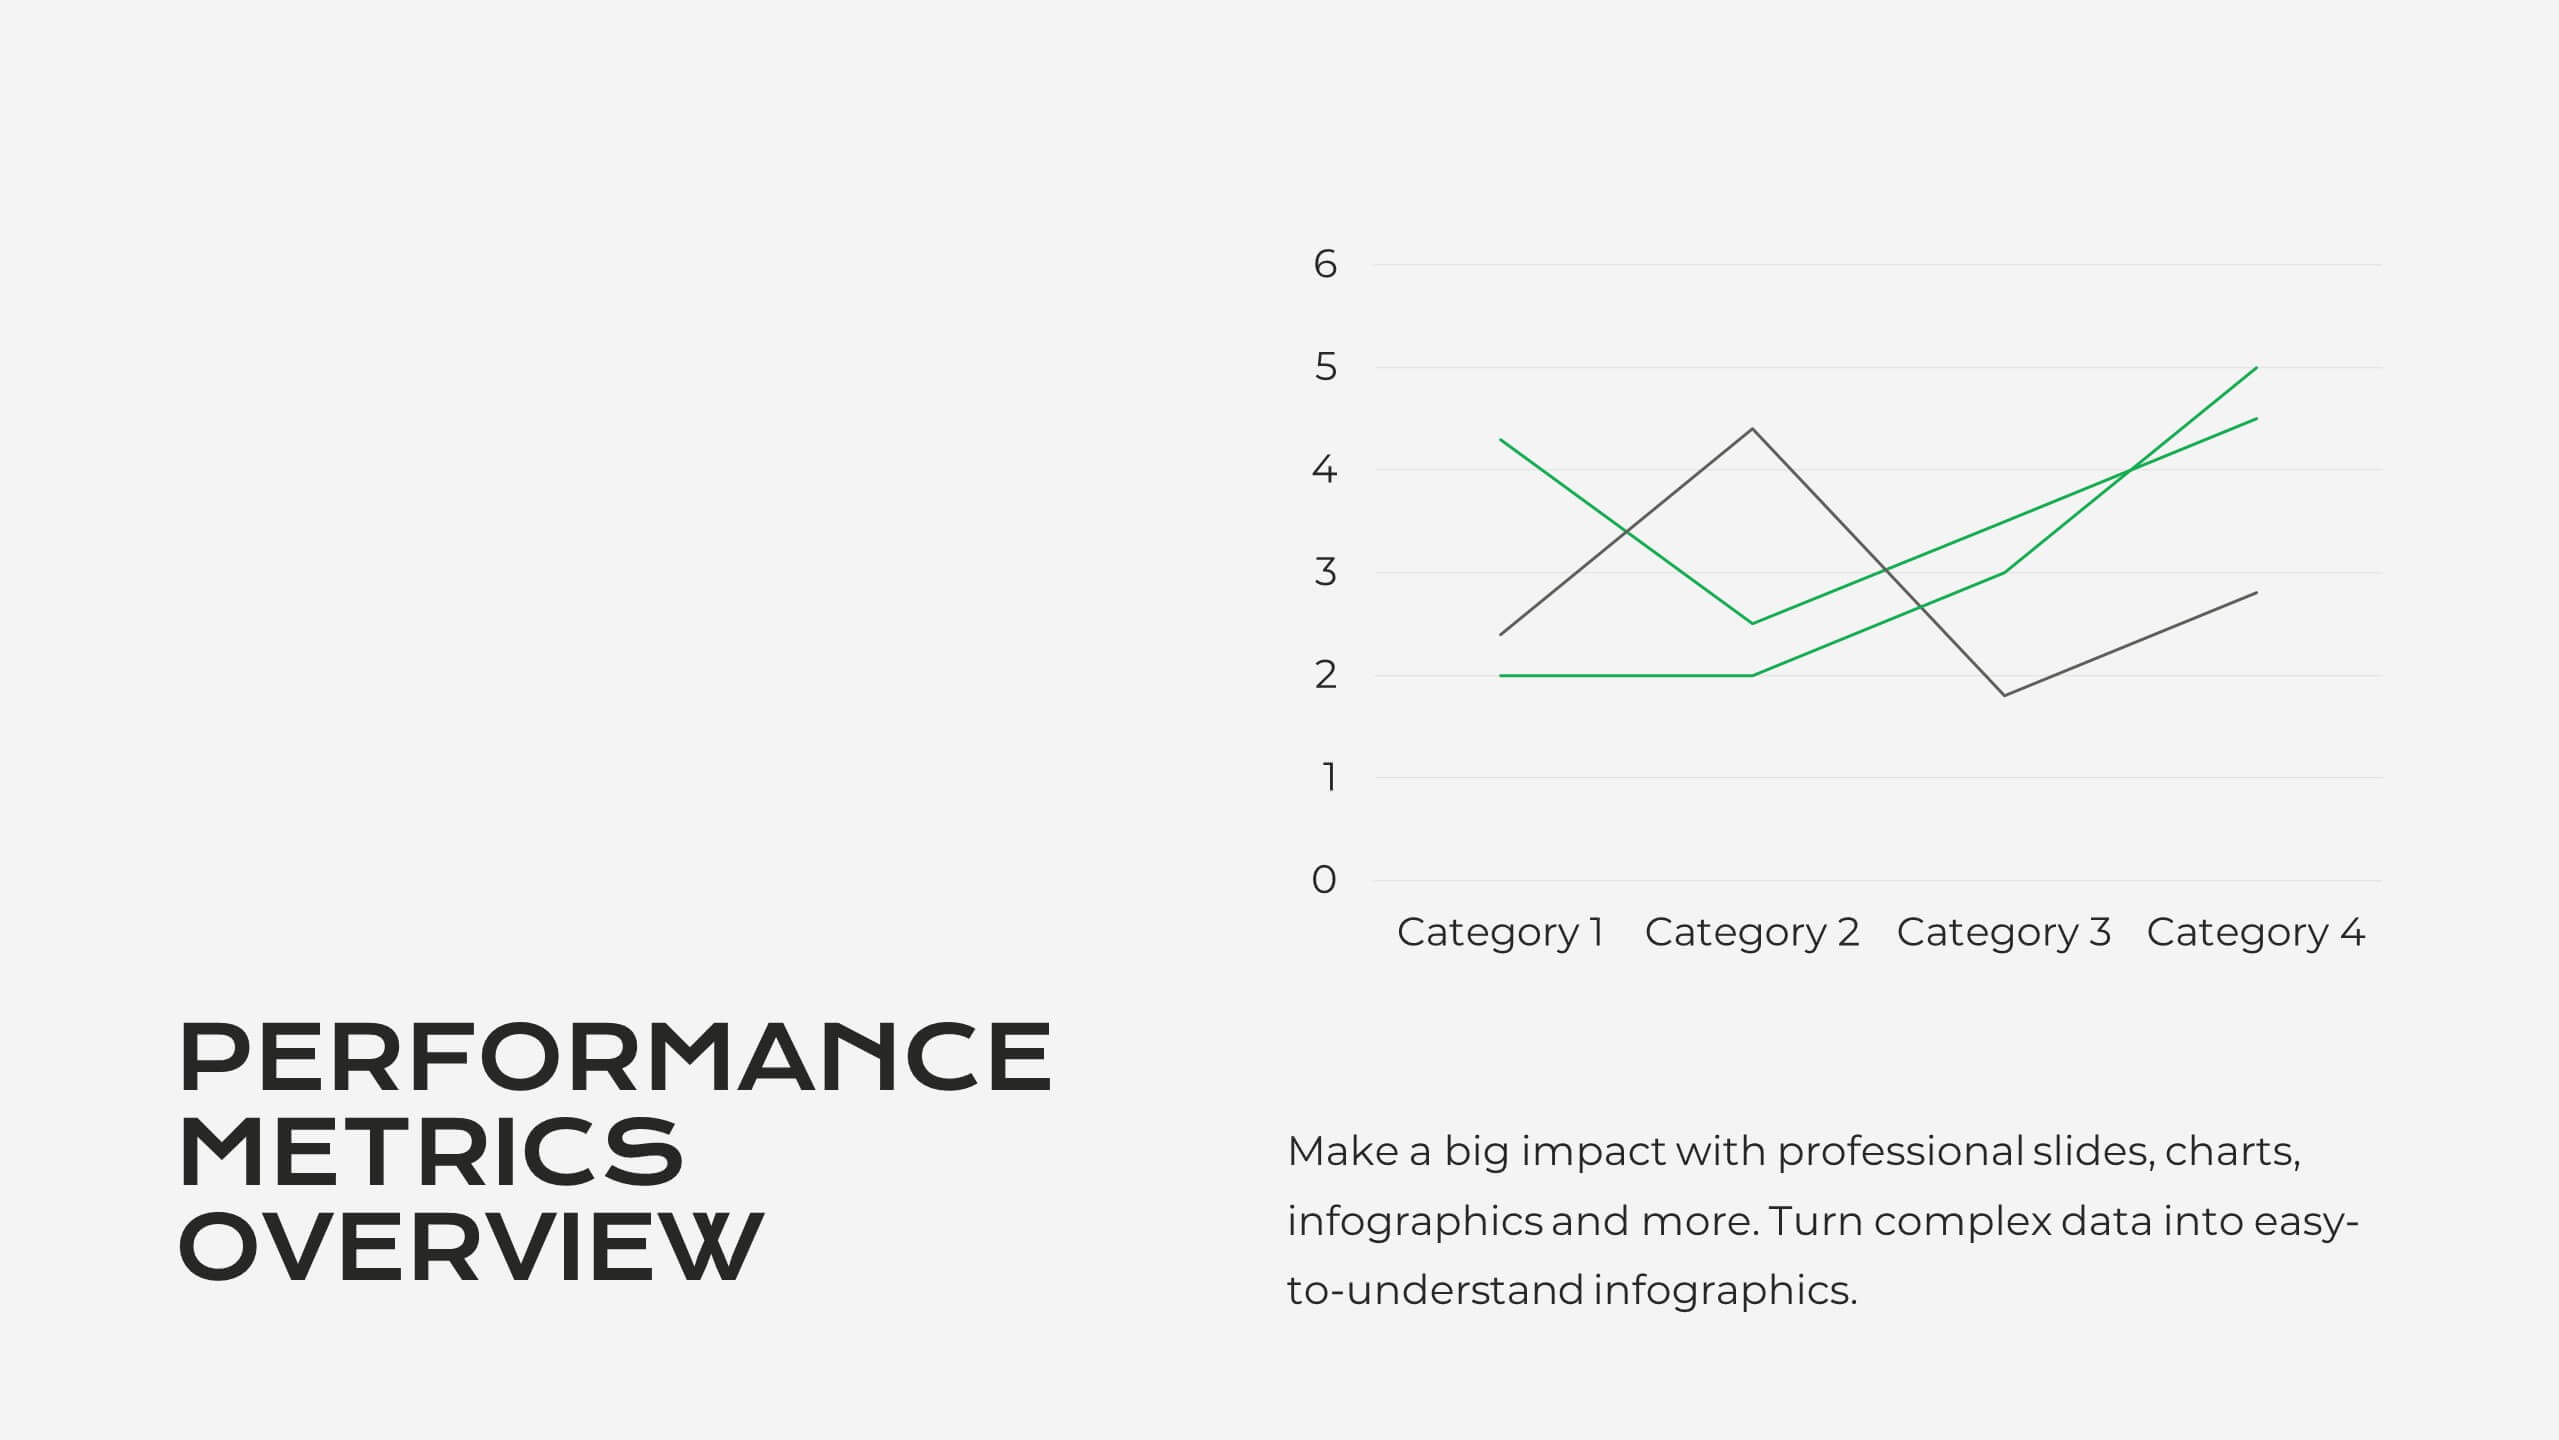
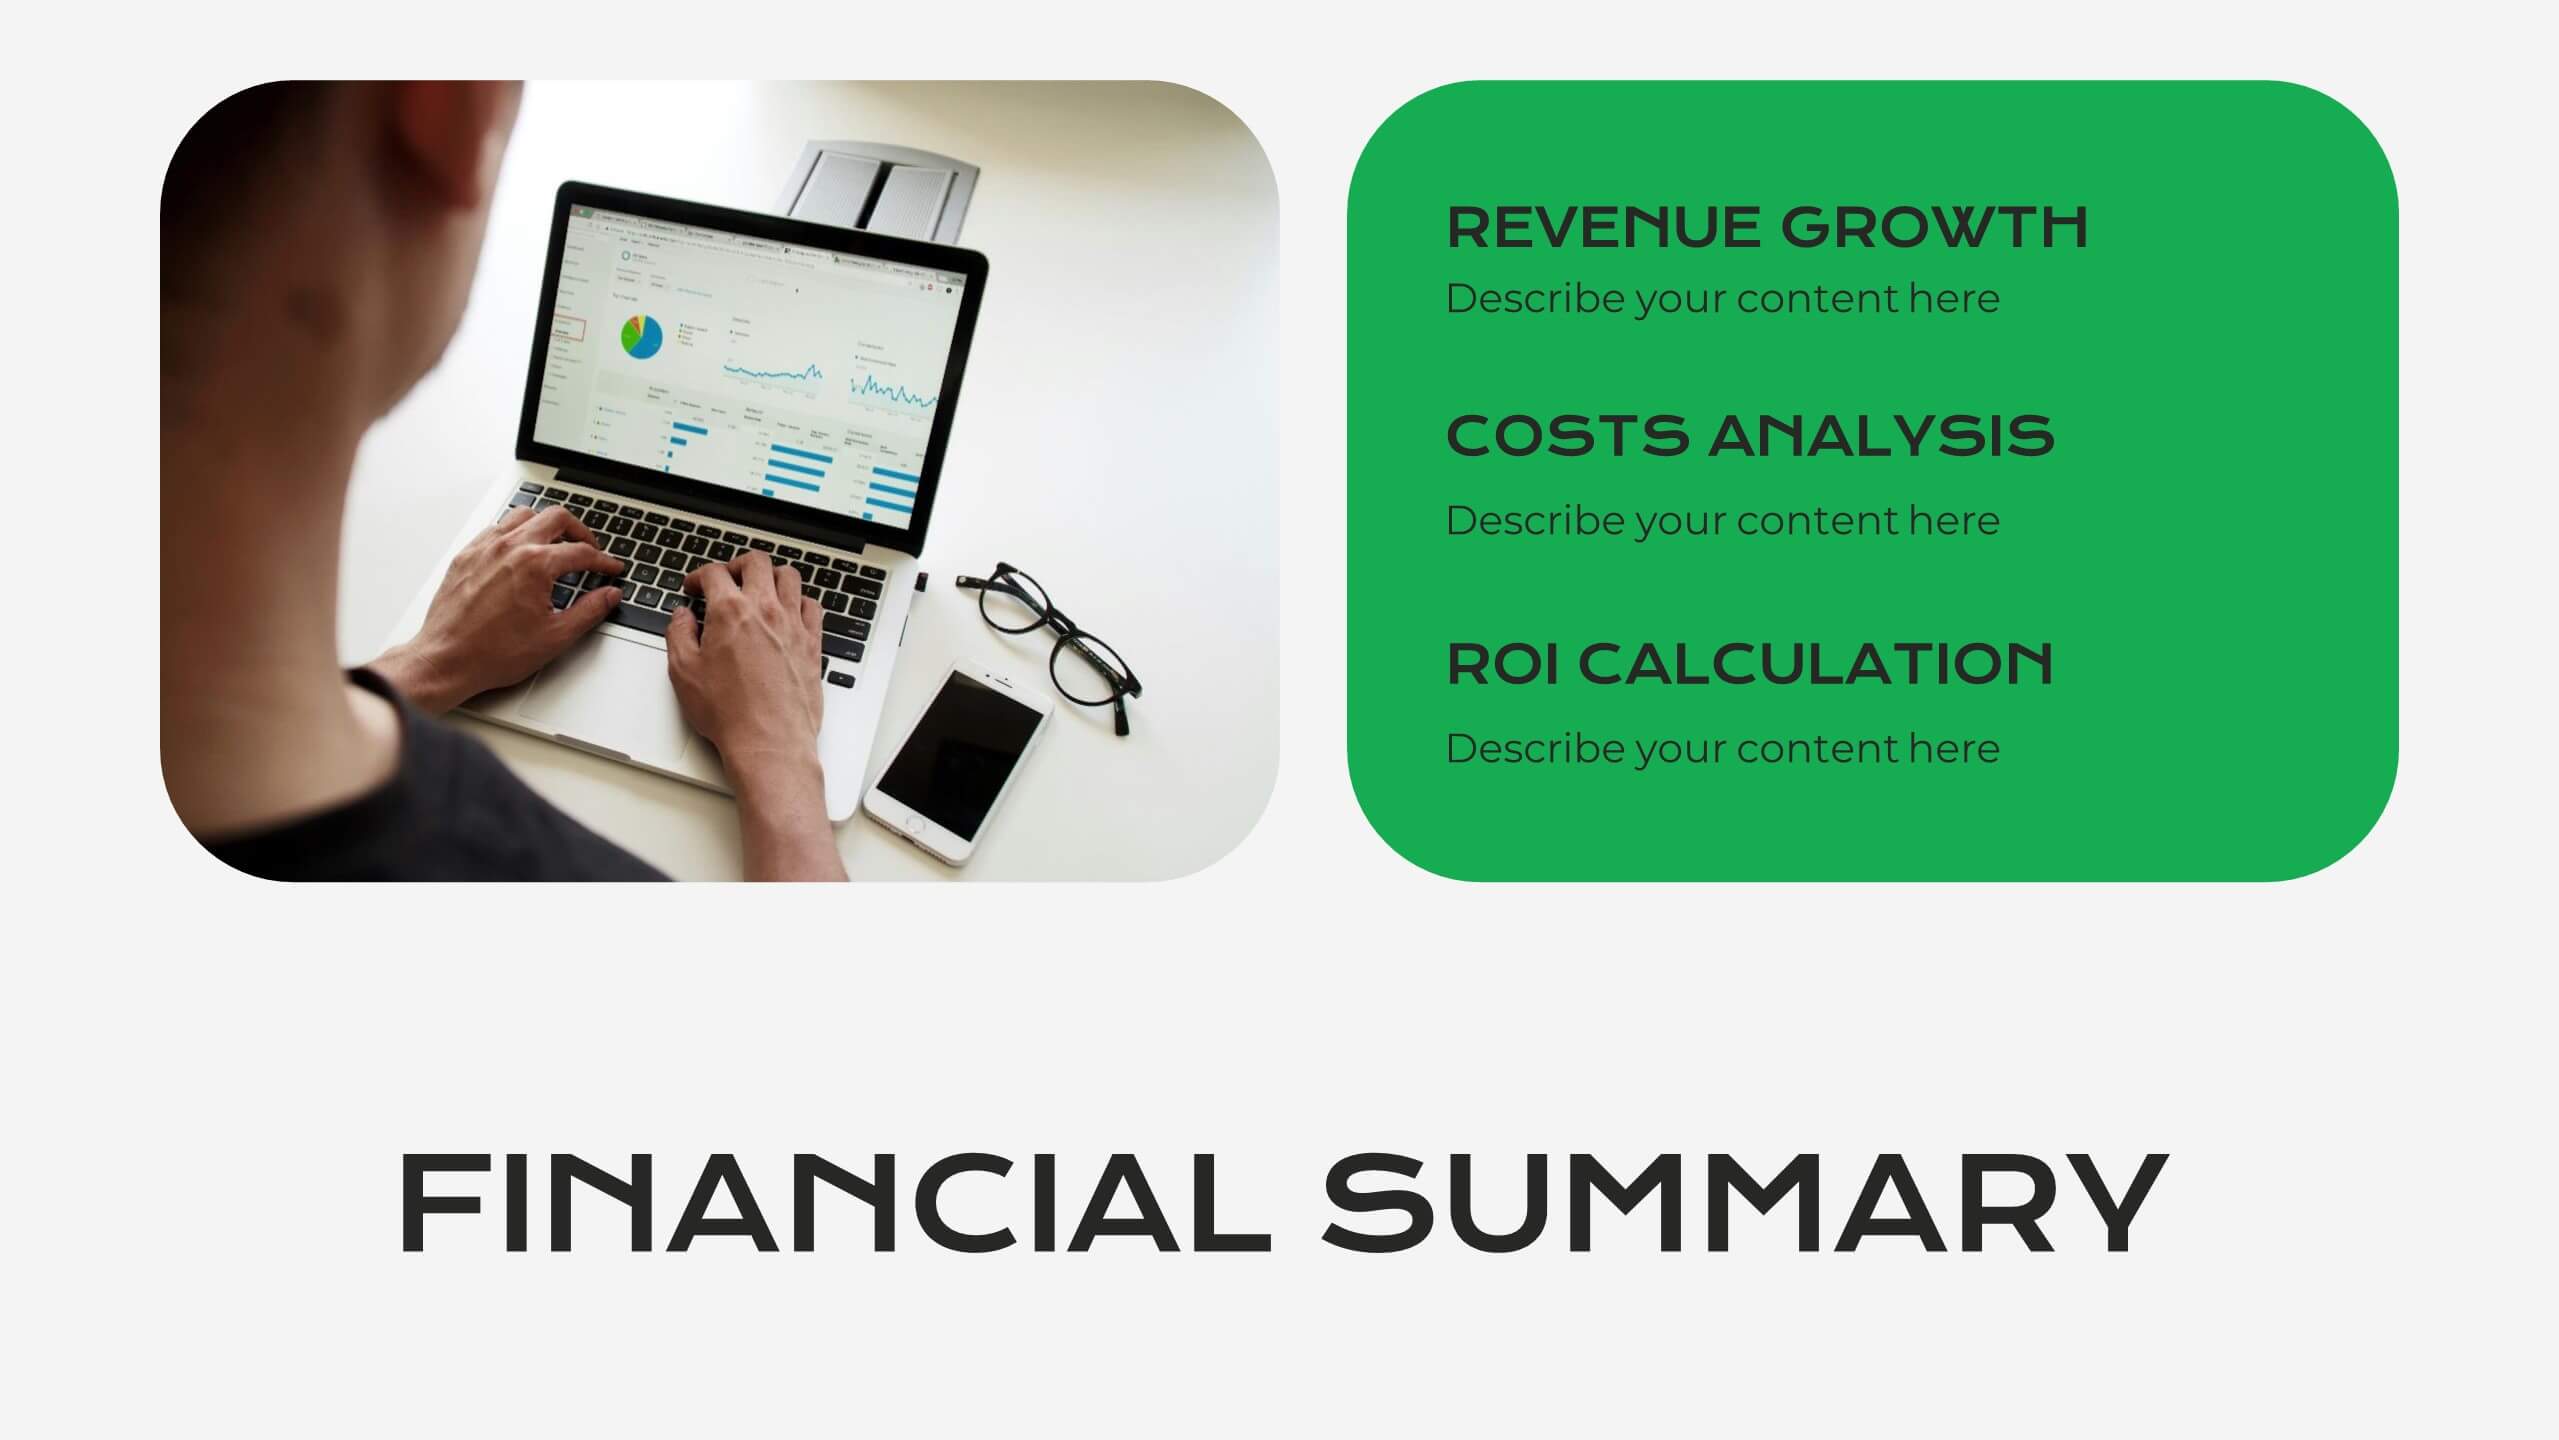
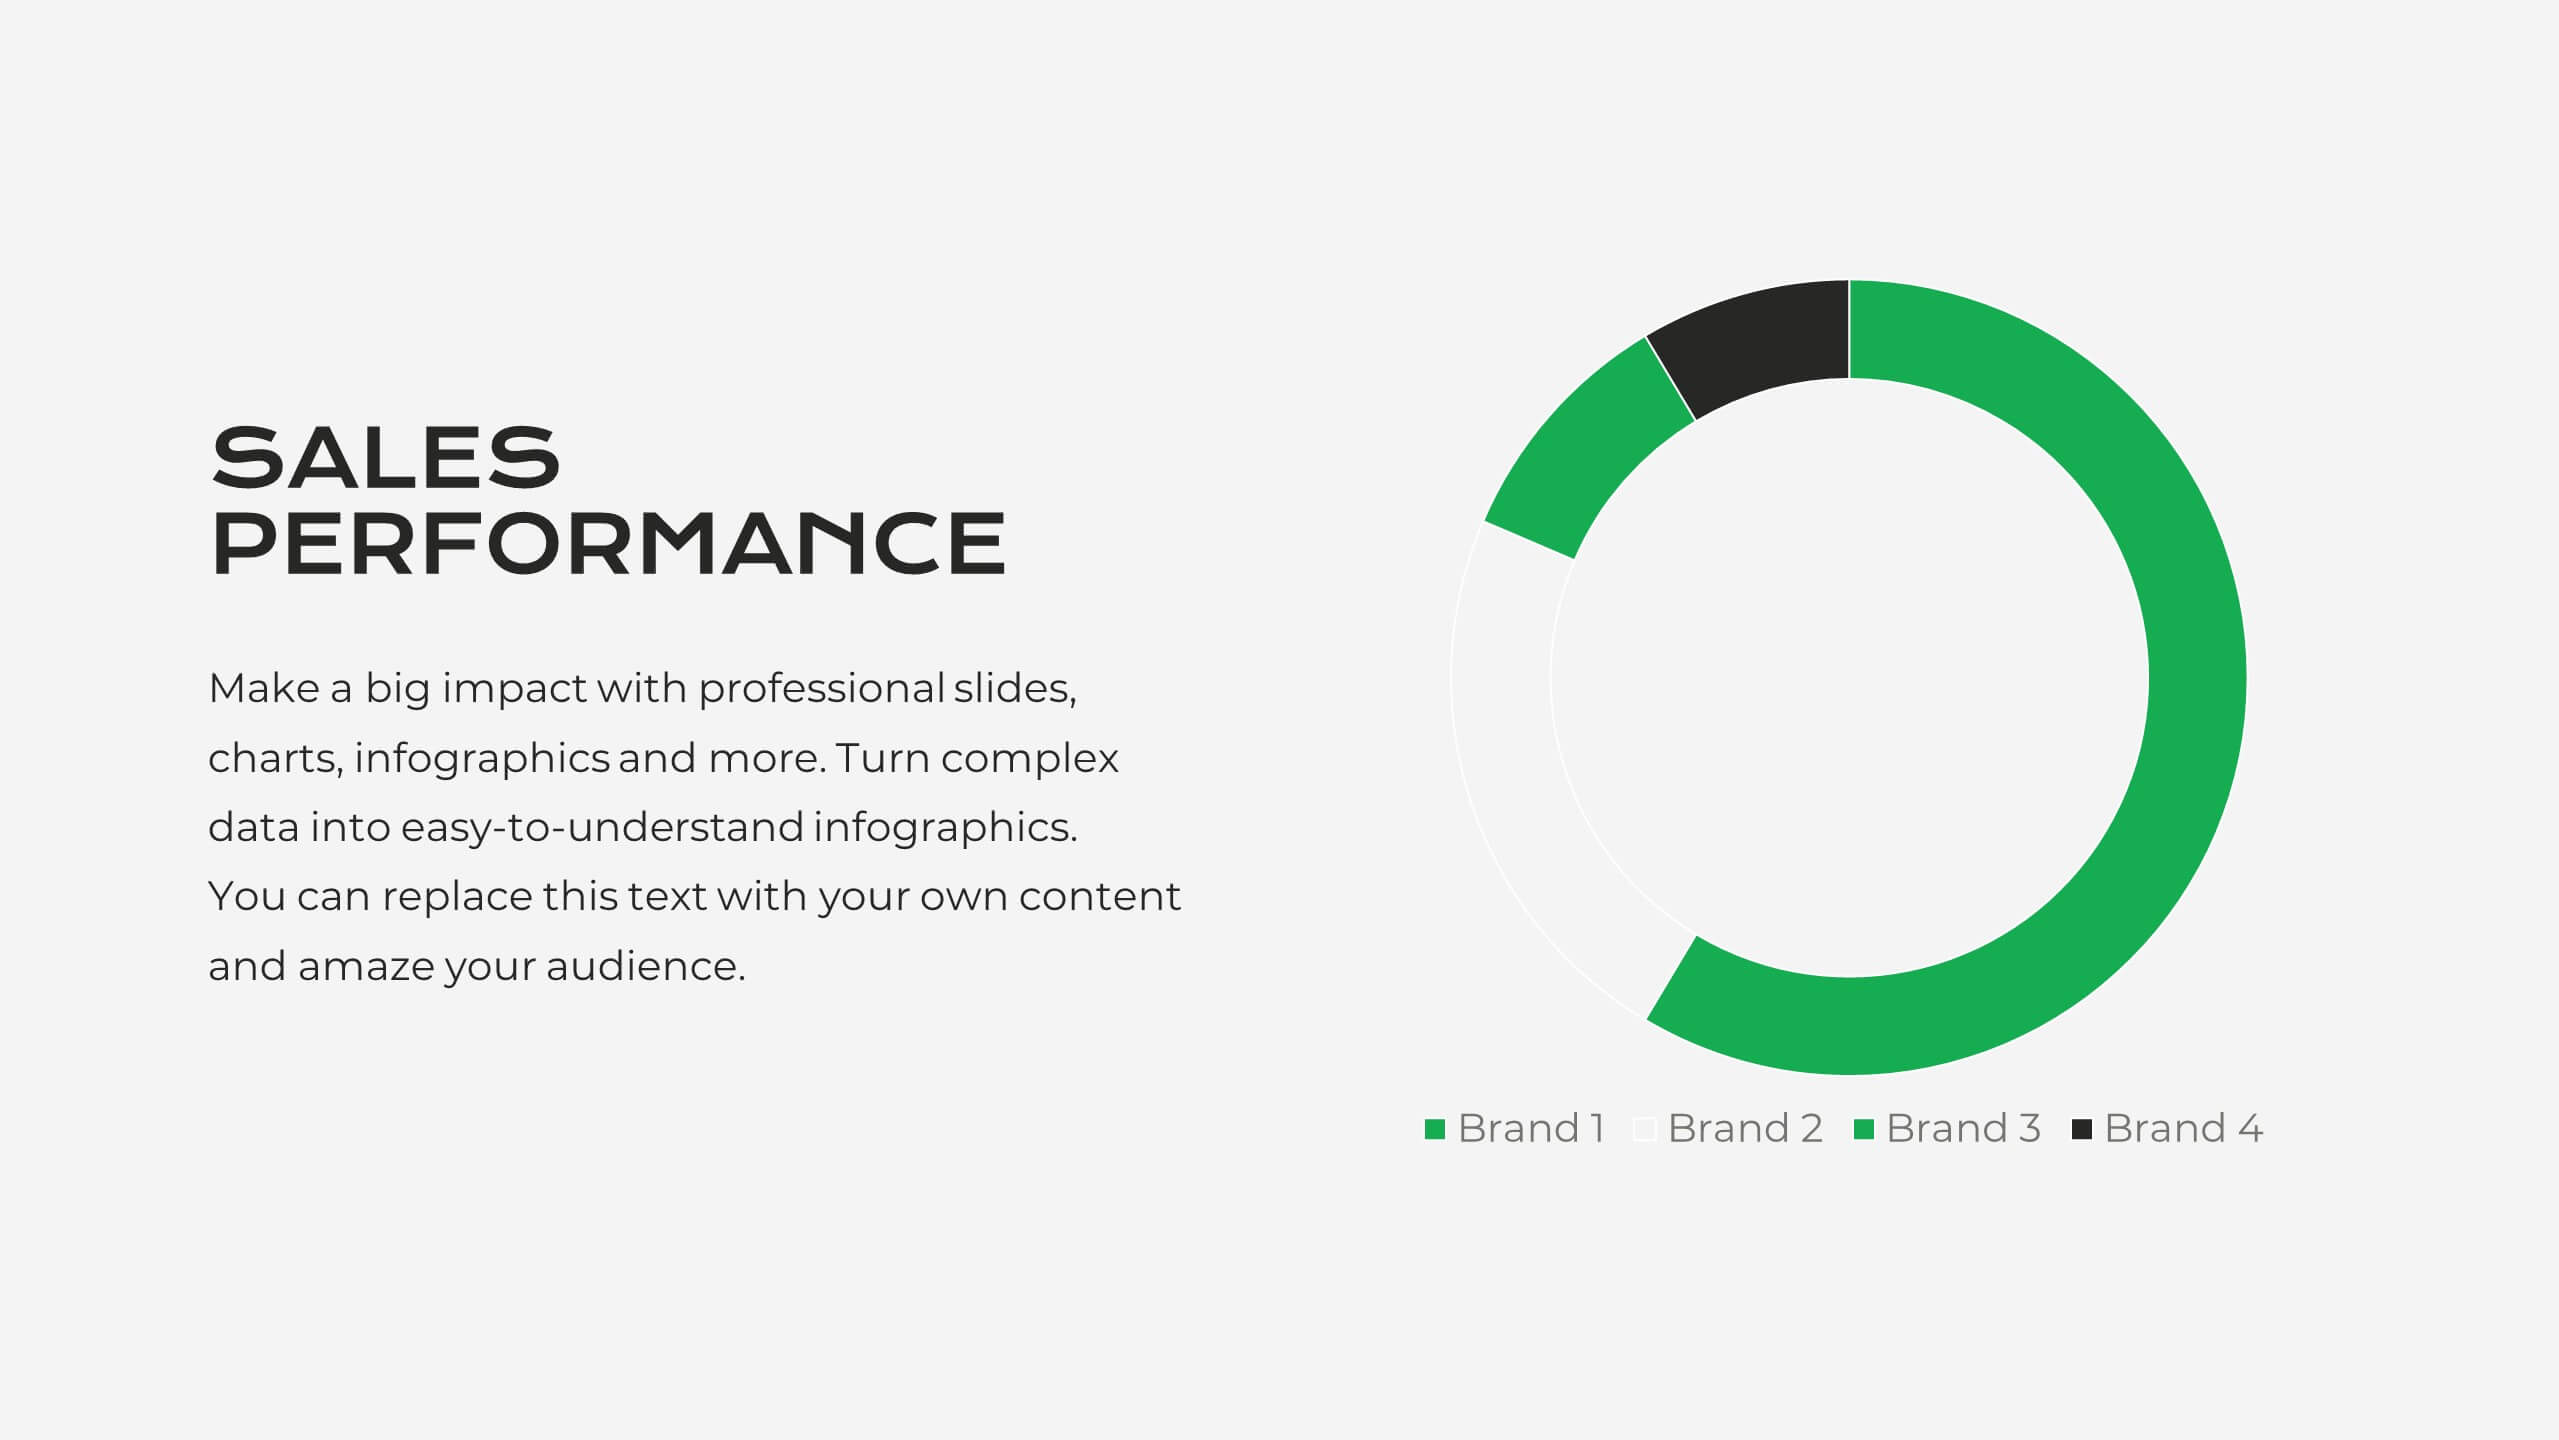
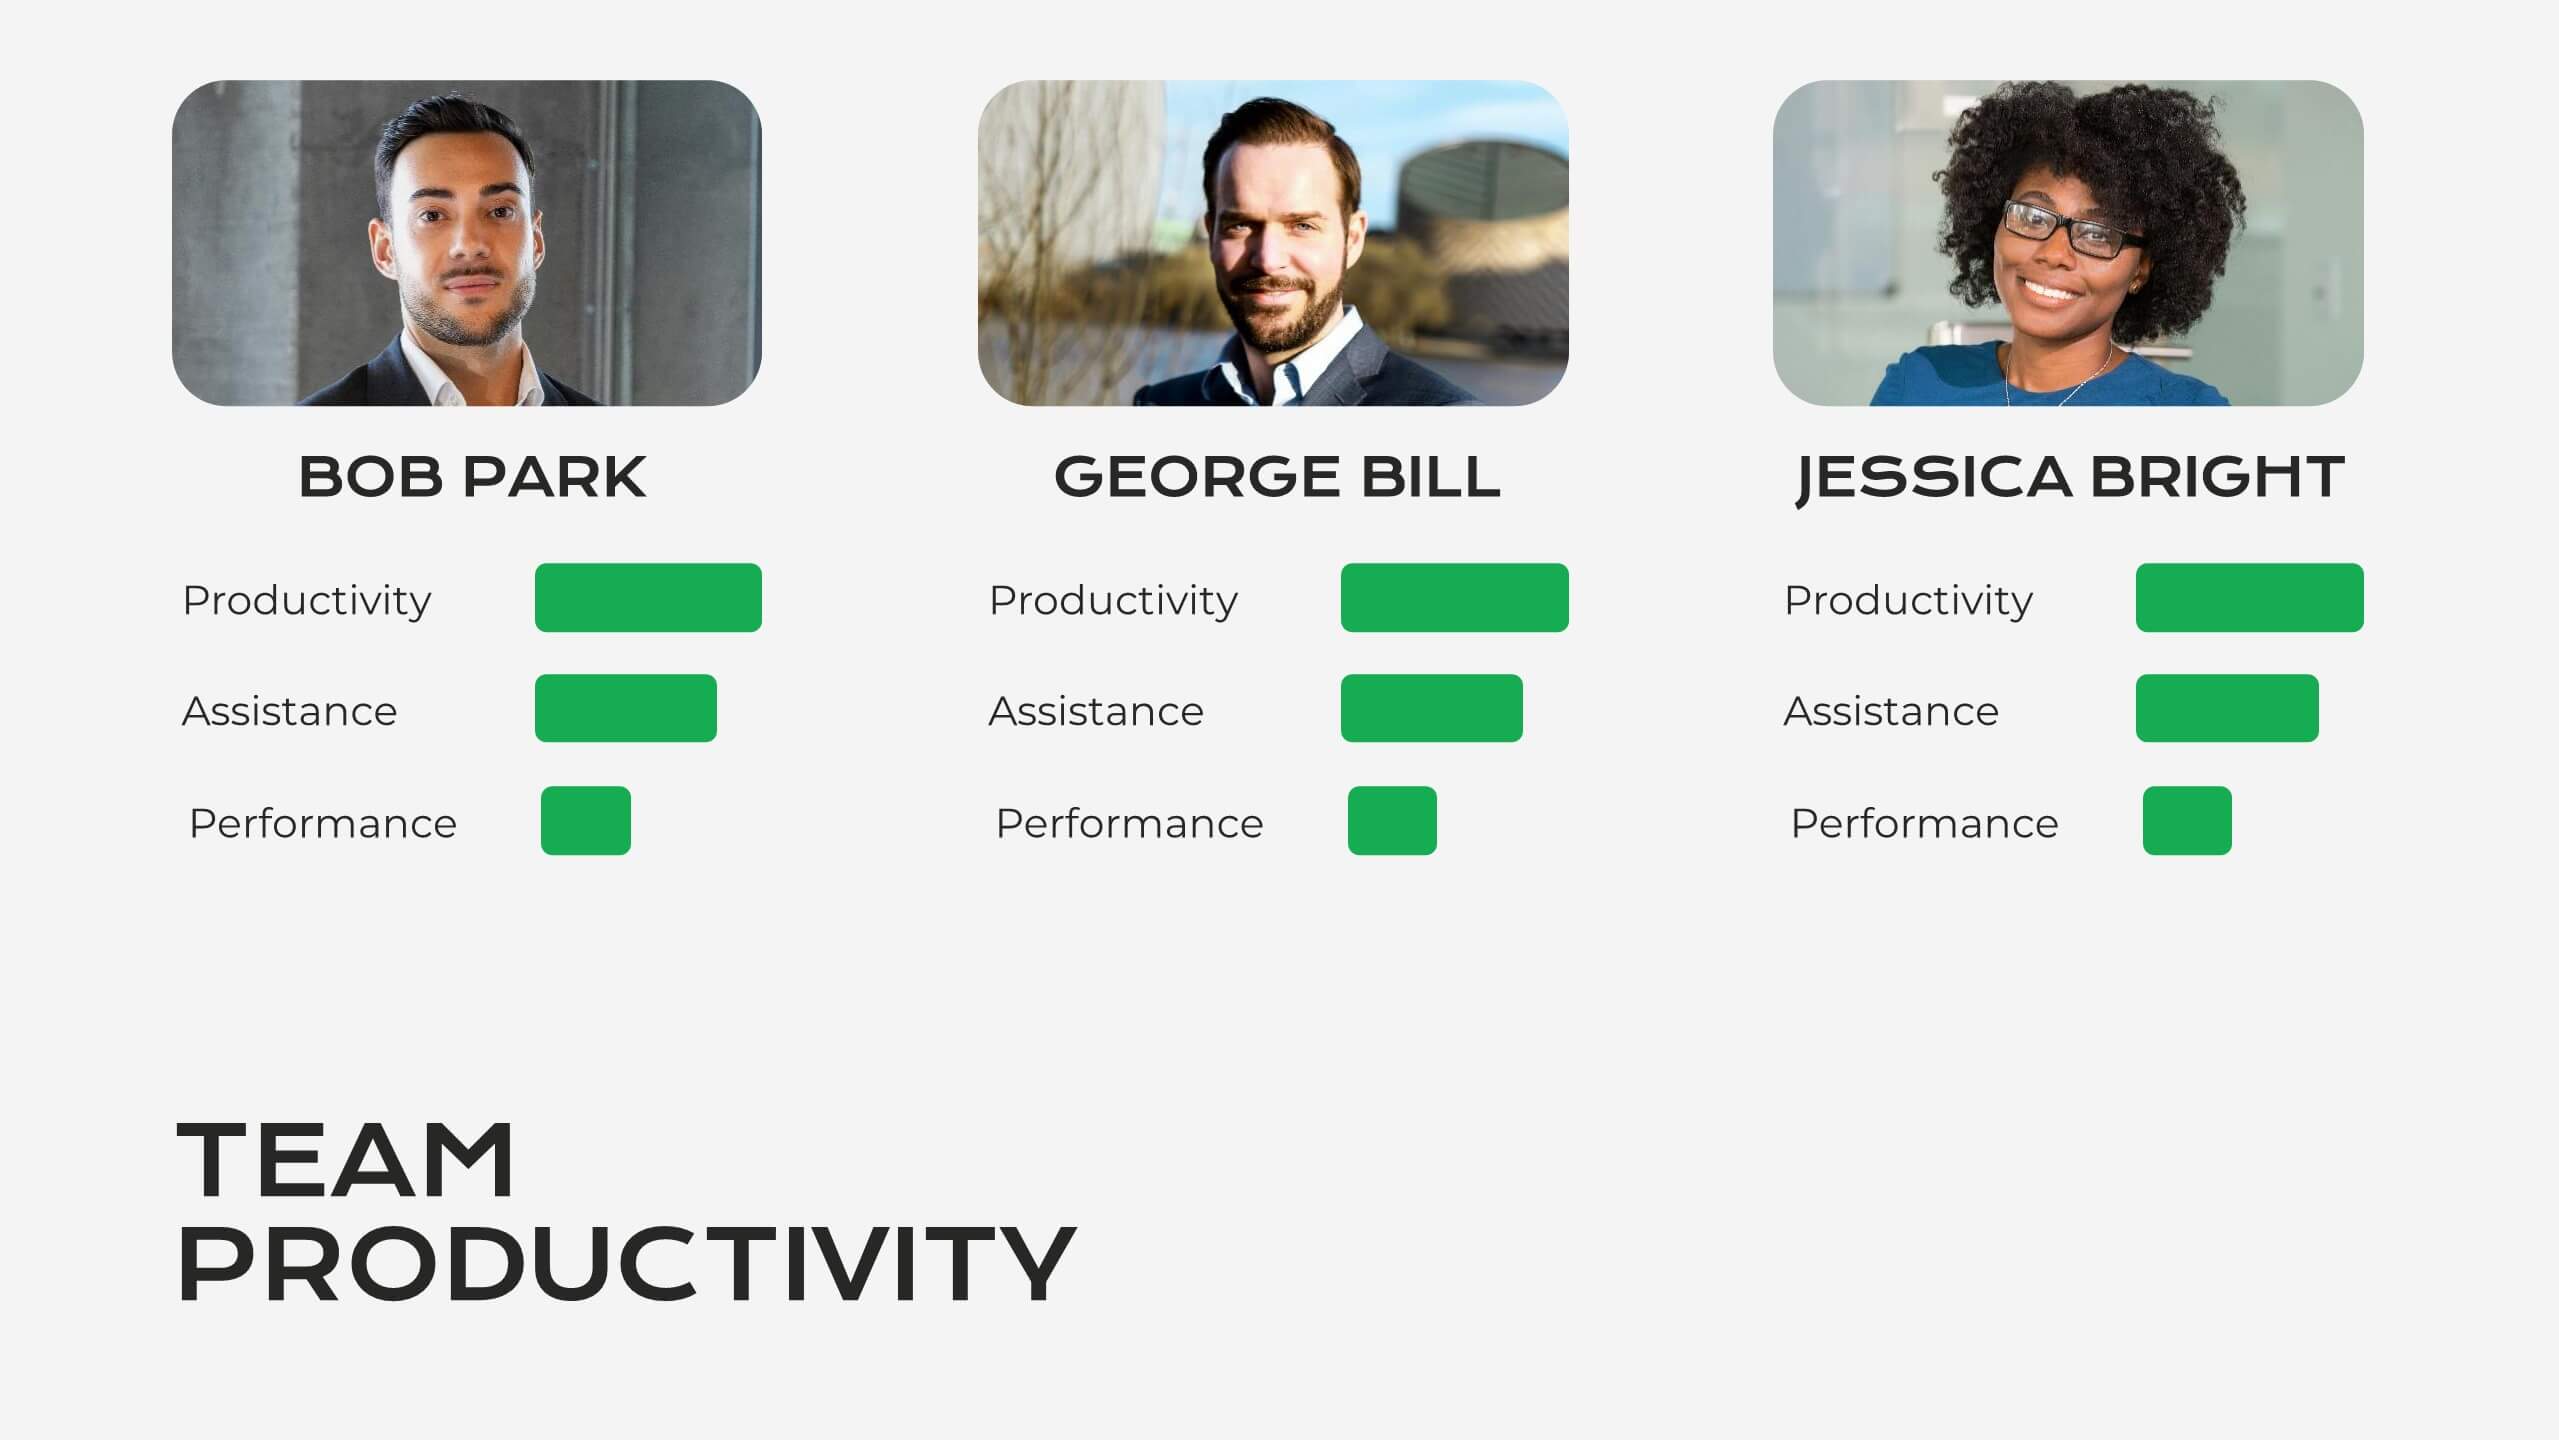
Serene Market Analysis Report Presentation
This modern and clean Market Analysis Report template is designed to help you present key data and insights with clarity and impact. Ideal for business professionals and analysts, it includes slides for key highlights, performance metrics, financial summaries, competitor insights, and strategic initiatives. The template's sleek layout ensures that your data is easy to understand and visually appealing, making it perfect for internal reports or client presentations. Customize it effortlessly in PowerPoint, Keynote, or Google Slides, and impress your audience with a polished and professional report.


5 slides
Workforce Alignment Strategy Presentation
Energize your strategy conversations with a clean, modern layout that makes team alignment feel clear, structured, and actionable. This presentation helps you break down goals, track priorities, and visualize key initiatives in a simple, intuitive flow. Ideal for planning sessions and leadership updates. Fully compatible with PowerPoint, Keynote, and Google Slides.