


Features
- 7 Unique Slides
- Fully editable and easy to edit in Microsoft Powerpoint, Keynote and Google Slides
- 16:9 widescreen layout
- Clean and professional designs
- Export to JPG, PDF or send by email


Do you have any questions?
Recommend


7 slides
TAM SAM SOM Infographic Presentation Template
TAM, SAM and SOM are acronyms that represents different subsets of a market. Which stand for (TAM) Total Addressable Market, (SAM) Serviceable Addressable Market, and (SOM) Serviceable Obtainable Market. Understanding these acronyms can help you better target your marketing efforts to potential customers. This presentation template is a great tool to organize and plan any of your important business projects. Using this template can become critically important to the very foundation of your business model, and TAM, SAM, SOM should be key components to craft the details of your business plan.


5 slides
Regional Economic Growth in Asia Map Presentation
Explore economic landscapes with the "Regional Economic Growth in Asia Map" template, an essential tool for visualizing economic data across Asia. Designed for business strategists and policymakers, it offers detailed insights and regional analysis to support informed decision-making. Compatible with PowerPoint and Google Slides, this template is flexible for both academic and professional uses.


21 slides
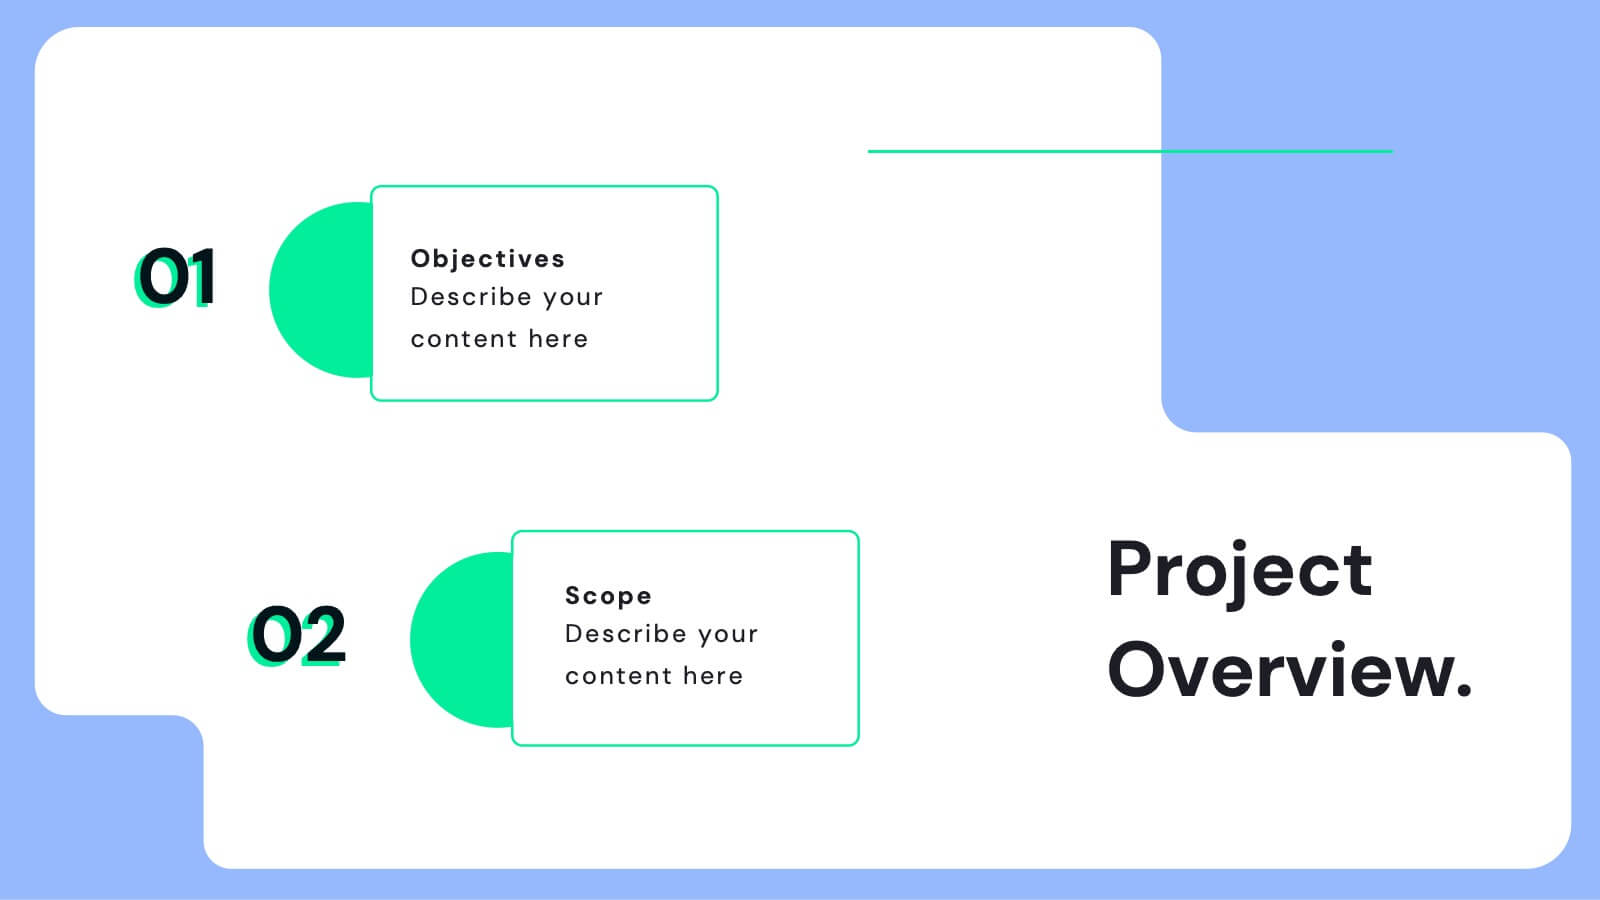
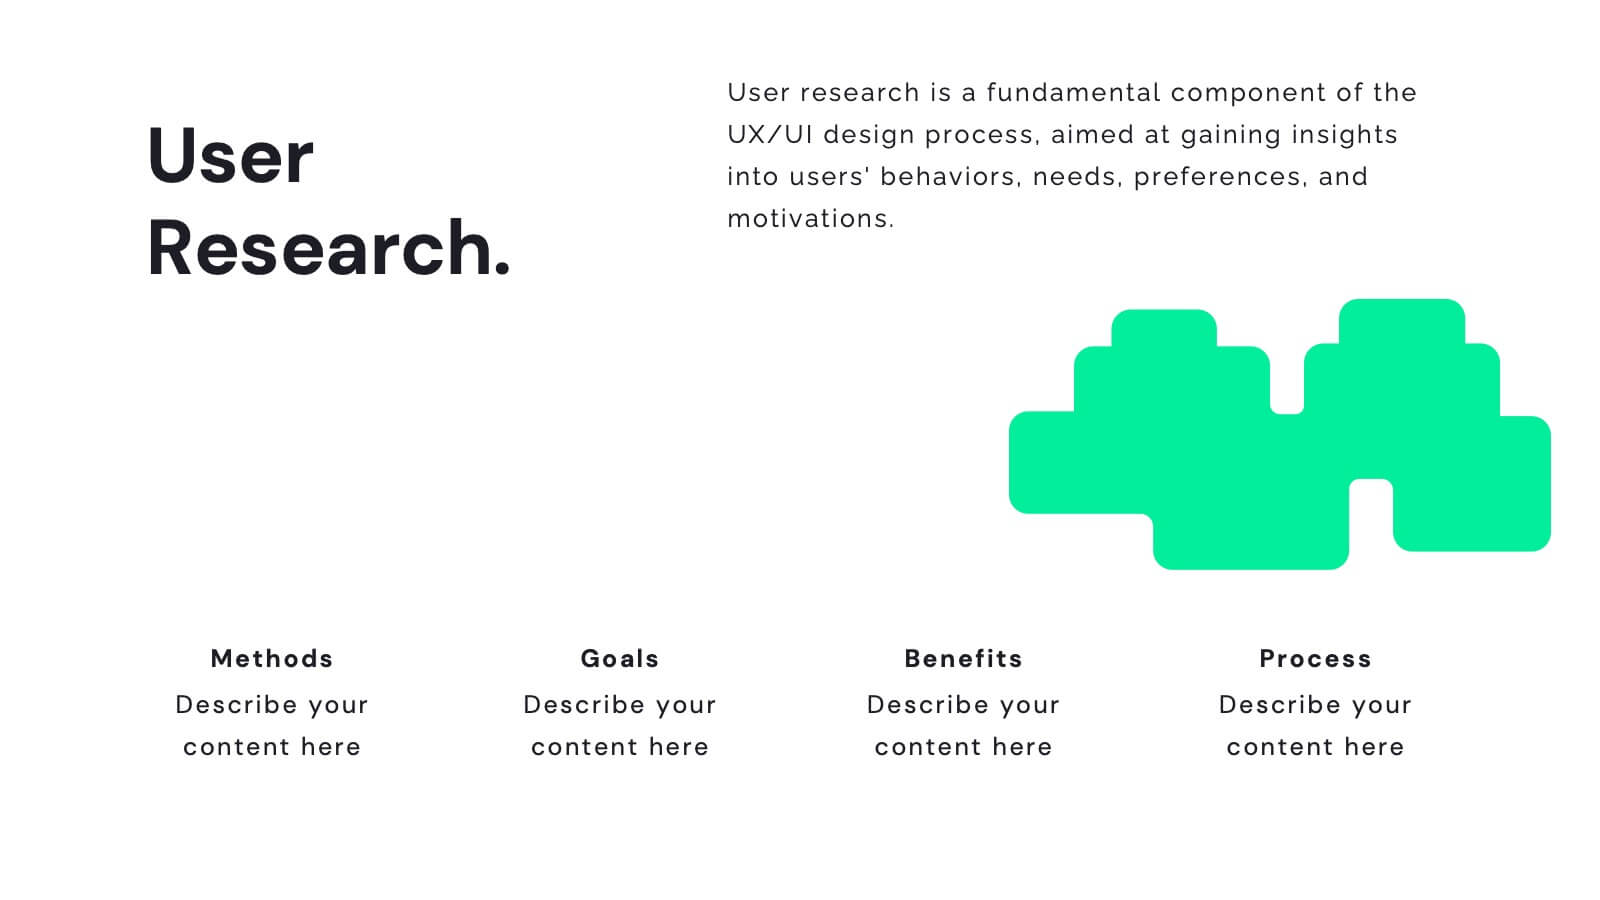
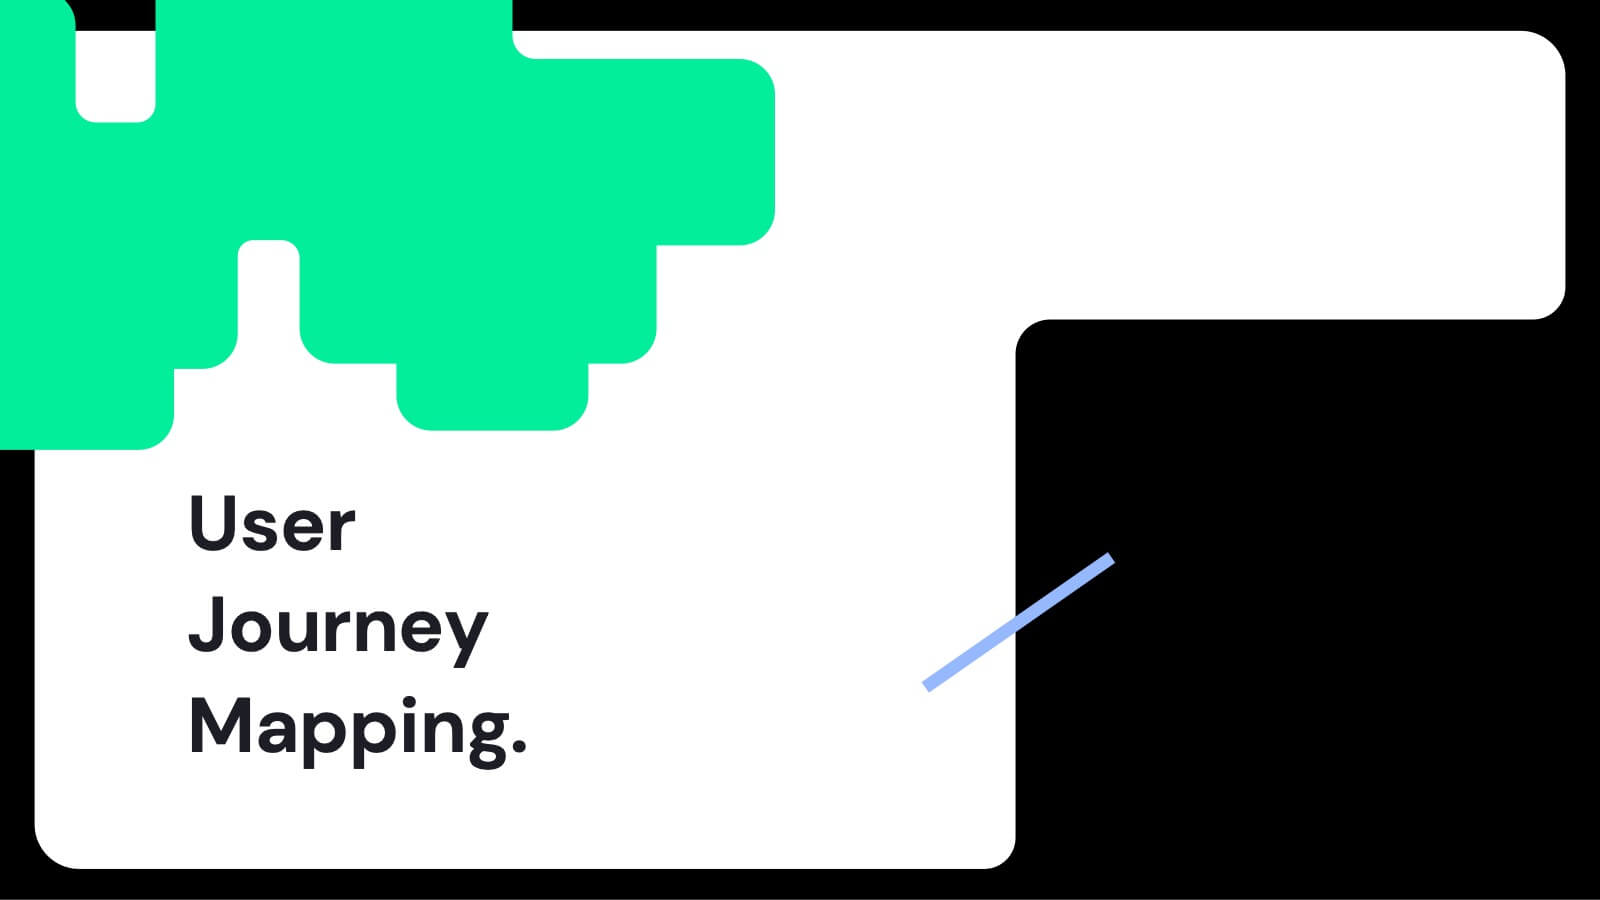
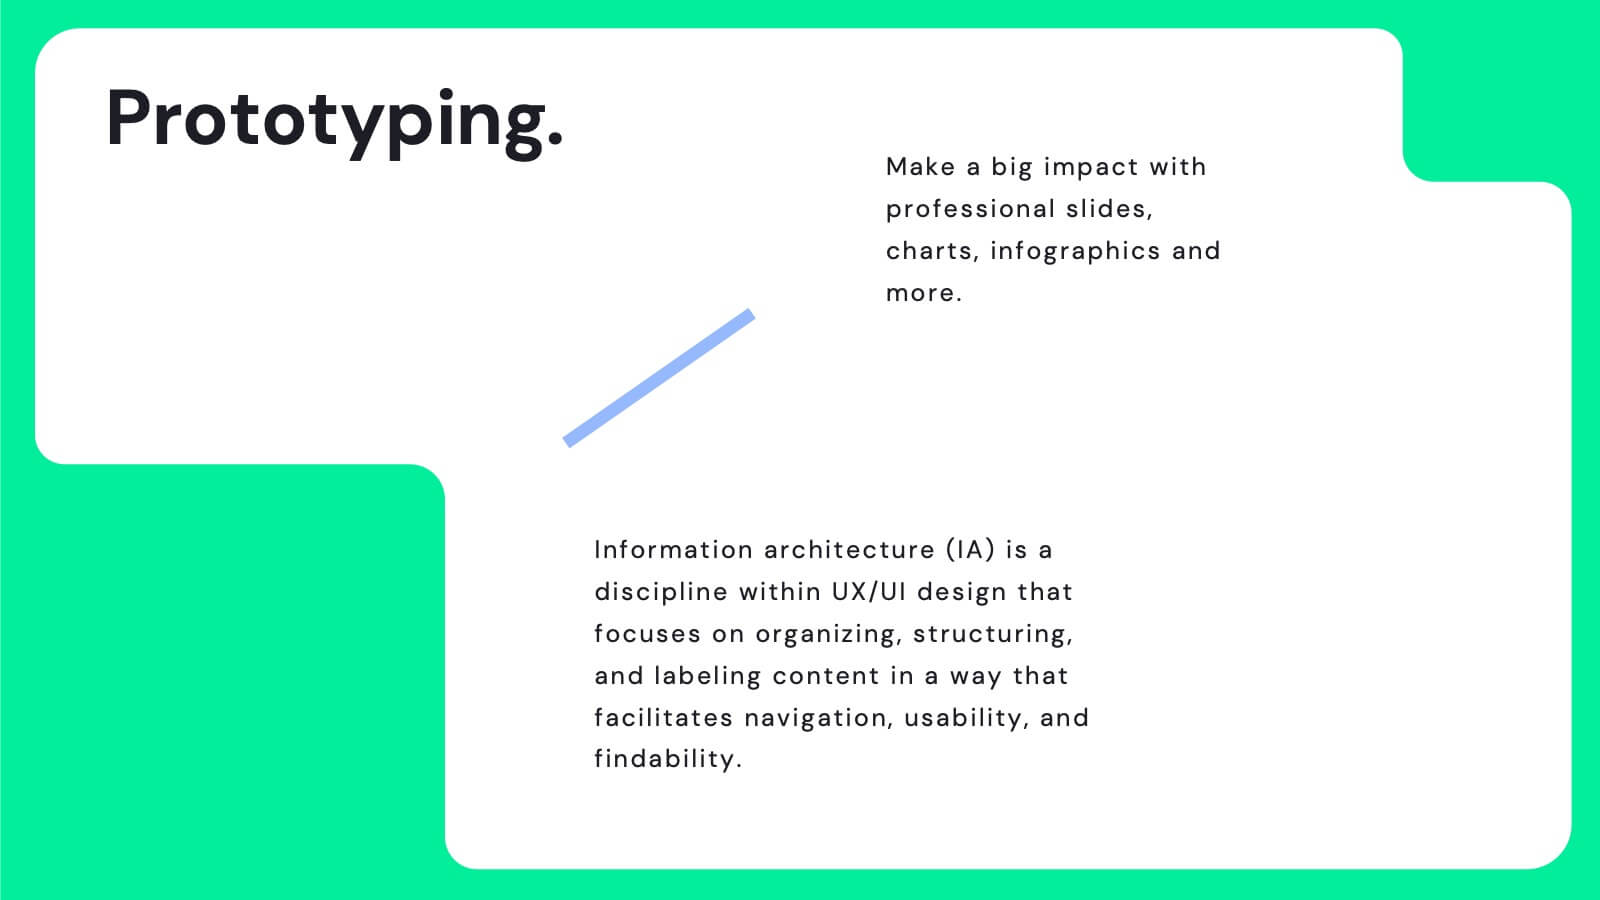
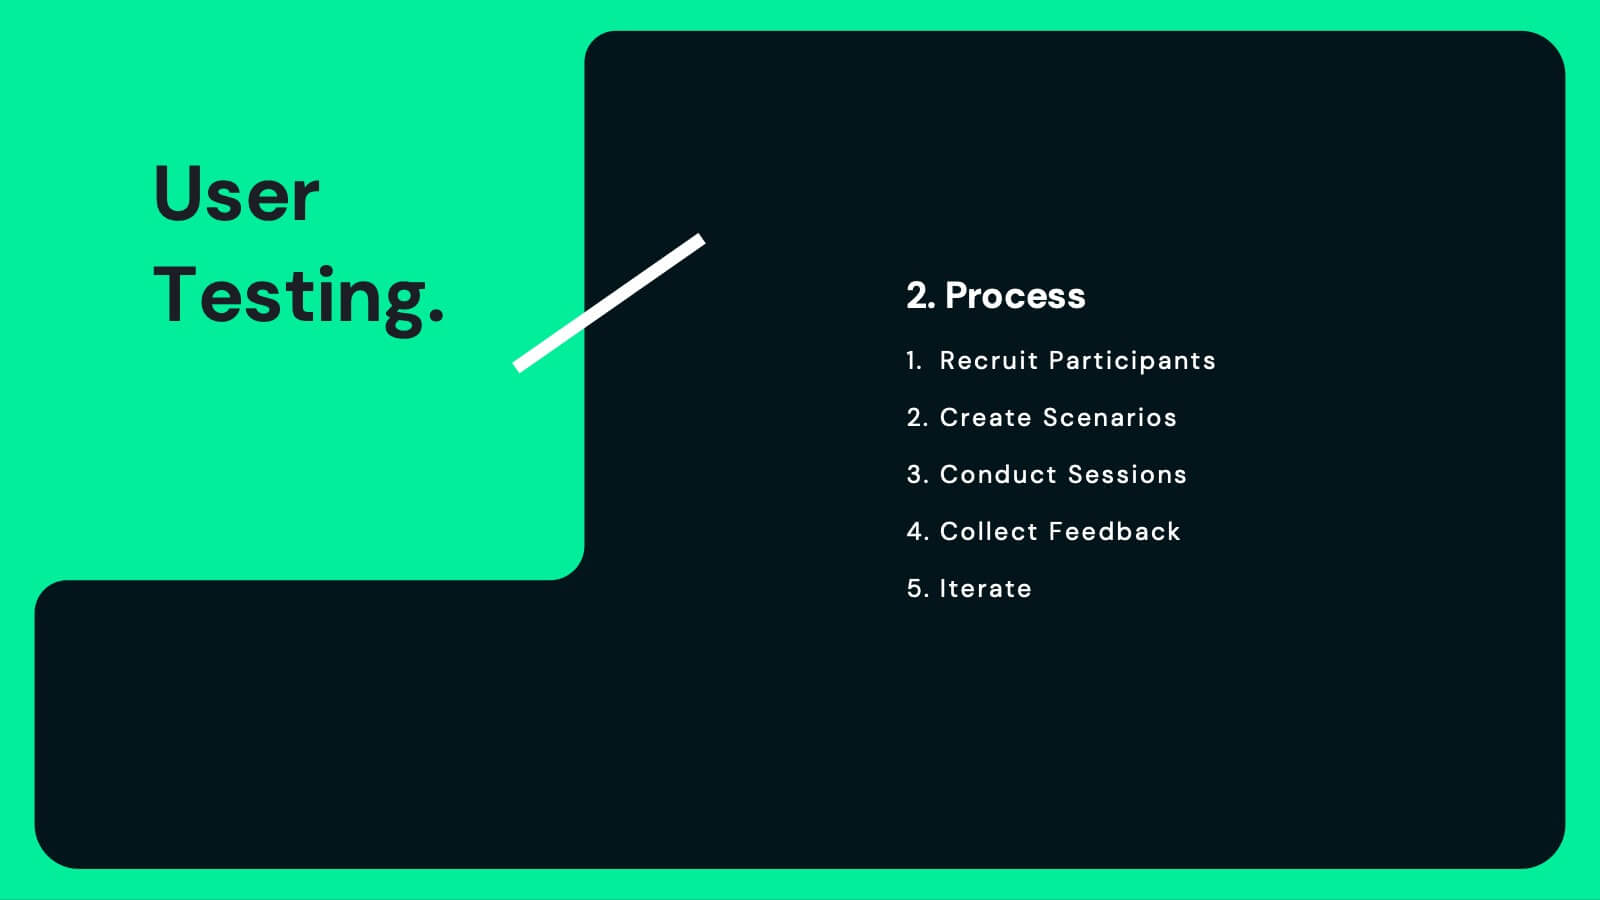
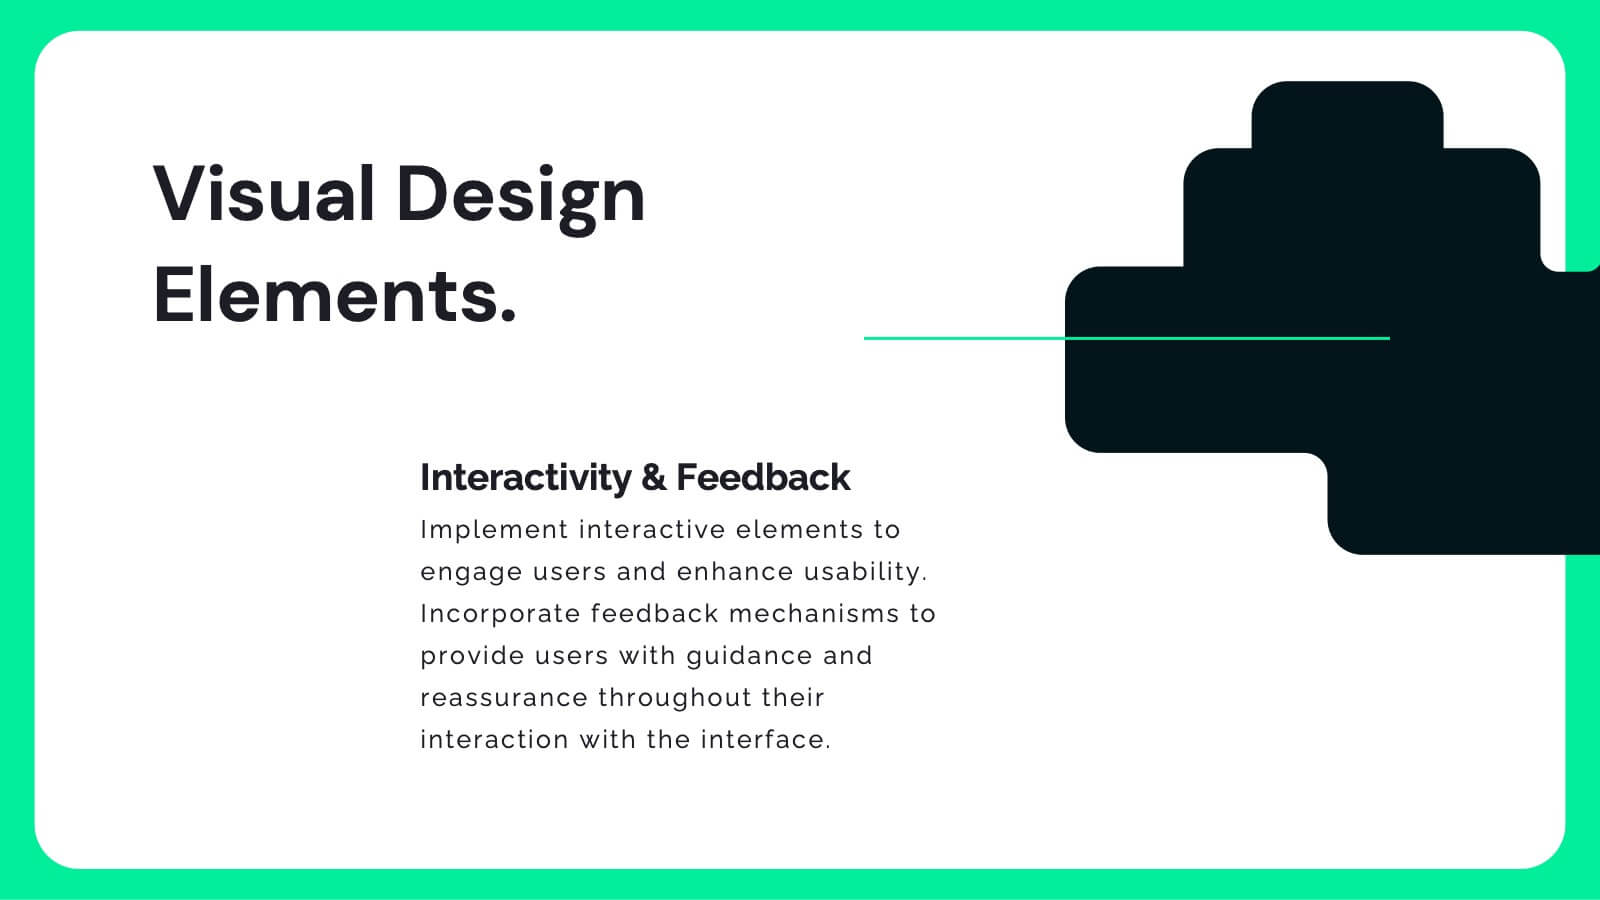
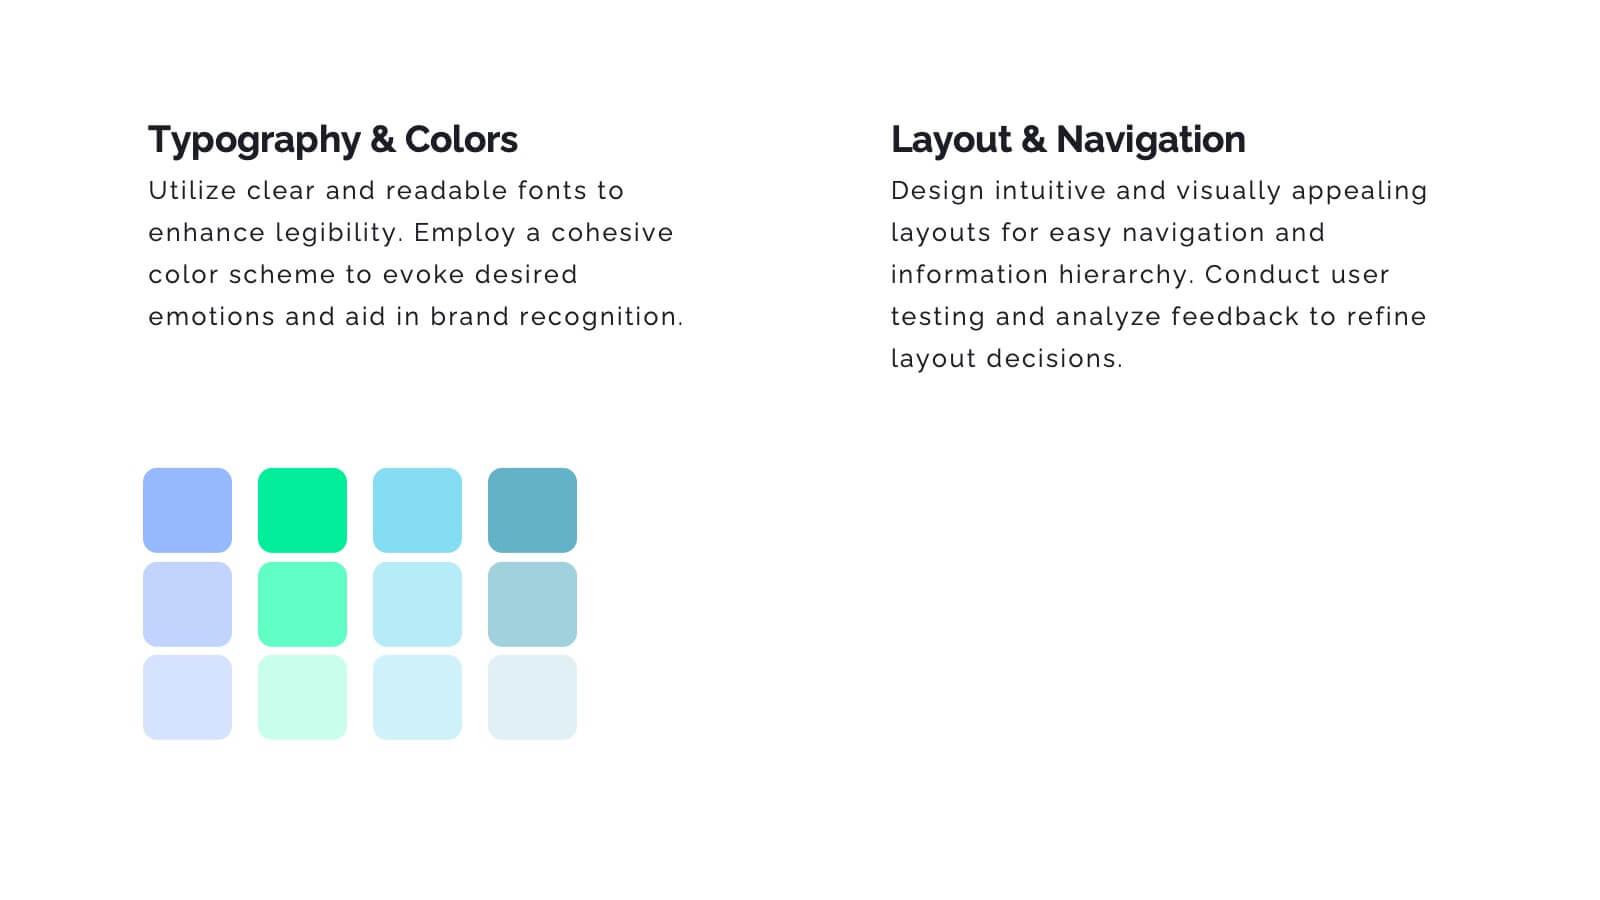
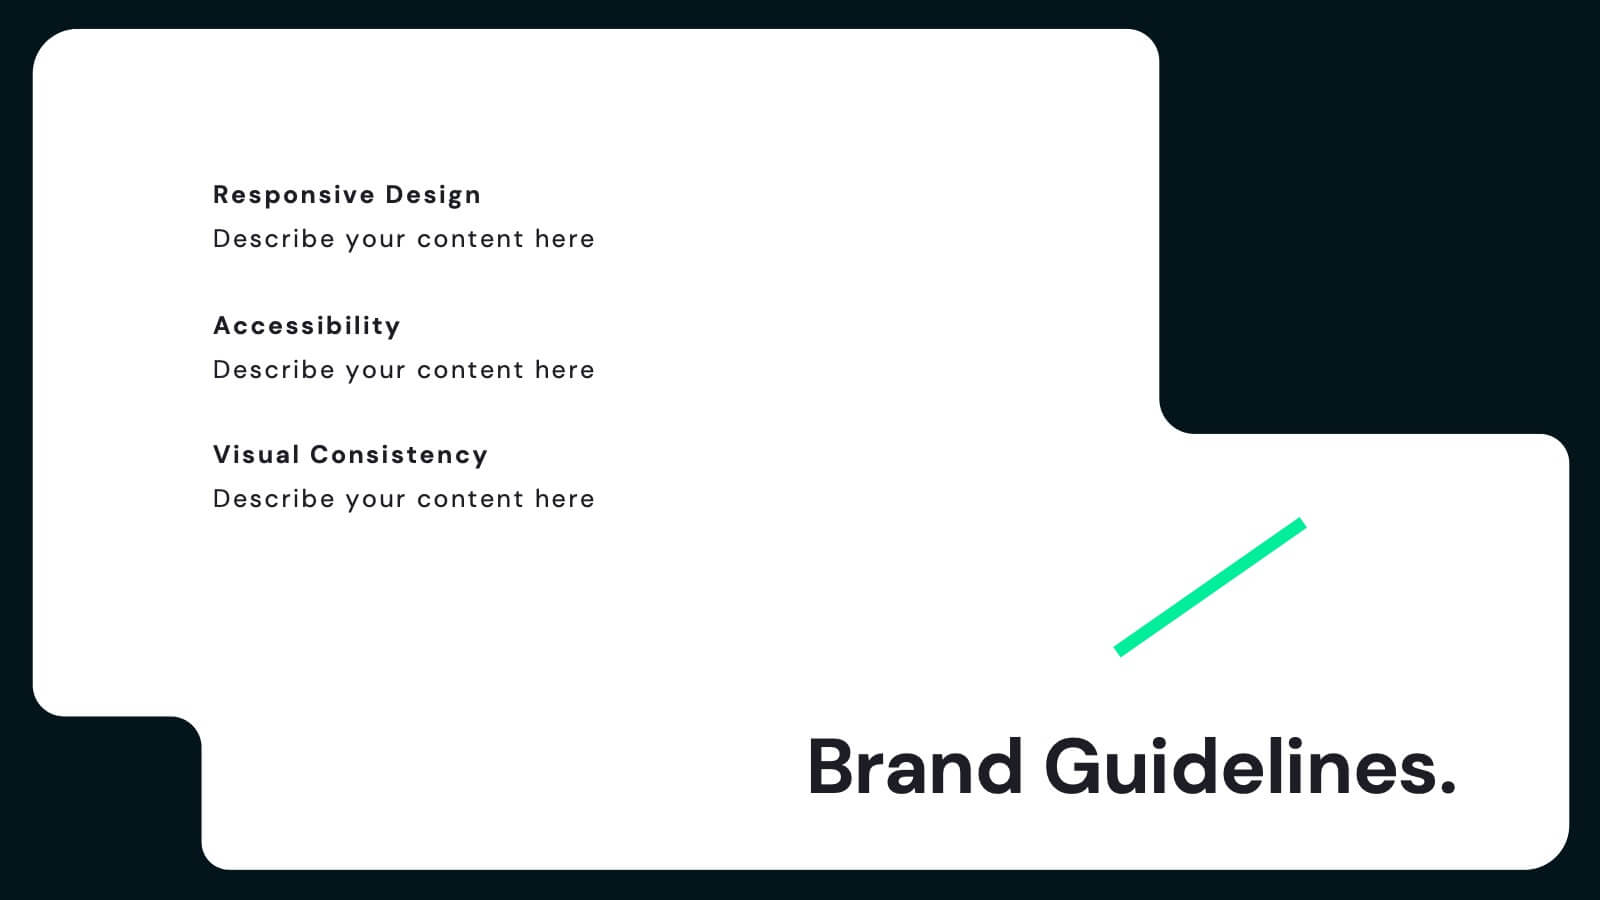
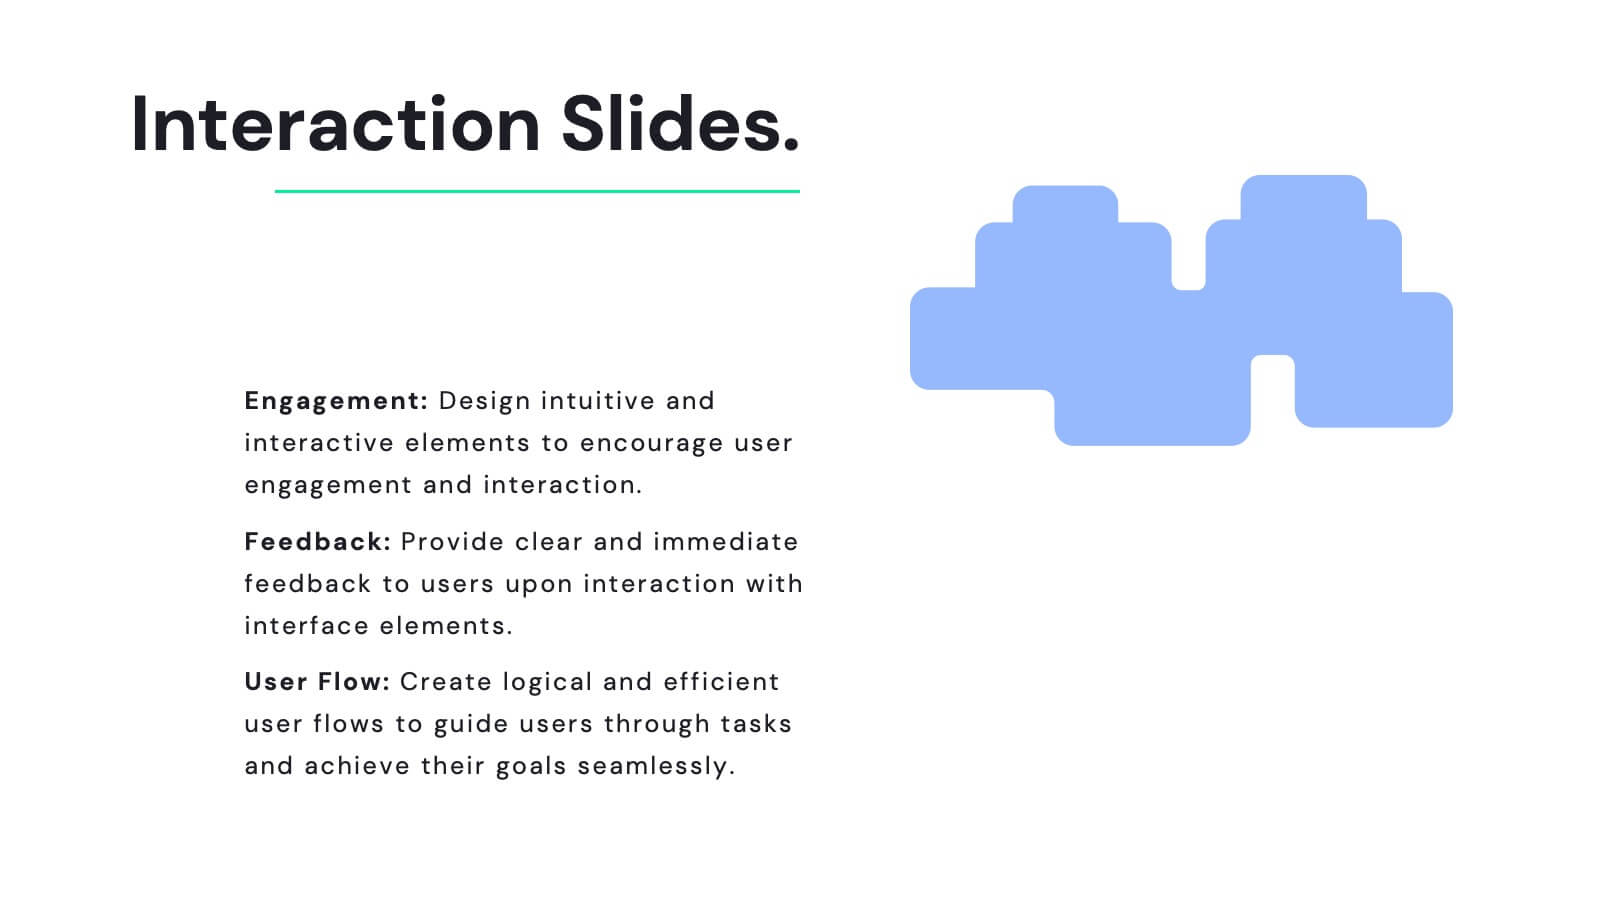
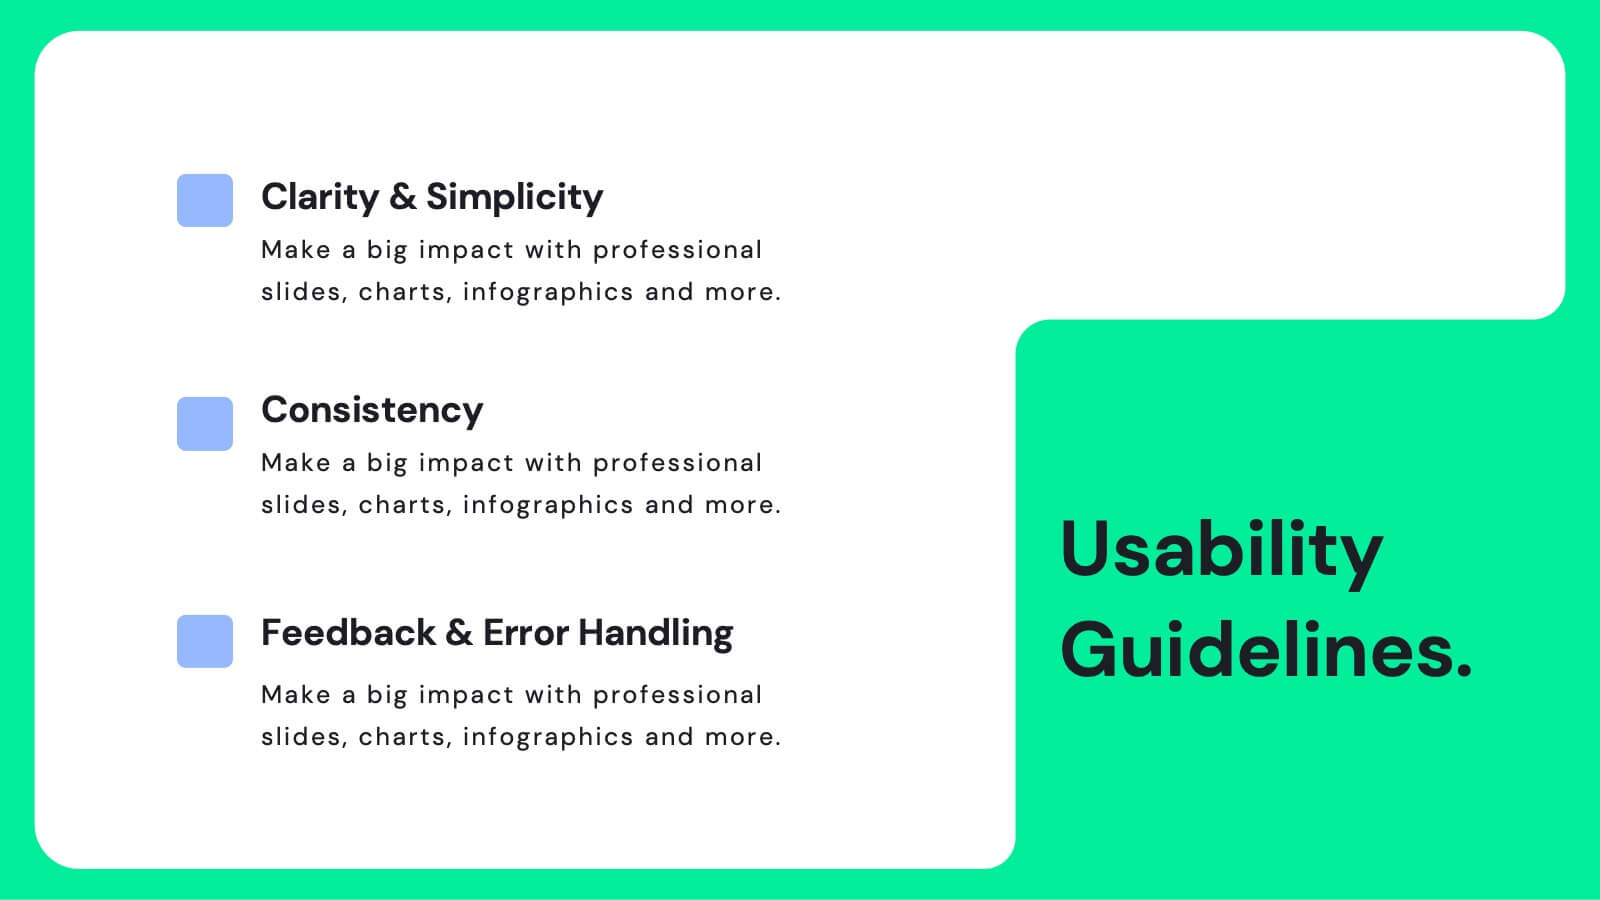
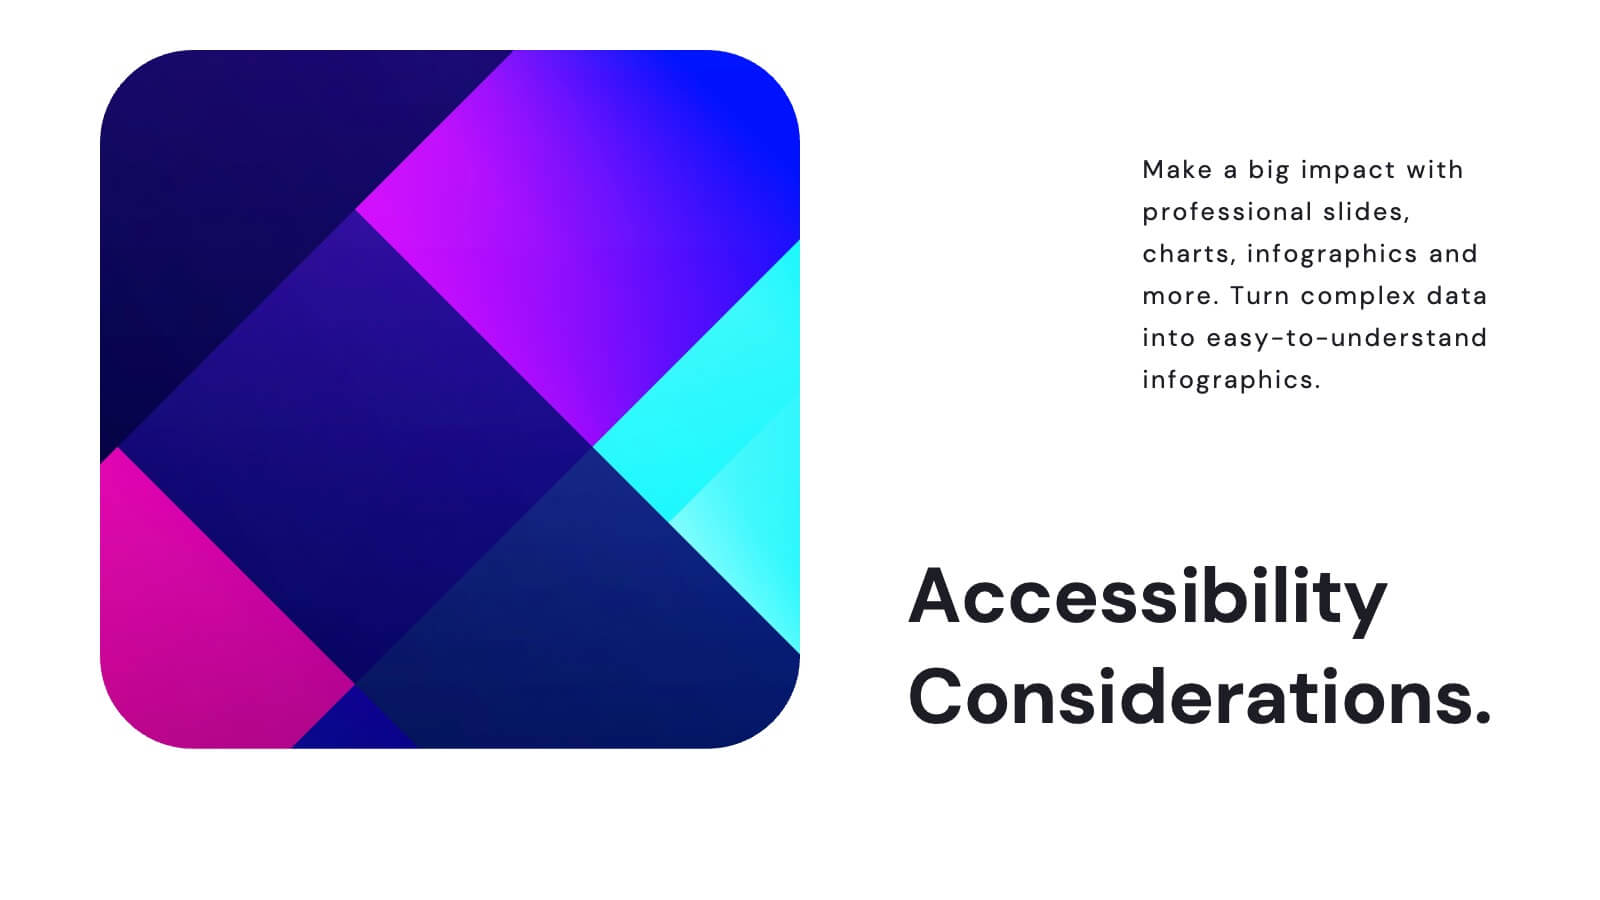
Juno UX Case Study Presentation
Enhance your UX presentations with this sleek, user-friendly template designed for showcasing detailed case studies and user research. With a modern layout and clear sections for user journey mapping, prototyping, and usability guidelines, this template ensures a professional and engaging presentation. Compatible with PowerPoint, Keynote, and Google Slides, it's perfect for any platform.


5 slides
Closing Statement with Highlights Presentation
Wrap up your presentation with this clean, step-by-step summary slide. Featuring a rising arrow path and a trophy icon, it’s ideal for showcasing final insights or major achievements. Highlight up to five key points clearly and concisely. Fully customizable in PowerPoint, Keynote, and Google Slides for seamless presentation use.


7 slides
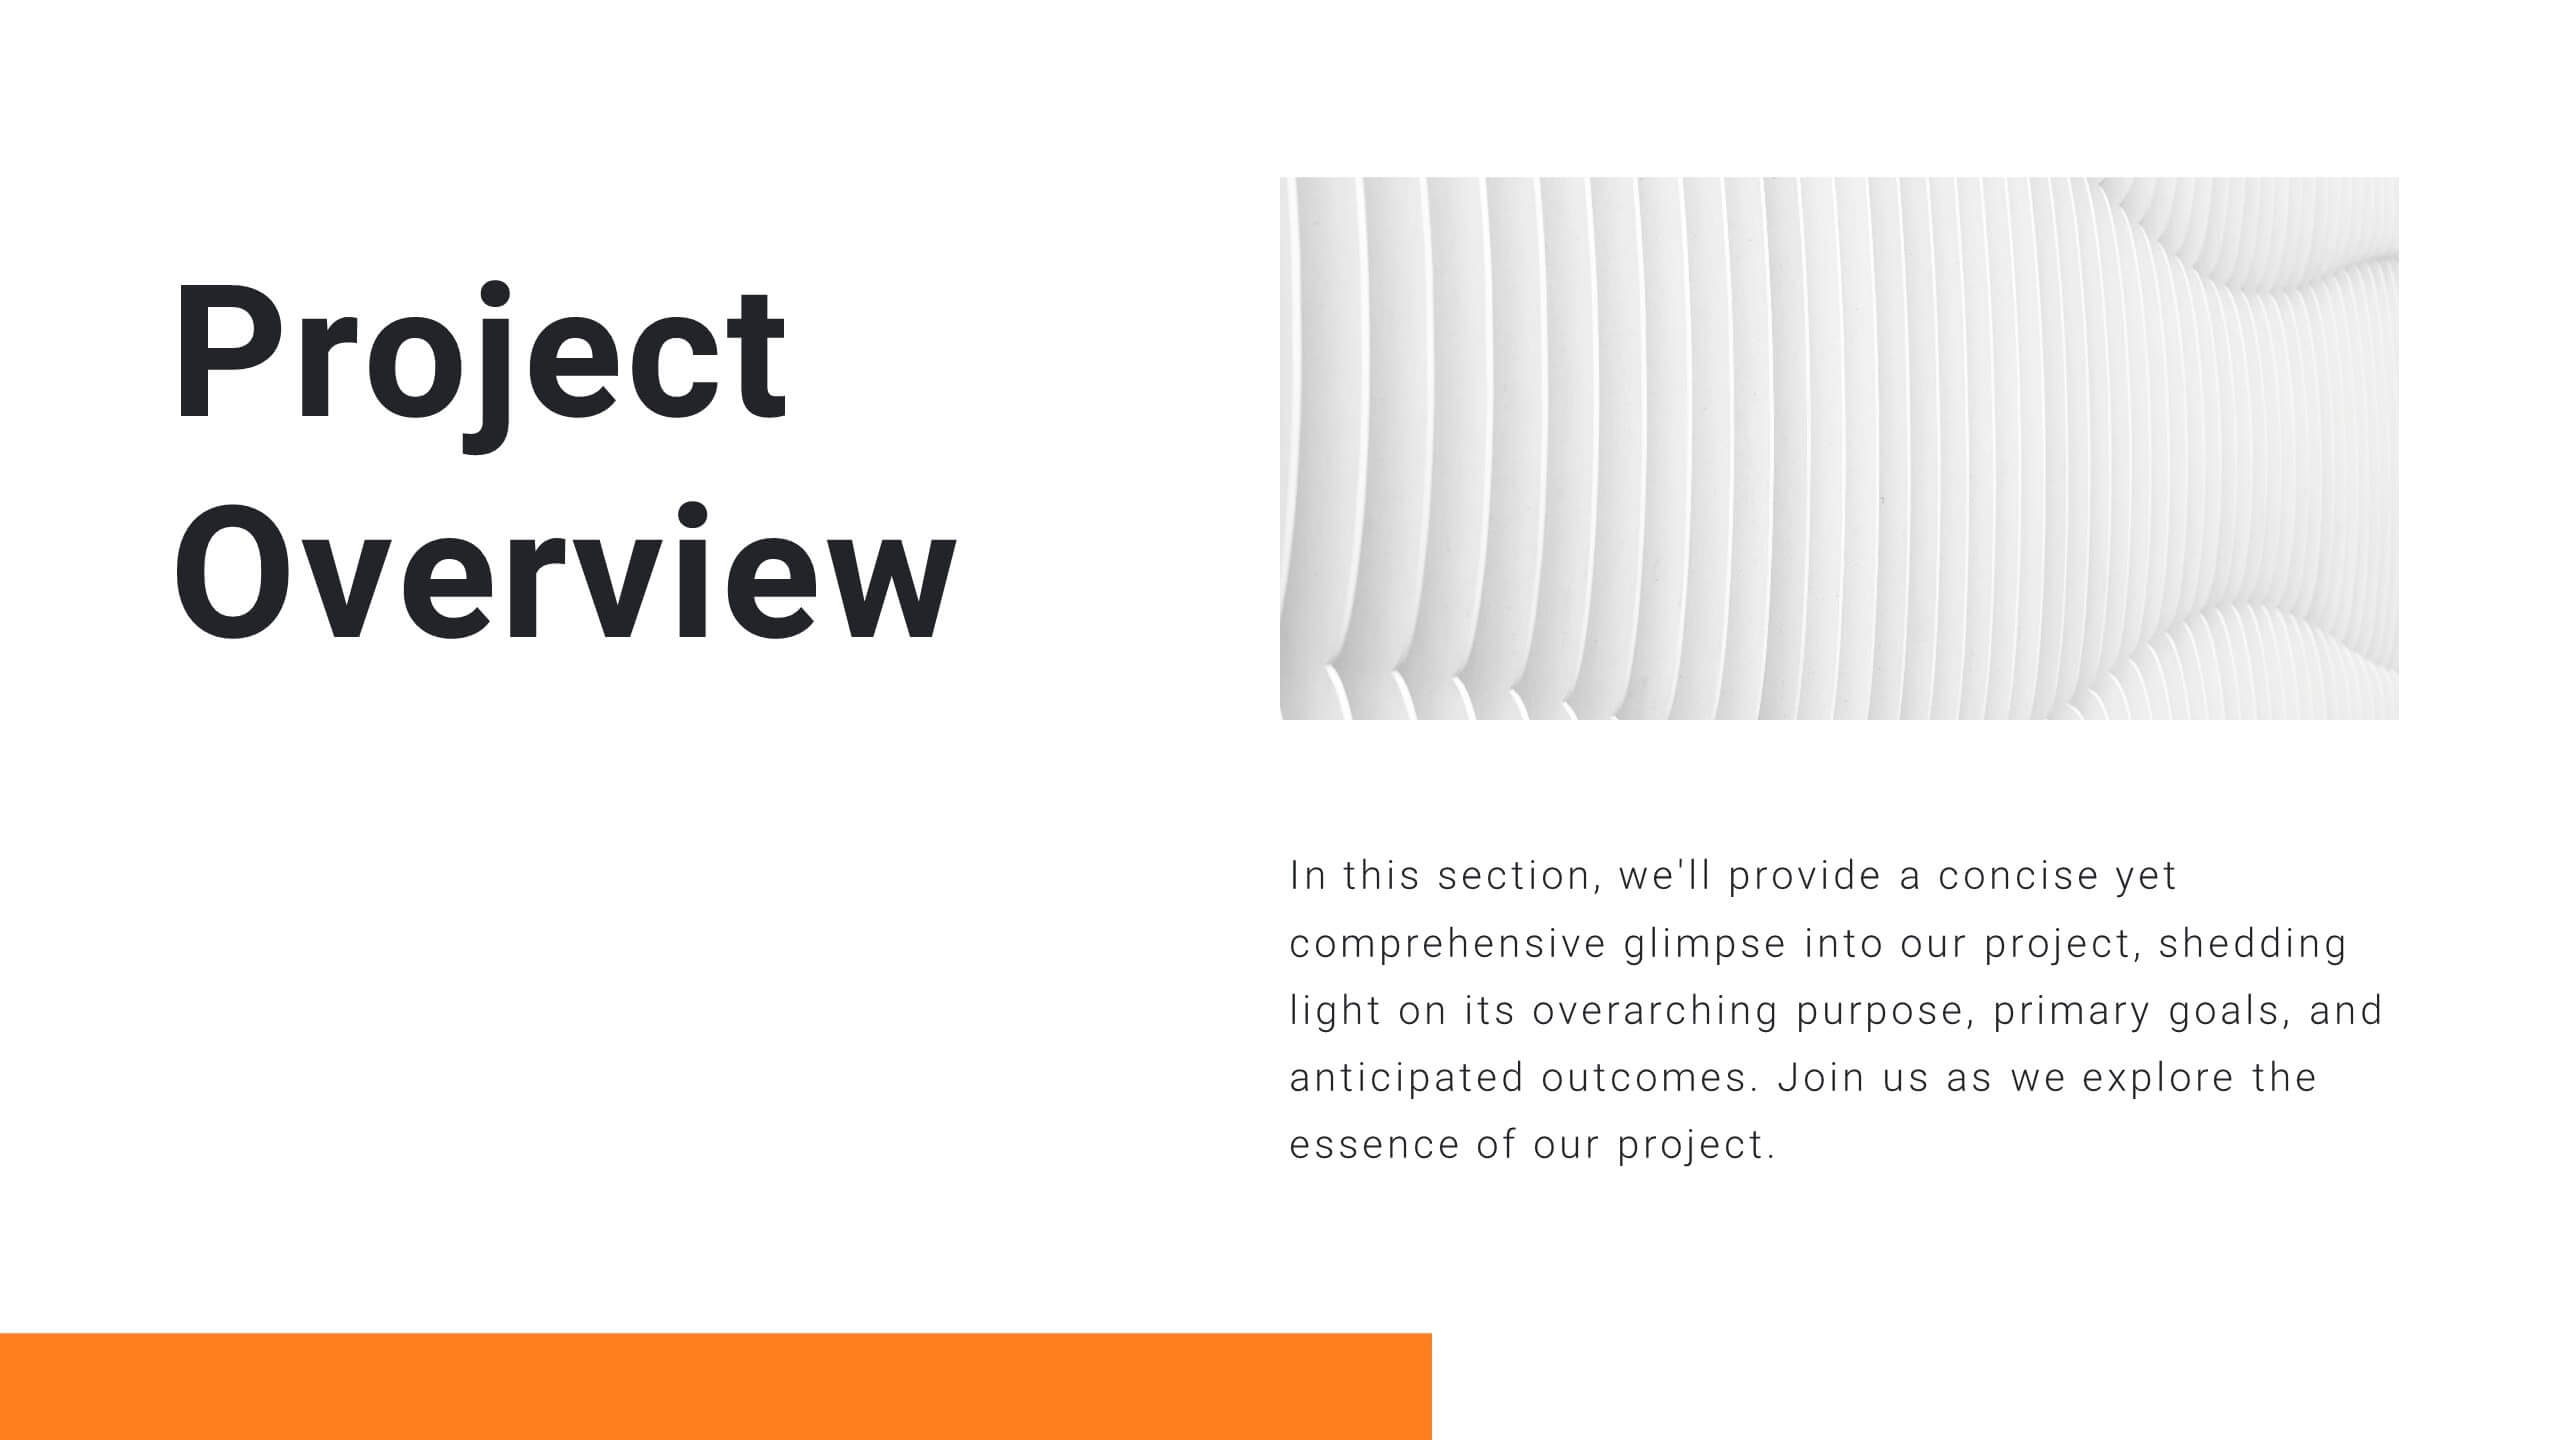
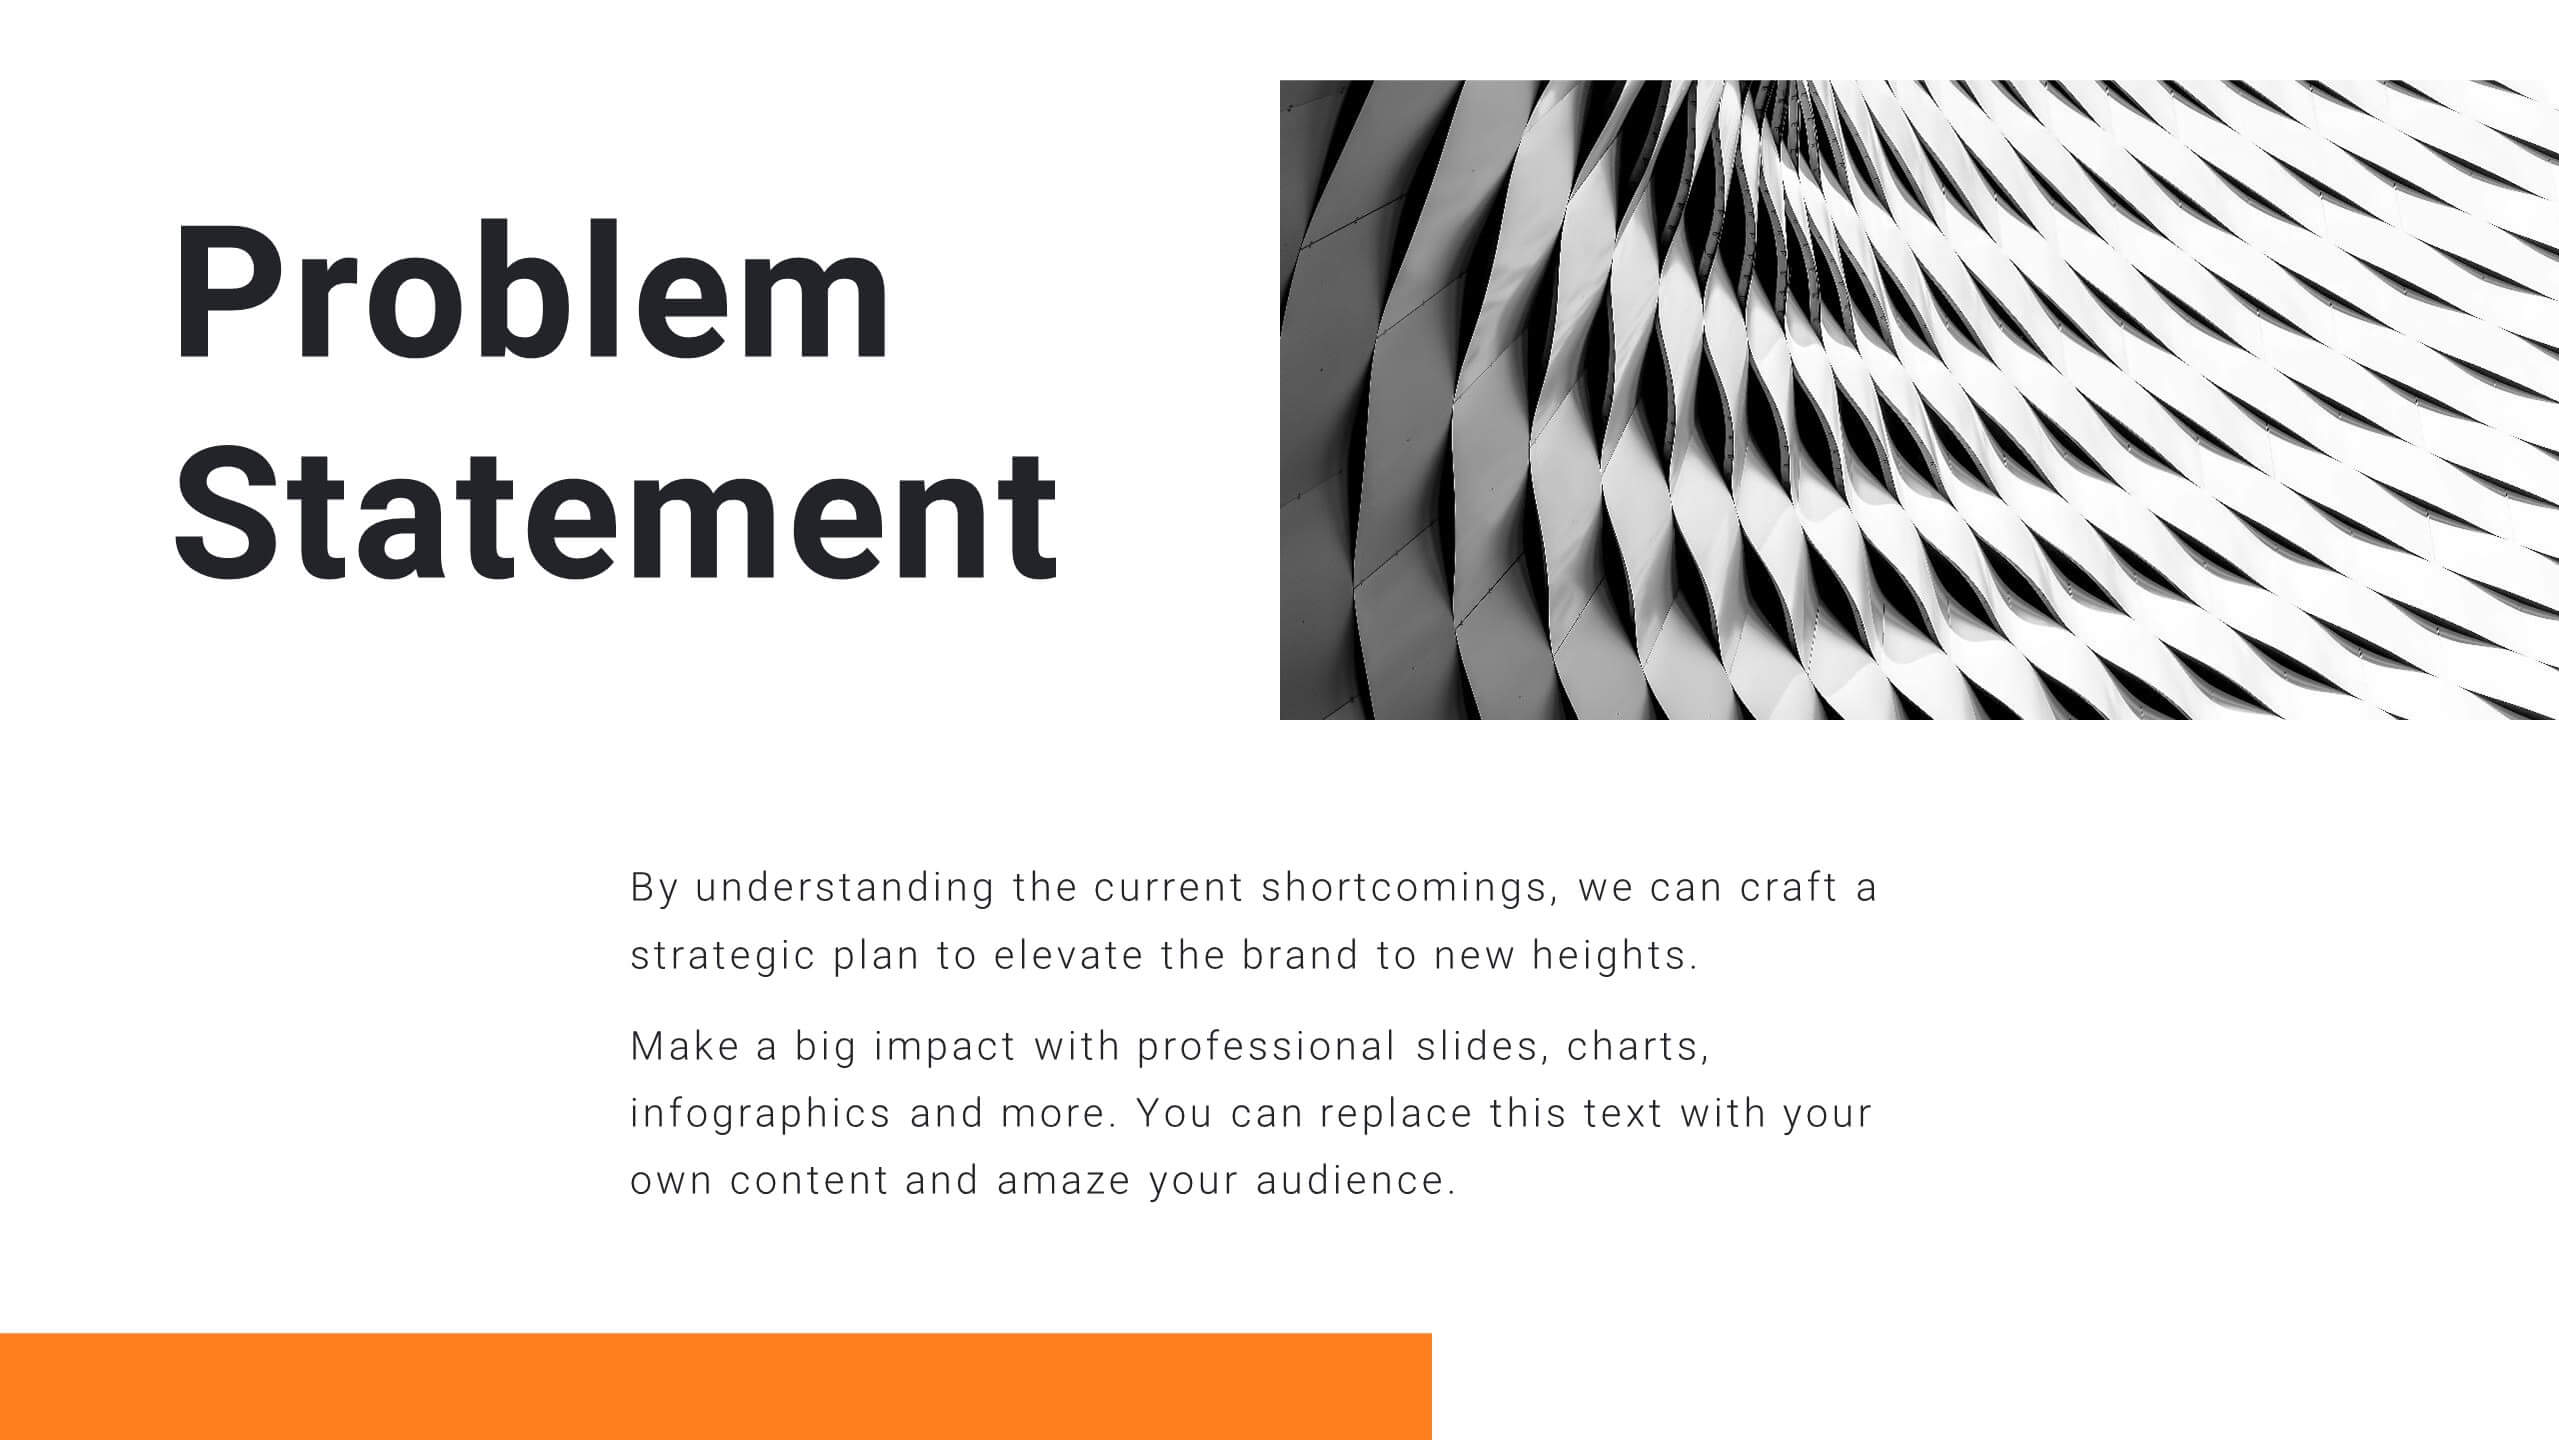
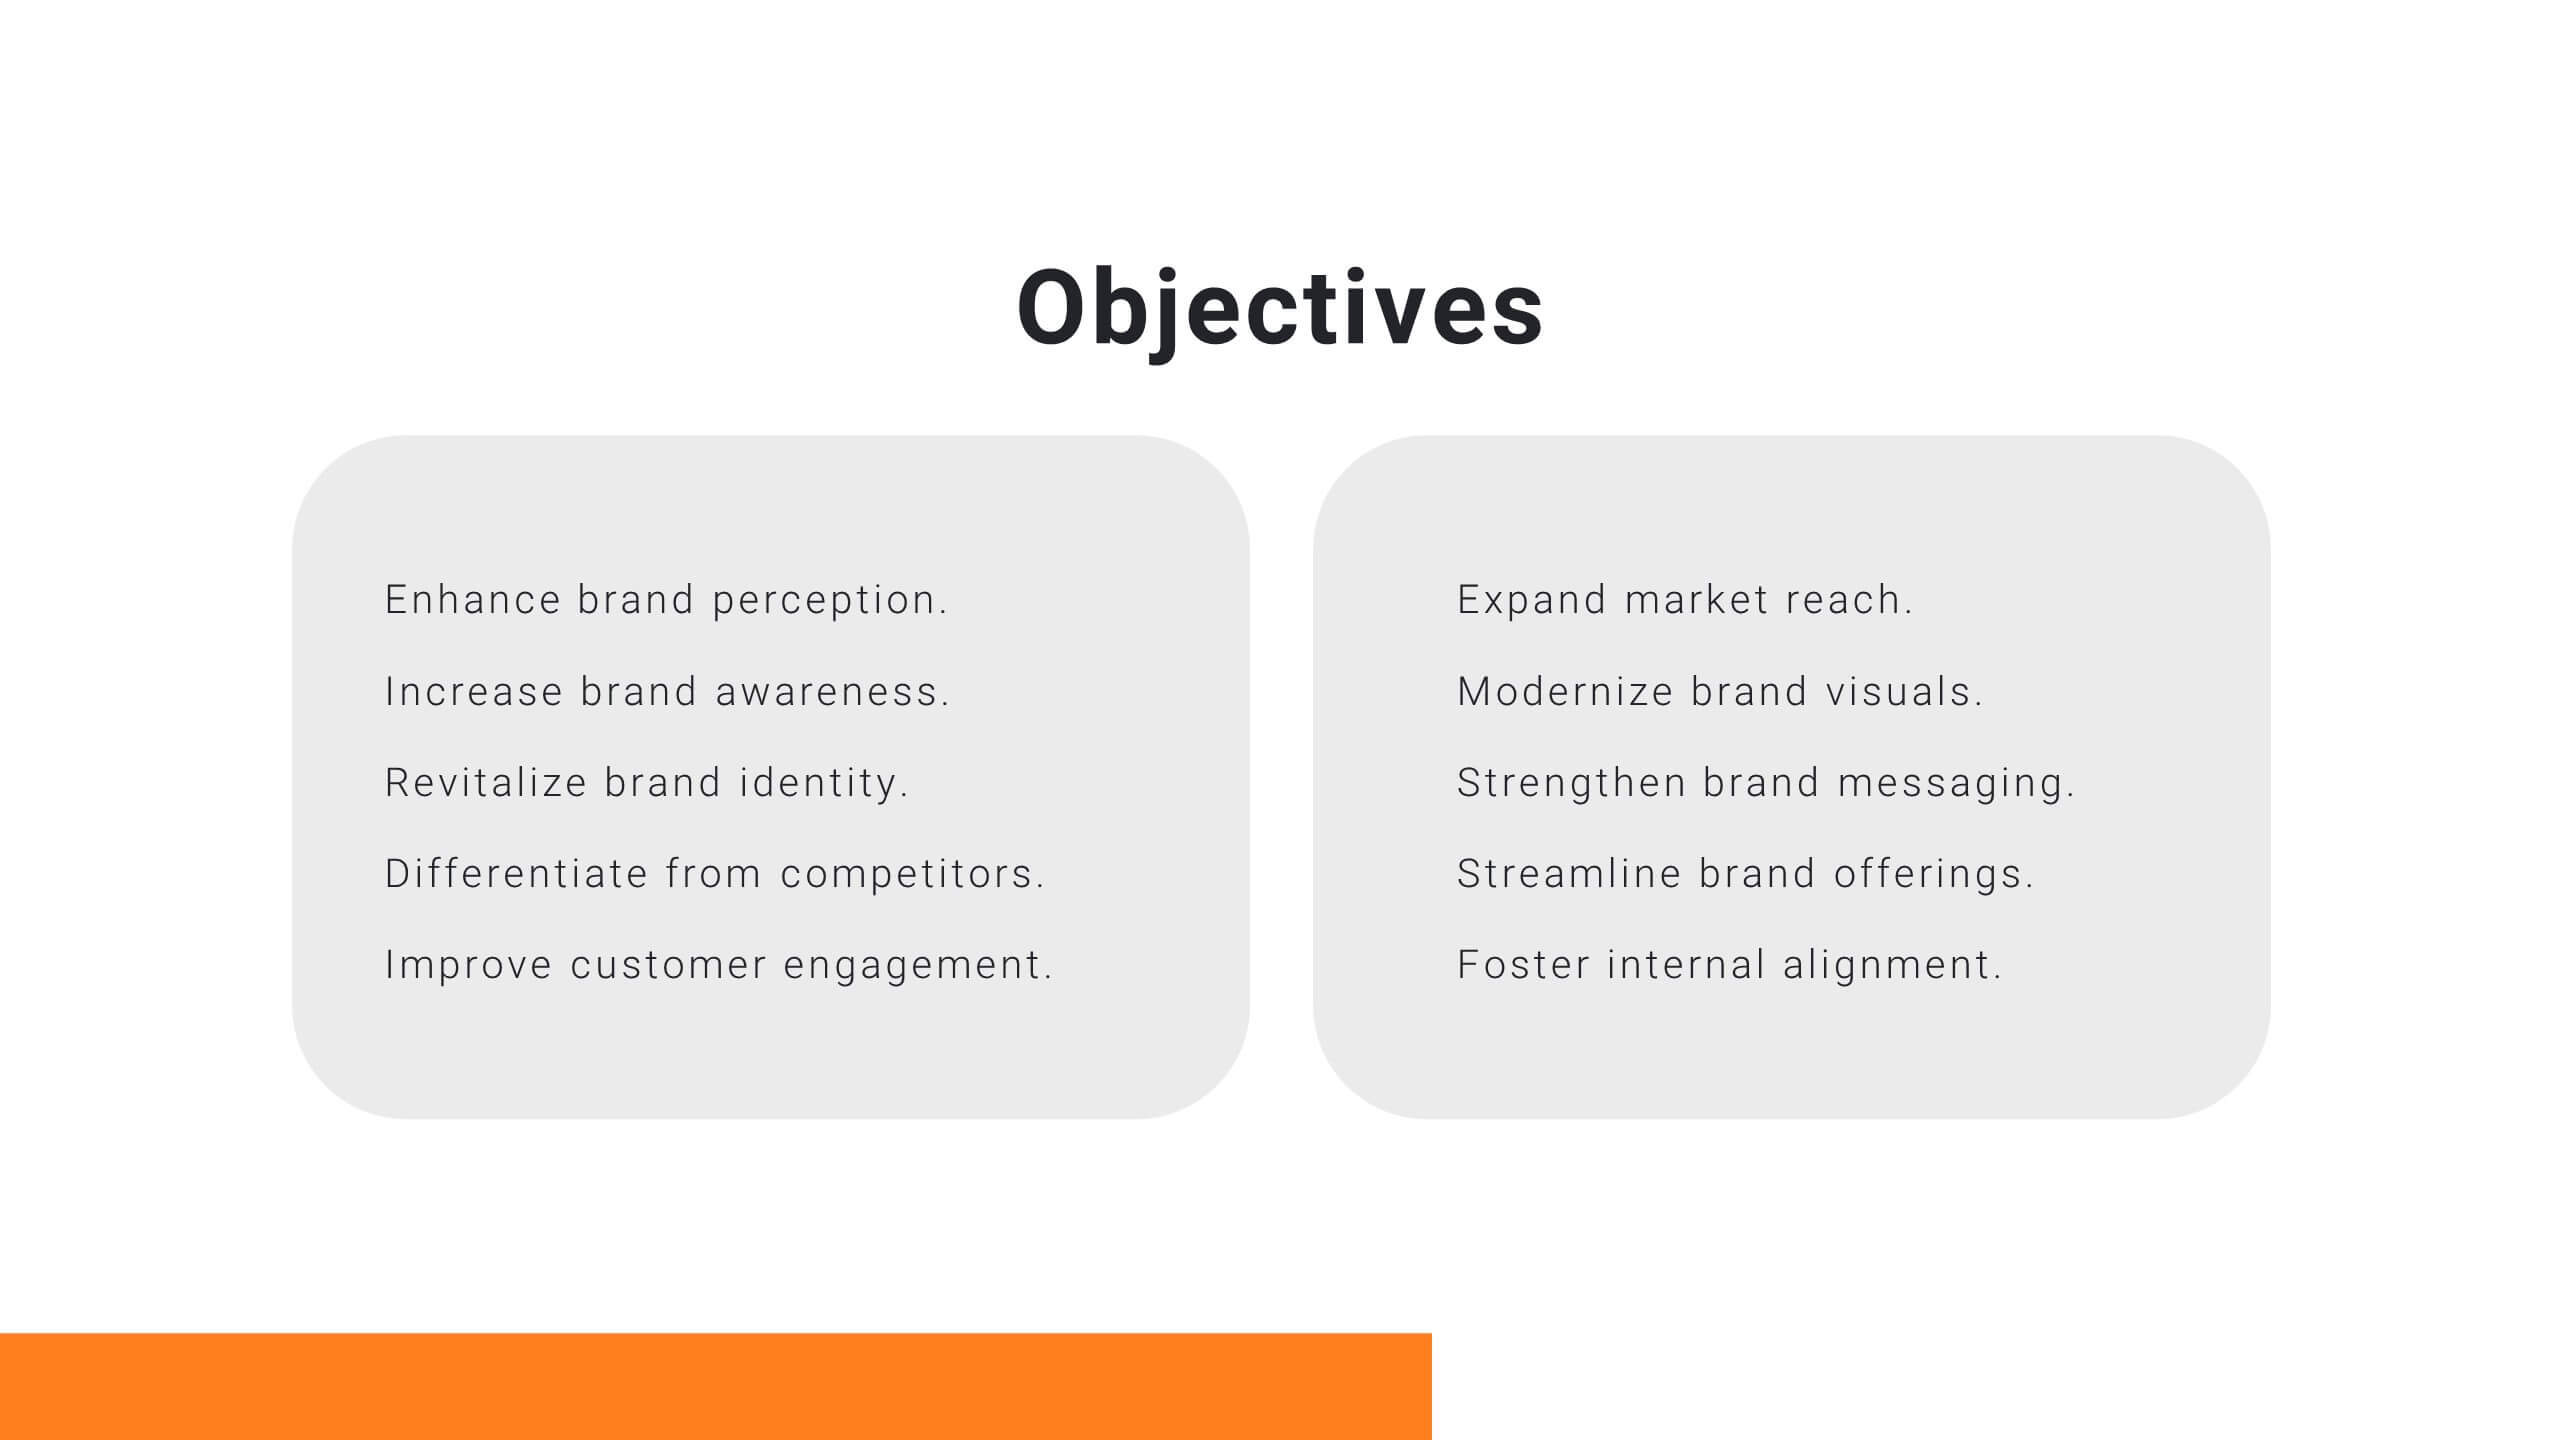
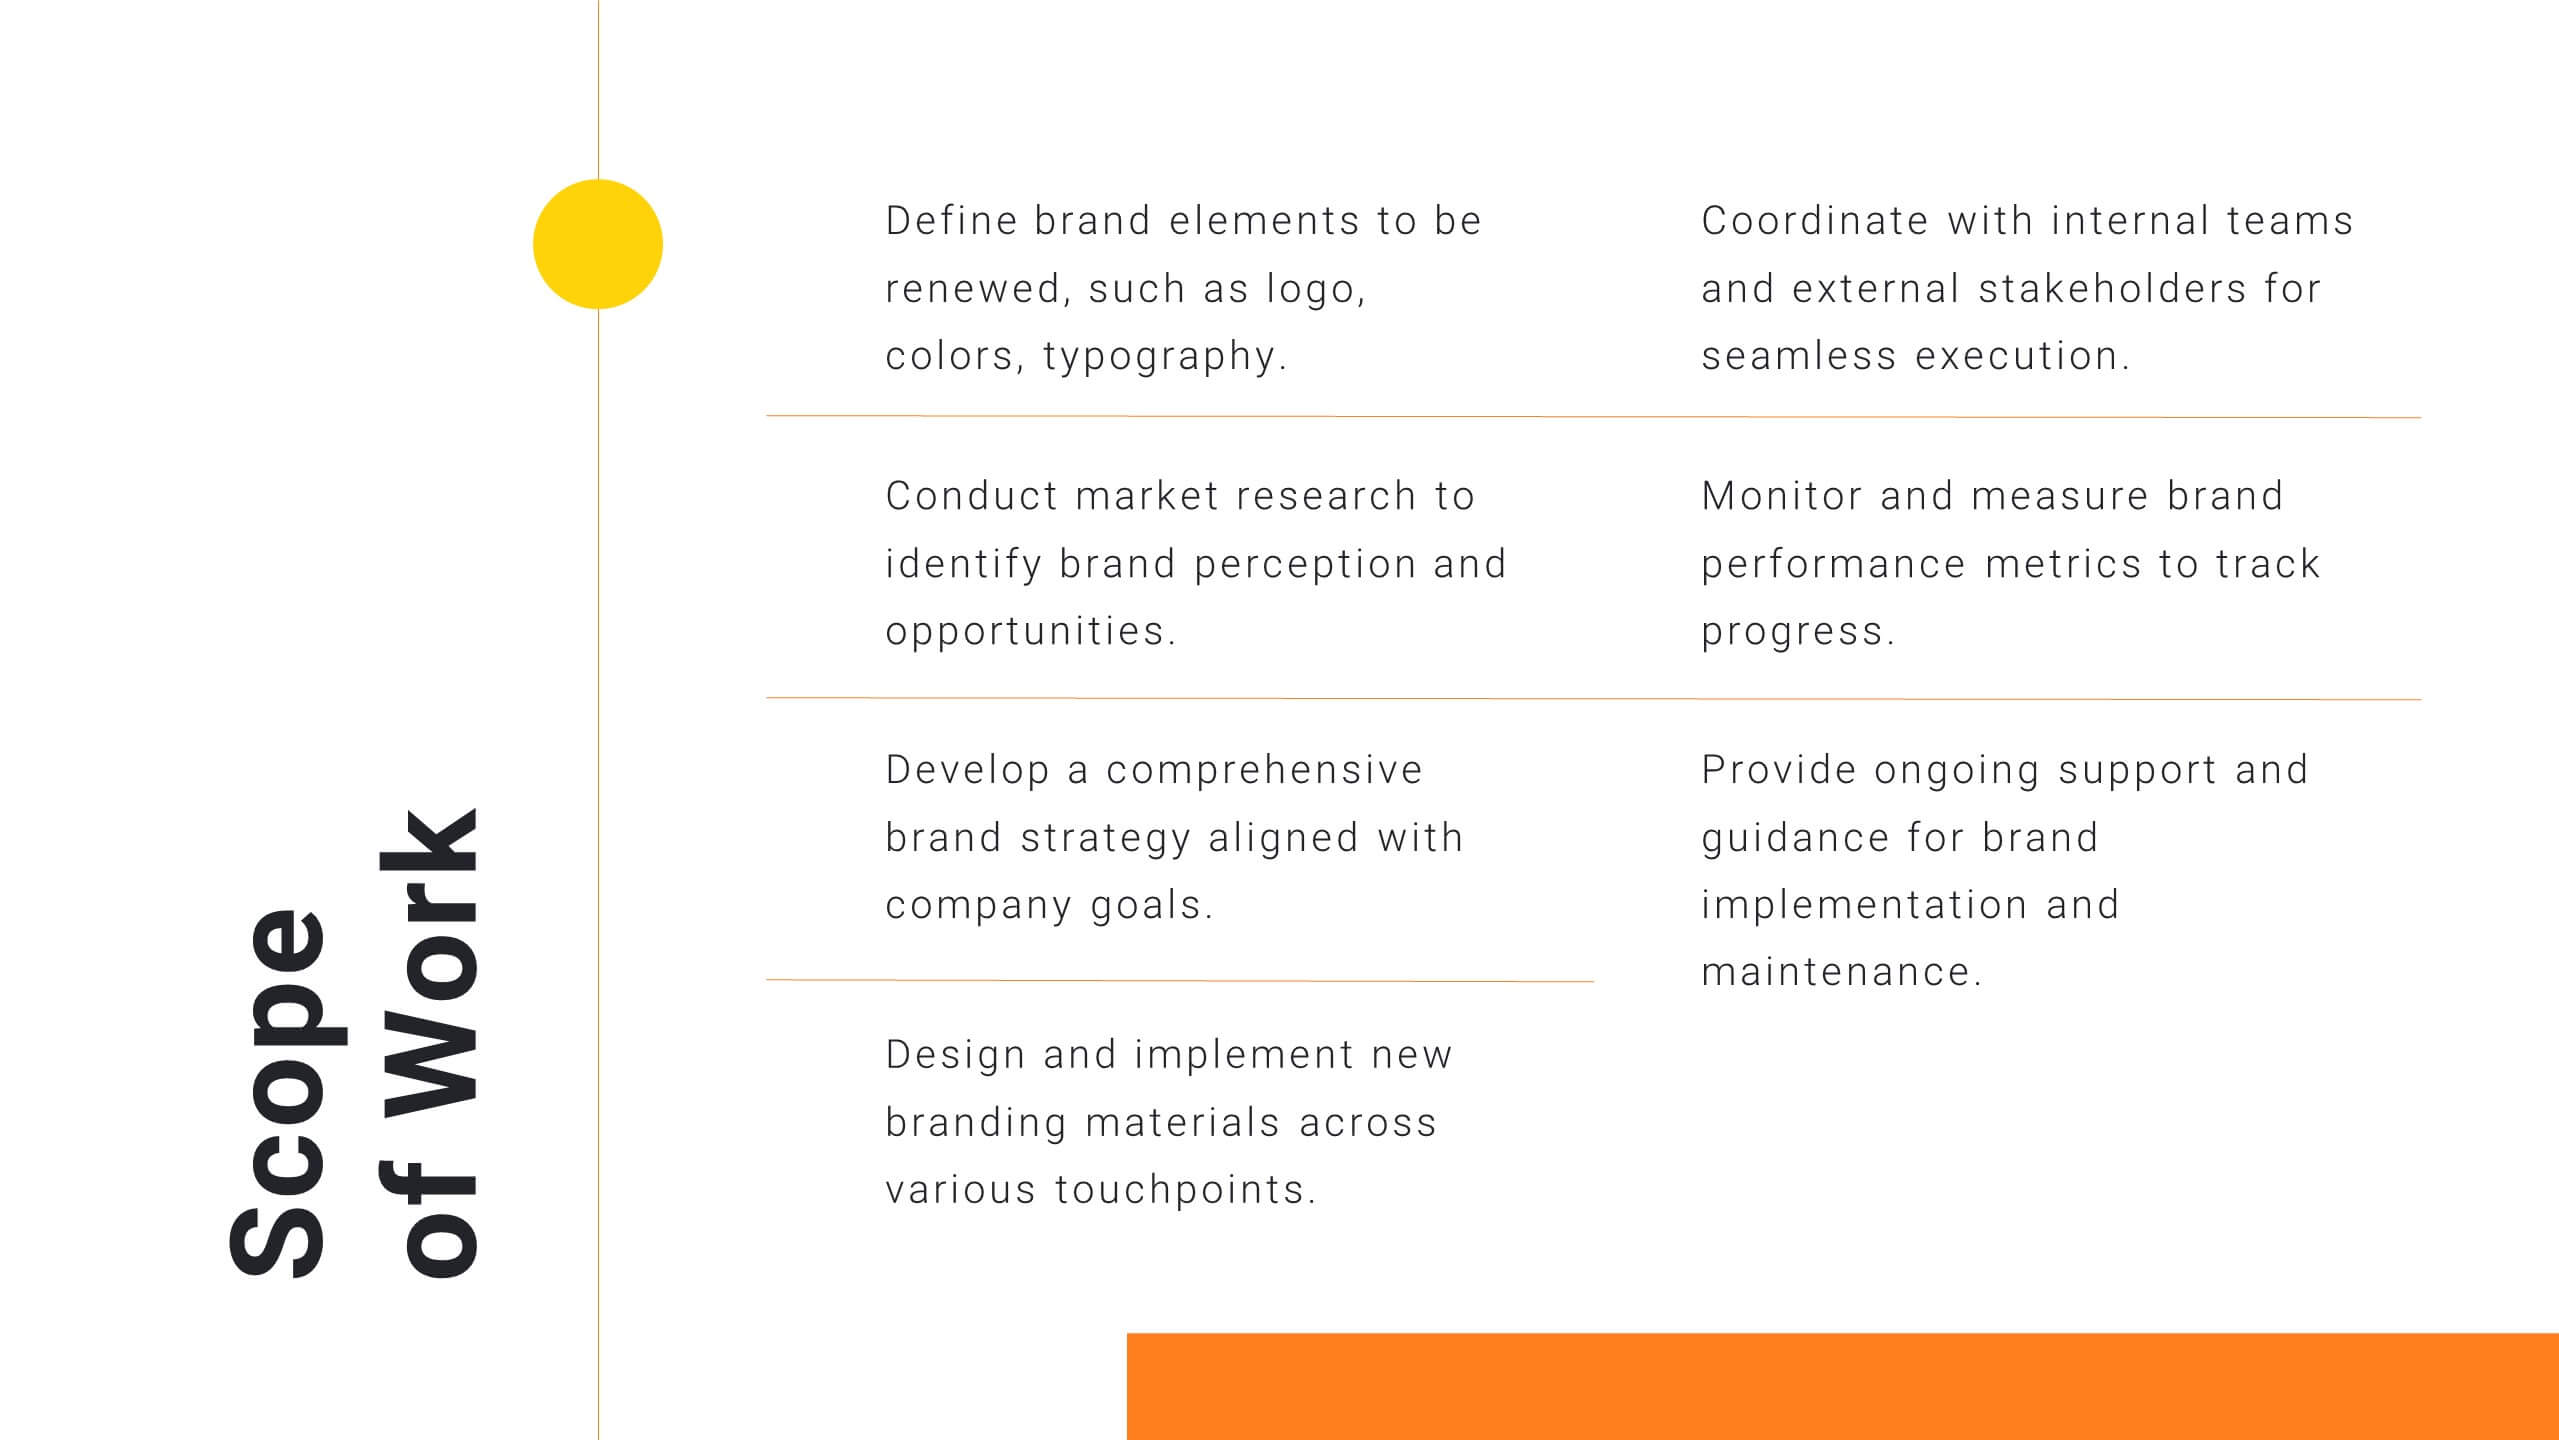
Project Proposal Structure Infographic
Optimize your project planning and presentation with this professional set of project proposal structure templates. Each slide is designed to systematically display project details, from the introduction and objectives to the detailed work plan and budget. These templates are essential tools for project managers, strategists, and business analysts aiming to convey comprehensive project proposals. Structured to support clear communication, the templates feature a logical flow that guides viewers through each critical component of the proposal. The use of a consistent blue color palette and clean typography helps maintain focus on the content, while graphical elements like charts and timelines visually break down complex information, making it easily digestible for stakeholders. Fully customizable, these templates allow for easy adaptations to specific project needs, enabling precise tailoring of text, color, and design elements. Whether for internal project approval or external client pitches, these slides will help you present a clear, structured, and persuasive project proposal.


4 slides
Real Estate and Housing Market Presentation
Turn market insights into visual stories that captivate investors and clients alike. This sleek and modern presentation helps you illustrate property trends, housing data, and real estate growth with clarity and confidence. Fully customizable and compatible with PowerPoint, Keynote, and Google Slides for easy editing and professional results.


6 slides
Three-Point Framework Triangle Diagram Presentation
Break down complex strategies with the Three-Point Framework Triangle Diagram template. This visually structured design helps you present key business components in a clear, logical format, making it ideal for decision-making, planning, and analysis. Fully customizable and easy to use, it's compatible with PowerPoint, Keynote, and Google Slides for seamless integration.


6 slides
Editable Weekly Calendar Slide Presentation
Bring your week into focus with a vibrant layout that turns daily planning into something you actually look forward to. This presentation helps you outline tasks, deadlines, and priorities in a clear, color-coded structure perfect for productivity. Fully editable and compatible with PowerPoint, Keynote, and Google Slides.


3 slides
Training & Development Modules Presentation
Present your program structure with the Training & Development Modules Presentation. This slide design features a 3D cube layout that clearly illustrates three learning modules, each with space for a title, icon, and description. Ideal for onboarding, employee growth, or educational programs. Fully editable in Canva, PowerPoint, Keynote, and Google Slides.


5 slides
Progress and Performance Yearly Review Presentation
Highlight key milestones along your business journey with this winding roadmap-style slide. Designed for annual reviews, it features five flag markers for progress tracking, goals, or achievements. Ideal for reports or team updates. Fully customizable in PowerPoint, Keynote, and Google Slides for seamless adaptation to your yearly metrics.


5 slides
Fitness Program Infographics
A fitness program is a structured plan designed to improve and maintain physical health and well-being. These vertical infographics outline the key elements and benefits of a fitness program. This template is ideal for gyms, personal trainers, and fitness enthusiasts looking to educate and inspire others to adopt a healthy and active lifestyle. The infographics offer space to include customizable workout plans tailored to different fitness levels, such as weight loss, muscle gain, or overall fitness improvement. Helpful nutrition tips are incorporated to complement the fitness program, emphasizing the importance of achieving fitness goals.


7 slides
Relationship Infographics Presentation Template
Featuring our Relationship Infographic template, this provides the entire process of relationship building in its true form. This infographic will take you through the stages of building a relationship. This design is good for any purpose and can be used as a template for many presentations. Use this template to illustrate your ideas, put forward an argument, or make statistics and facts catchy. In this template, you’ll find everything you need to create a gorgeous relationship infographic. This is the perfect way to share your story and create an emotional connection with your audience.


6 slides
Managing Product Maturity and Decline Presentation
Explore the critical phases of 'Managing Product Maturity and Decline' with this detailed presentation template. It's designed for professionals in product management, illustrating strategies to handle product lifecycle stages effectively. This template is a must-have for seminars and workshops focusing on prolonging product lifespan and maximizing returns.


21 slides
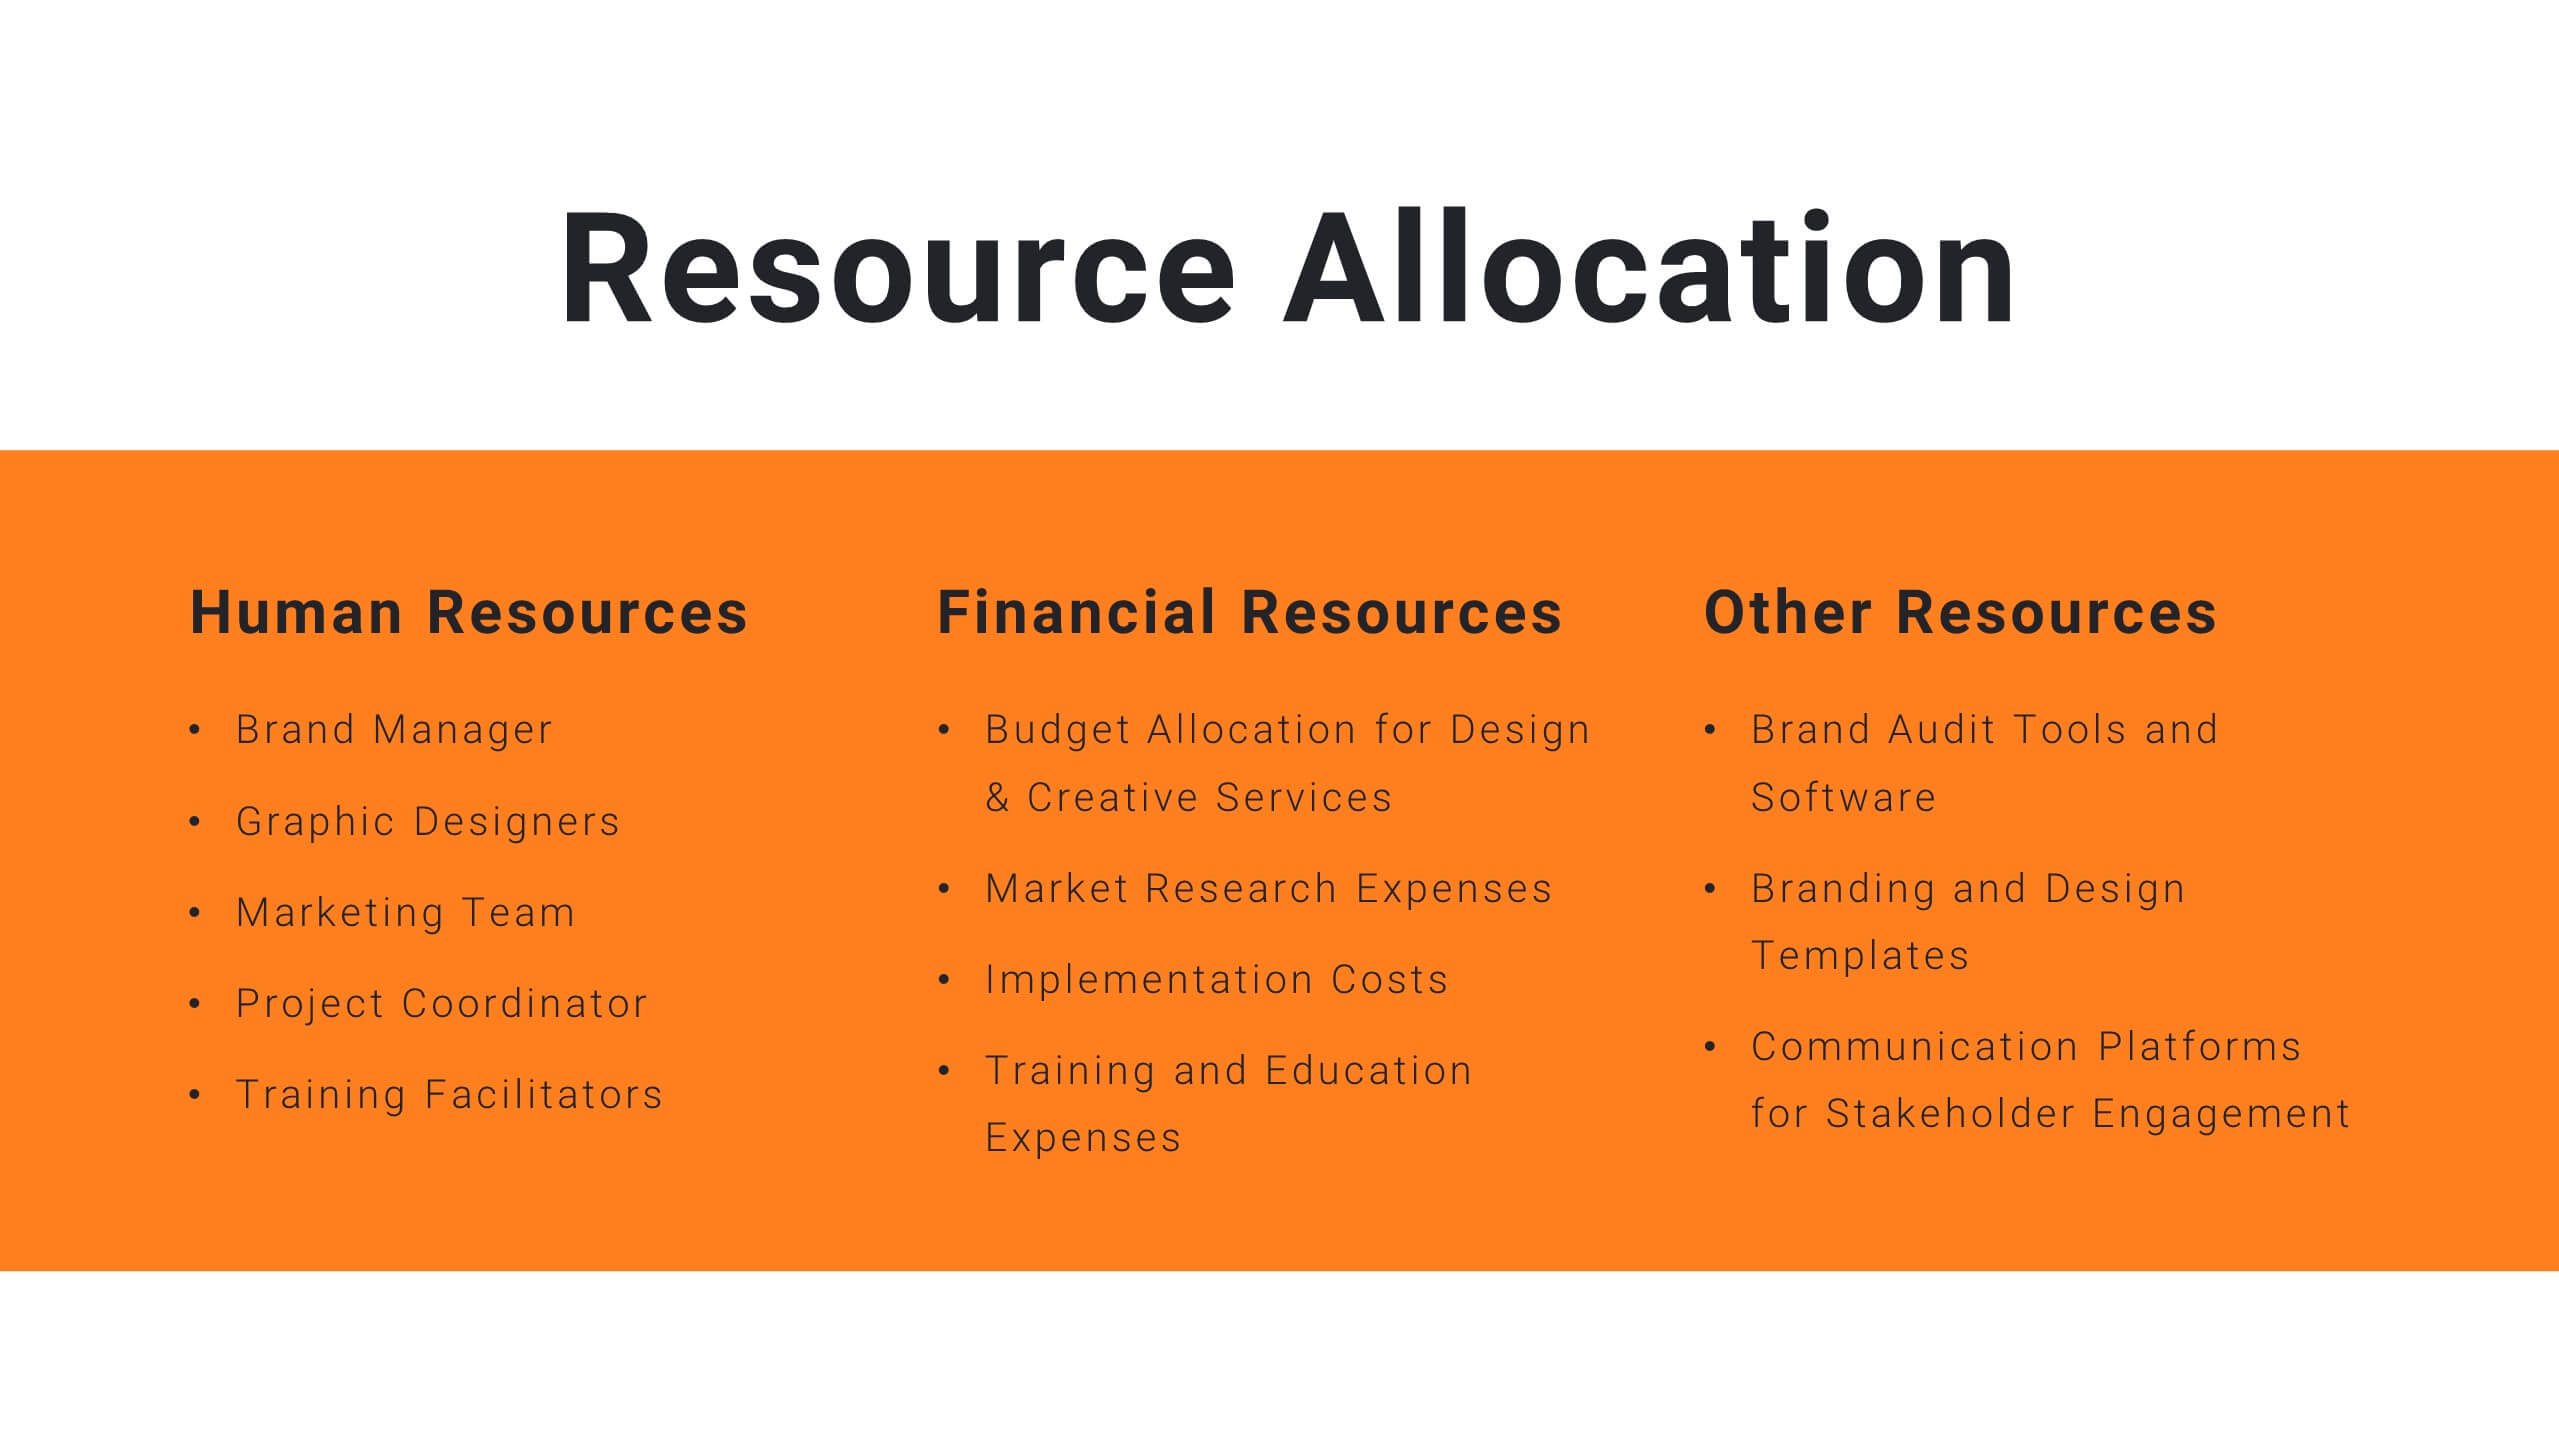
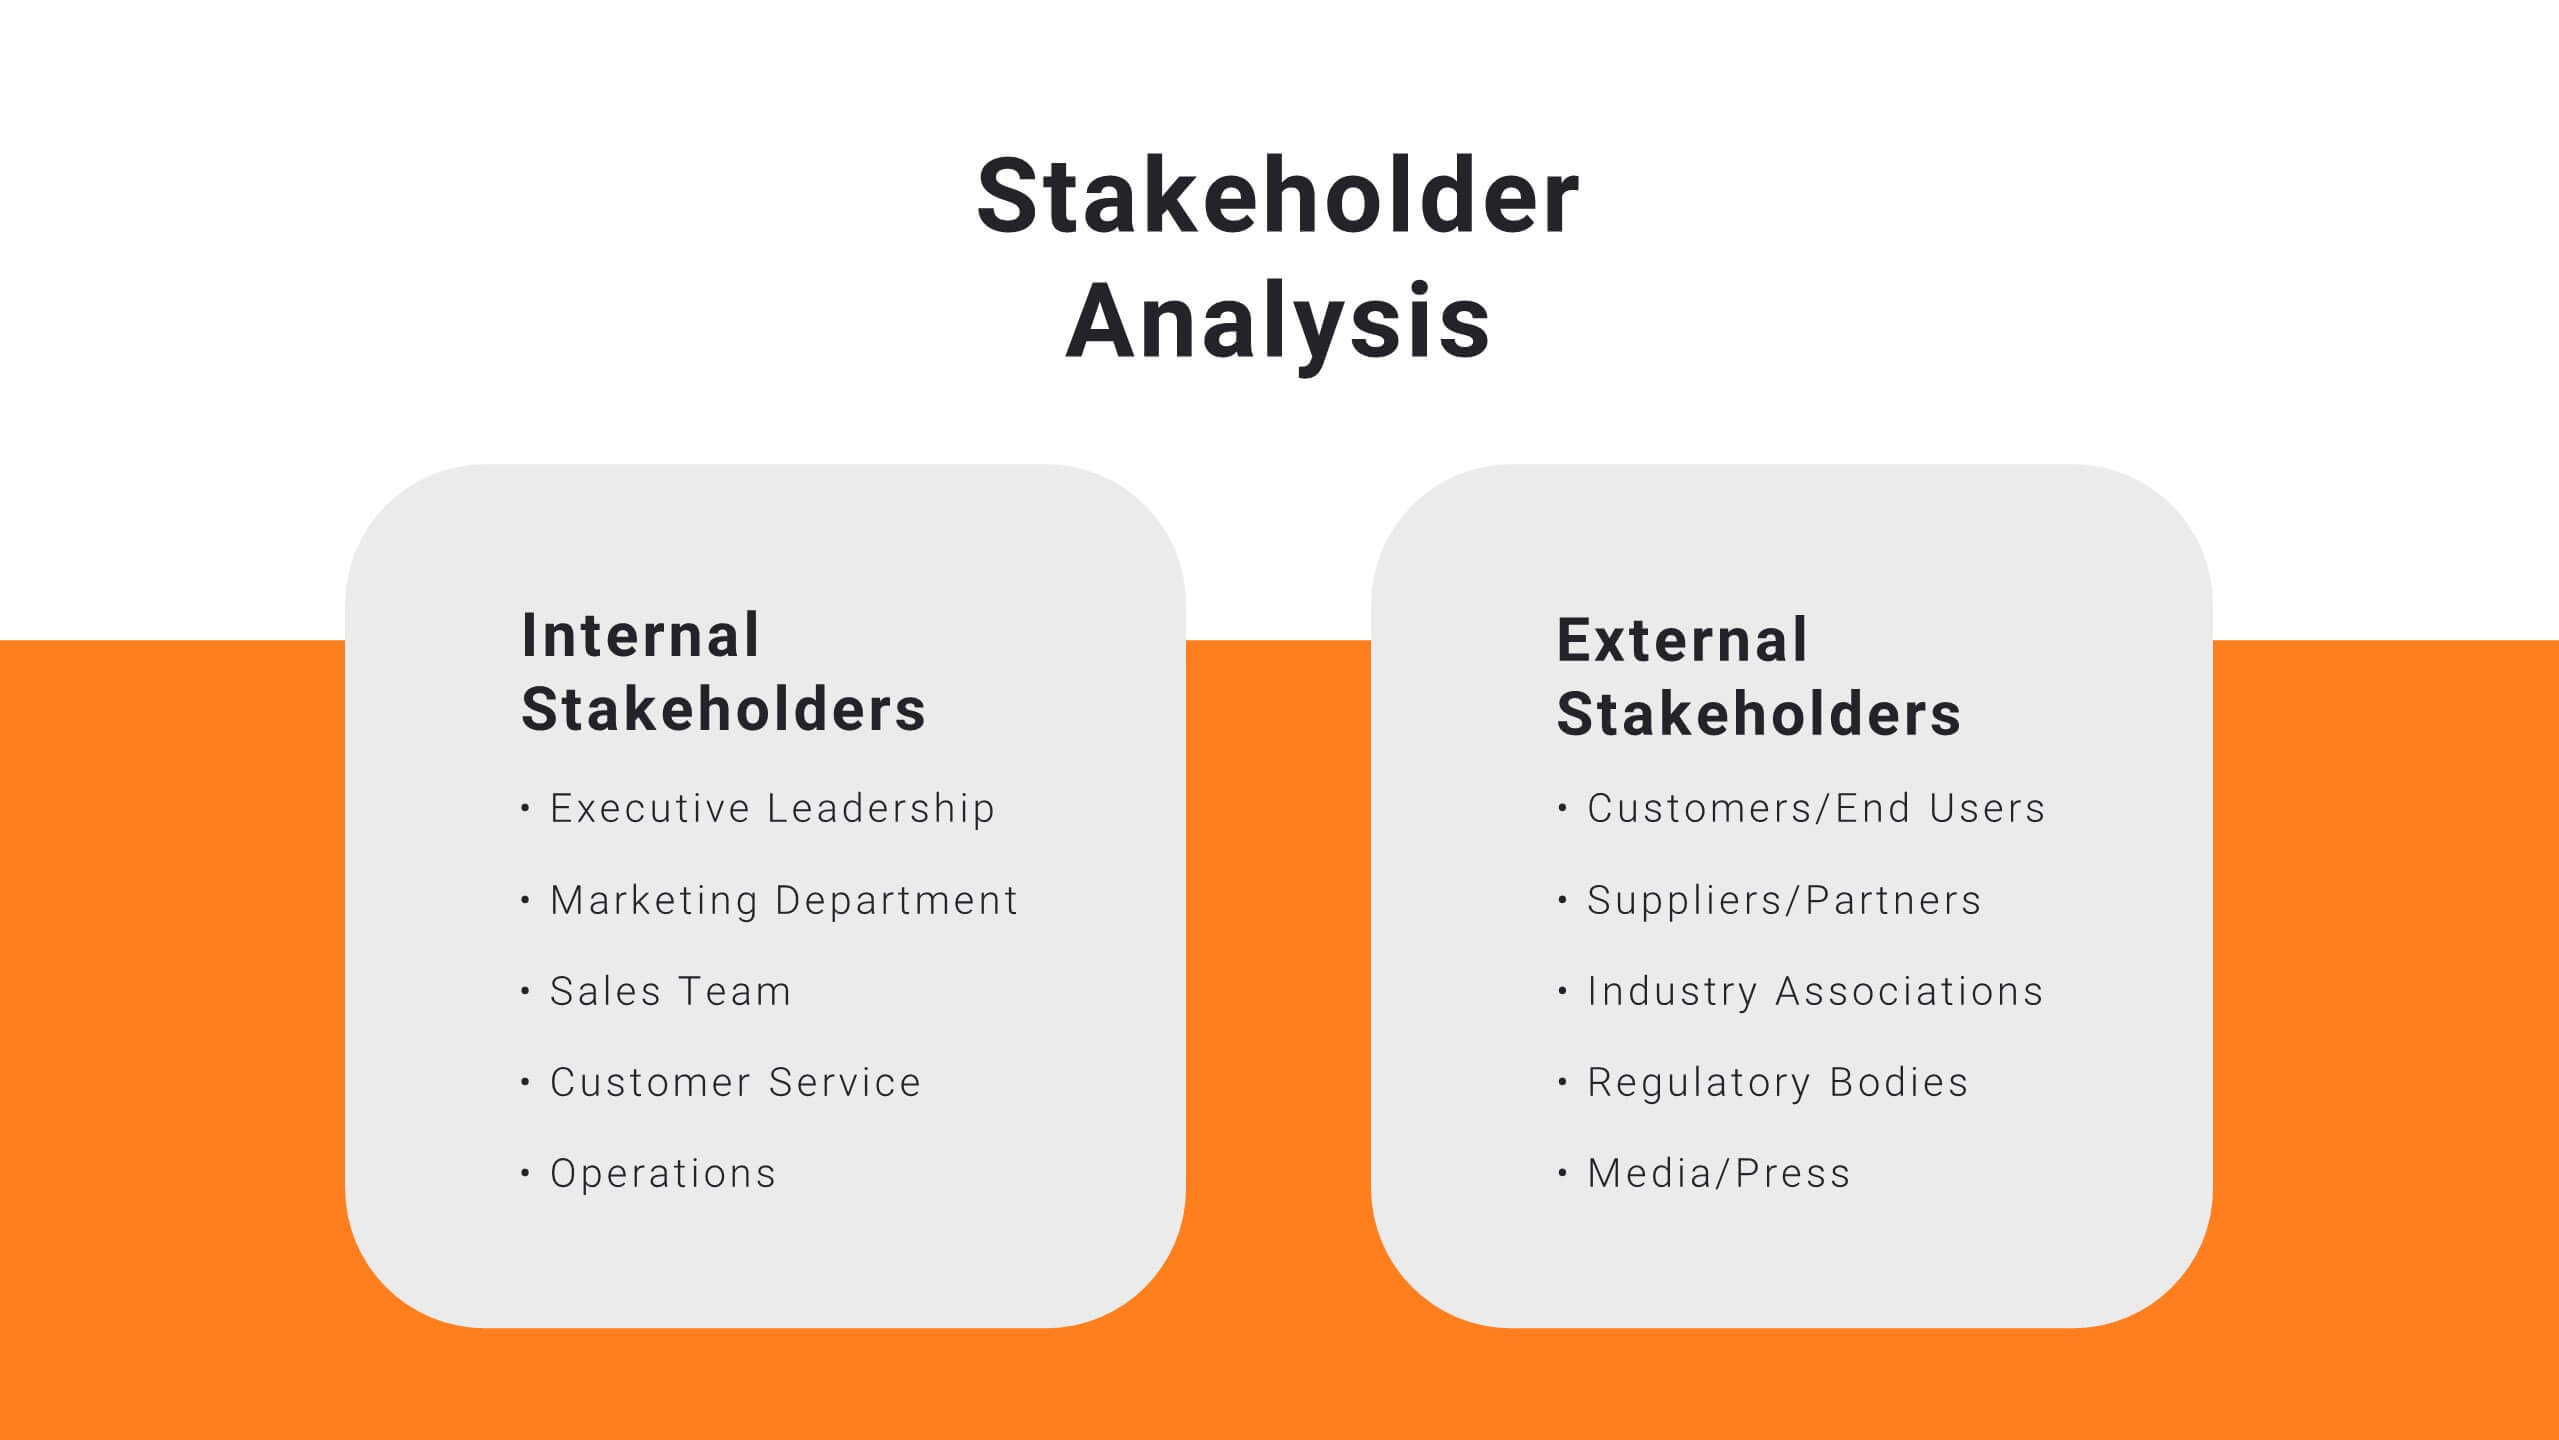
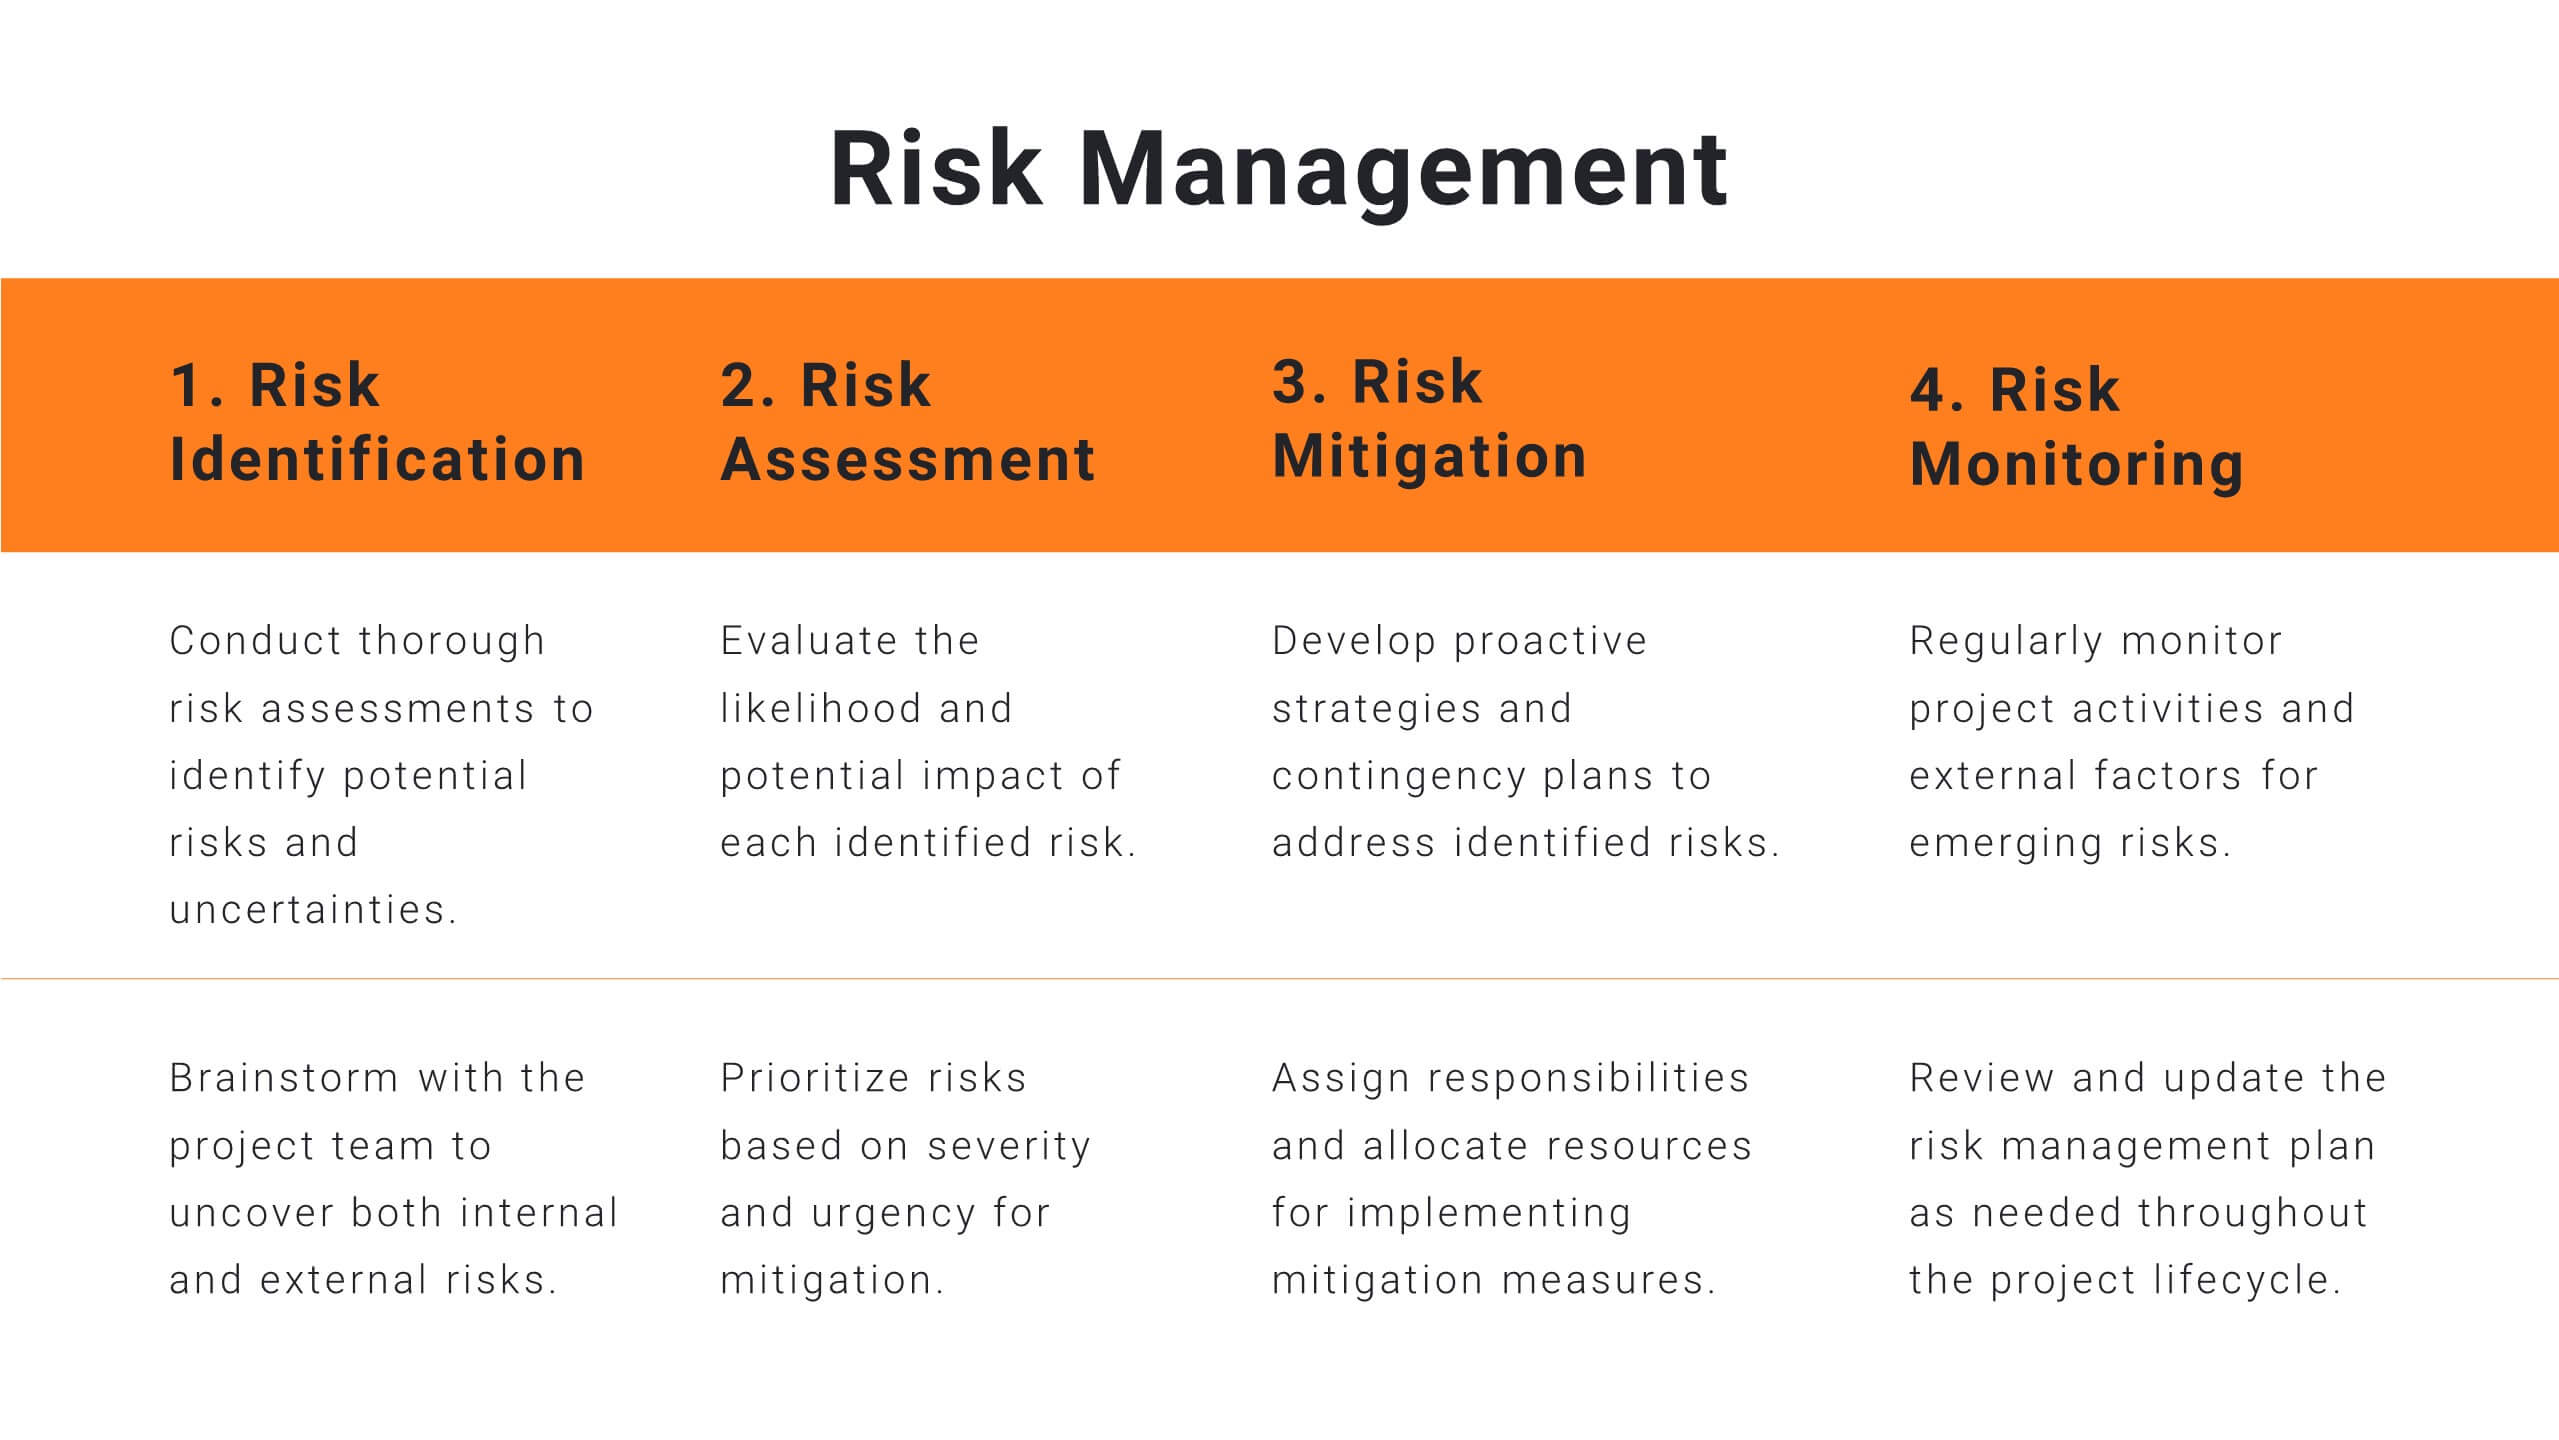
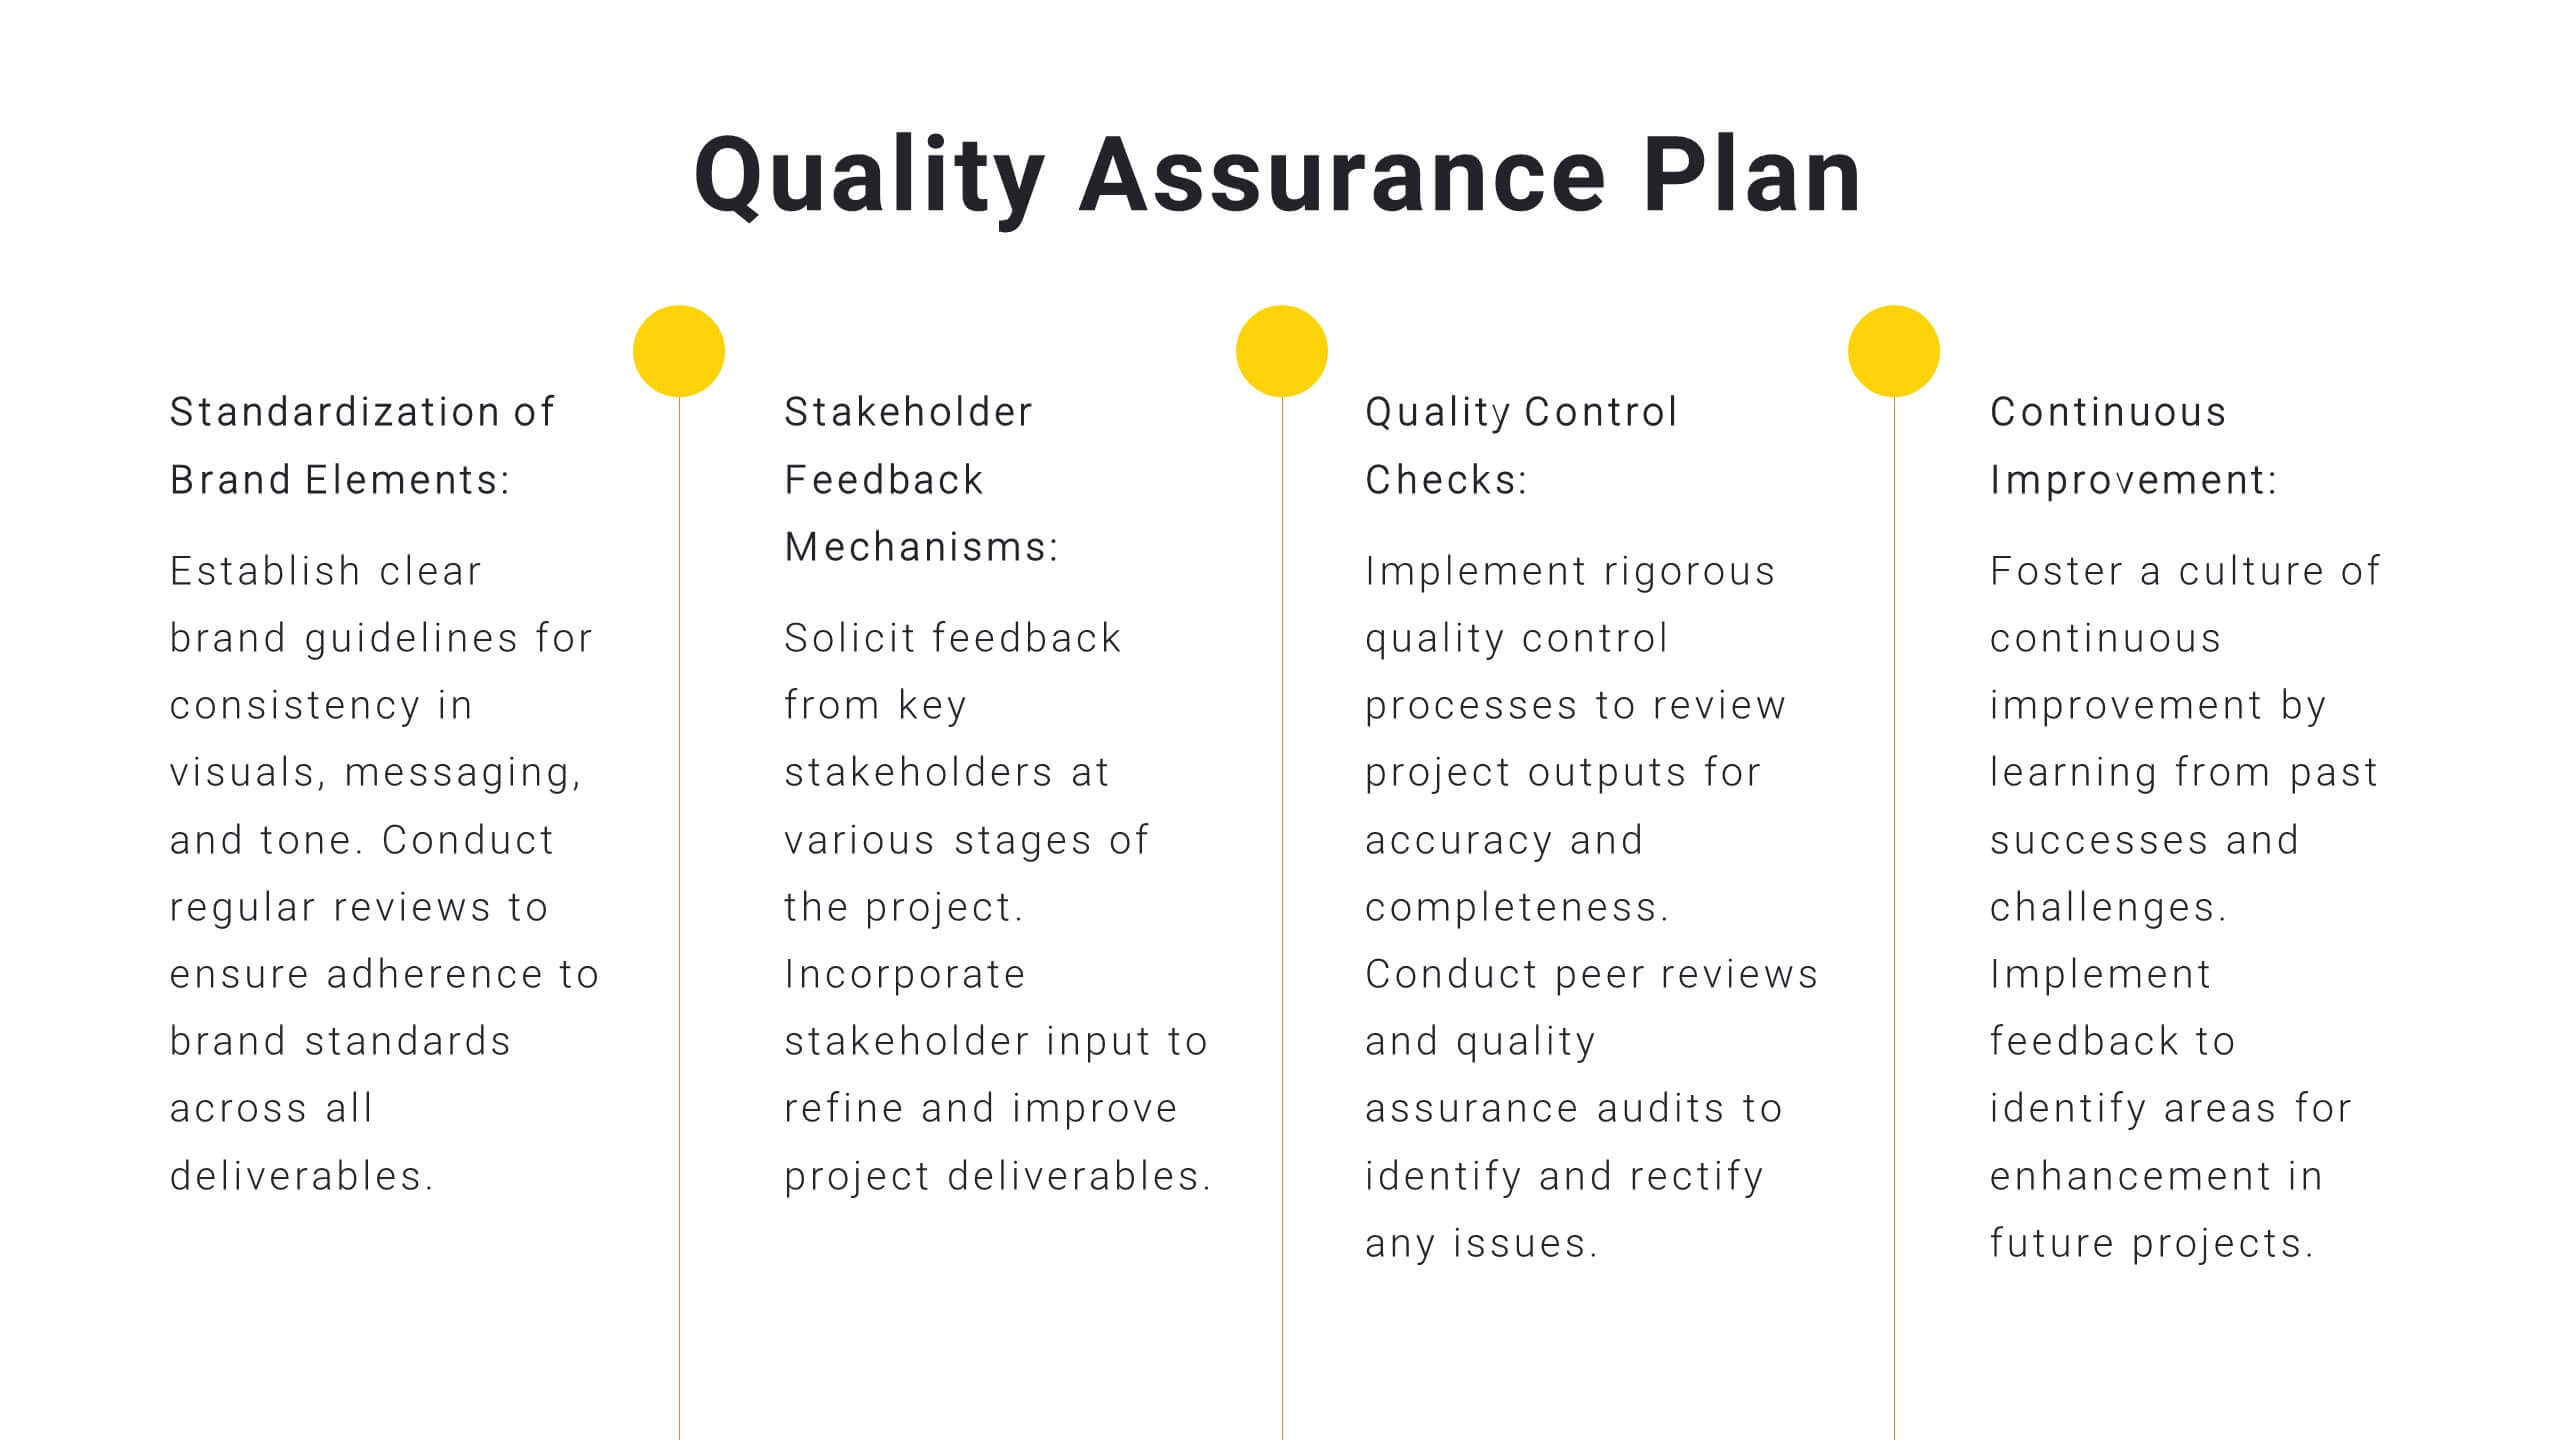
Harmony Project Management Plan Presentation
Plan your project efficiently with this comprehensive project management plan template! It covers all essential aspects including timeline, budget, resource allocation, and risk management. Ensure smooth project execution and achieve your objectives. Compatible with PowerPoint, Keynote, and Google Slides, it's designed to streamline your project planning and management process.


5 slides
Likelihood vs Impact Risk Matrix Presentation
Clearly prioritize your risks with the Likelihood vs Impact Risk Matrix Presentation. This intuitive grid layout lets you map potential threats based on severity and probability, helping teams focus on what matters most. Ideal for strategic planning, audits, and project risk reviews. Editable in PowerPoint, Canva, Keynote, and Google Slides.


8 slides
Business Purpose and Mission Alignment Presentation
Clarify your organization’s direction with this step-by-step alignment slide. Featuring four sequential stages, each with icons, numbers, and customizable text boxes, this layout helps visually communicate how your business goals align with your mission. Perfect for strategic planning, team alignment workshops, and leadership presentations. Fully editable and compatible with PowerPoint, Keynote, and Google Slides.


7 slides
Science Research Infographic
Science research, is a systematic and organized inquiry that aims to generate new knowledge, validate existing knowledge, or solve specific problems using scientific methods and principles. This infographic template aims to present your science research initiatives, achievements, and vision to the audience in an engaging and informative way. This is essential to convey complex scientific data and discoveries in a visually appealing manner. Fully customizable and compatible with Powerpoint, Keynote, and Google Slides. Adapt and personalize the content to align with your specific research center's focus and mission.