


Features
- 6 Unique slides
- Fully editable and easy to edit in Microsoft Powerpoint, Keynote and Google Slides
- 16:9 widescreen layout
- Clean and professional designs
- Export to JPG, PDF or send by email


Do you have any questions?
Recommend


12 slides
Business Networking Strategy
Showcase your connection-building roadmap with this hexagonal Business Networking Strategy template. Ideal for illustrating partnerships, key contacts, or collaboration phases, this layout helps structure complex relationships with clarity. Fully customizable in PowerPoint, Keynote, and Google Slides to match your branding and networking objectives.


26 slides
Law Firm and Research Presentation
Discover the fantastic Law Firm Presentation Template, perfect for showcasing your legal expertise! With its clean, beautiful design and easy-to-understand visuals, this template is great for all ages. This versatile template works with both PowerPoint and Google Slides, allowing you to choose your preferred platform. Customizing the template is a breeze, thanks to its simple-to-edit features. With image placeholders, effortlessly drag and drop your favorite photos to create a unique, professional presentation. The clean design helps your audience focus on crucial content, while the beautiful elements provide a polished, modern look. Creative modern icons allow you to emphasize key points, making your presentation engaging and memorable. Our Law Firm Presentation Template is a time-saver, designed for quick, efficient editing. Create a powerful presentation that leaves a lasting impression on your audience with ease. Enhance your legal presentations with this amazing template. Its clean design, creative icons, easy editing, and compatibility with PowerPoint and Google Slides make it the perfect solution for your needs. Download now and elevate your legal presentations!


6 slides
Business Value Proposition Presentation
Ignite your strategy with this captivating template that highlights your unique business value. This tool breaks down key value propositions, market differentiators, and customer benefits in an engaging format. Perfect for pitching ideas, it clarifies competitive advantages and growth opportunities. Compatible with PowerPoint, Keynote, and Google Slides for seamless presentations.


2 slides
Elegant Title Slide Design Presentation
Dress your presentation in sophistication with the "Elegant Title Slide," where simplicity meets style. This template elegantly frames your opening remarks in a polished and refined layout, highlighted by a chic, contemporary office backdrop. Perfect for any business aiming to impress, it's fully compatible with PowerPoint, Keynote, and Google Slides. Elevate your presentation game with this seamlessly designed slide.


20 slides
Aurorium Sales Proposal Presentation
Win over clients with confidence using this sleek and modern sales proposal presentation. Designed to highlight key business strategies, pricing plans, competitive analysis, and future opportunities, this template helps you communicate your value with clarity and impact. Fully customizable and compatible with PowerPoint, Keynote, and Google Slides for seamless presentations.


21 slides
Thunderbird Small Business Pitch Deck Presentation
Take flight with this dynamic Thunderbird-inspired presentation, perfect for pitching your small business! Designed to highlight your business model, market potential, and financial projections, this template ensures your pitch is clear, compelling, and professional. Its bold visuals will help you soar. Compatible with PowerPoint, Keynote, and Google Slides.


4 slides
Workforce Skills Gap Analysis
Spot the gap. Bridge the skills. This Workforce Skills Gap Analysis slide helps visualize the journey from your team’s current capabilities to their desired performance level, with a clear action plan in between. Fully editable and works seamlessly in PowerPoint, Keynote, and Google Slides.


2 slides
Mobile and Laptop Mockup Devices Presentation
Showcase your designs with the Mobile and Laptop Mockup Devices presentation template. Featuring clean and modern device frames, this slide helps you present responsive web designs, app interfaces, or digital content seamlessly. Ideal for designers, marketers, and tech presentations. Fully editable and compatible with PowerPoint, Keynote, and Google Slides.


3 slides
Clear Navigation Table of Content Presentation
Streamline your presentation flow with this Clear Navigation Table of Content layout. Featuring labeled sections, visual cues, and photo placeholders, this slide helps guide your audience through key topics. Perfect for reports, proposals, or training decks. Fully customizable in PowerPoint, Keynote, and Google Slides for seamless integration and personalization.


7 slides
Technology Consulting Infographic
Technology consulting, also known as IT consulting or tech consulting, involves providing expert advice and guidance to organizations regarding their technology strategy, utilization, and optimization. This infographic template provides a compelling way to illustrate complex concepts, strategies, and data related to technology consulting. Fully customizable and compatible with Powerpoint, Keynote, and Google Slides. The sleek, modern design reflects the cutting-edge nature of technology and consulting services. This infographic is your go-to tool for creating presentations that showcase your technology consulting expertise.


22 slides
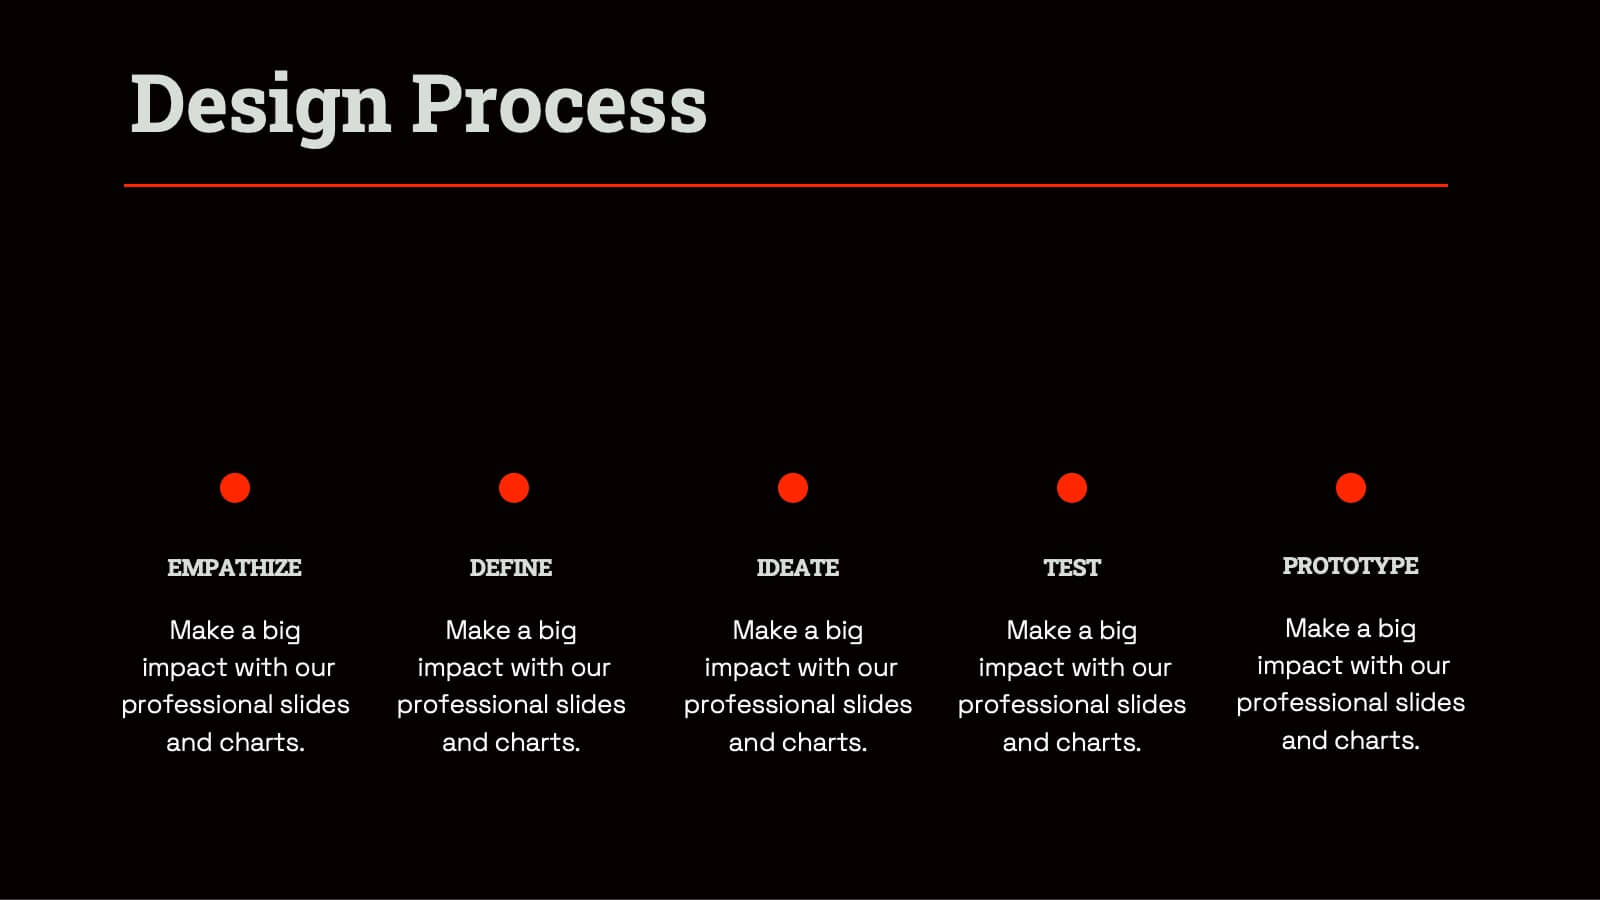
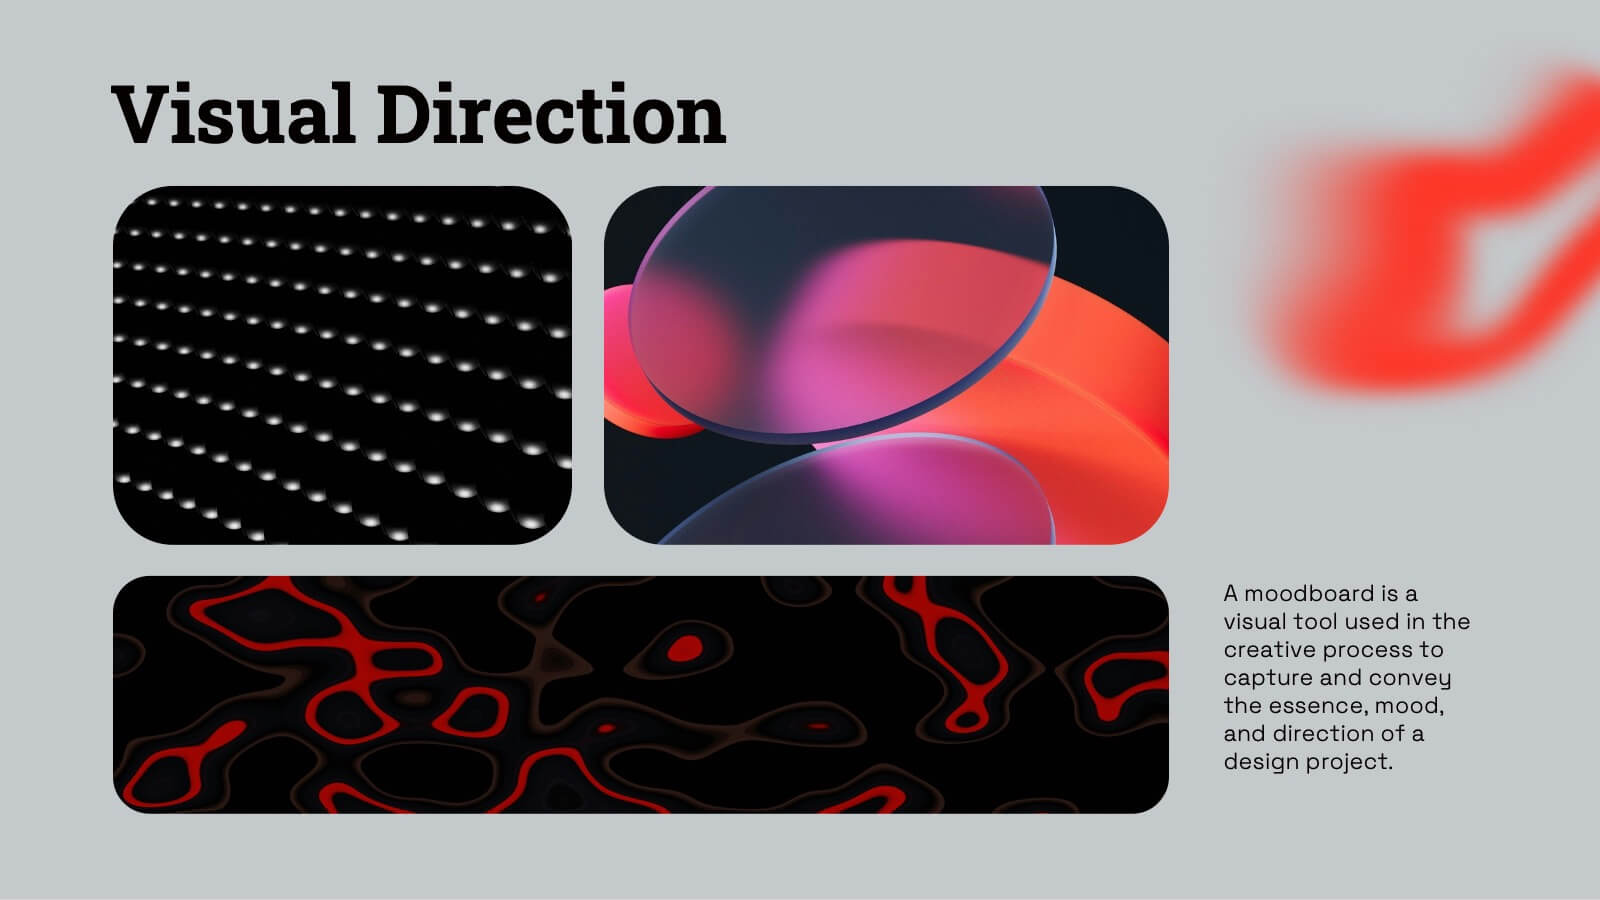
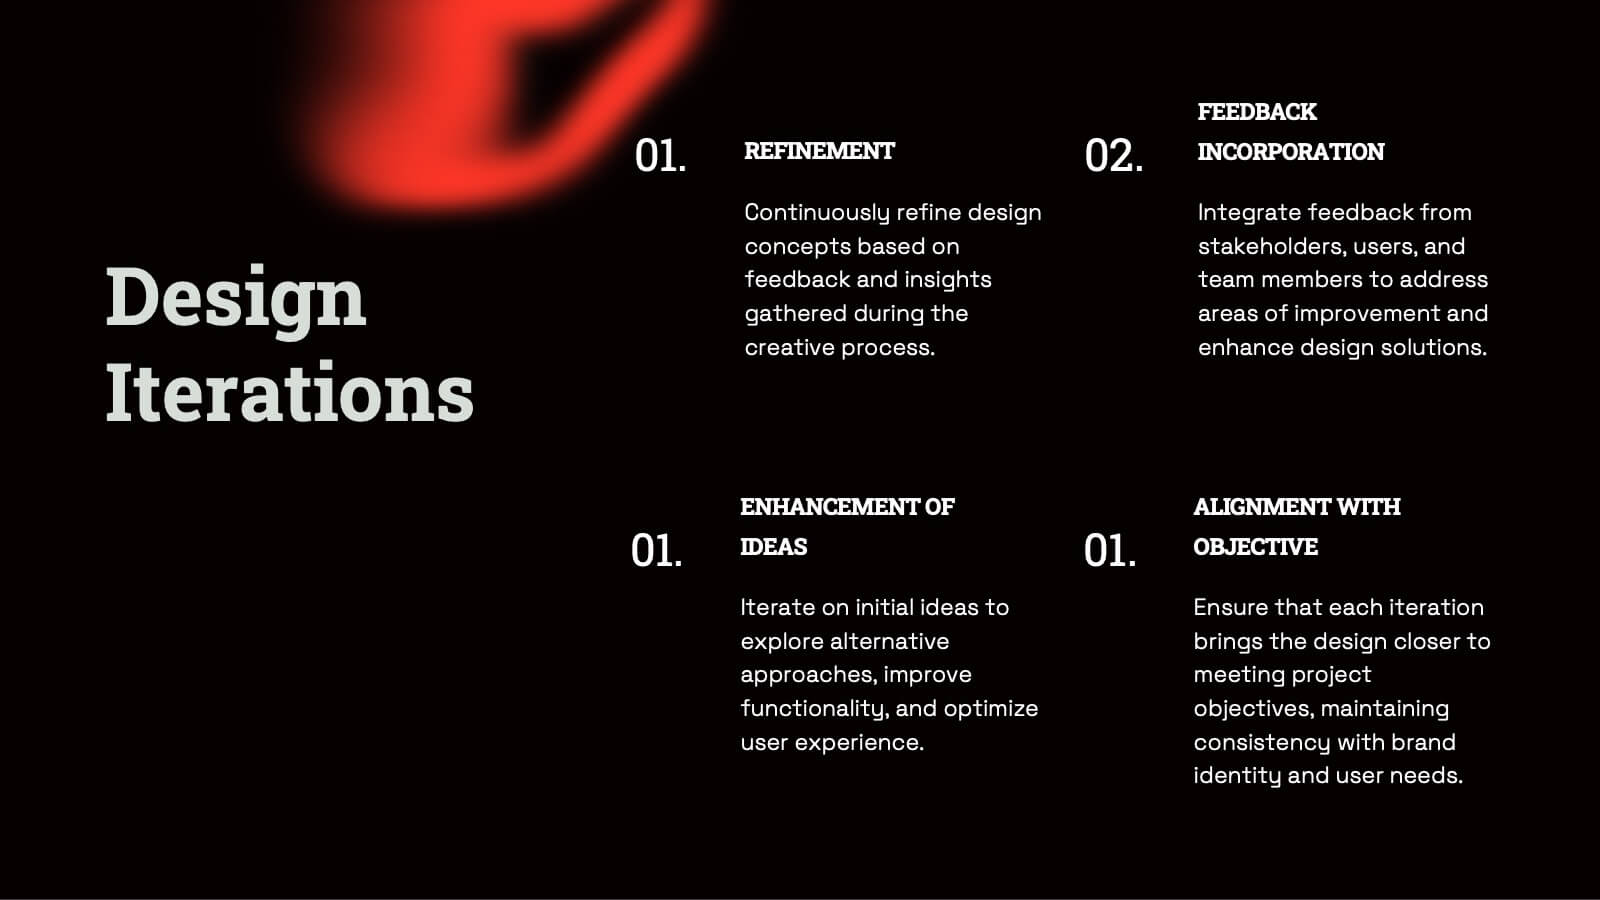
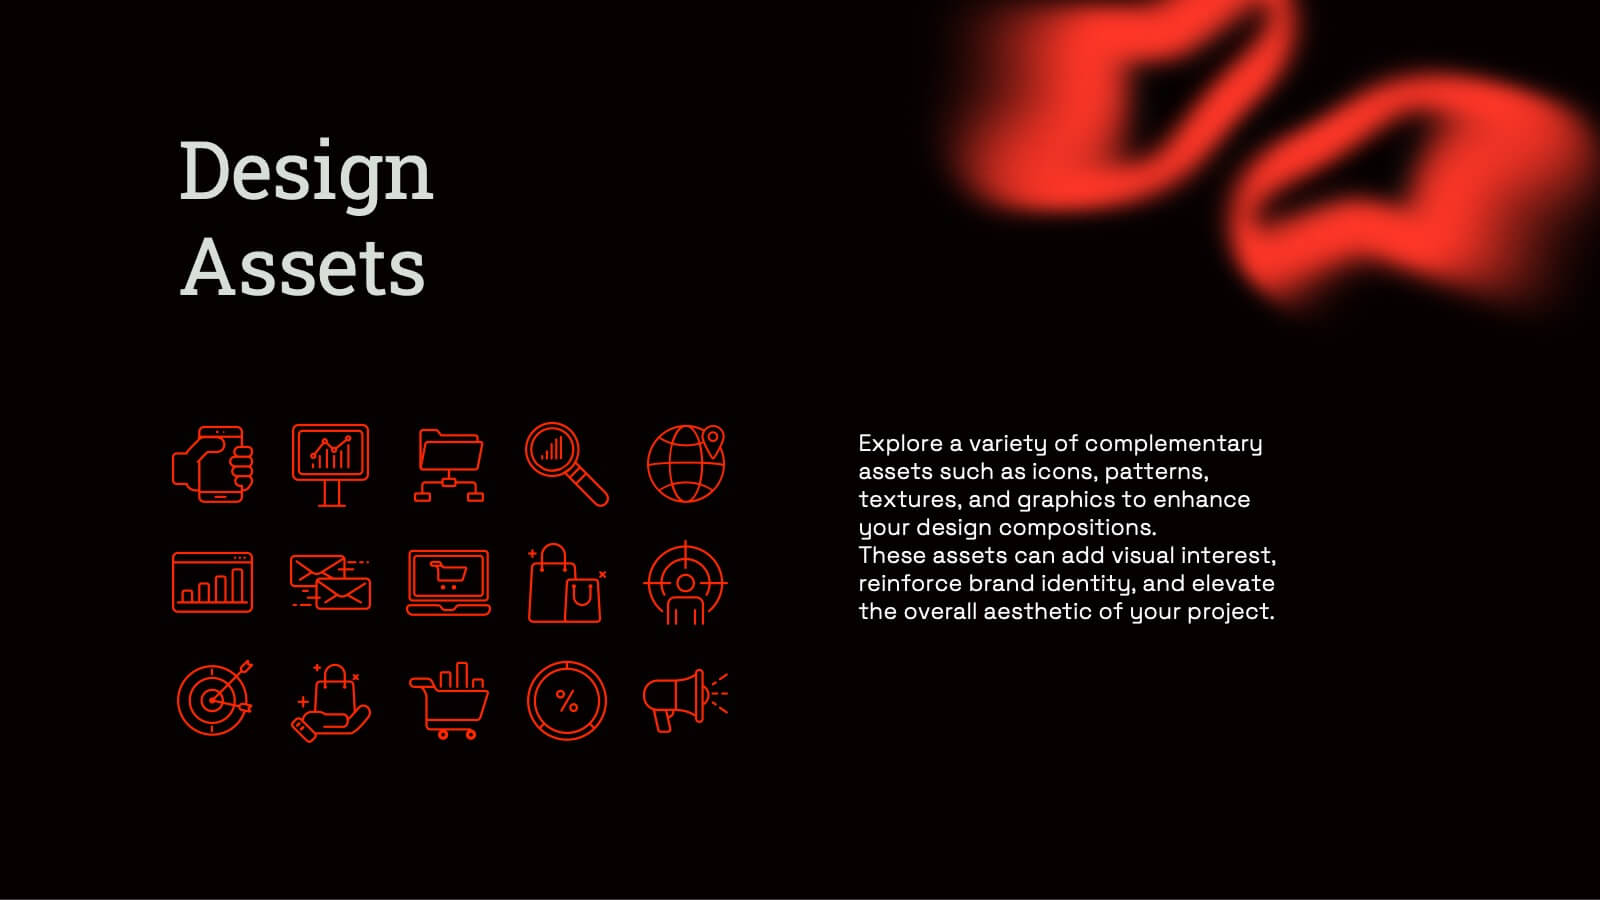
Radiant Graphic Design Project Plan Presentation
Unleash your creativity with this bold and dynamic graphic design project plan template! Perfect for showcasing design elements, textures, and typography, this template guides you through every phase, from concept development and prototyping to feedback and final presentations. Ideal for visual direction and design asset management, it’s fully compatible with PowerPoint, Keynote, and Google Slides for seamless use.


7 slides
Digital KPI Dashboard Infographic
A KPI Dashboard is a visual representation of the most important performance metrics or KPIs that track the progress of an organization or business activities. This infographic template is designed to showcase the KPIs and metrics that are crucial for evaluating the success of digital marketing efforts. This template provides an overview of various digital marketing KPIs in an easy-to-understand format. The template utilizes eye-catching charts, graphs, and diagrams to present digital marketing data in a visually appealing way. Bar graphs, line charts, pie charts, and other visual elements make it easy to grasp the performance trends at a glance.


7 slides
Big Data Tools Infographic
Big Data refers to large volumes of data, both structured and unstructured, that inundate a business or organization on a day-to-day basis. This infographic template is designed to captivate, educate, and empower, providing a bold and clear representation of the sheer magnitude and impact of big data. Compatible with Powerpoint, Keynote, and Google Slides. This template involves processing and analyzing Big Data to extract meaningful insights, patterns, and trends. These insights can be used for business intelligence, decision-making, research, and various other applications across different domains and industries.


6 slides
4 Stage Roadmap Template
Navigate your projects with clarity using our "4 Stage Roadmap Template." This engaging presentation template offers a unique, pathway-like design to outline the progression of any project through four distinct stages. Each step is visually differentiated, making it easy to follow and understand the sequence and dependencies of tasks. Perfect for project managers and teams, this template ensures your strategic milestones are visually aligned and easy to communicate. Compatible with PowerPoint, Keynote, and Google Slides, it's an essential tool for effective project visualization and management.


6 slides
Startup Goals and MVP Rollout Plan Presentation
Launch with clarity using the Startup Goals and MVP Rollout Plan Presentation. This dynamic circular layout features a rocket icon and segmented design to represent phased growth and product milestones. Ideal for showcasing early-stage priorities, MVP deliverables, and go-to-market strategies. Compatible with PowerPoint, Keynote, Google Slides, and Canva for full customization.


7 slides
Enterprise Security Infographic
In today's digital age, enterprise security has become the bedrock of business operations, ensuring data integrity and protection from threats. Our enterprise security infographic encapsulates key aspects of this vital domain, harmoniously blending white, blue, and hints of yellow. It's an essential visual tool for IT professionals, cybersecurity experts, and corporate strategists, illustrating the multifaceted nature of modern security protocols. Tailored to seamlessly integrate with PowerPoint, Keynote, and Google Slides, this infographic is your go-to resource for conveying complex security concepts in a digestible format.


6 slides
Business Idea Presentation for Investors Presentation
Present your business concept with clarity using the Business Idea Presentation for Investors. This unique hexagon-centric layout highlights six key pillars of your idea—perfect for showcasing problem-solving, market fit, innovation, competitive advantage, scalability, and profitability. Each point includes customizable icons and text, allowing you to adapt it to your pitch needs. Clean, visually balanced, and easy to edit in PowerPoint, Keynote, or Google Slides, this slide is ideal for entrepreneurs, founders, and startup teams seeking investment and buy-in.