


Features
- 4 Unique slides
- Fully editable and easy to edit in Microsoft Powerpoint, Keynote and Google Slides
- 16:9 widescreen layout
- Clean and professional designs
- Export to JPG, PDF or send by email


Do you have any questions?
Recommend


6 slides
Human Anatomy Silhouette Infographic Presentation
Visualize key medical concepts with the Human Anatomy Silhouette Infographic Template. This professional and informative design highlights different body areas with labeled sections for easy understanding. Ideal for medical, healthcare, and educational presentations. Fully customizable and compatible with PowerPoint, Keynote, and Google Slides.


26 slides
Ioel Presentation Template
Here's the perfect kickstart to your business with a presentation template that you’ve been dreaming of! Ioel's crisp, bold font and a clean aesthetic that is engaging to any audience. This template will give your business a bolder and more professional image that you need. Ioel's bold blue background is eye-catching, making this template perfect for businesses seeking to make a great impression. This template will make it easy for you to create an attractive and professional-looking deck. Any business owner wishing to make an impression on their audience will want to use this presentation.


7 slides
Supply Chain Process Mapping Presentation
Streamline your logistics and operations presentations with the Supply Chain Process Mapping Presentation. Featuring a linked-chain visual, this editable template is ideal for outlining each step in your supply flow—from sourcing to delivery. Highlight dependencies, bottlenecks, or key stages with customizable color coding. Fully compatible with PowerPoint, Keynote, and Google Slides.


4 slides
Cross-Functional Role Matrix Chart Presentation
Visualize responsibilities across teams with the Cross-Functional Role Matrix Chart Presentation. This template makes it easy to map roles, tasks, or departments in a clean matrix layout. Ideal for project managers, team leaders, or operations professionals, the chart highlights role relationships and task ownership. Fully editable in Canva, PowerPoint, Keynote, and Google Slides.


6 slides
Academy Sports Infographic
Sports are physical activities or games that involve individual or team competition and are typically governed by specific rules. This infographic template highlights key aspects of sports and physical activities in an academy setting. Whether it's a school sports program, a community sports academy, or a professional training institute, this infographic provides a comprehensive overview of the benefits, programs, and facilities offered by an academy sports institution. This template is compatible with Powerpoint, Keynote, and Google Slides making it easy to navigate and can be easily customized to fit your presentation needs.


4 slides
AIDA Marketing Model Breakdown Presentation
Visualize your marketing funnel with this sleek AIDA breakdown slide. Each stage—Attention, Interest, Desire, and Action—is clearly illustrated with bold arrow graphics and space for strategic insights. Ideal for marketing teams, business pitches, or campaign planning. Fully customizable in PowerPoint, Keynote, and Google Slides.


4 slides
3-Tier Pricing Table Layout Presentation
Make your pricing pitch pop with this bold and modern layout! This presentation template is perfect for showcasing product or service plans with clear comparisons across three tiers. Designed to streamline pricing communication, it’s ideal for SaaS, consulting, or digital services. Fully compatible with PowerPoint, Keynote, and Google Slides.


6 slides
Country Highlight Map North America Presentation
Showcase your regional focus with a clean, data-driven map that highlights key areas across the United States. Perfect for presenting business coverage, demographic data, or strategic expansion points, this layout keeps visuals sharp and organized. Fully compatible with PowerPoint, Keynote, and Google Slides for effortless customization and presentation.


4 slides
Investor Business Plan One-Pager Presentation
Present your startup vision with clarity using this Investor Business Plan One-Pager. Designed to outline key milestones, growth projections, and funding goals, it’s perfect for pitch decks and investor briefs. Visually dynamic and fully customizable, this one-slide format works seamlessly in PowerPoint, Keynote, and Google Slides—ideal for entrepreneurs and startups.


5 slides
Meal Plan and Nutrition Guide Presentation
Simplify your nutrition strategy with the Meal Plan and Nutrition Guide Presentation. This visually engaging circular layout lets you outline five key nutrition pillars or daily meals with icons and editable titles. Ideal for dietitians, wellness coaches, or health brands. Compatible with PowerPoint, Canva, and Google Slides for seamless customization.


6 slides
Sales Skills Development Training Presentation
Bring your sales training to life with a sleek, infinity-loop visual that keeps learners engaged from start to finish. This template helps you map out each phase of sales skill development, from lead generation to closing. Fully customizable and compatible with PowerPoint, Keynote, and Google Slides for seamless integration.


4 slides
Scrum Team Retrospective Overview Deck Presentation
Reflect on past sprints with this structured Scrum Team Retrospective Deck. Featuring four quadrants for clear team feedback—what worked, what didn’t, ideas for improvement, and action items. Ideal for agile coaches and team leads. Fully editable in PowerPoint, Keynote, and Google Slides to match your team's review process.


15 slides
Business Plan Infographic Presentation
Businesses are important components of a healthy economy and society. They create jobs, drive innovation, encourage entrepreneurship, and contribute to the well-being of society. With this template you can create a clear and effective business Infographic for your pitches, or projects. The design is made to enhance your message and inspire your audience. This template can be used for presenting any business information whether it be data, statistics, facts etc. It is compatible with Powerpoint, keynote and google slides so all the elements are editable, and can be changed to fit your needs.


6 slides
Mind Map Ideas Infographic
A Mind Map is a visual representation of ideas, concepts, and relationships, often created around a central topic or theme. This infographic mind map template offer a versatile and effective method for organizing, analyzing, and visualizing information, making them valuable tools for learning, problem-solving, and creative exploration. The structure of this template consists of the central idea or topic placed at the center of the map. This template provides a structured way to showcase and organize ideas using the mind mapping technique. Compatible with Powerpoint, Keynote, and Google Slides.


3 slides
Workflow Improvement and Progress Chart Presentation
Folders aren't just for files—they’re perfect for ideas too. This visual chart maps out streamlined processes, making it easier to track progress and improve internal workflow. Great for managers and teams, this infographic presentation template is fully compatible with PowerPoint, Keynote, and Google Slides for effortless editing and sharing.


4 slides
Crypto Investment Strategies Presentation
Dive into the dynamic world of cryptocurrency with our "Crypto Investment Strategies" presentation templates. These templates provide a structured approach to exploring various investment strategies, perfect for financial advisors and crypto enthusiasts. Easily editable and visually engaging, they're designed to help you present complex information in a clear manner. Compatible with PowerPoint, Keynote, and Google Slides, they offer flexibility across different platforms, ensuring your presentation looks great no matter where you show it.
22 slides
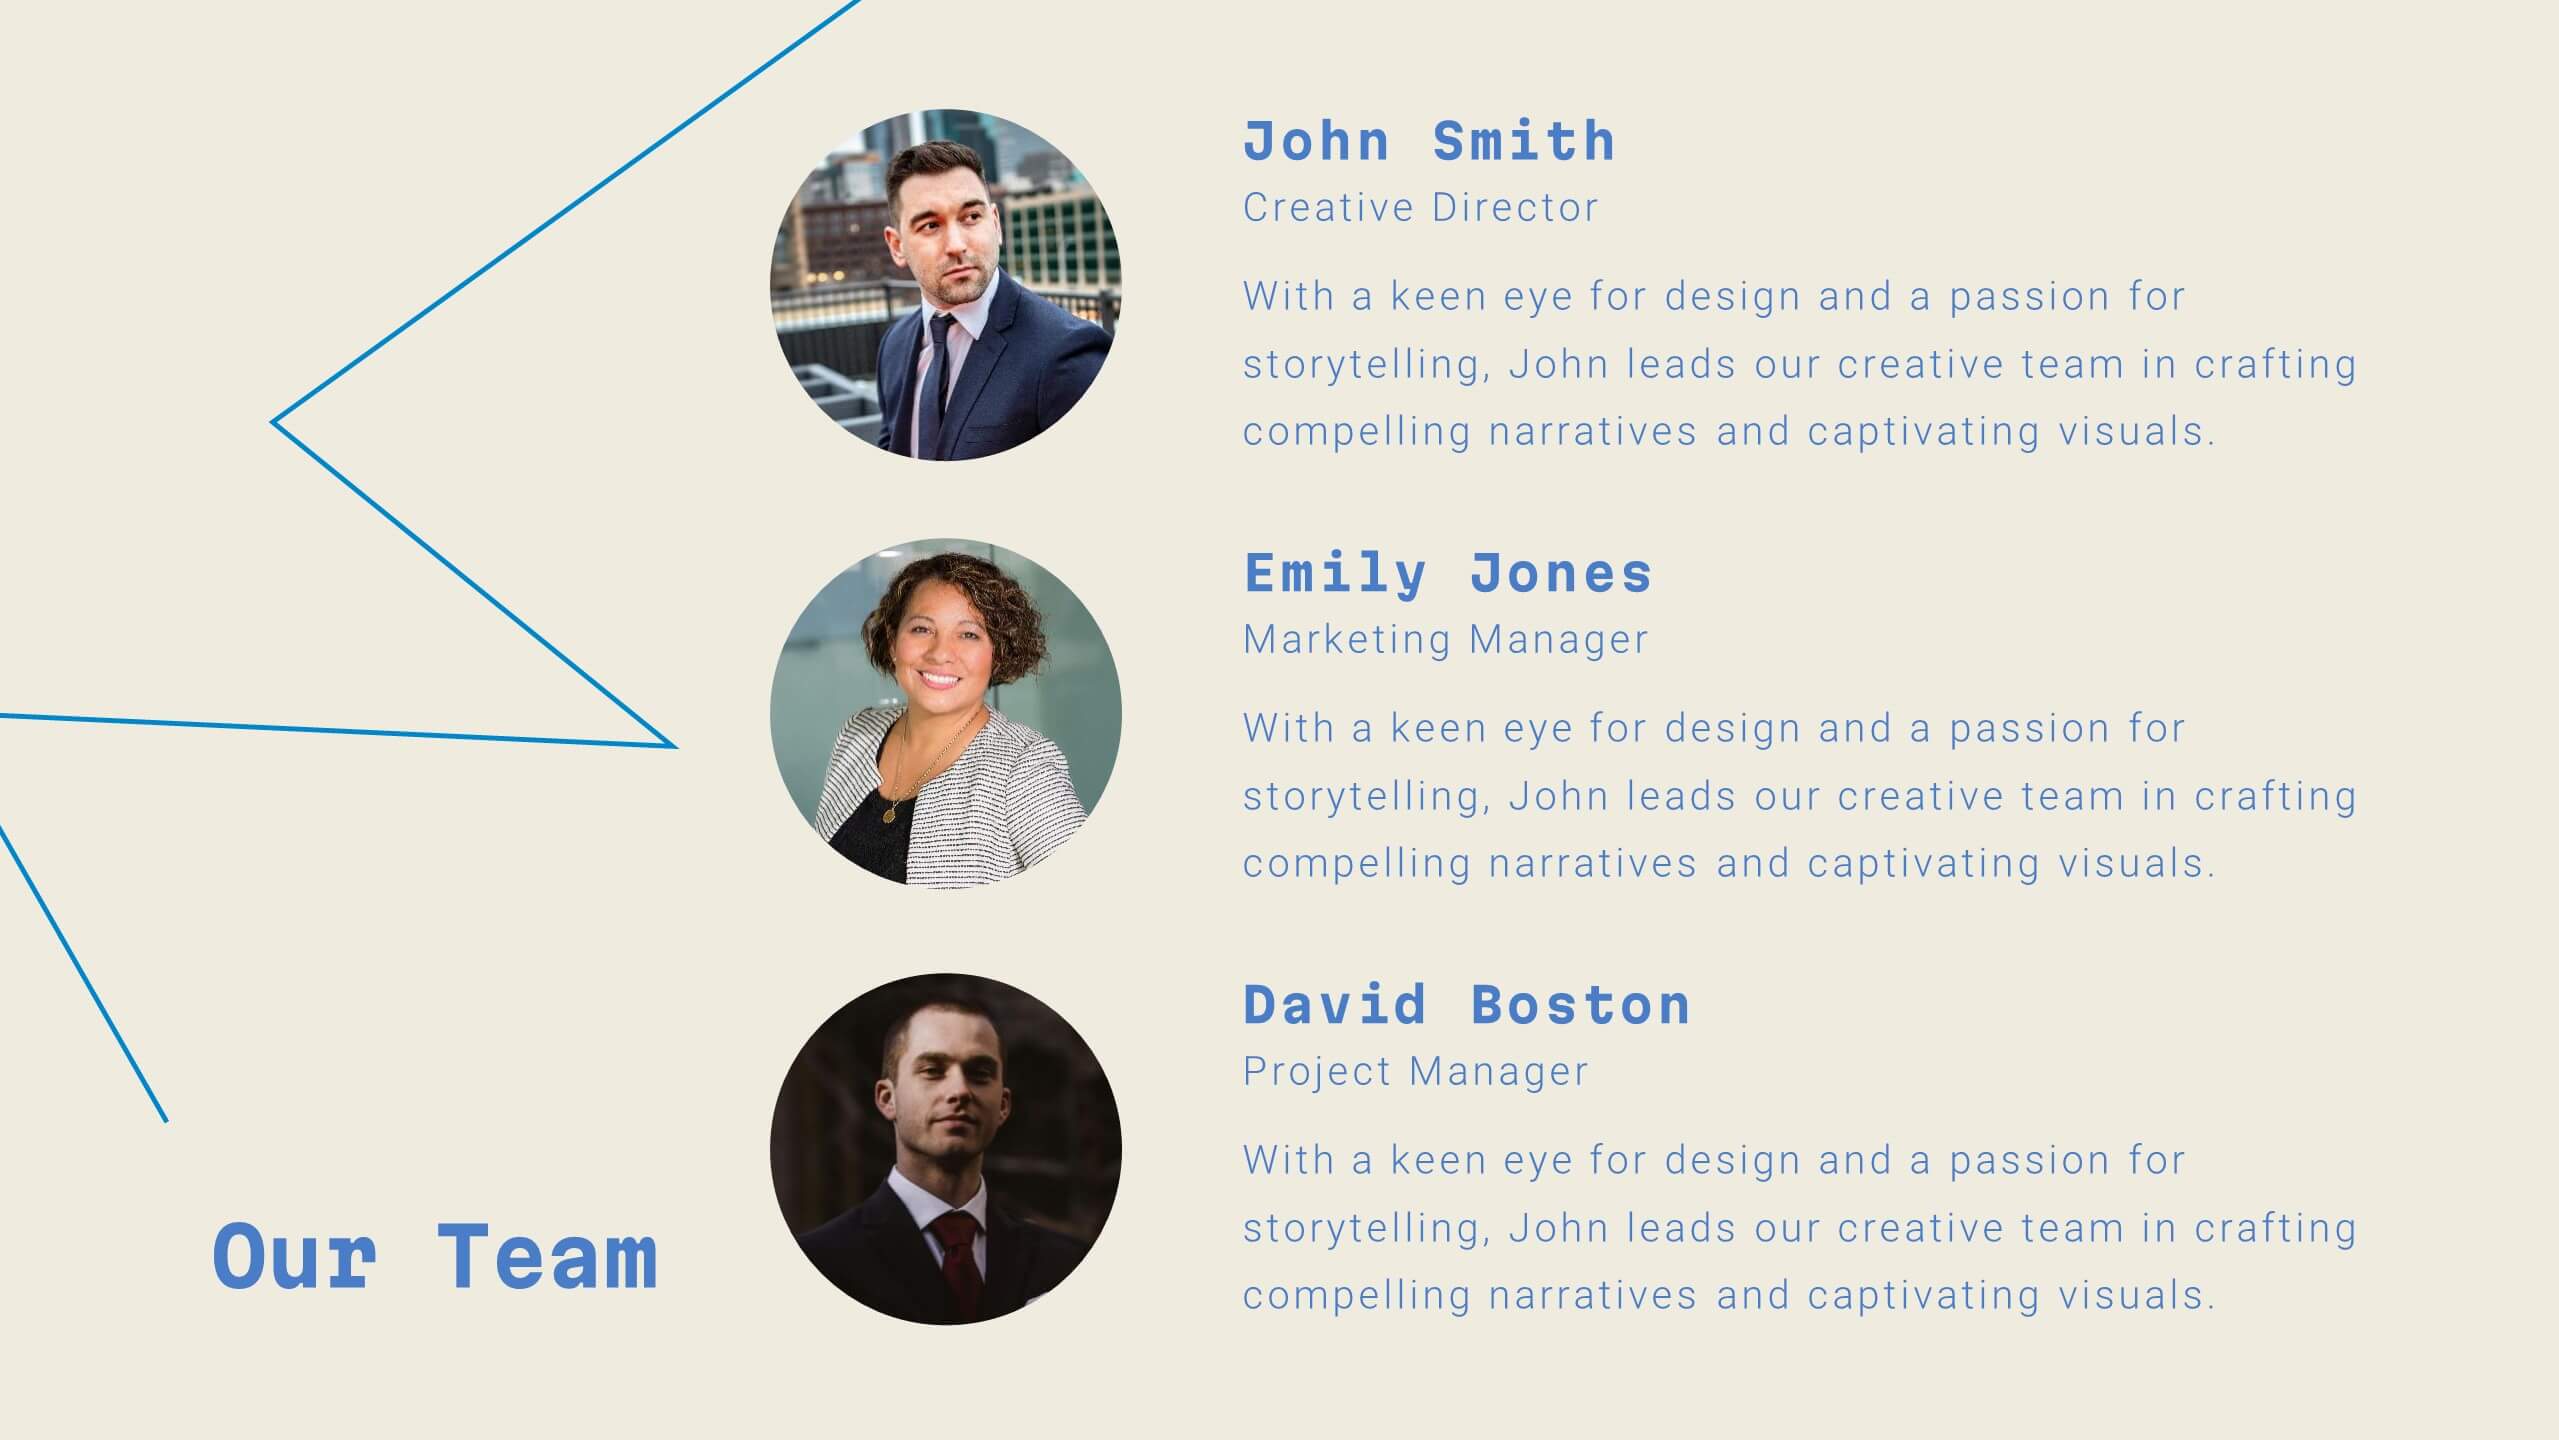
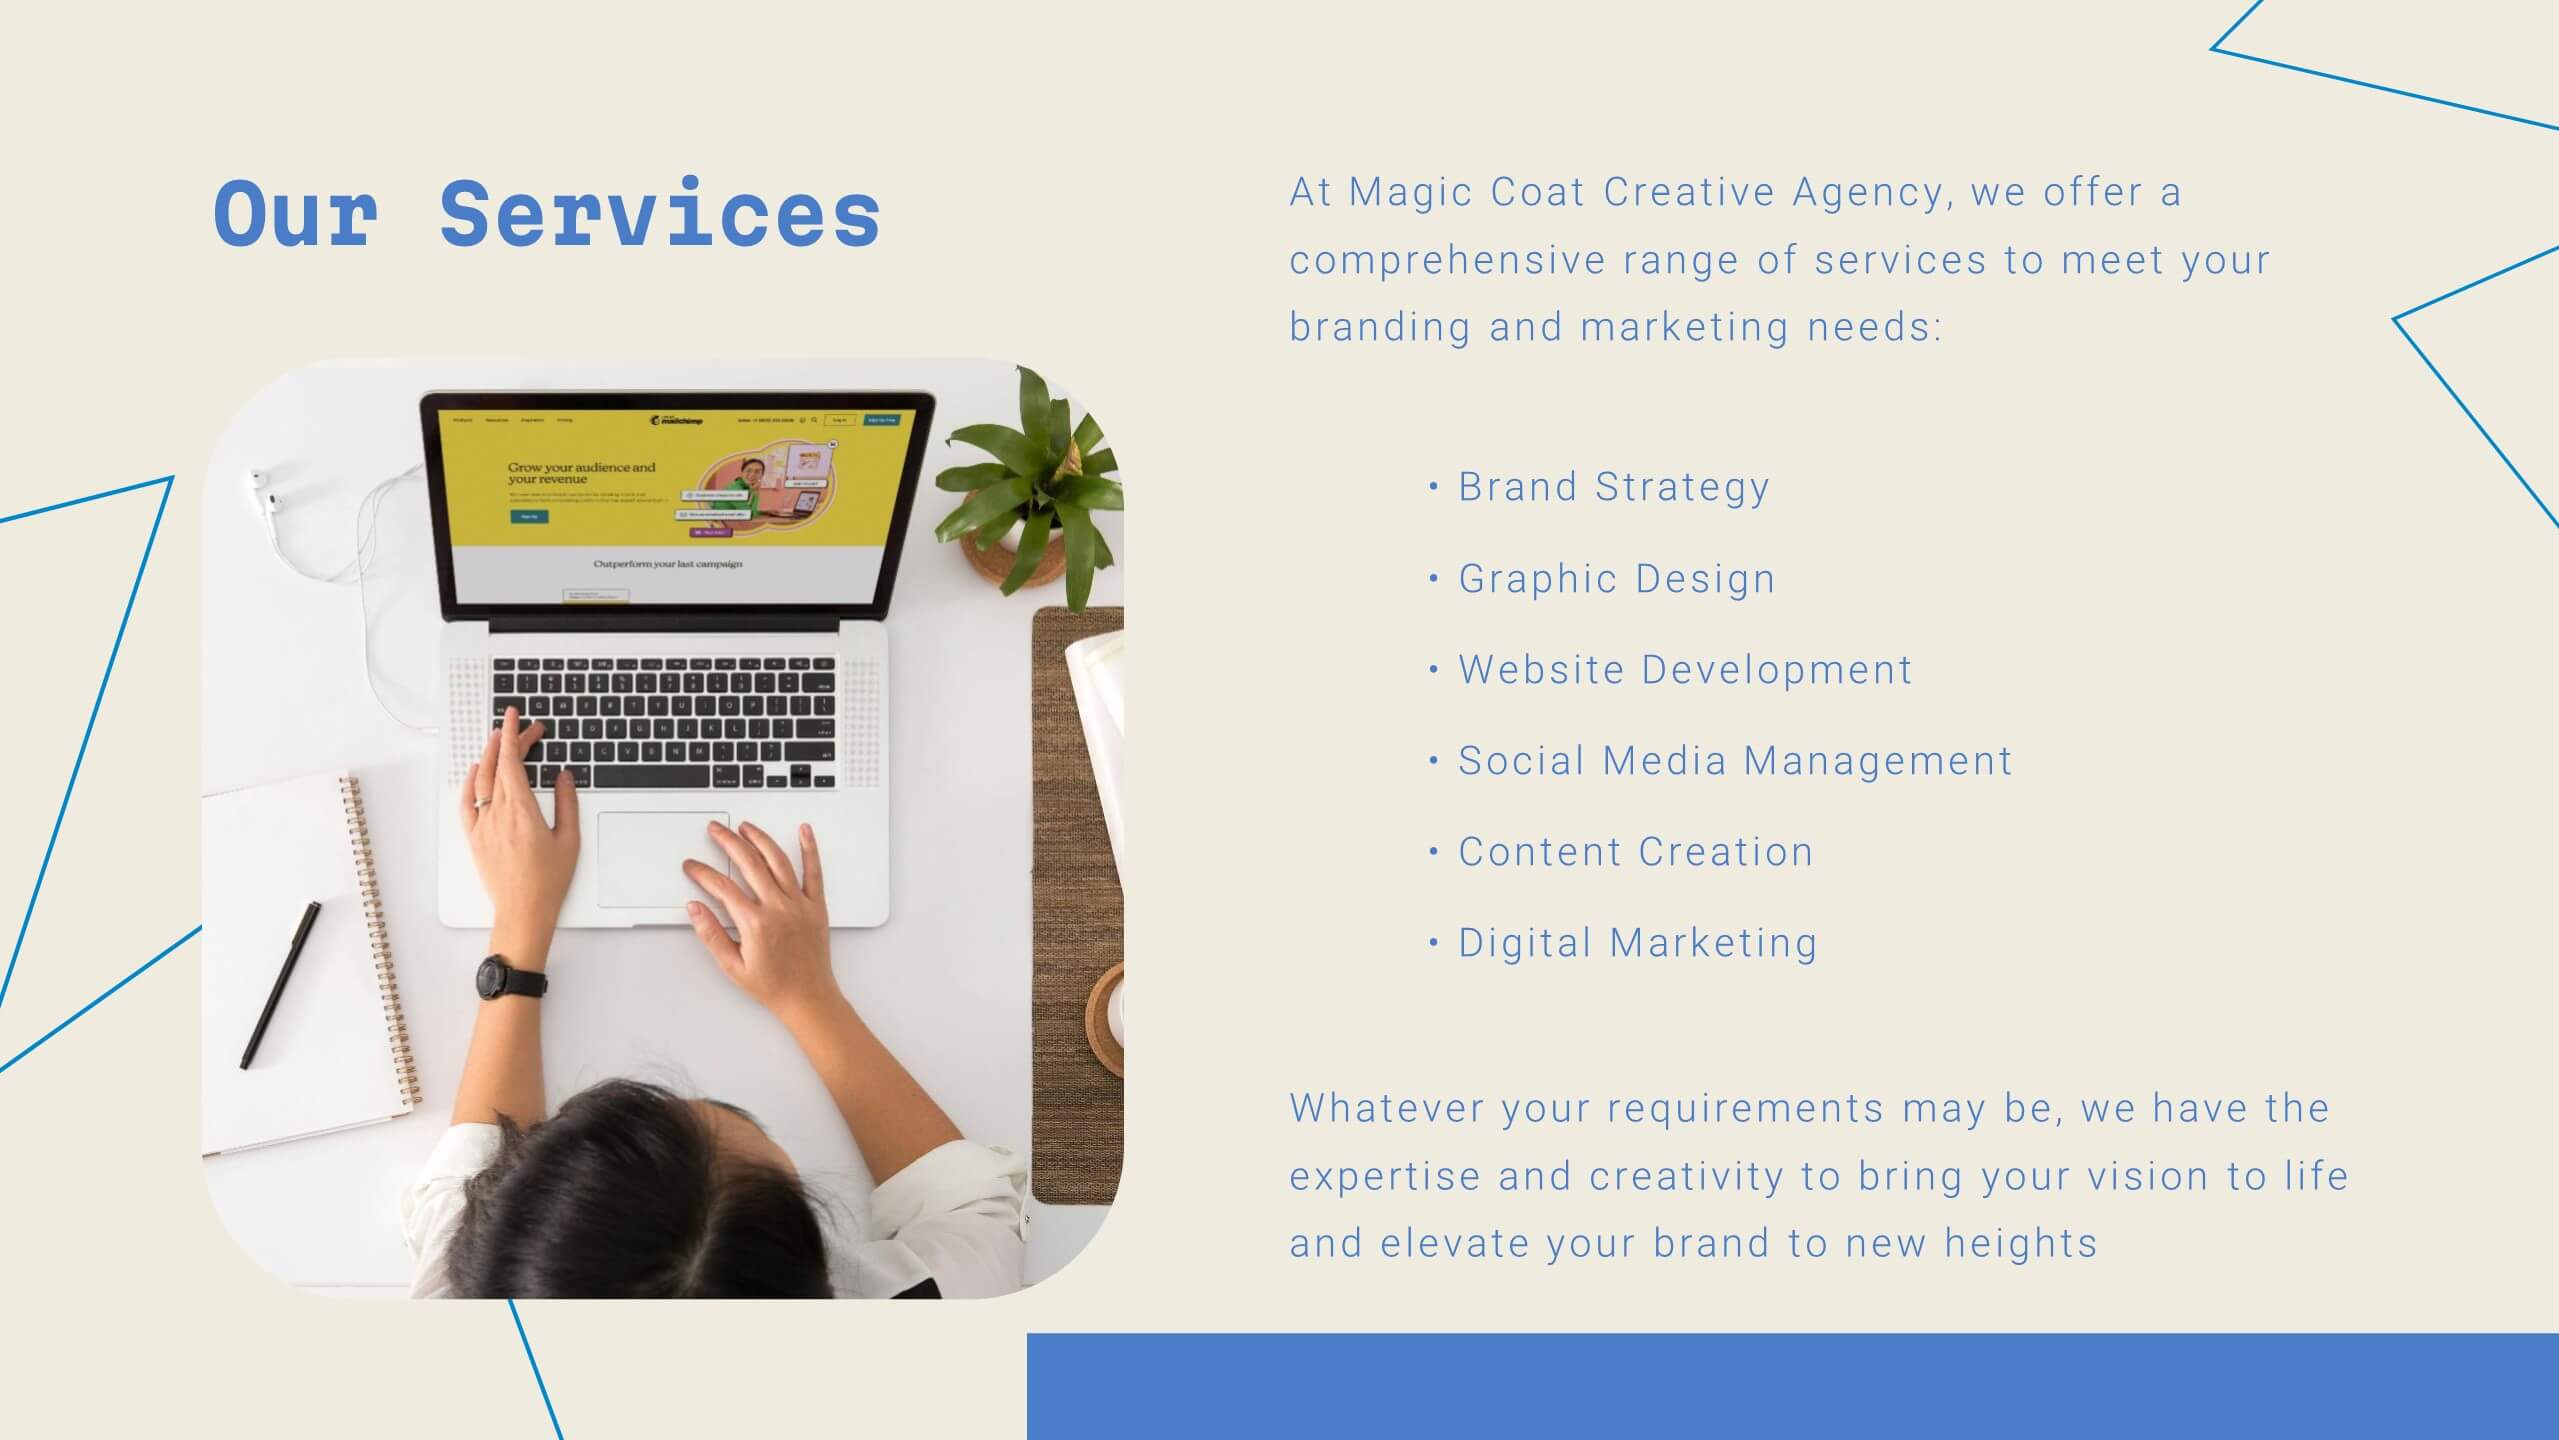
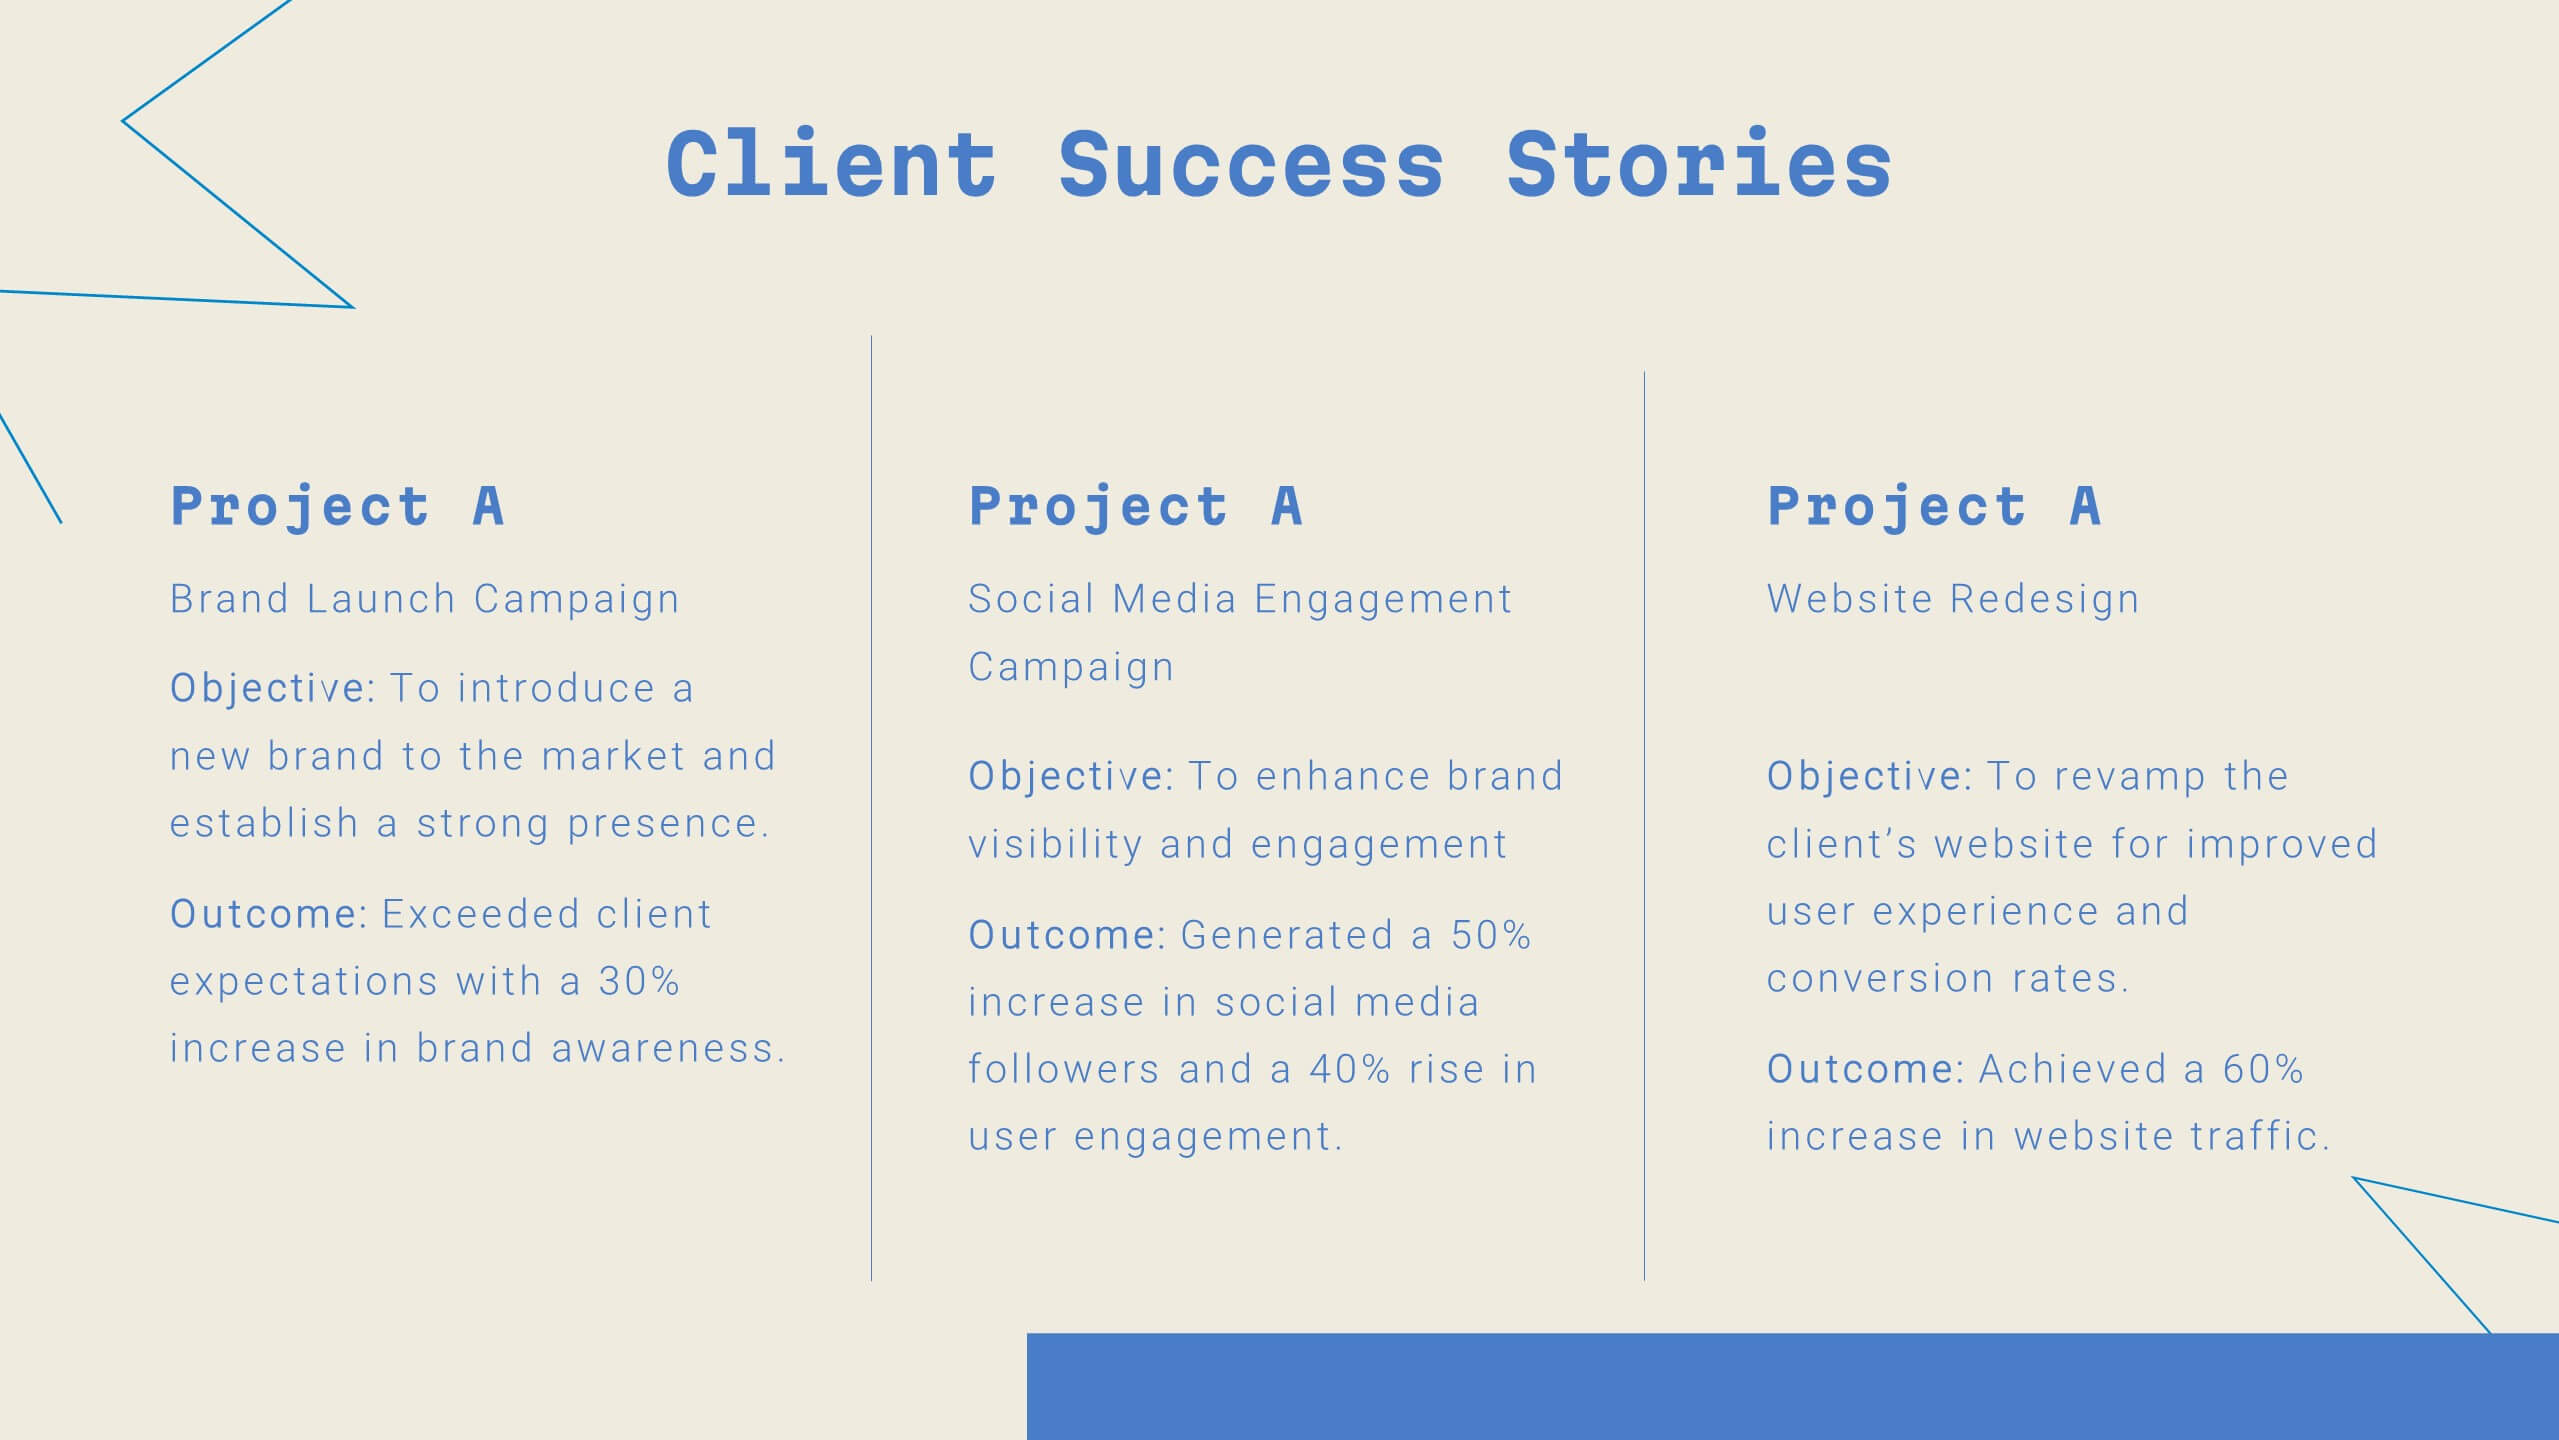
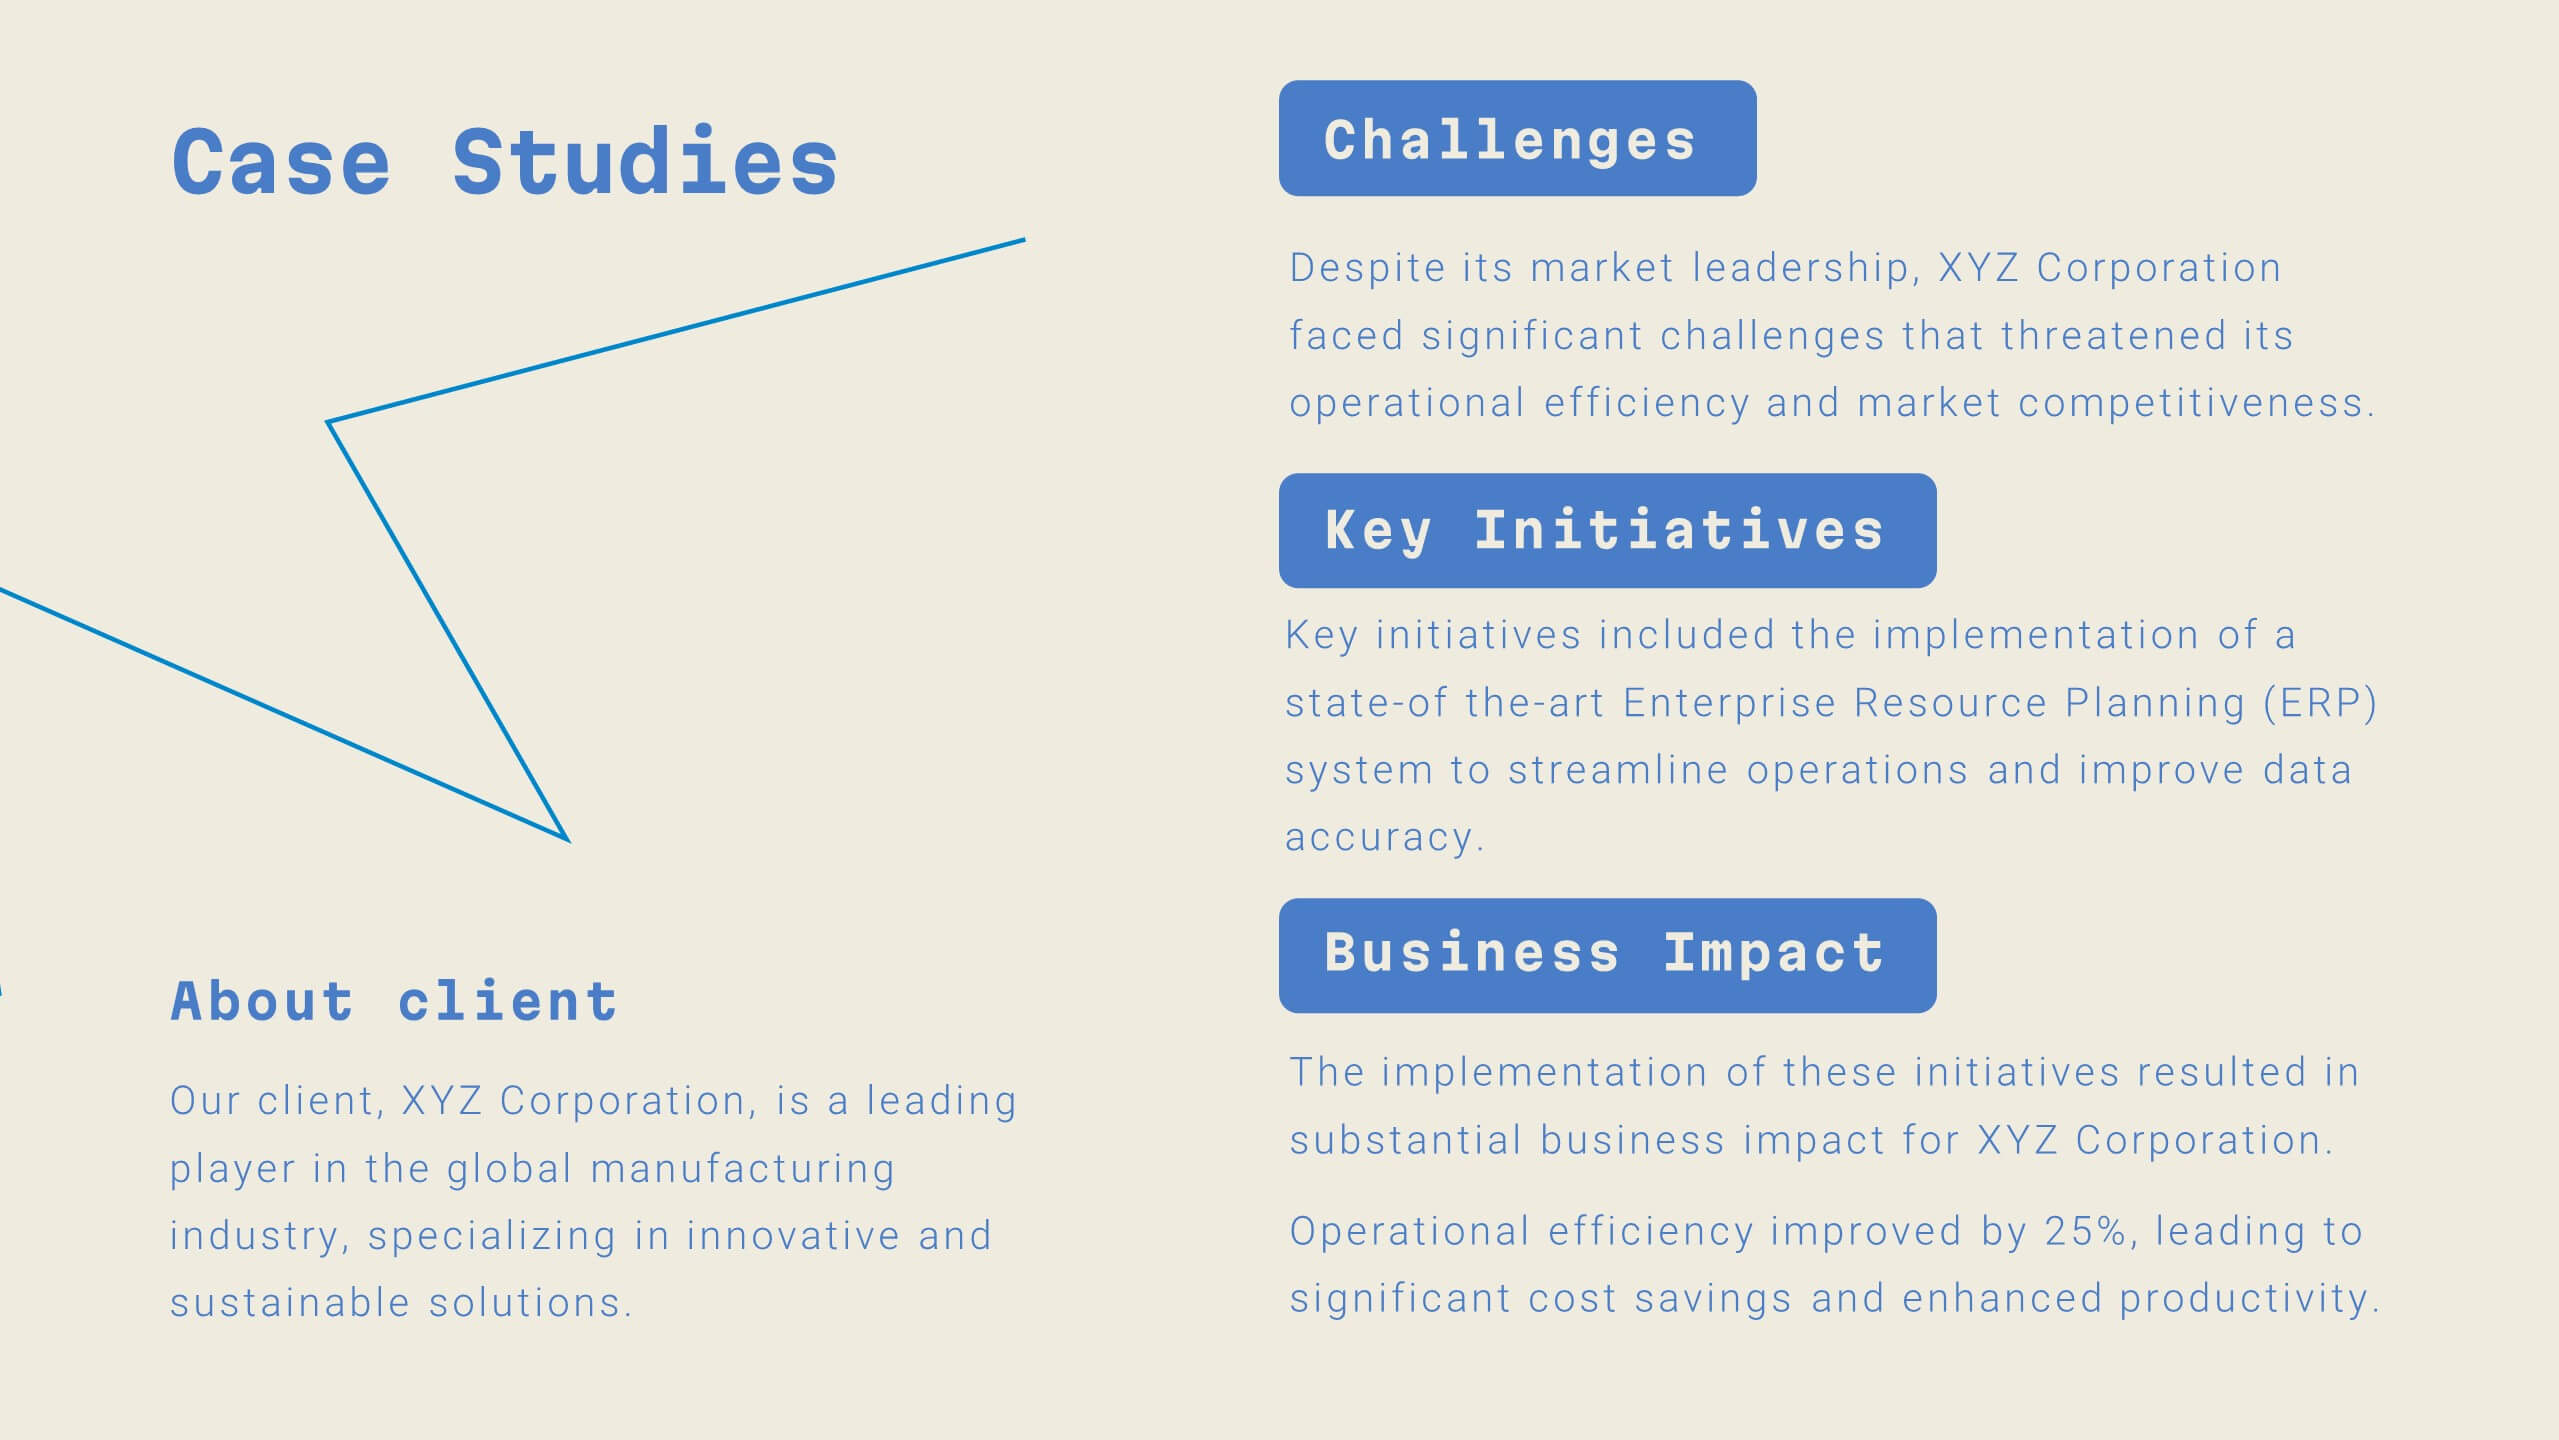
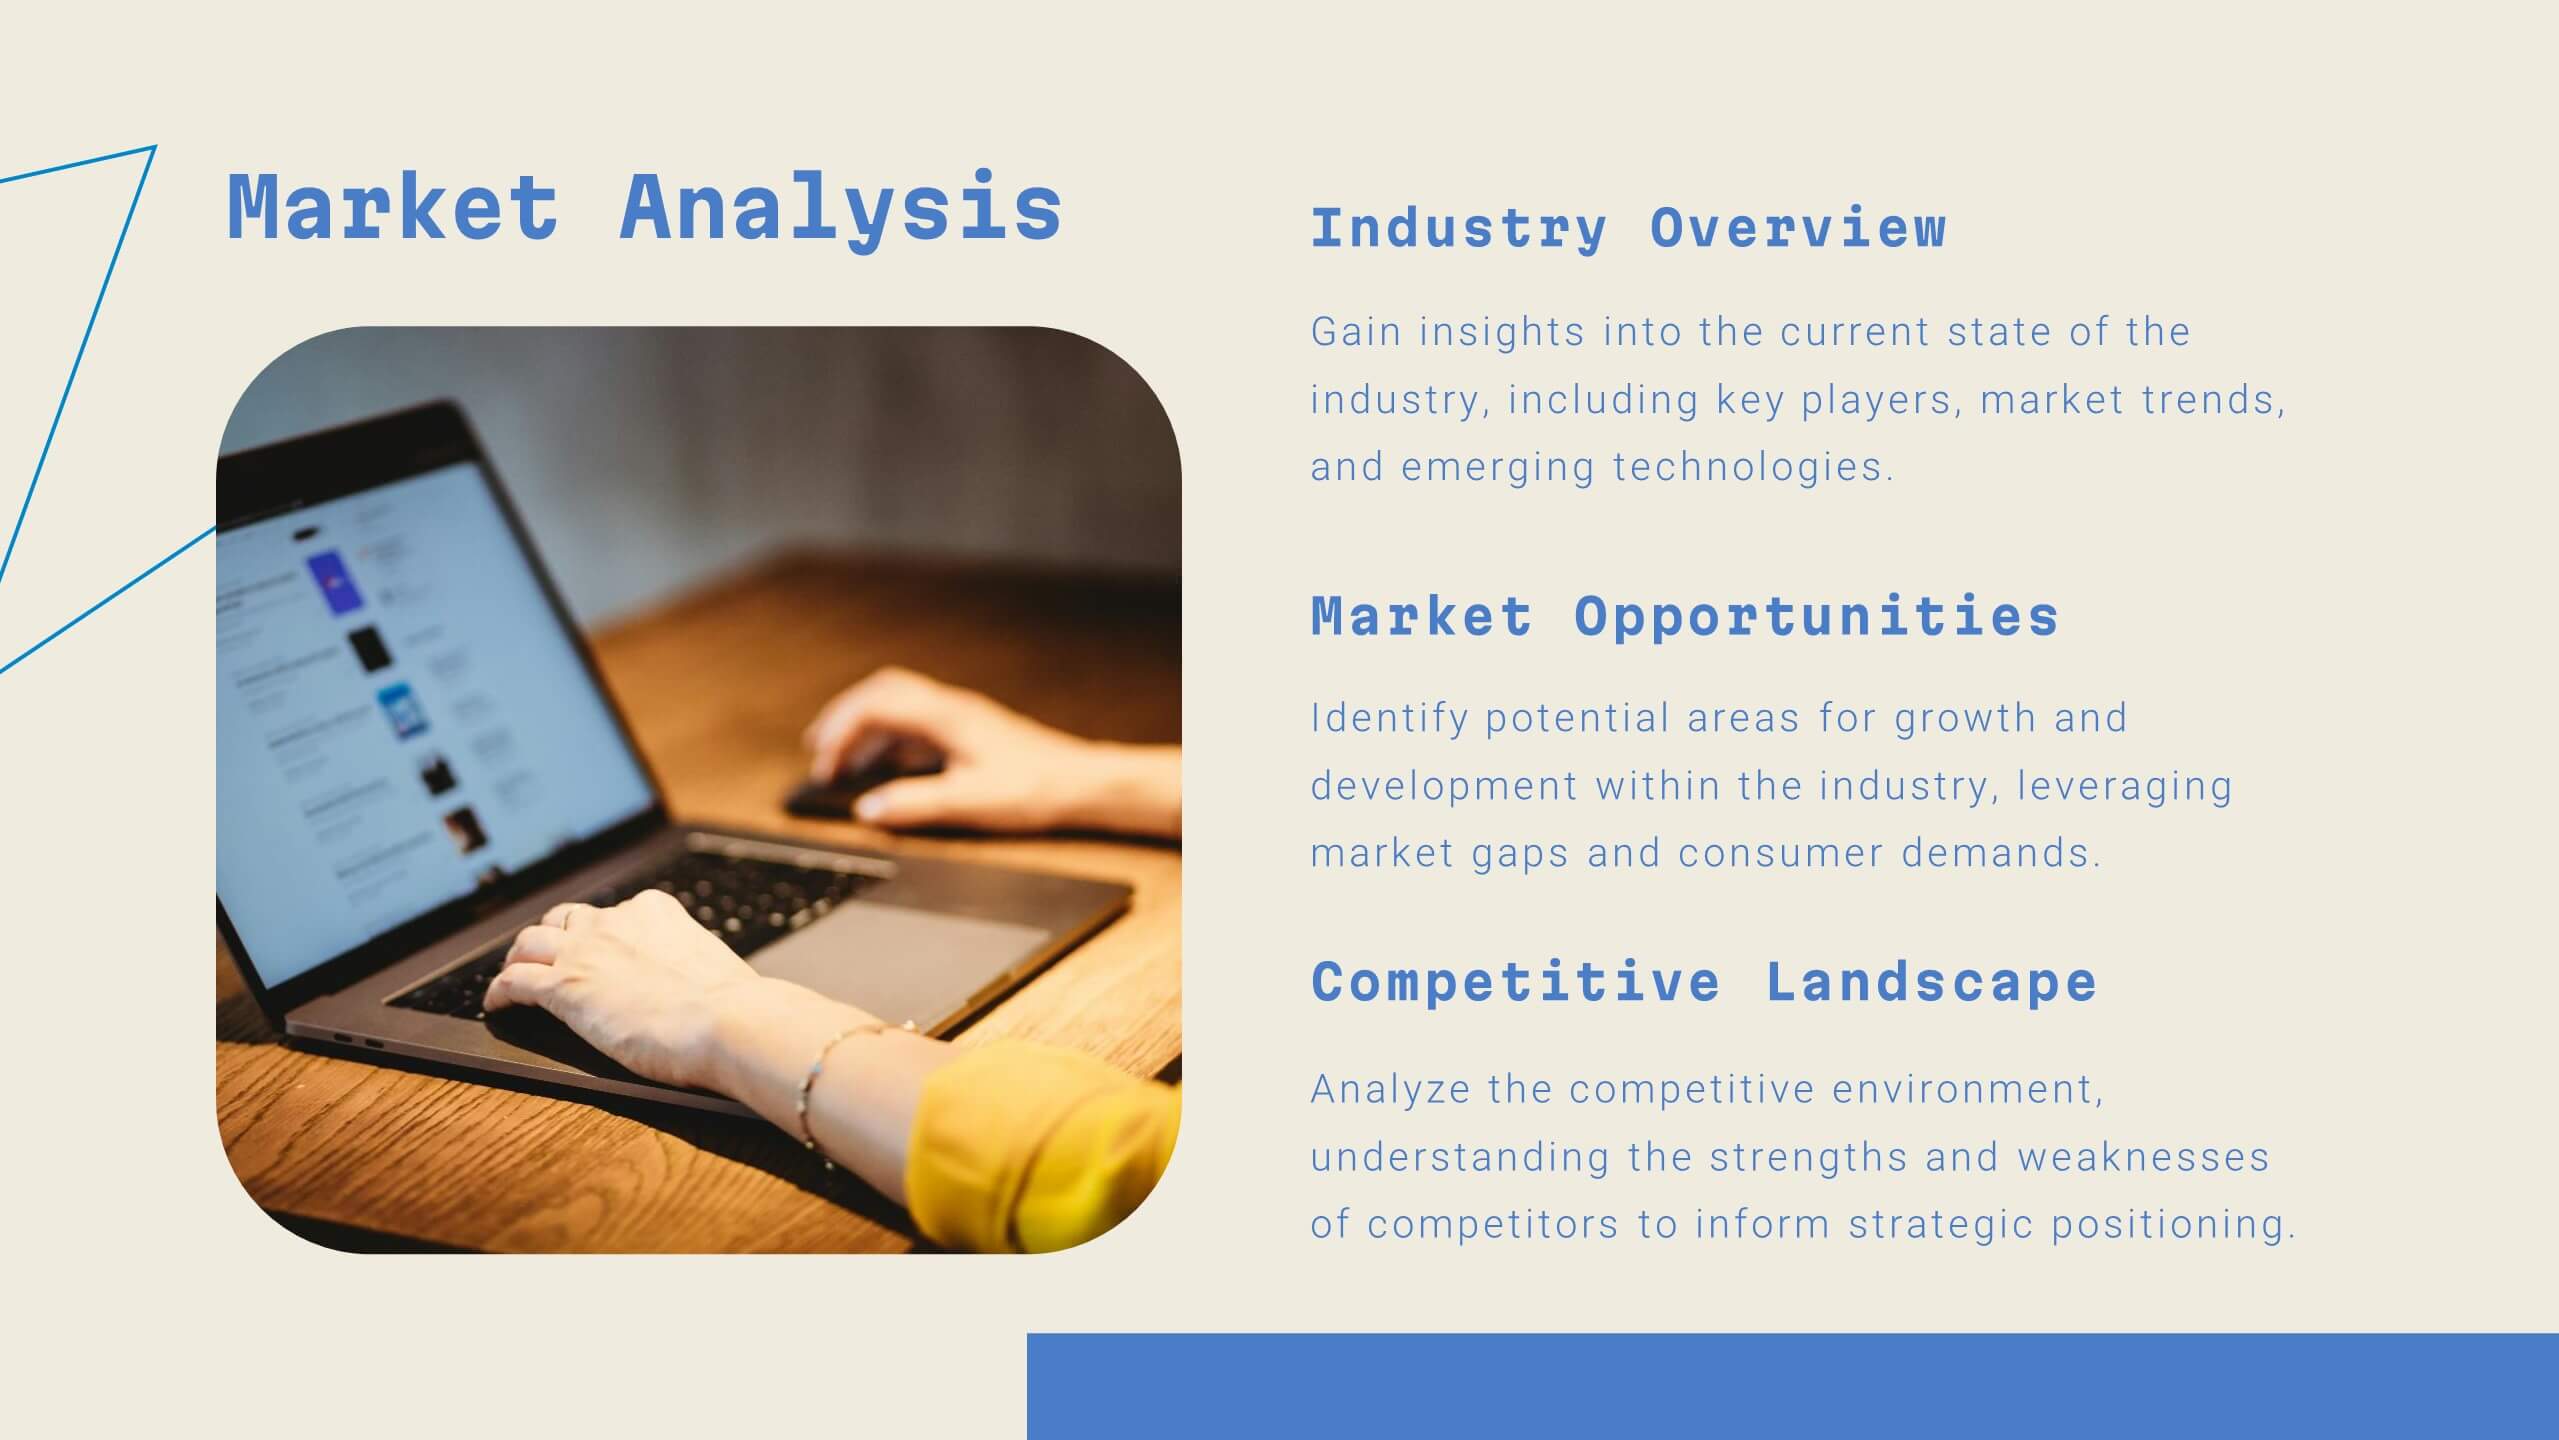
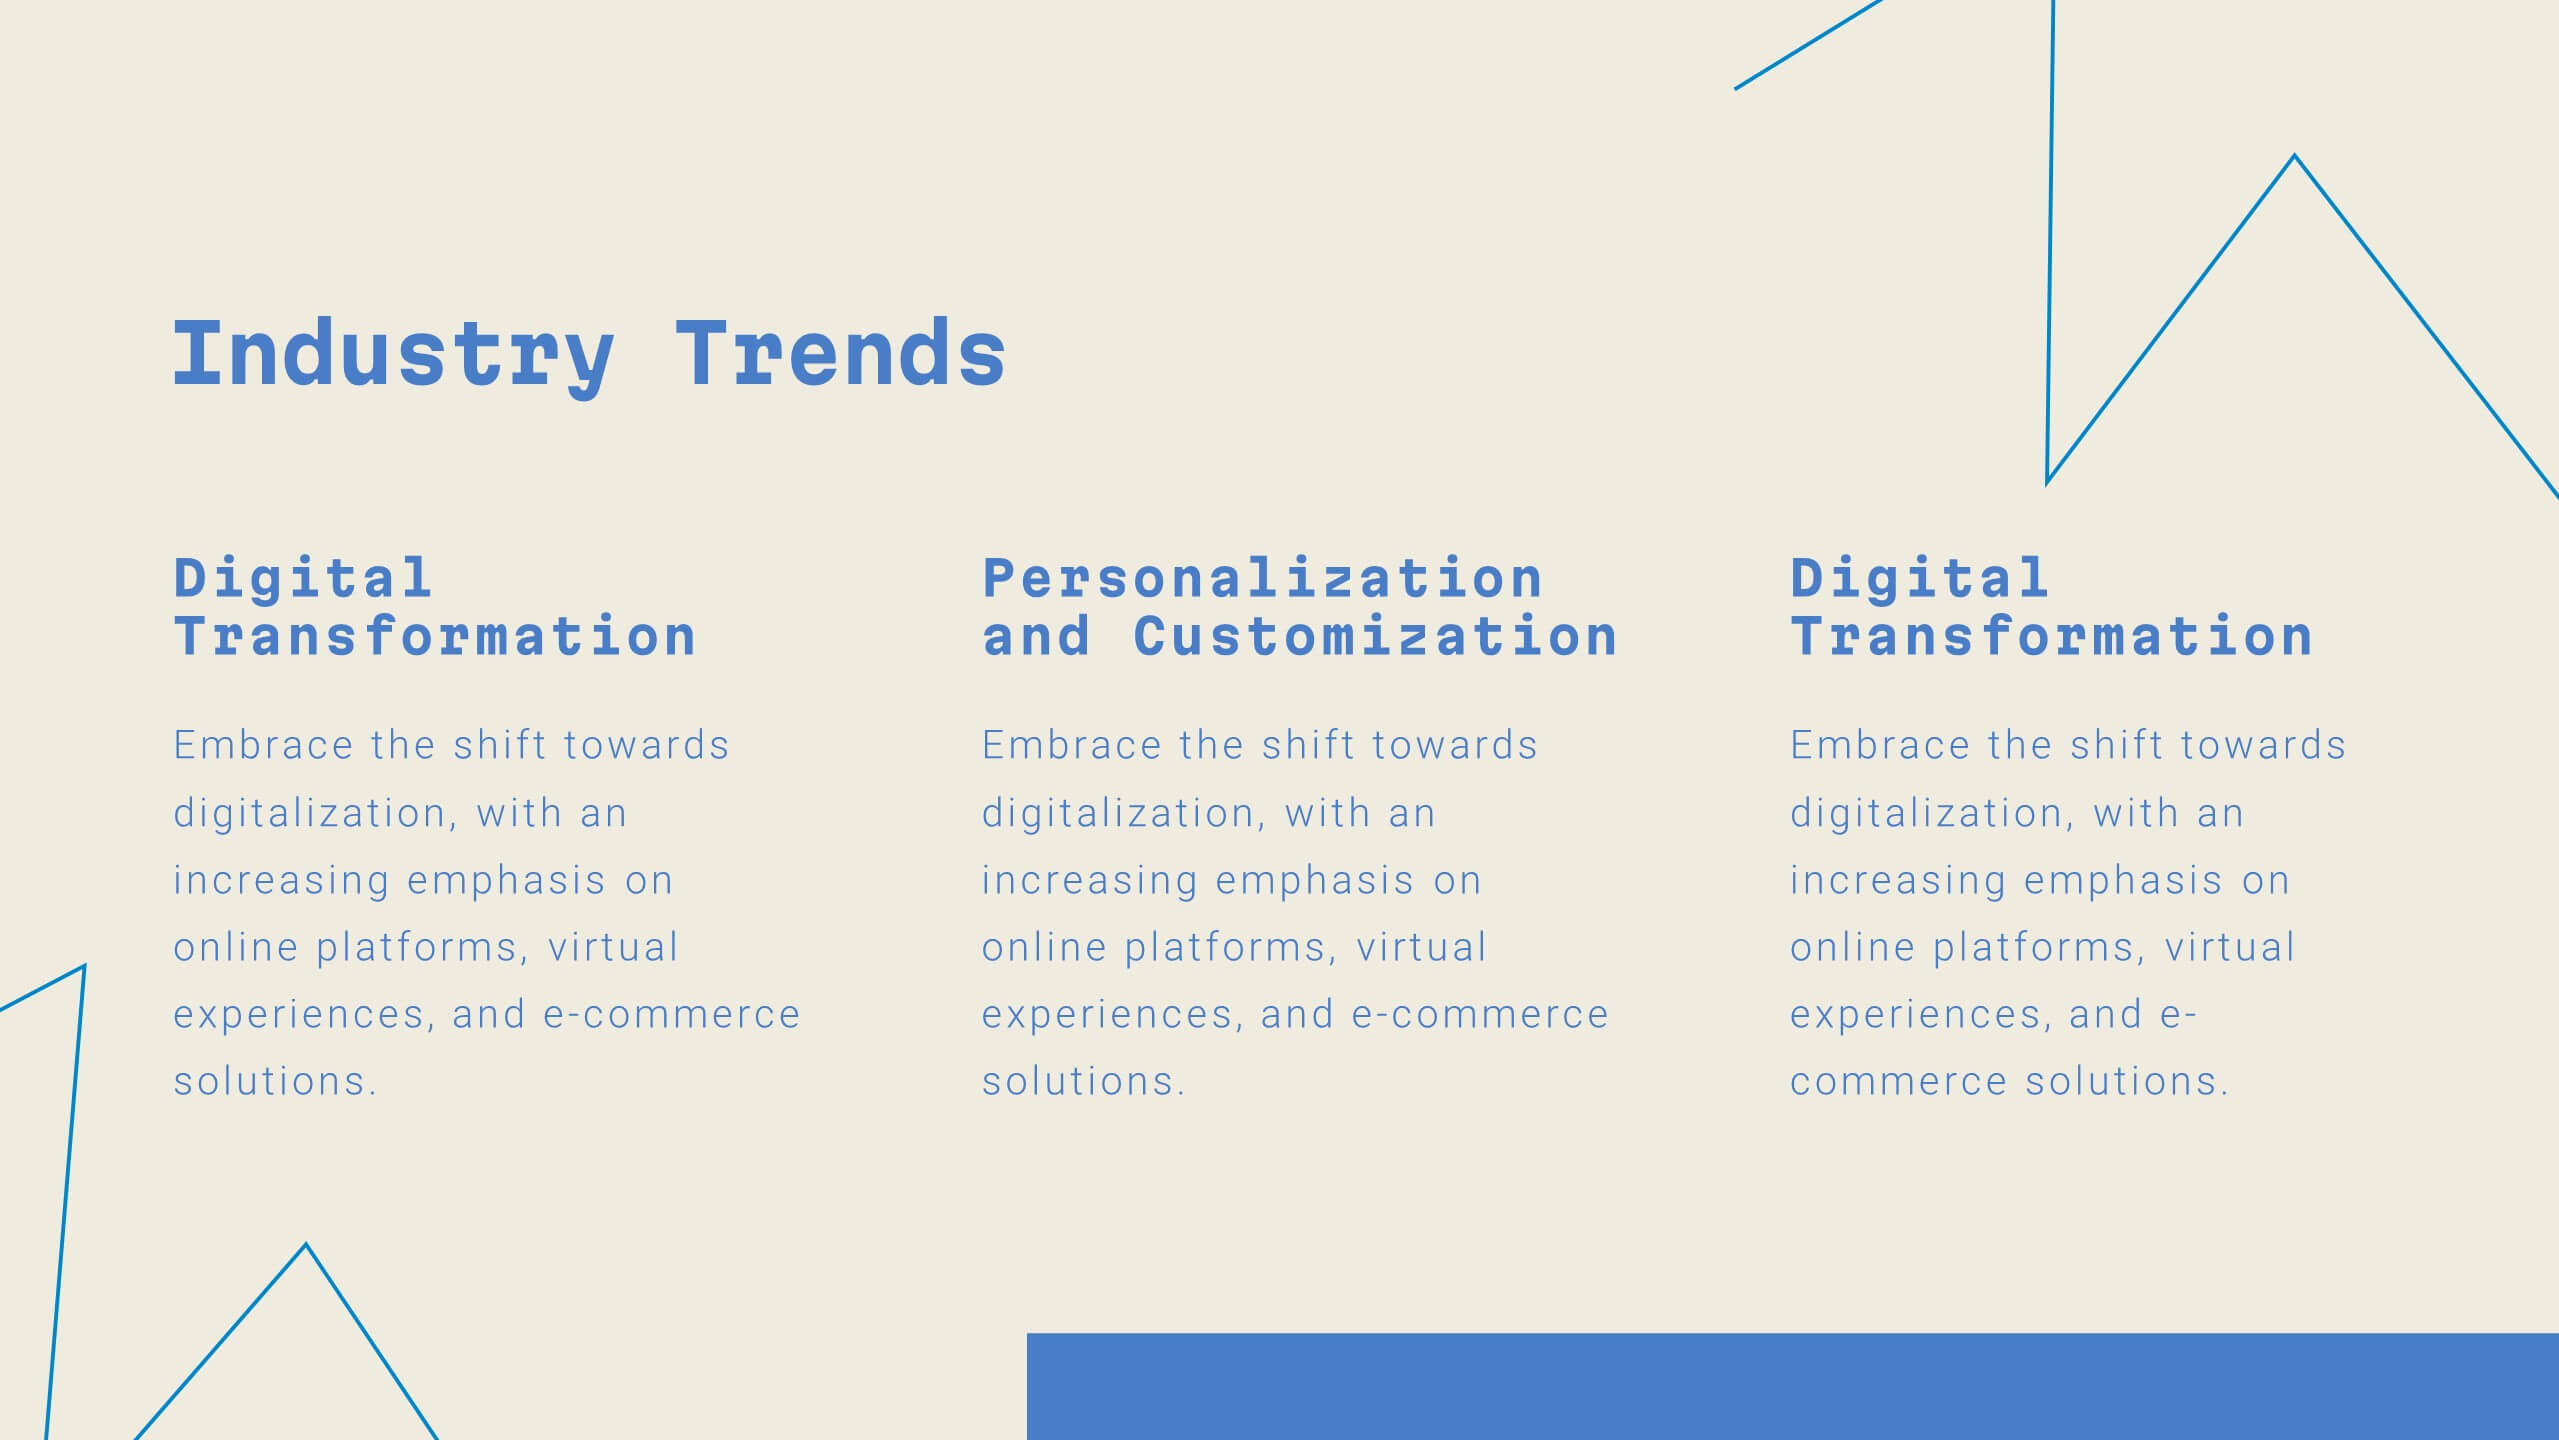
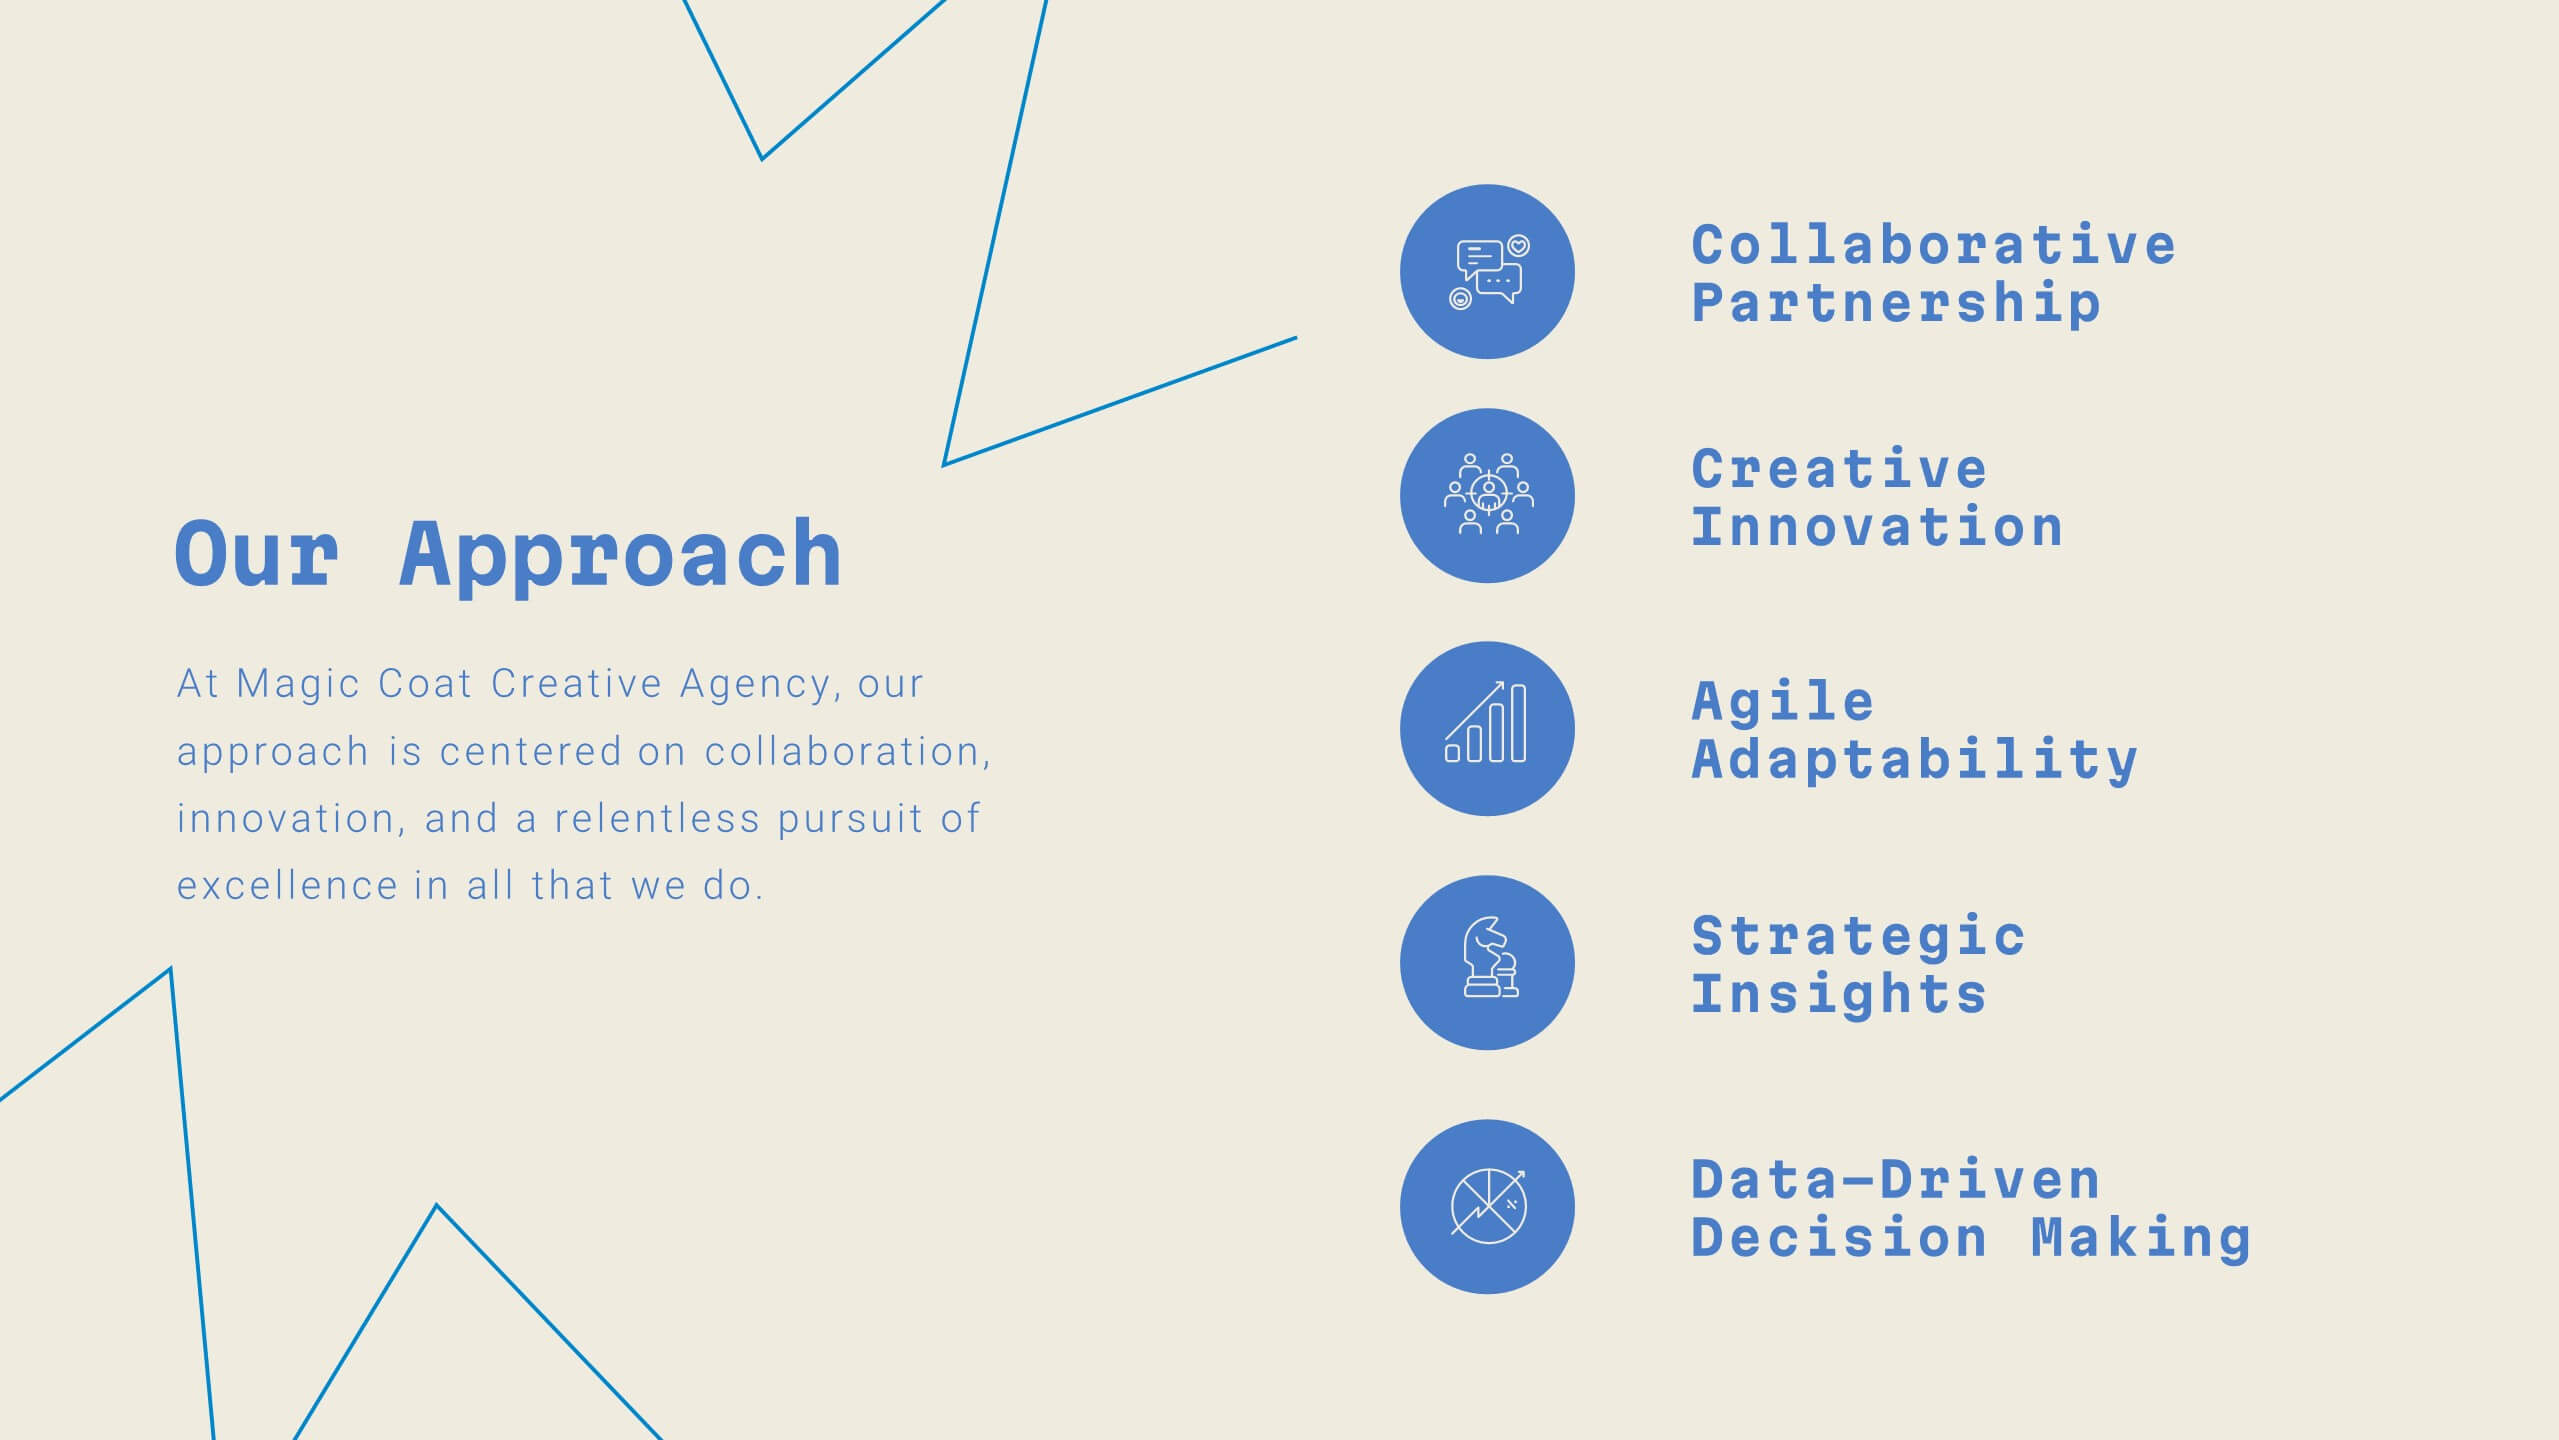
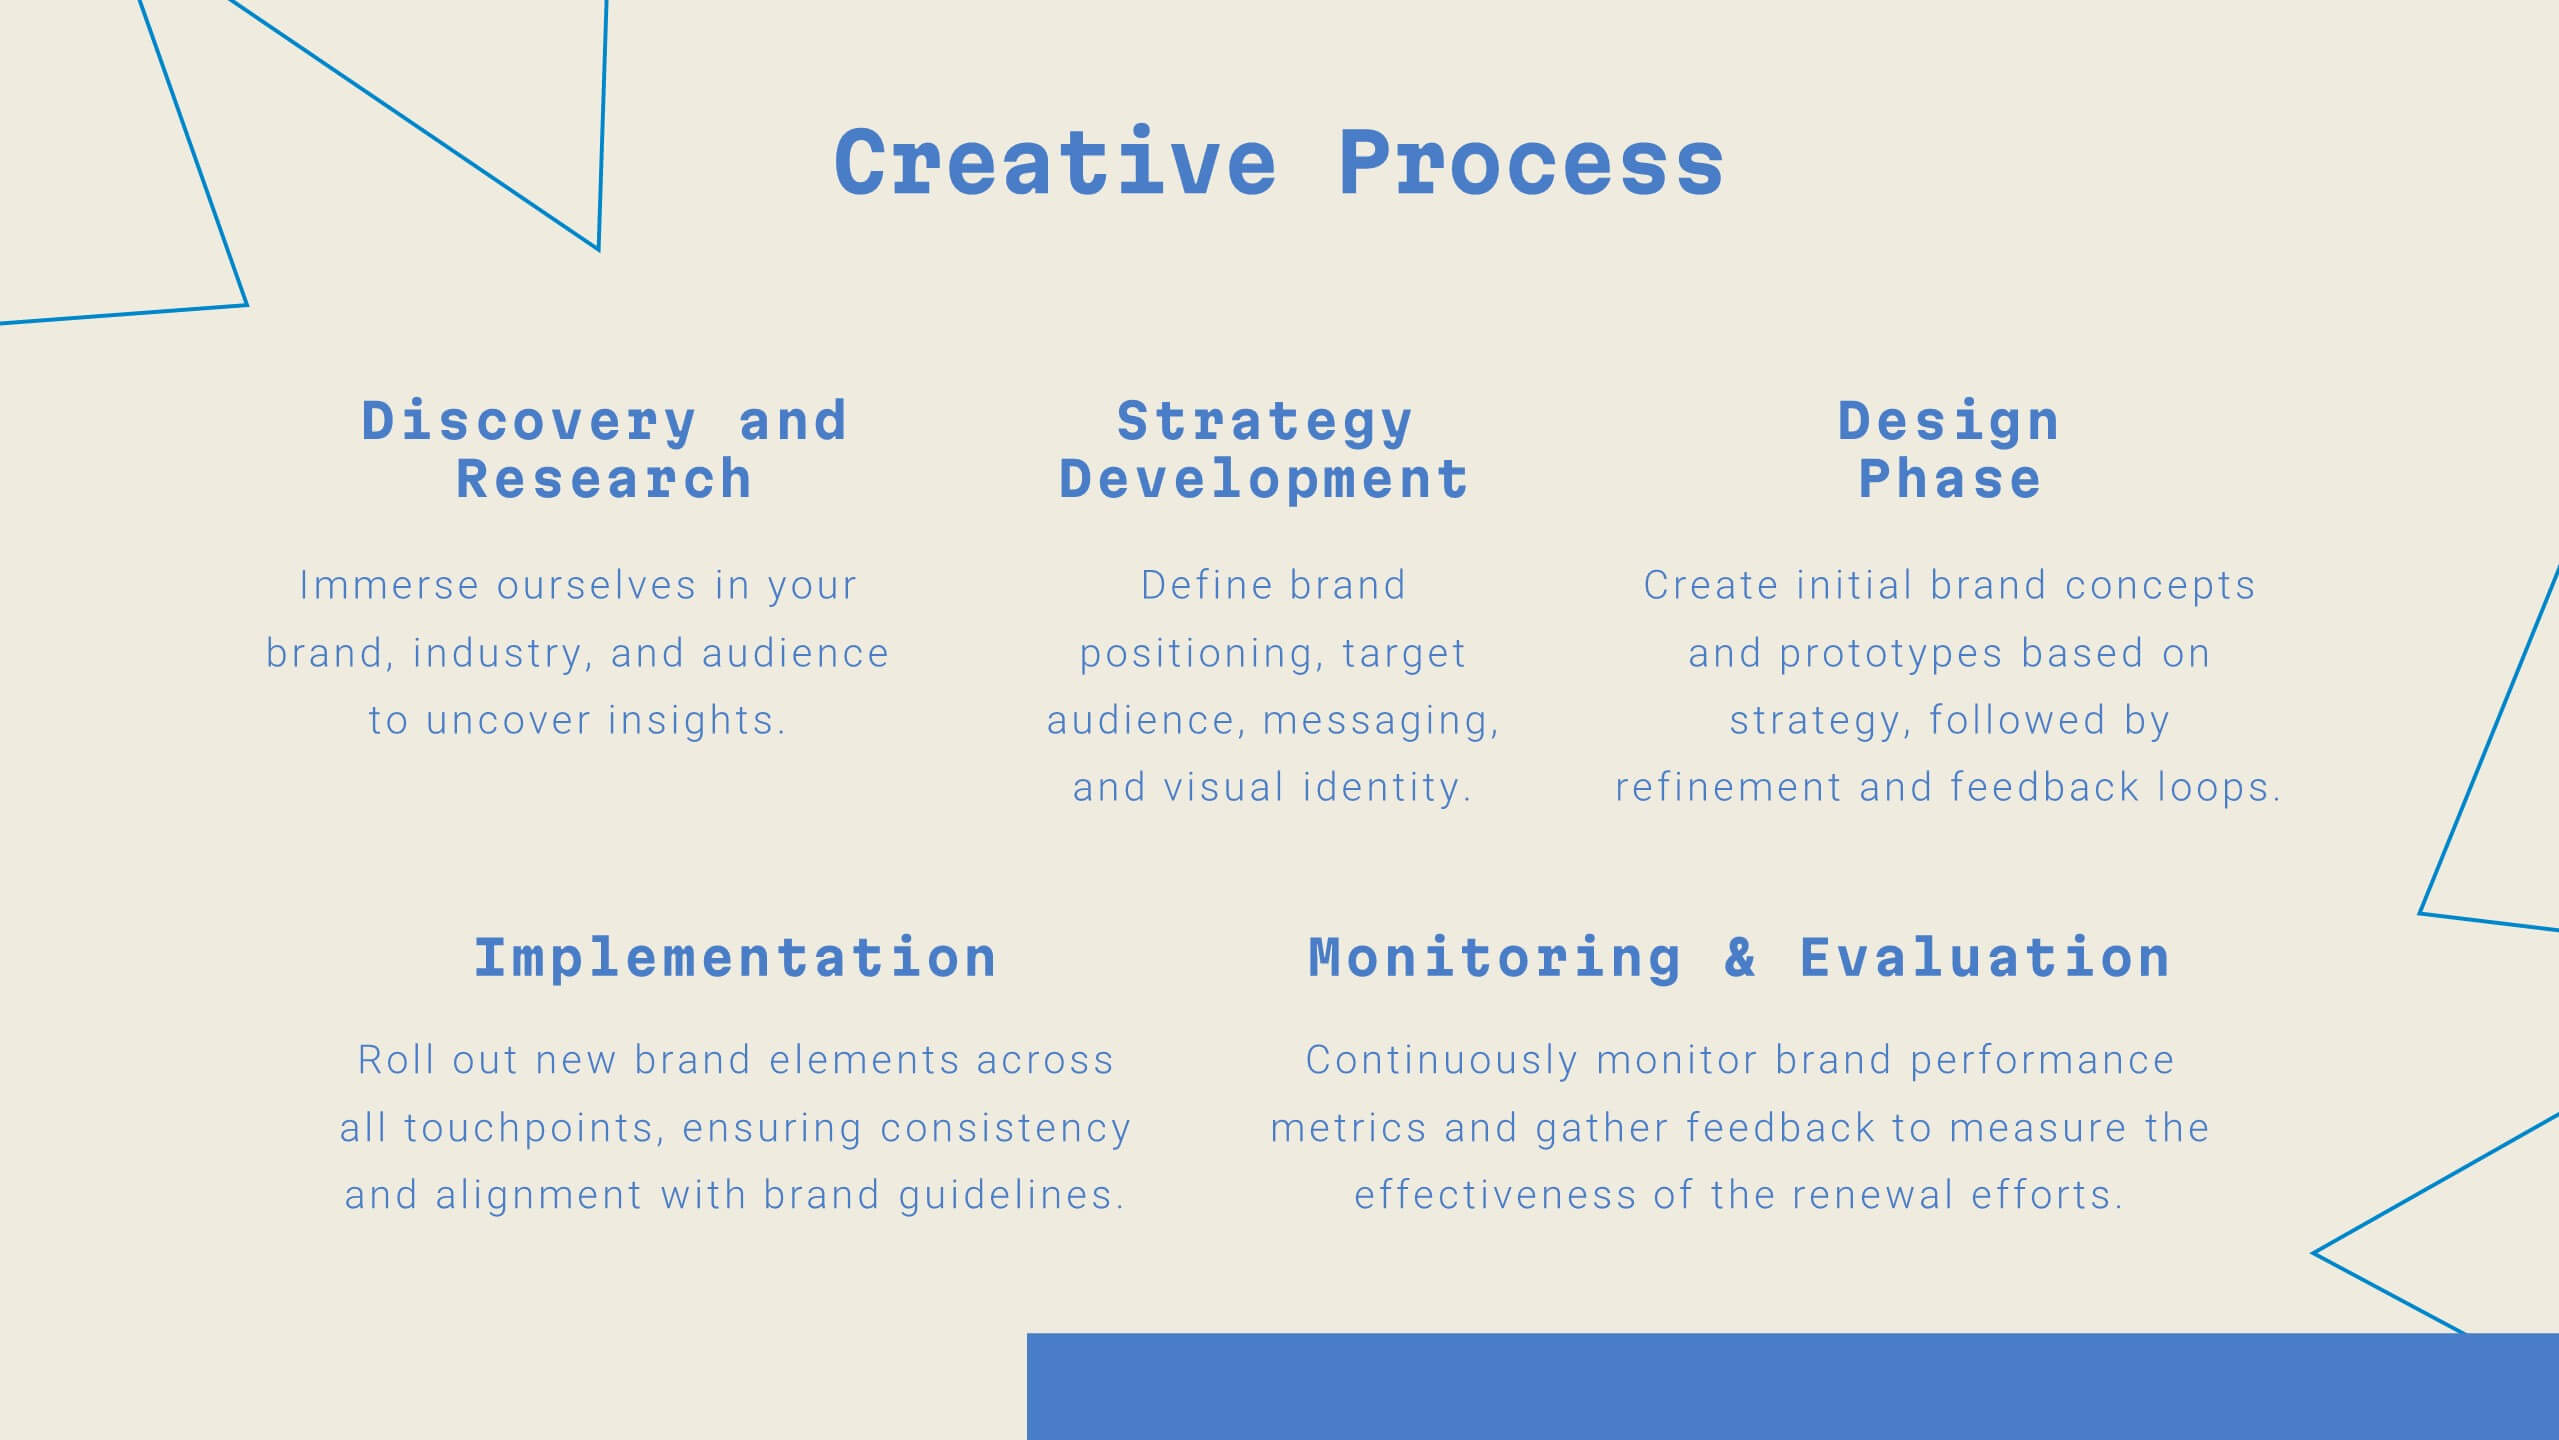
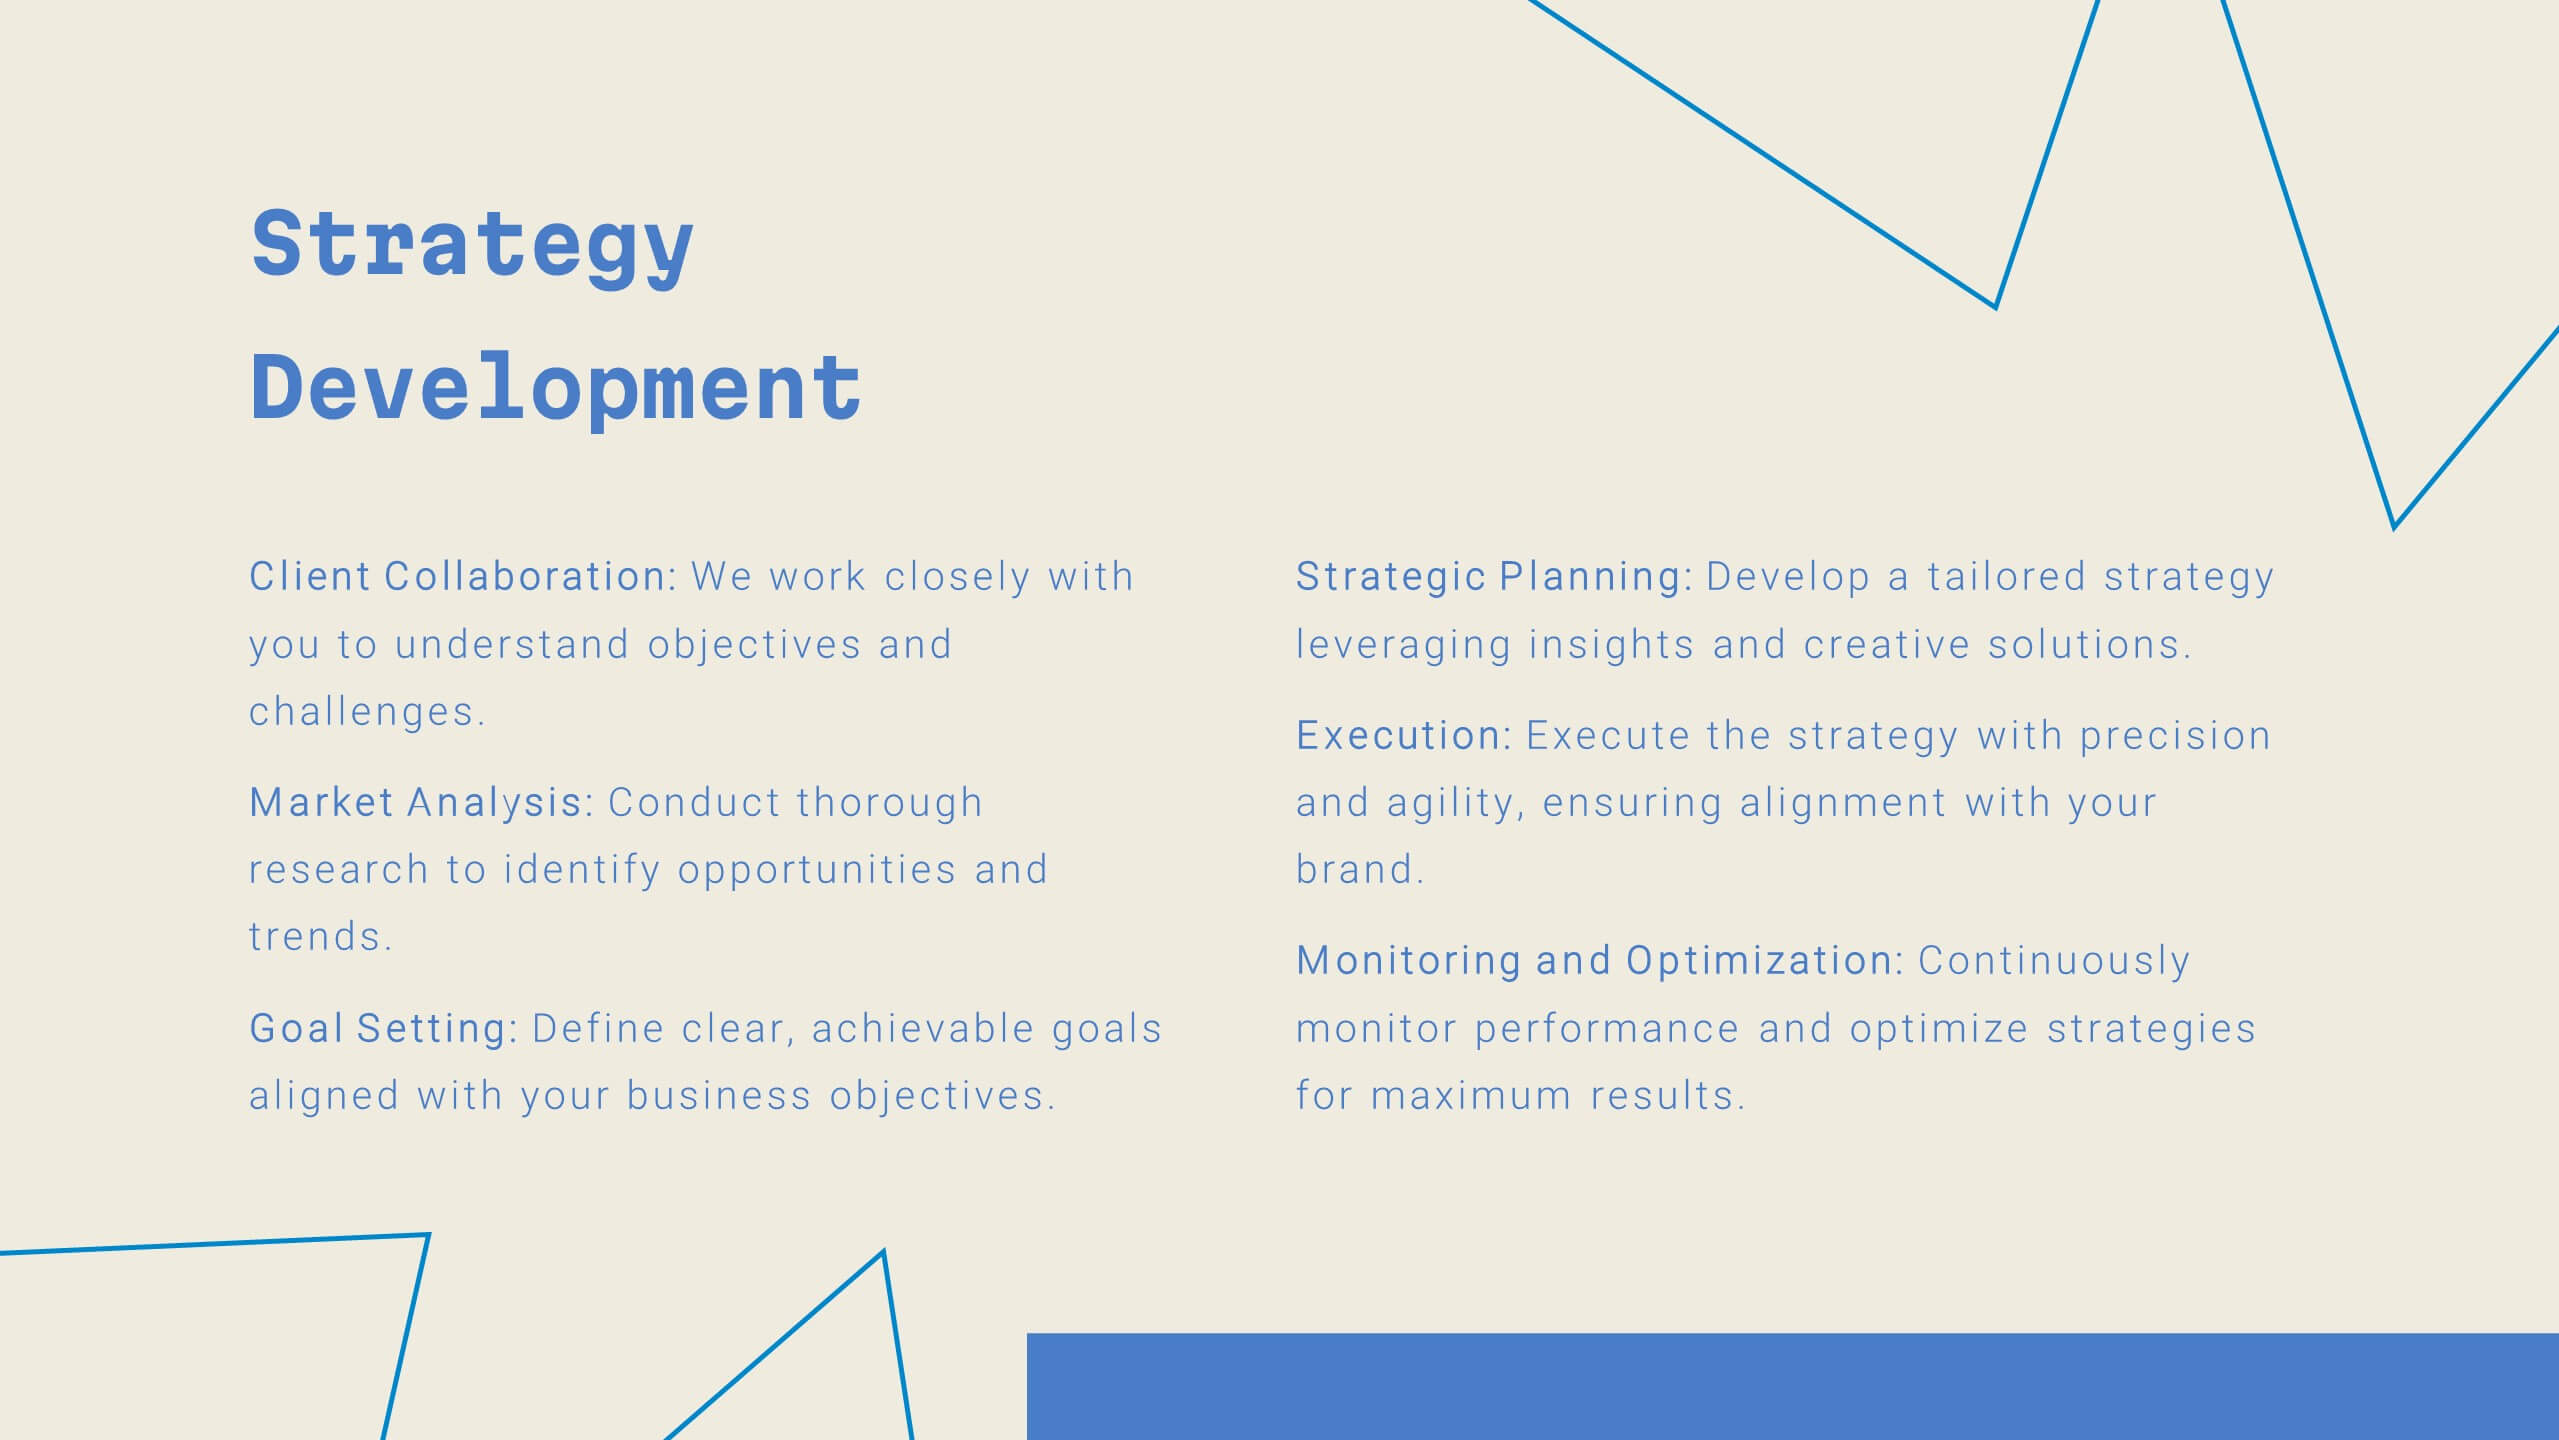
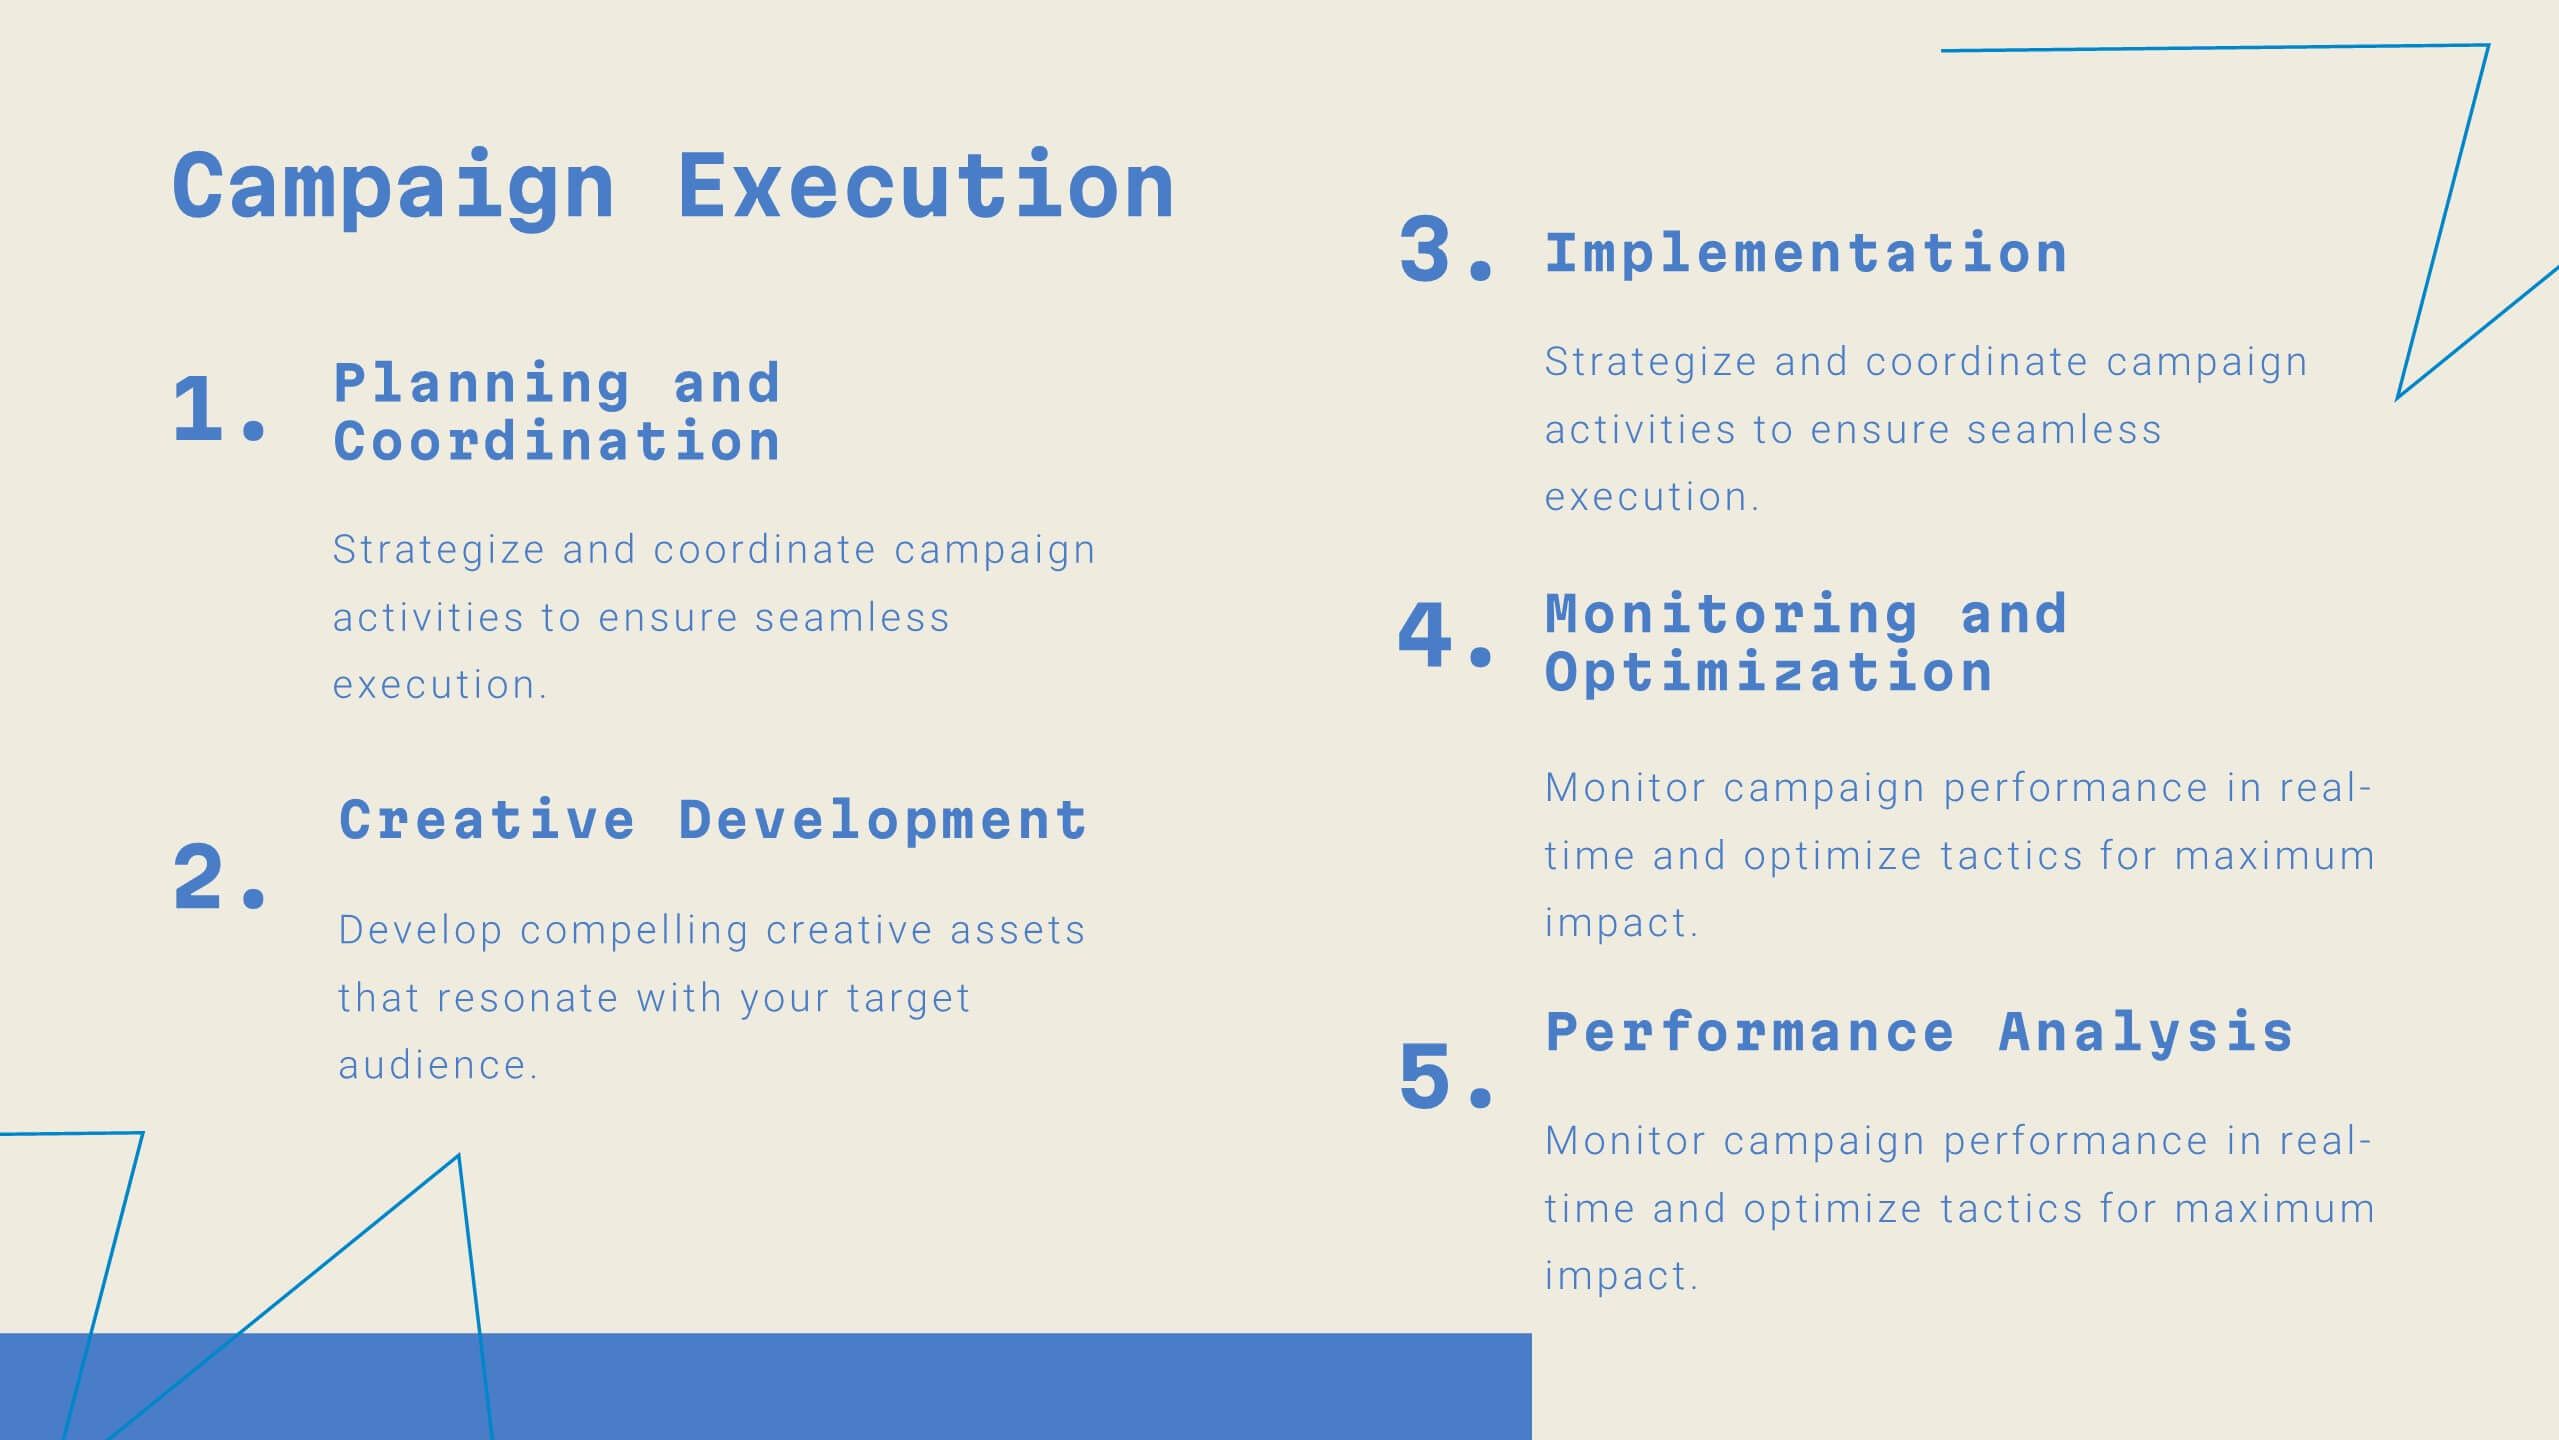
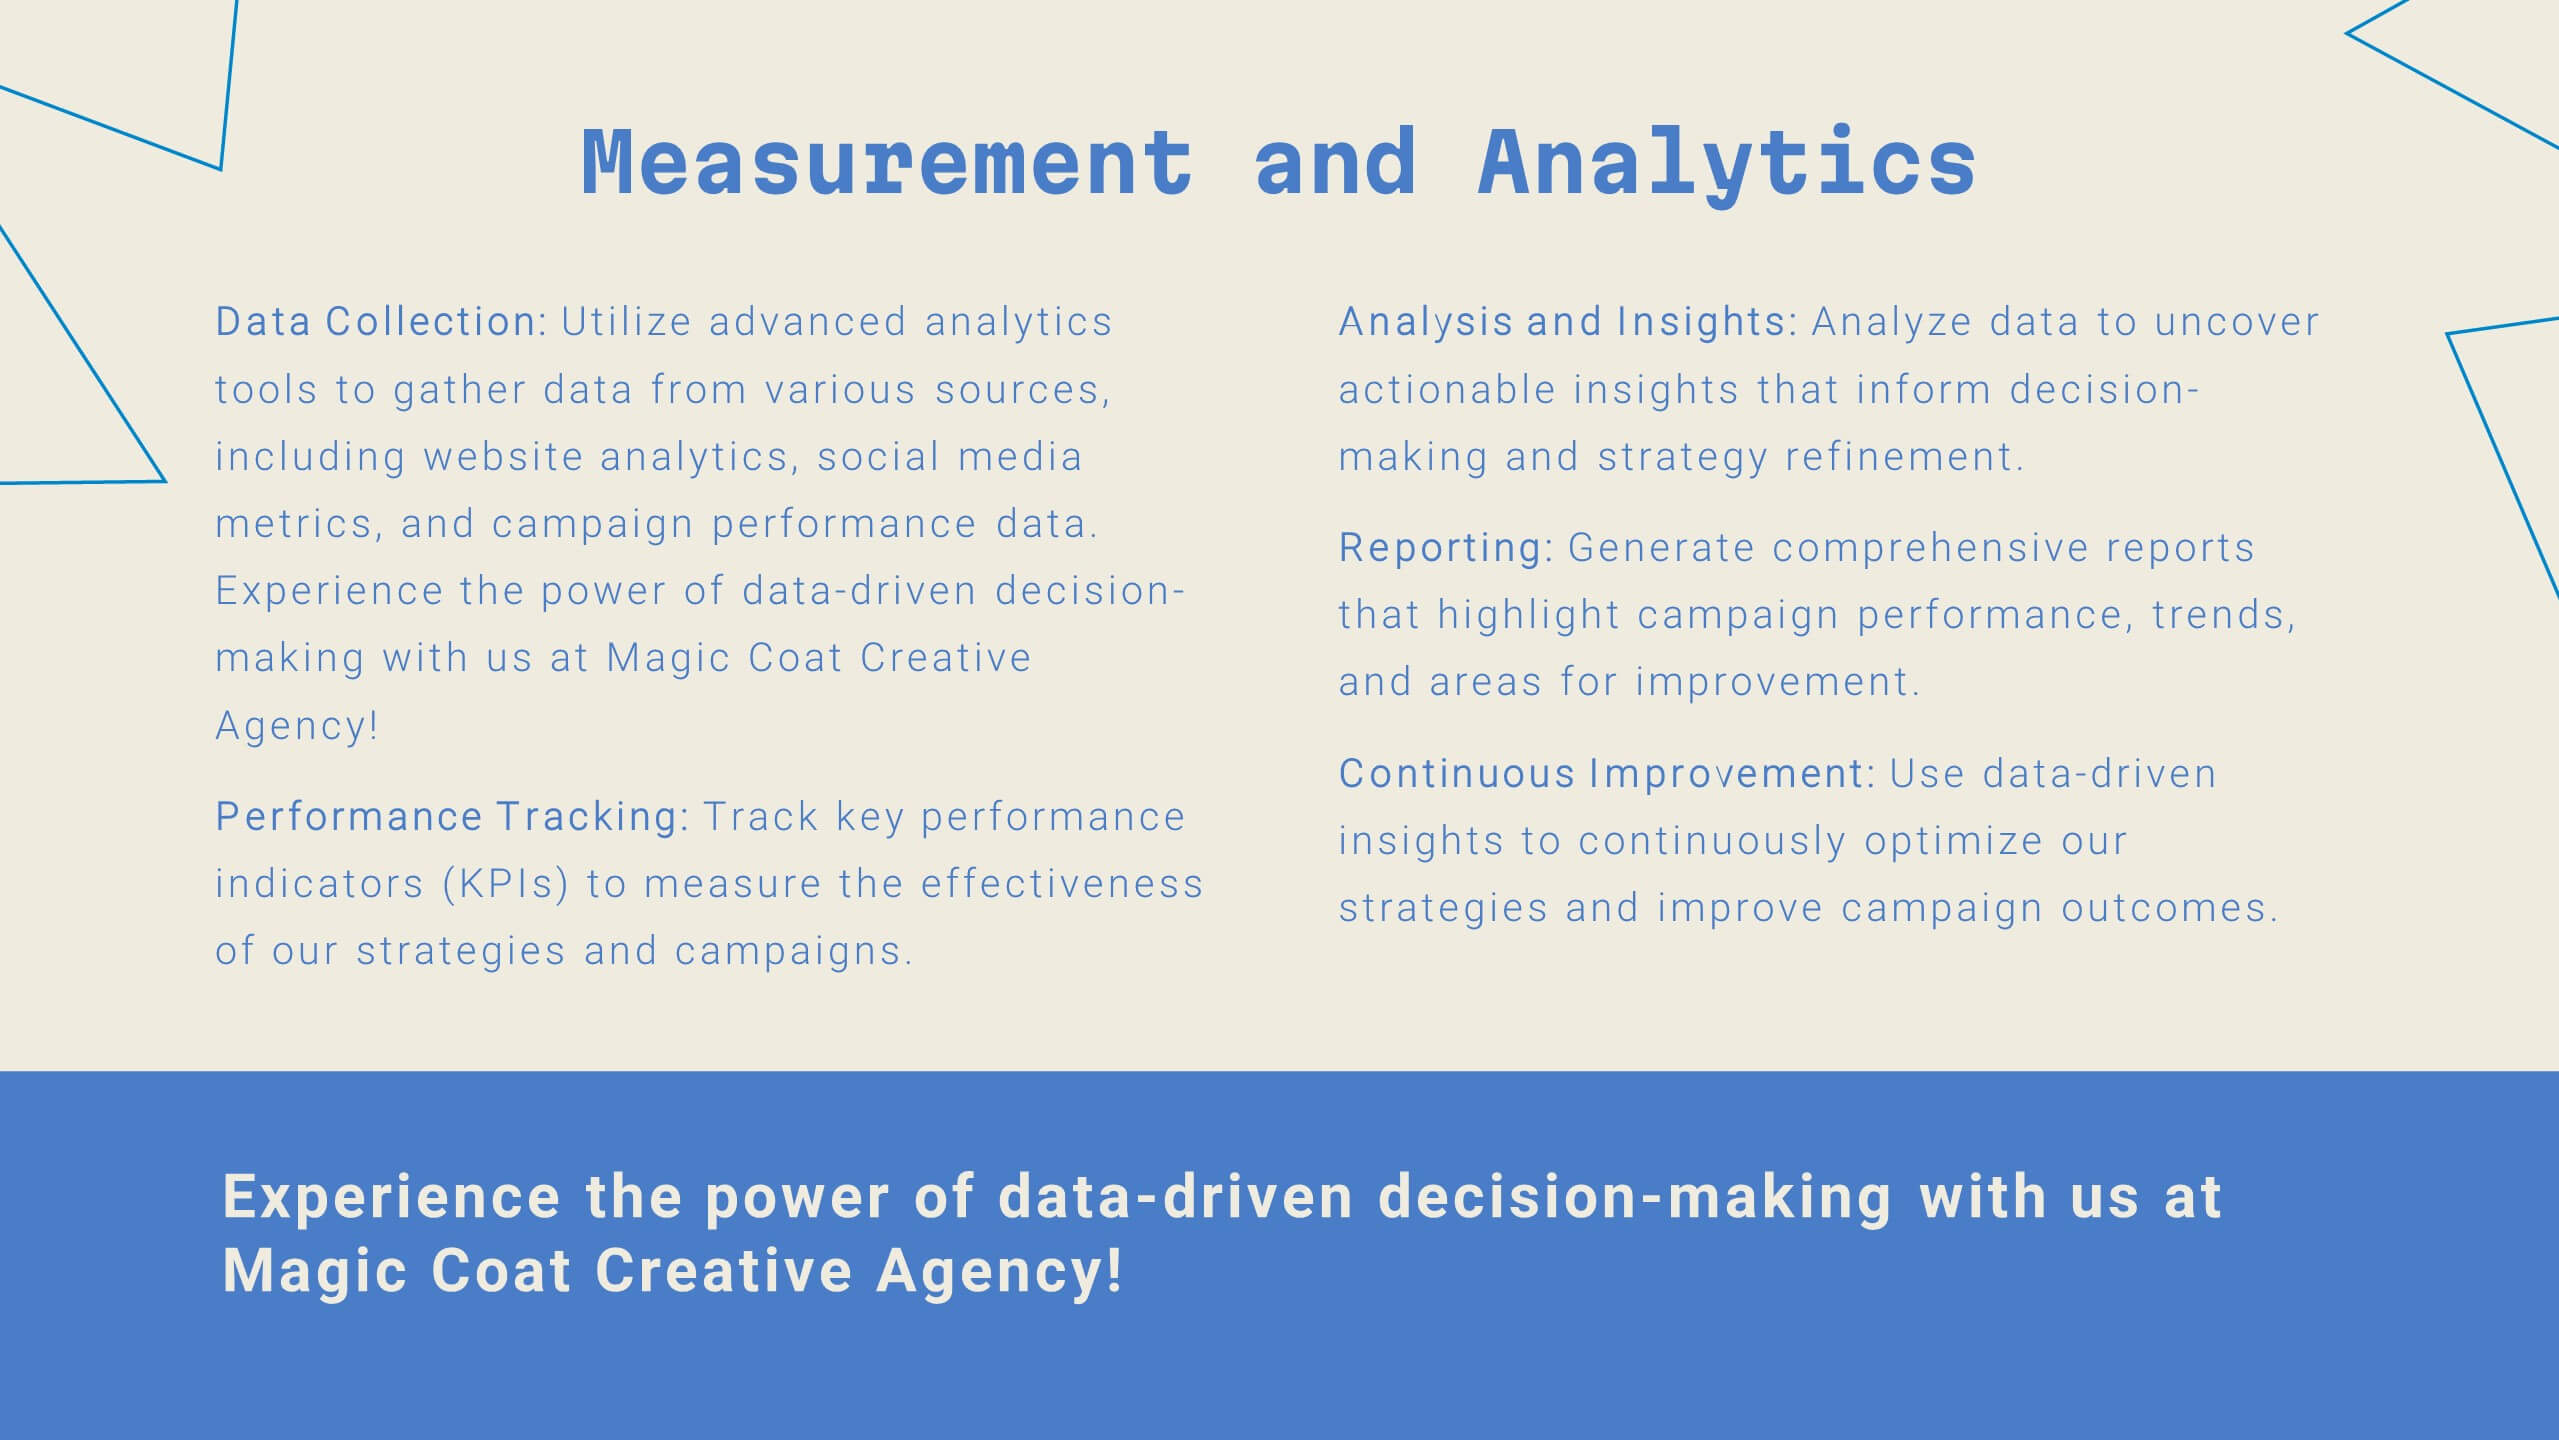
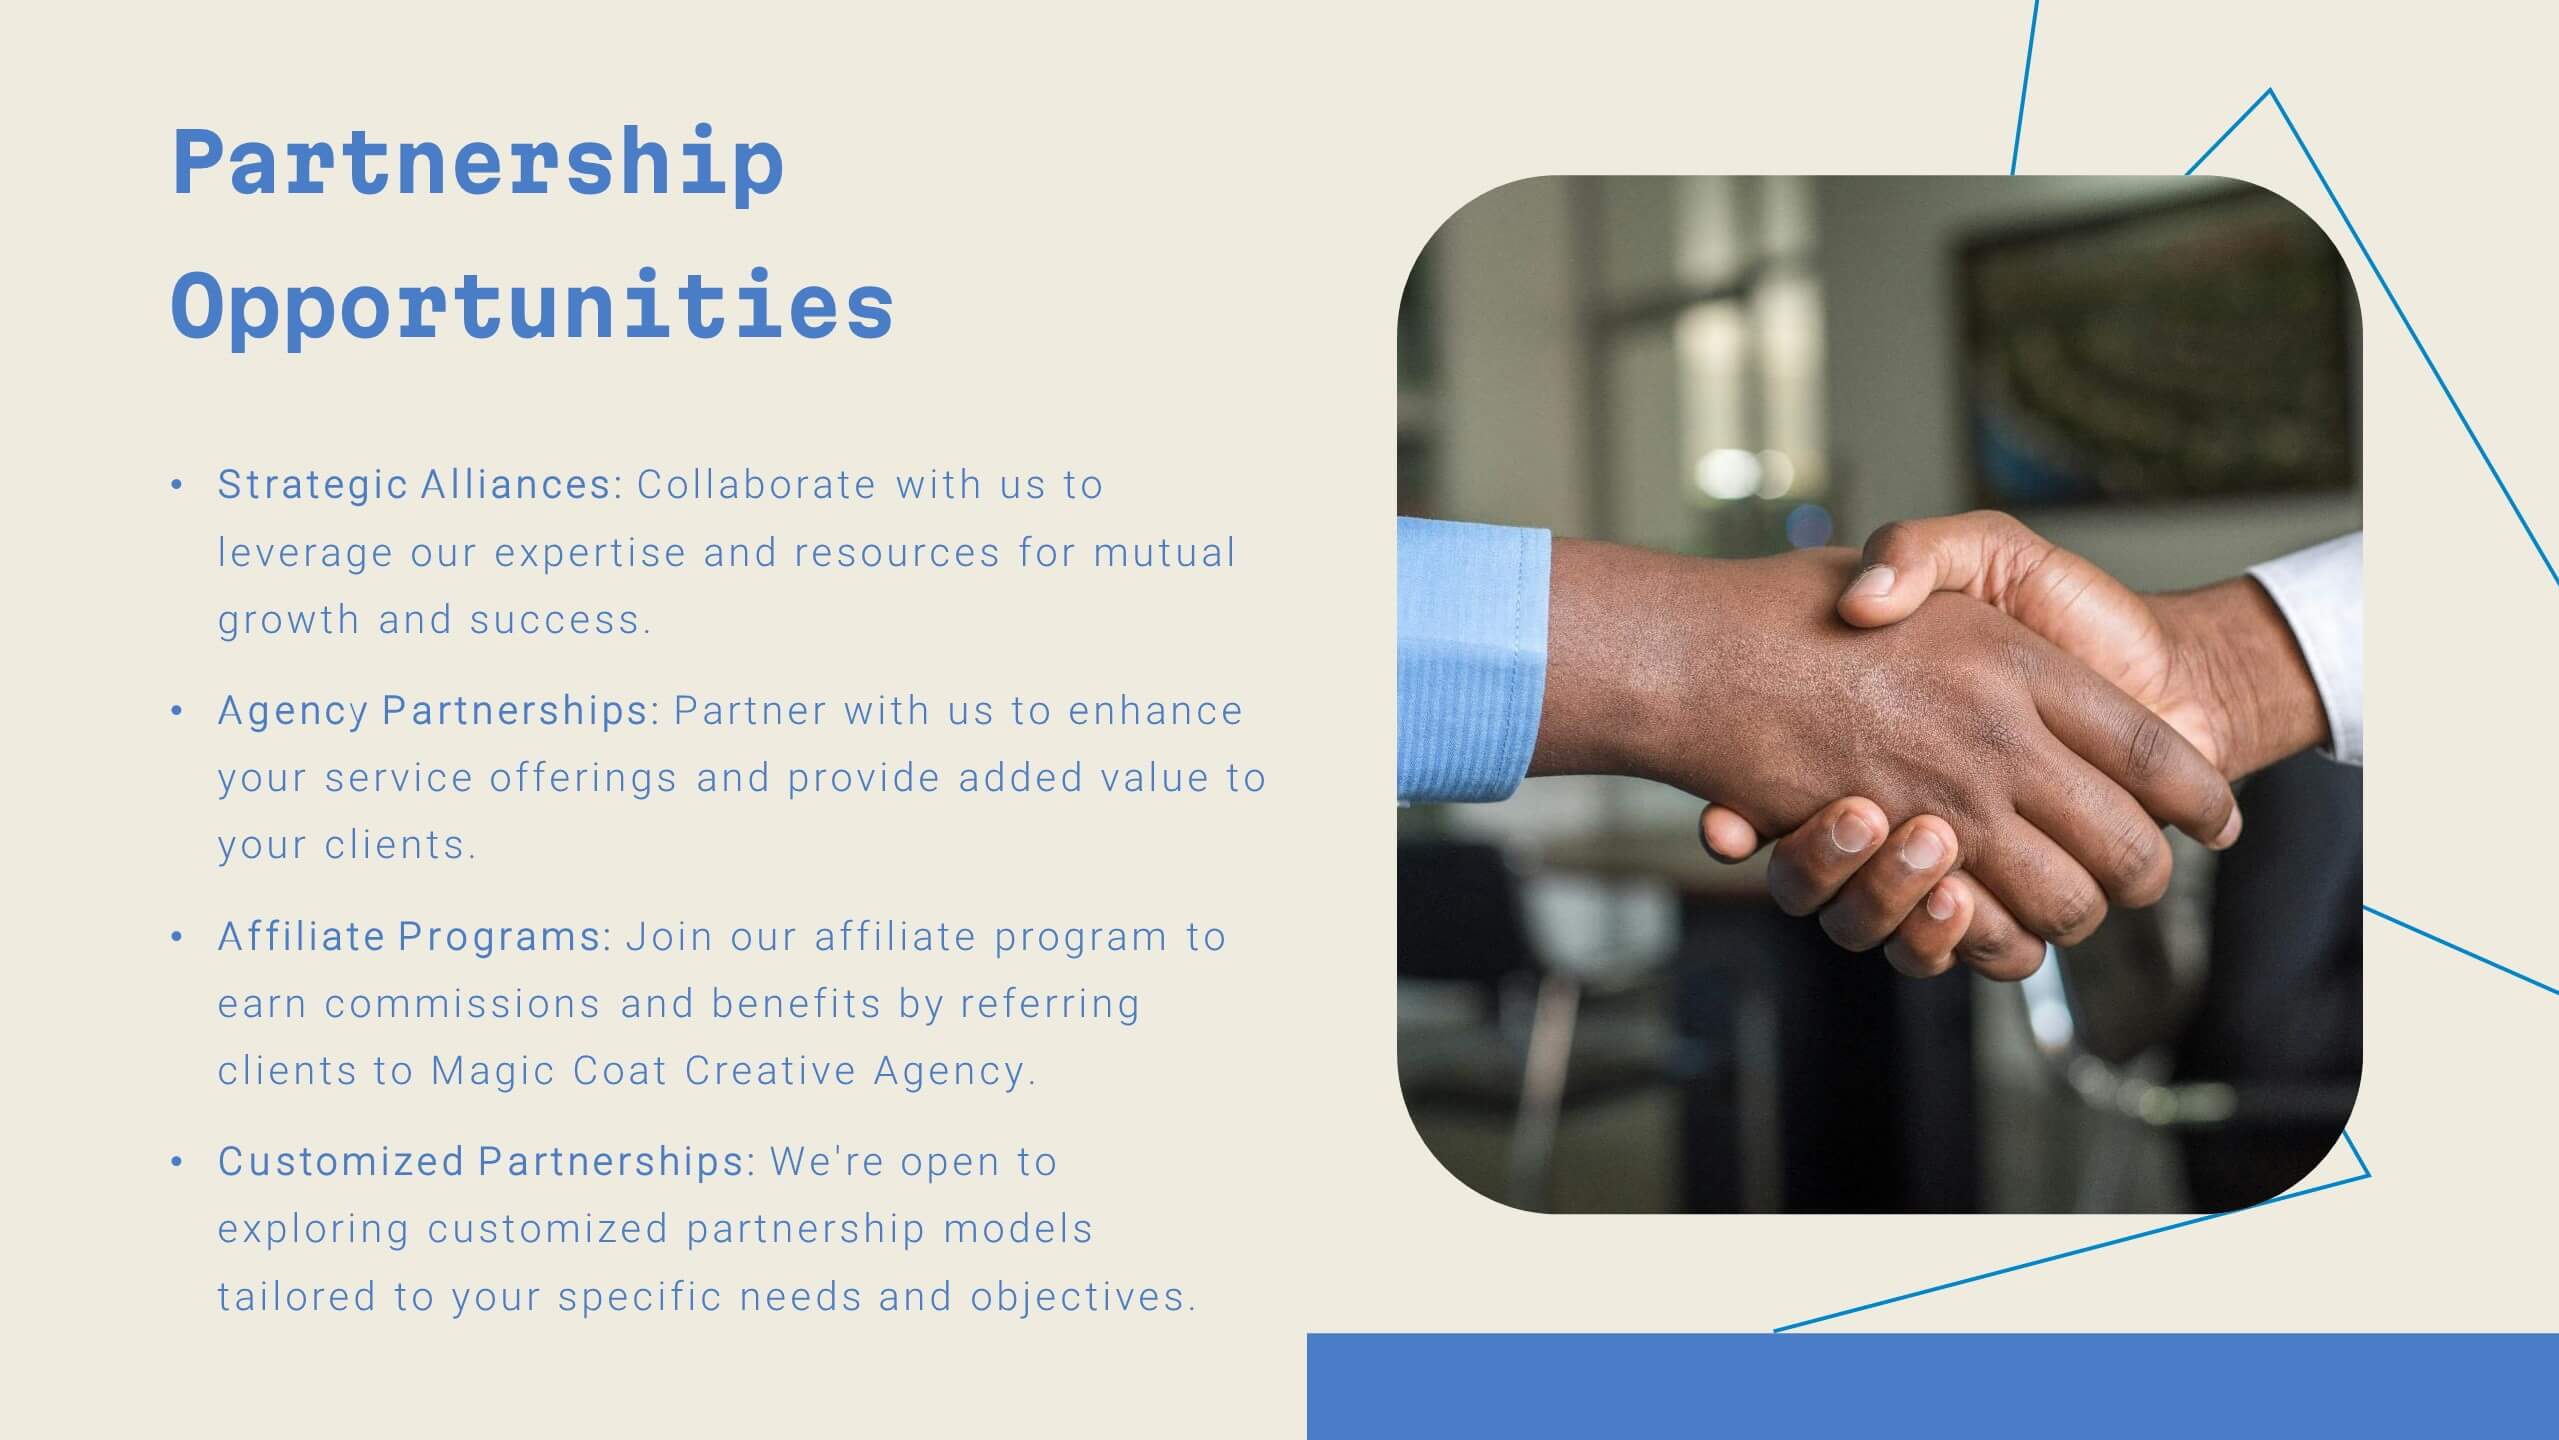
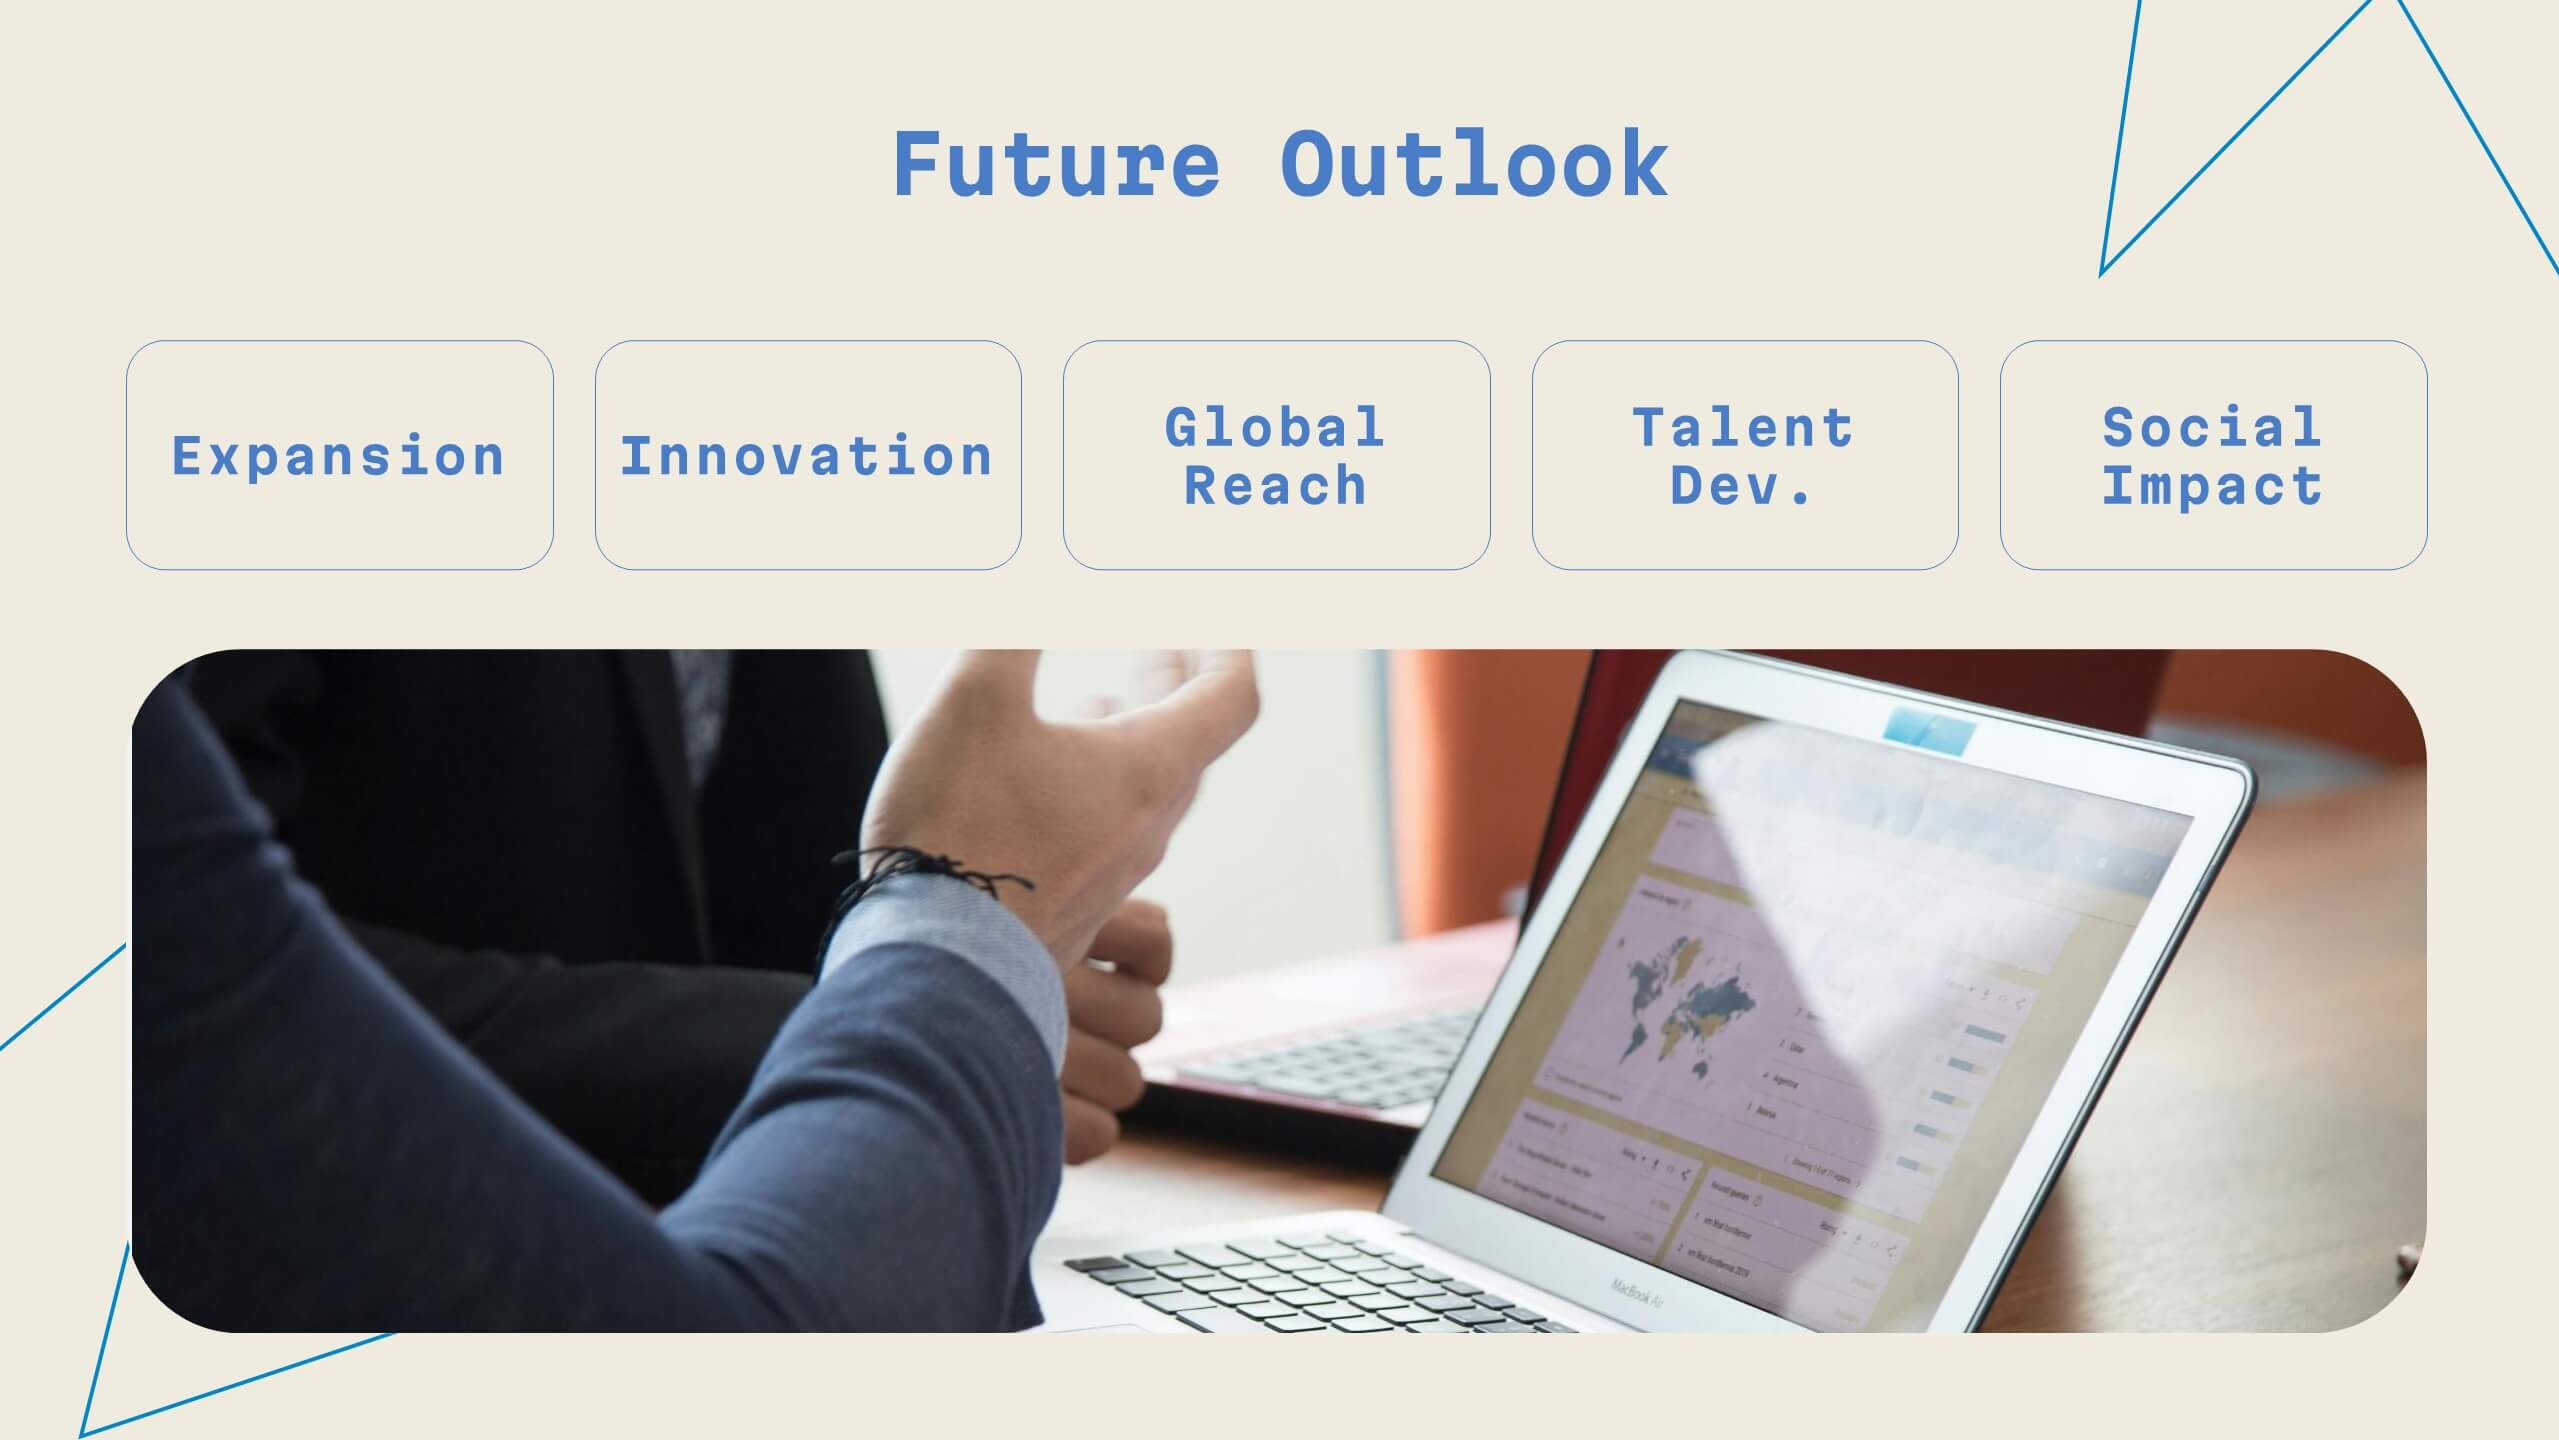
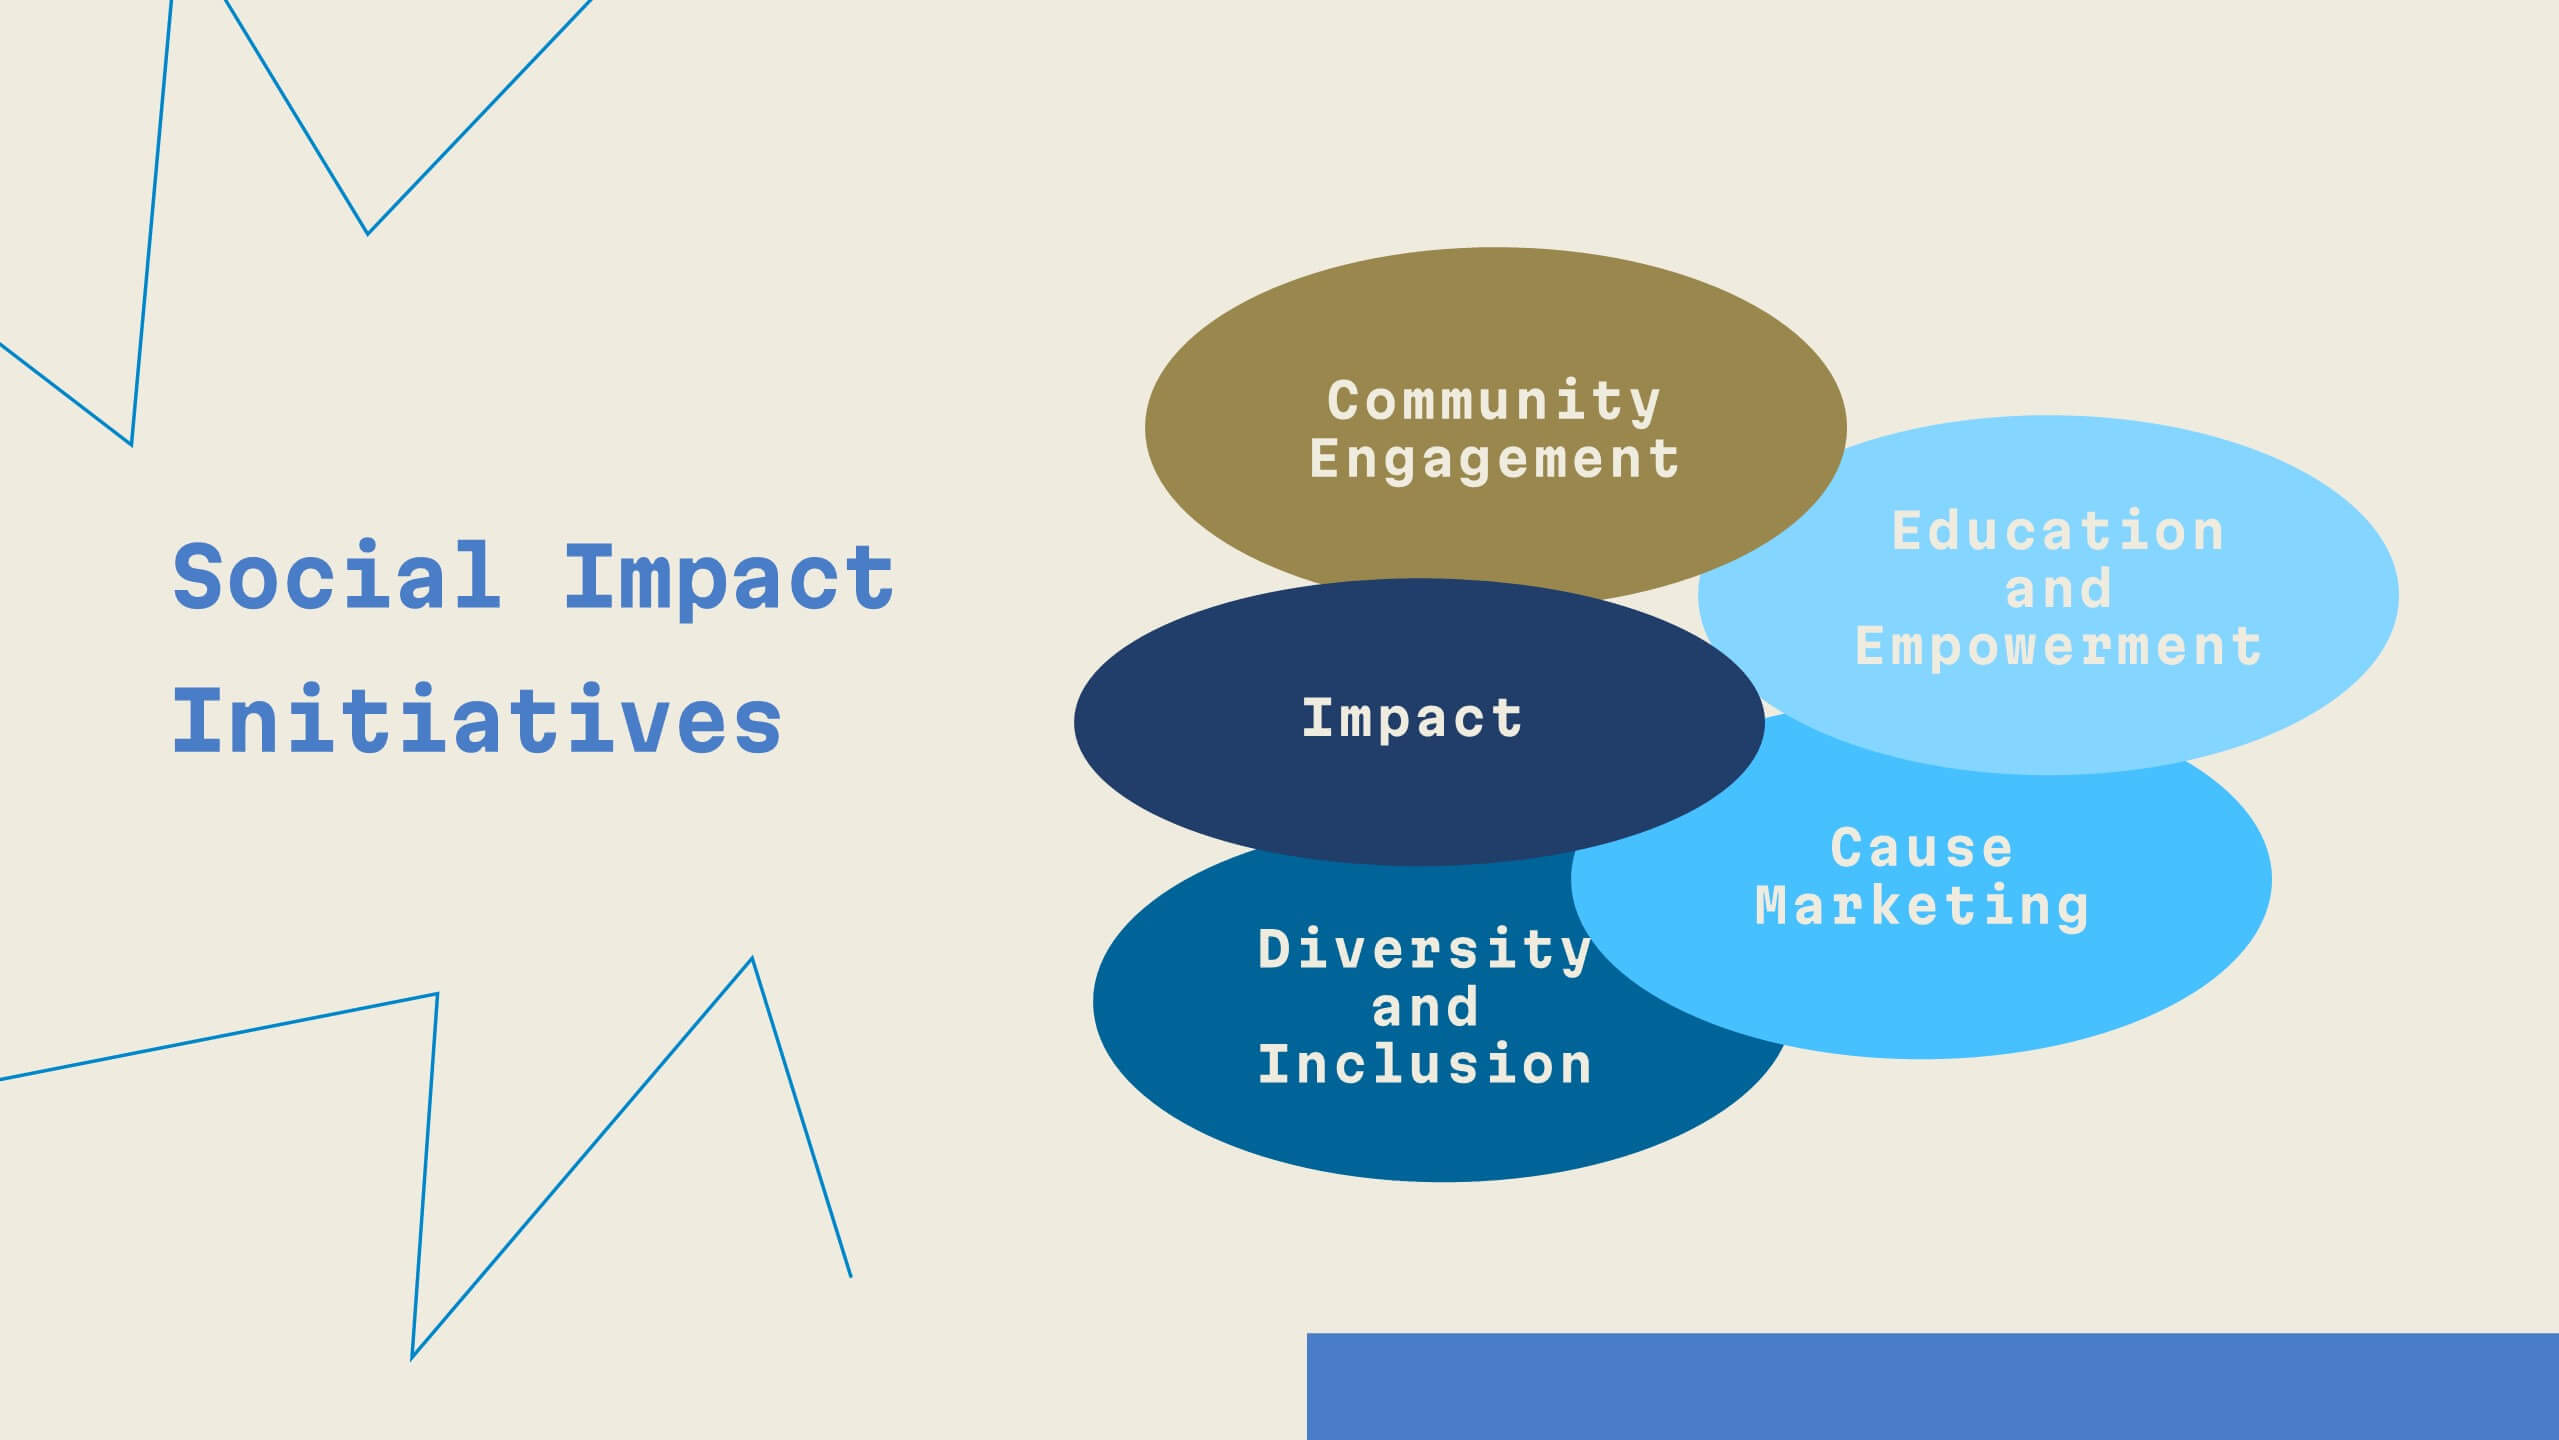
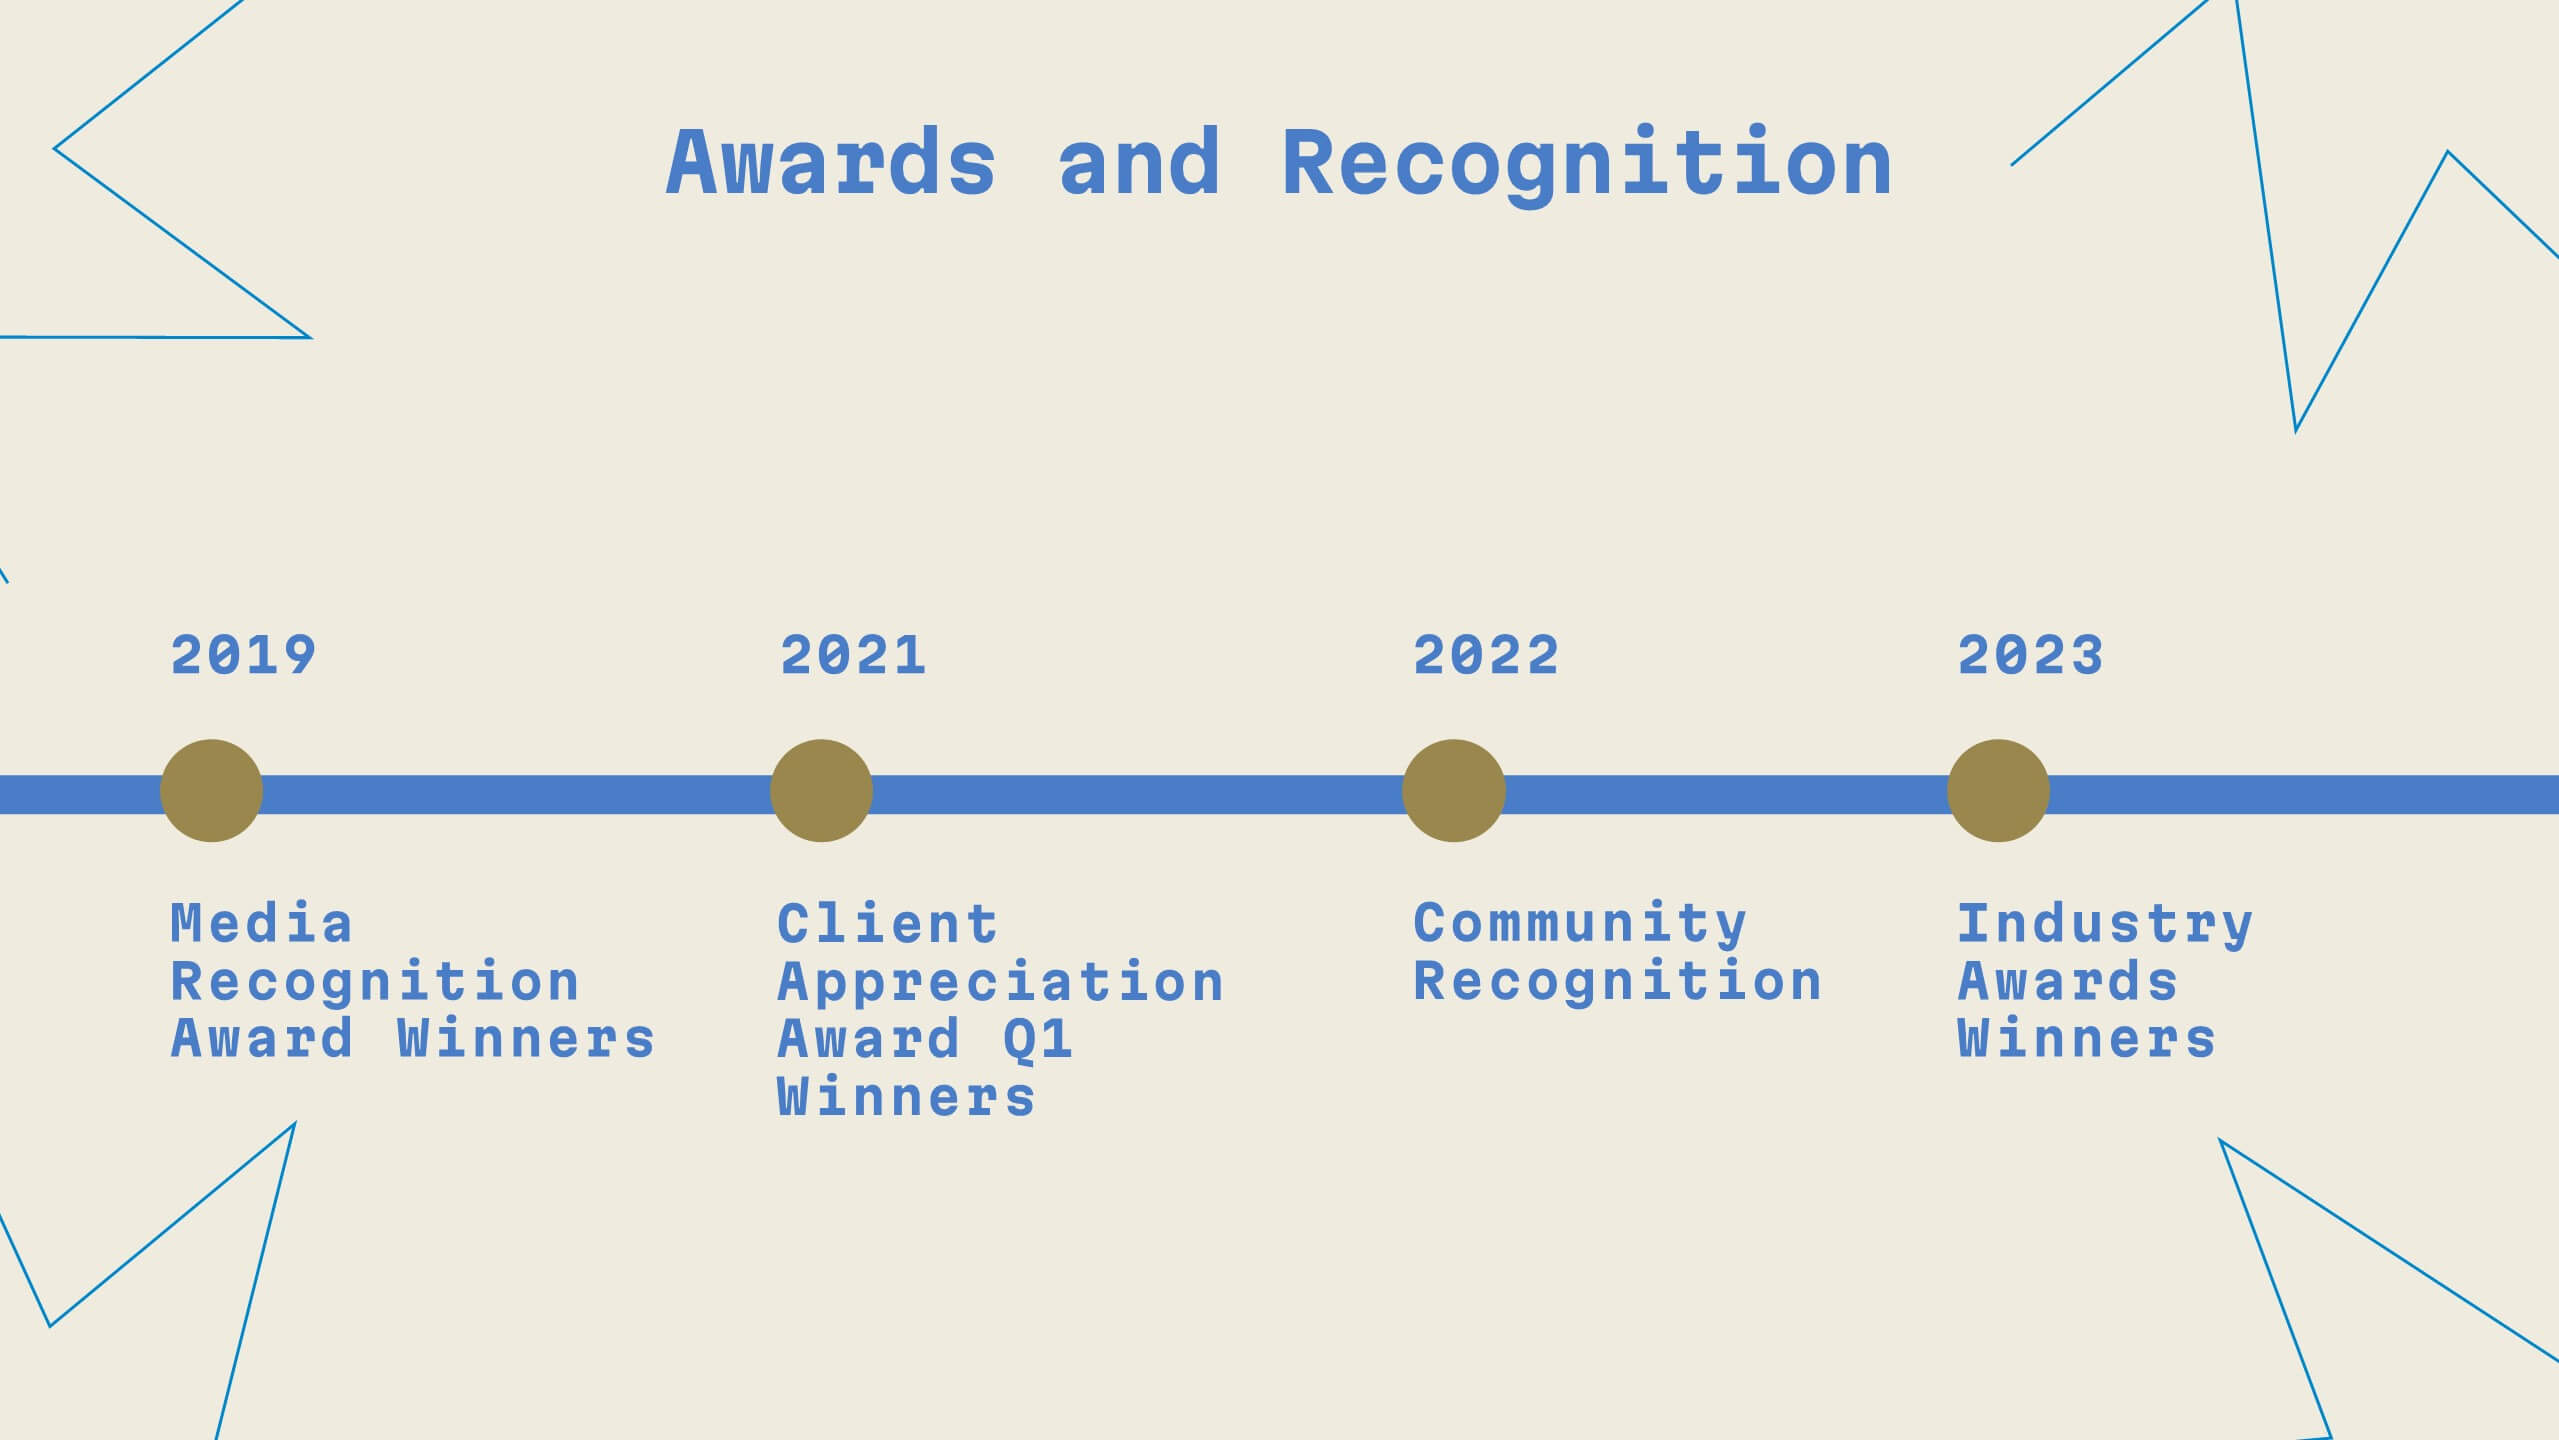
Unity Digital Agency Strategy Plan Presentation
Step into the future of digital marketing with this sleek template! From case studies to strategy development, it offers a comprehensive guide for creating impactful presentations. Highlight client success stories, industry trends, and creative processes with ease. Perfect for showcasing your agency's expertise. Compatible with PowerPoint, Keynote, and Google Slides.