


Features
- 6 Unique slides
- Fully editable and easy to edit in Microsoft Powerpoint, Keynote and Google Slides
- 16:9 widescreen layout
- Clean and professional designs
- Export to JPG, PDF or send by email


Do you have any questions?
Recommend


7 slides
Communication Skills Infographics
Effective communication skills are essential in every aspect of life, including personal relationships, professional relationships, and societal interactions. This template provides you with a great resource for presenting your communication skills. This can help you present your ideas in an effective way. This template features customizable slide designs and graphics allowing you plenty of room to add your own content. The format makes this presentation easy to follow and understand visually as it focuses on what are the most important aspects of delivering effective communication skills.


5 slides
Operational Process Mapping Presentation
Visualize complex workflows with this operational process mapping template, designed with four vertical sections for step-by-step clarity. Ideal for business operations, SOPs, and project management, it features clean flowchart elements for structured planning. Fully editable in Canva, PowerPoint, or Google Slides, ensuring easy customization for any industry or organizational process.


5 slides
Music & Arts Infographics
Music and Arts enrich our lives, stimulate our senses, and foster personal growth this plays a significant role in our lives and society. These infographic templates are perfect for promoting understanding and appreciation for music and arts. These can be used in educational settings, cultural organizations, or for personal enrichment, this template effectively conveys the significance of music and arts in our lives and inspires the audience to explore and engage with these creative expressions. These infographics include text boxes, icons, and color schemes that can be customized to fit your brand.


6 slides
Big Data Insights Visual Presentation
Transform complex analytics into clear, engaging visuals that tell a compelling story. This modern layout is perfect for showcasing data connections, performance metrics, and analytical insights in a visually balanced way. Fully editable and compatible with PowerPoint, Keynote, and Google Slides for seamless customization and professional presentations.


7 slides
Real Estate Companies Infographic
Real estate companies are organizations that engage in various aspects of the real estate industry, which involves the buying, selling, managing, or investing in properties. Creating an infographic about real estate companies can be a great way to showcase key information, trends, and benefits of various real estate firms. Customize the content, design, and visuals to create an engaging and informative infographic that provides insights into the real estate industry and the leading companies within it. Real estate is a dynamic field, and your infographic can serve as a valuable resource for potential clients and investors.


4 slides
Digital Marketing and SEO Best Practices Presentation
Communicate your digital strategy with this clean and structured visual layout. This template features a horizontal flowchart design with four circular icons branching from a central infographic, allowing you to showcase core areas such as audience targeting, content creation, performance analytics, and ranking improvement. Ideal for marketers, consultants, and SEO professionals. Fully editable in PowerPoint, Keynote, and Google Slides.


20 slides
Milky Way Design Portfolio Presentation
The Milky Way Design Portfolio template is your ultimate tool for showcasing your creative work with elegance and professionalism. This template combines soft pastel colors with modern design elements, making your projects stand out. Perfect for designers, artists, and creative professionals, it includes sections like portfolio overview, creative process, collaborations, client testimonials, and more. Each slide is carefully designed to highlight your work, achievements, and services in a visually appealing manner. The layout is clean and minimalistic, ensuring that the focus remains on your content. Whether you're presenting a single project or a diverse range of work, this template adapts effortlessly to your needs. It's fully compatible with PowerPoint, Keynote, and Google Slides, offering flexibility and ease of use across platforms. Impress your audience and potential clients with a portfolio presentation that's as polished and creative as your work itself.


24 slides
Copper Small Business Pitch Deck Presentation
Elevate your business presentations with this clean and professional pitch deck template! Ideal for team meetings, business updates, or investor pitches, it includes sections for collaboration opportunities, performance metrics, and process improvements. The layout ensures clarity and focus, making it perfect for effective communication. It’s fully customizable and works seamlessly with PowerPoint, Keynote, and Google Slides for hassle-free integration.


21 slides
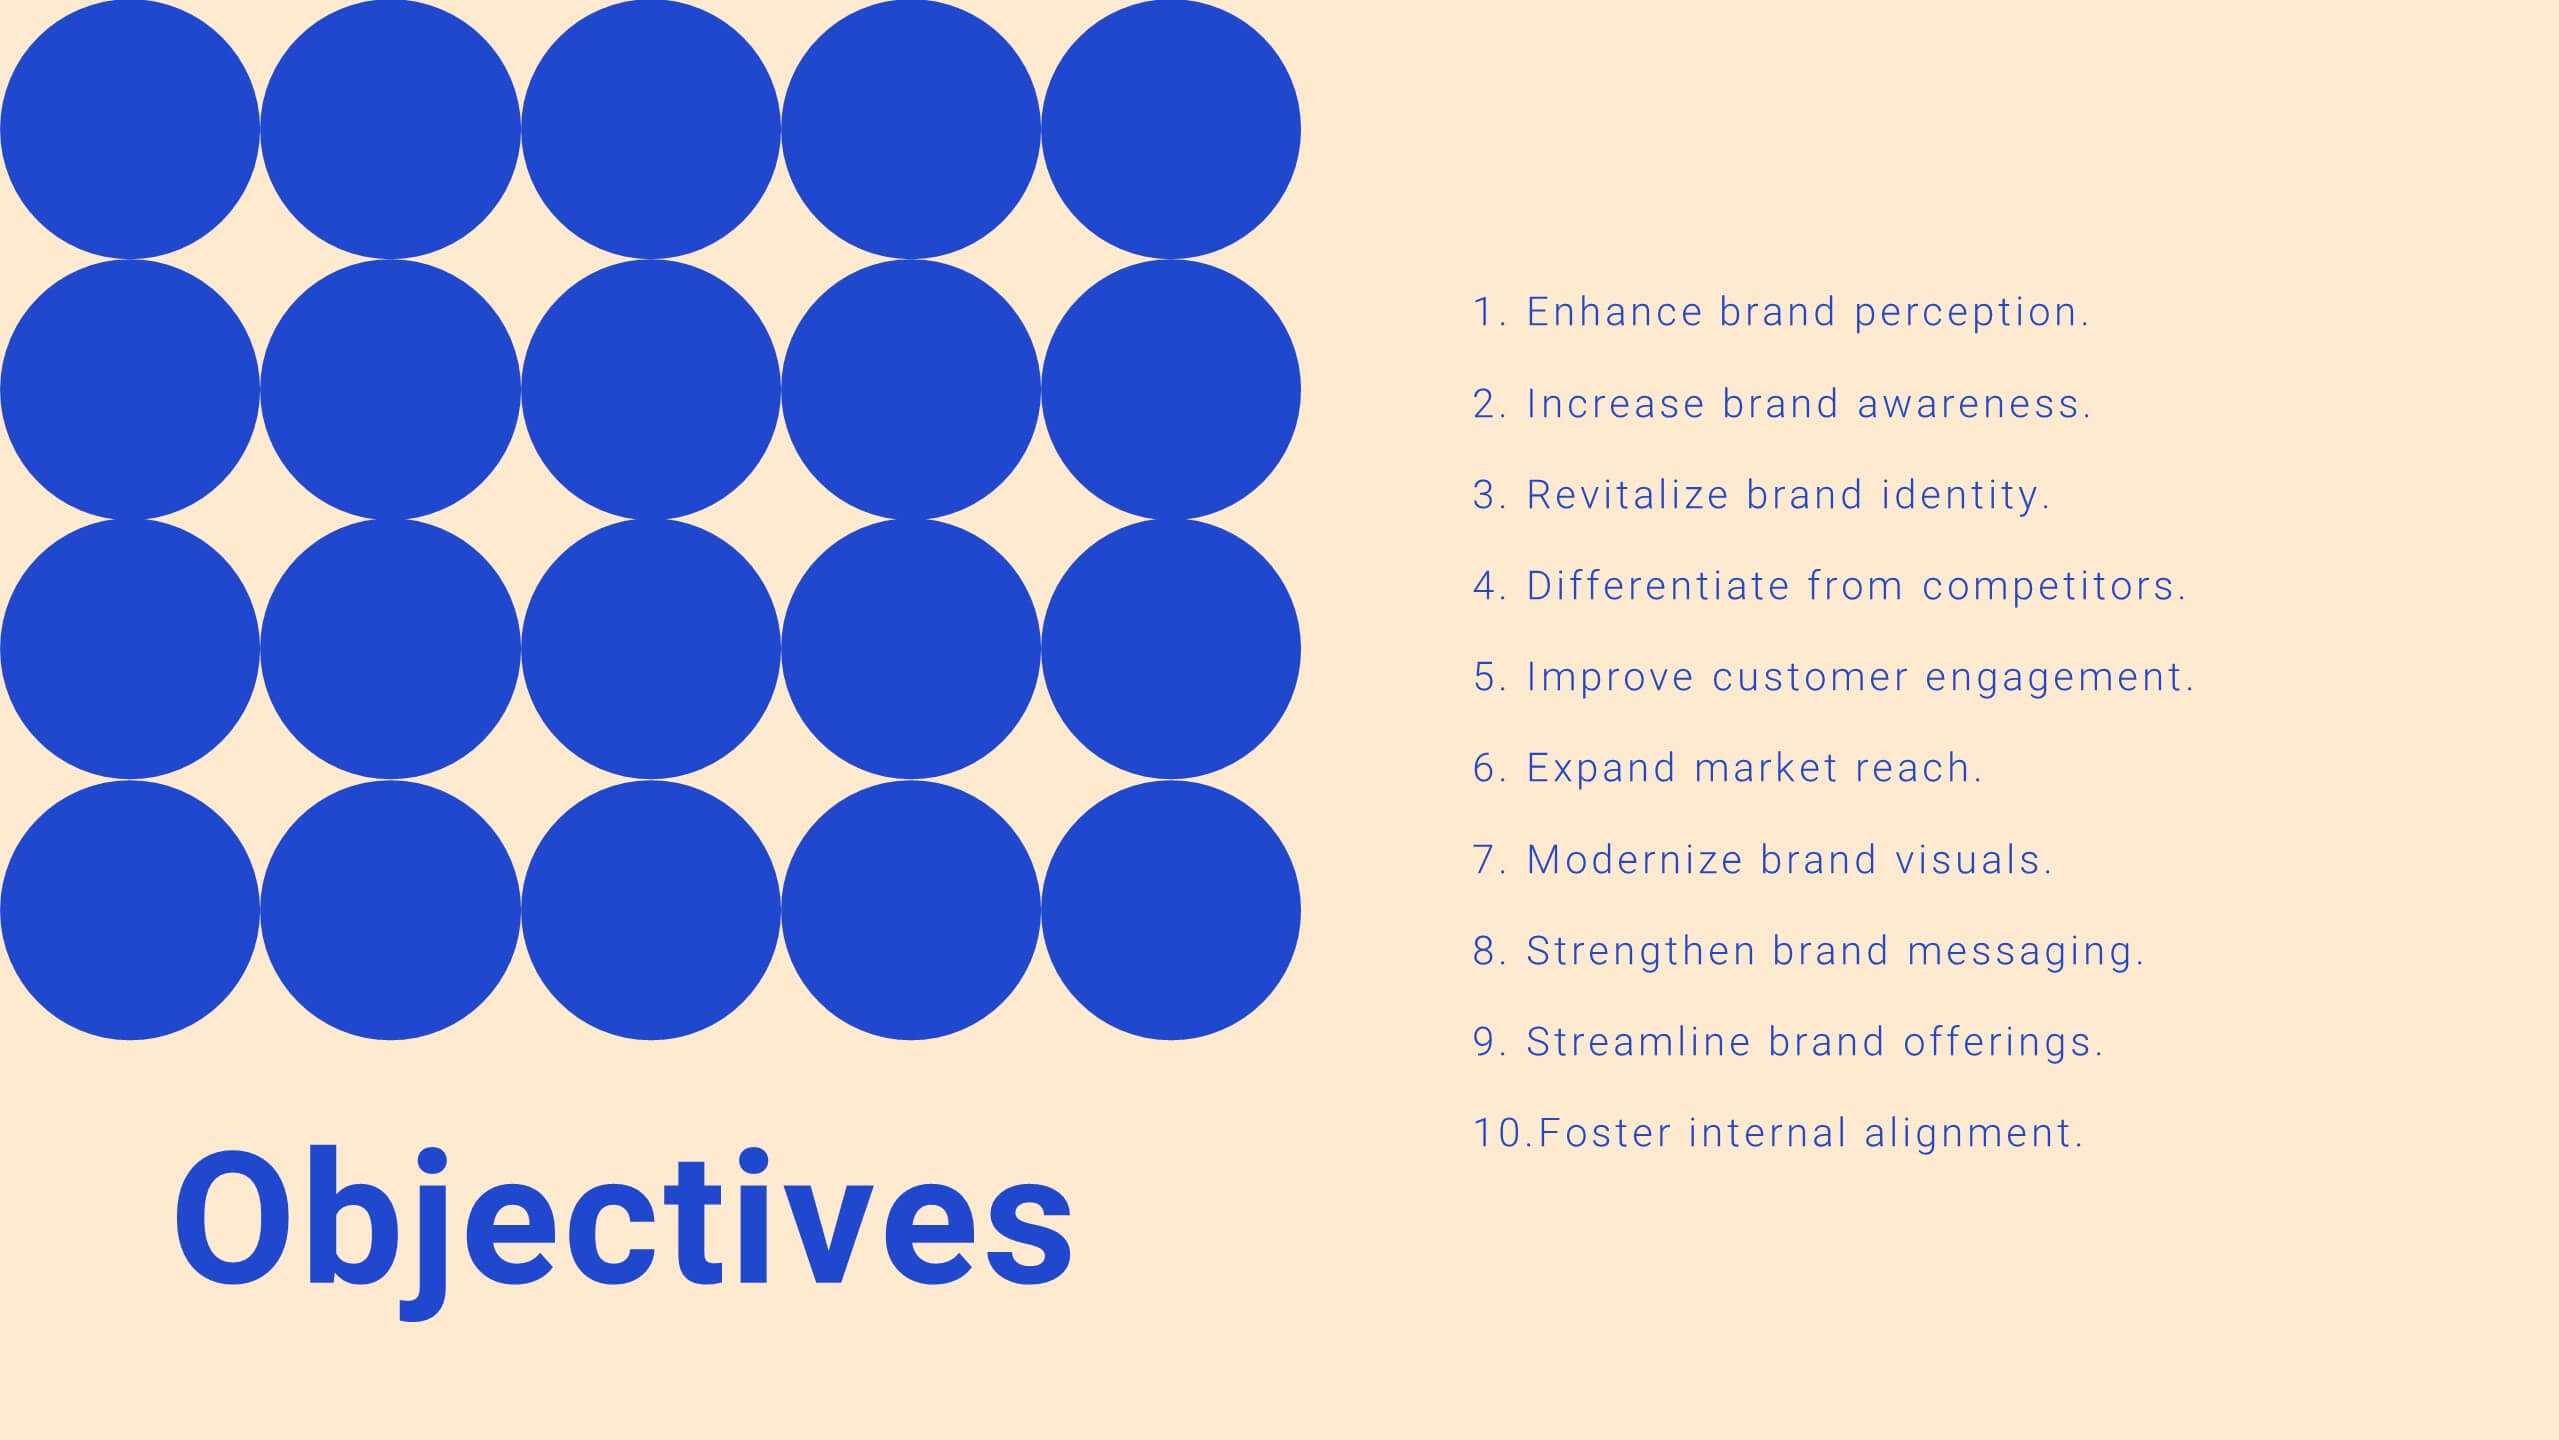
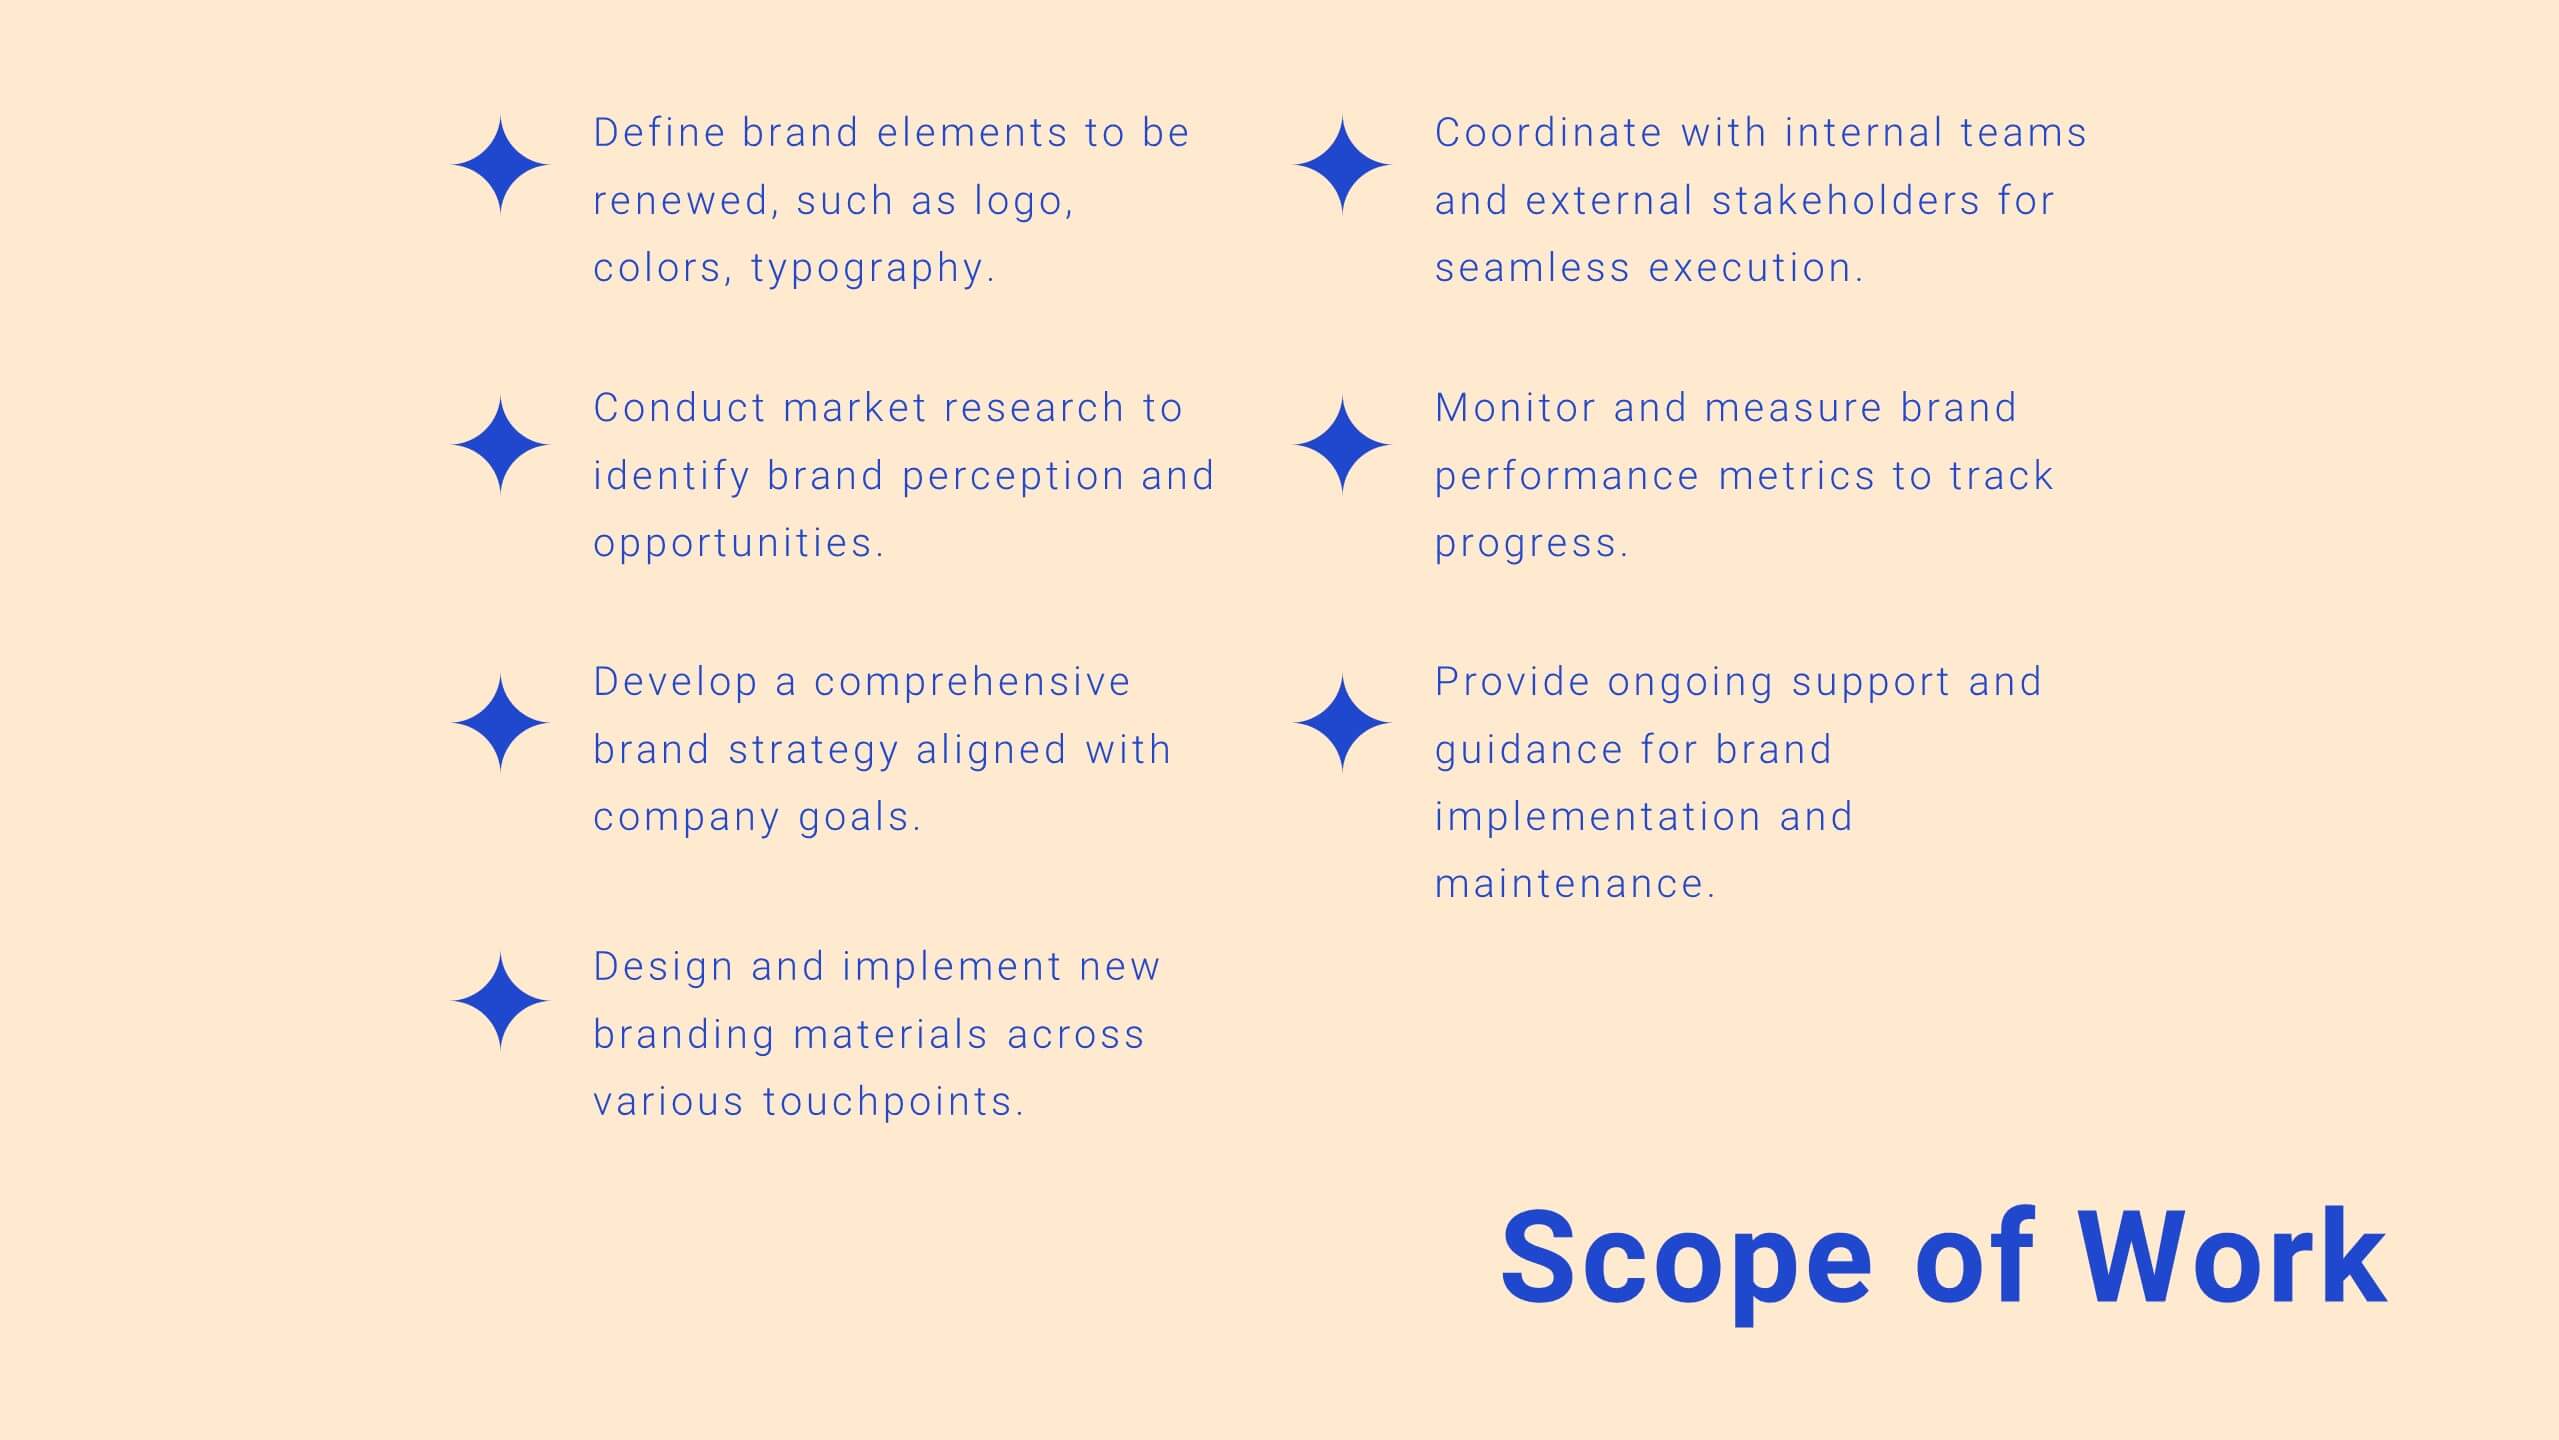
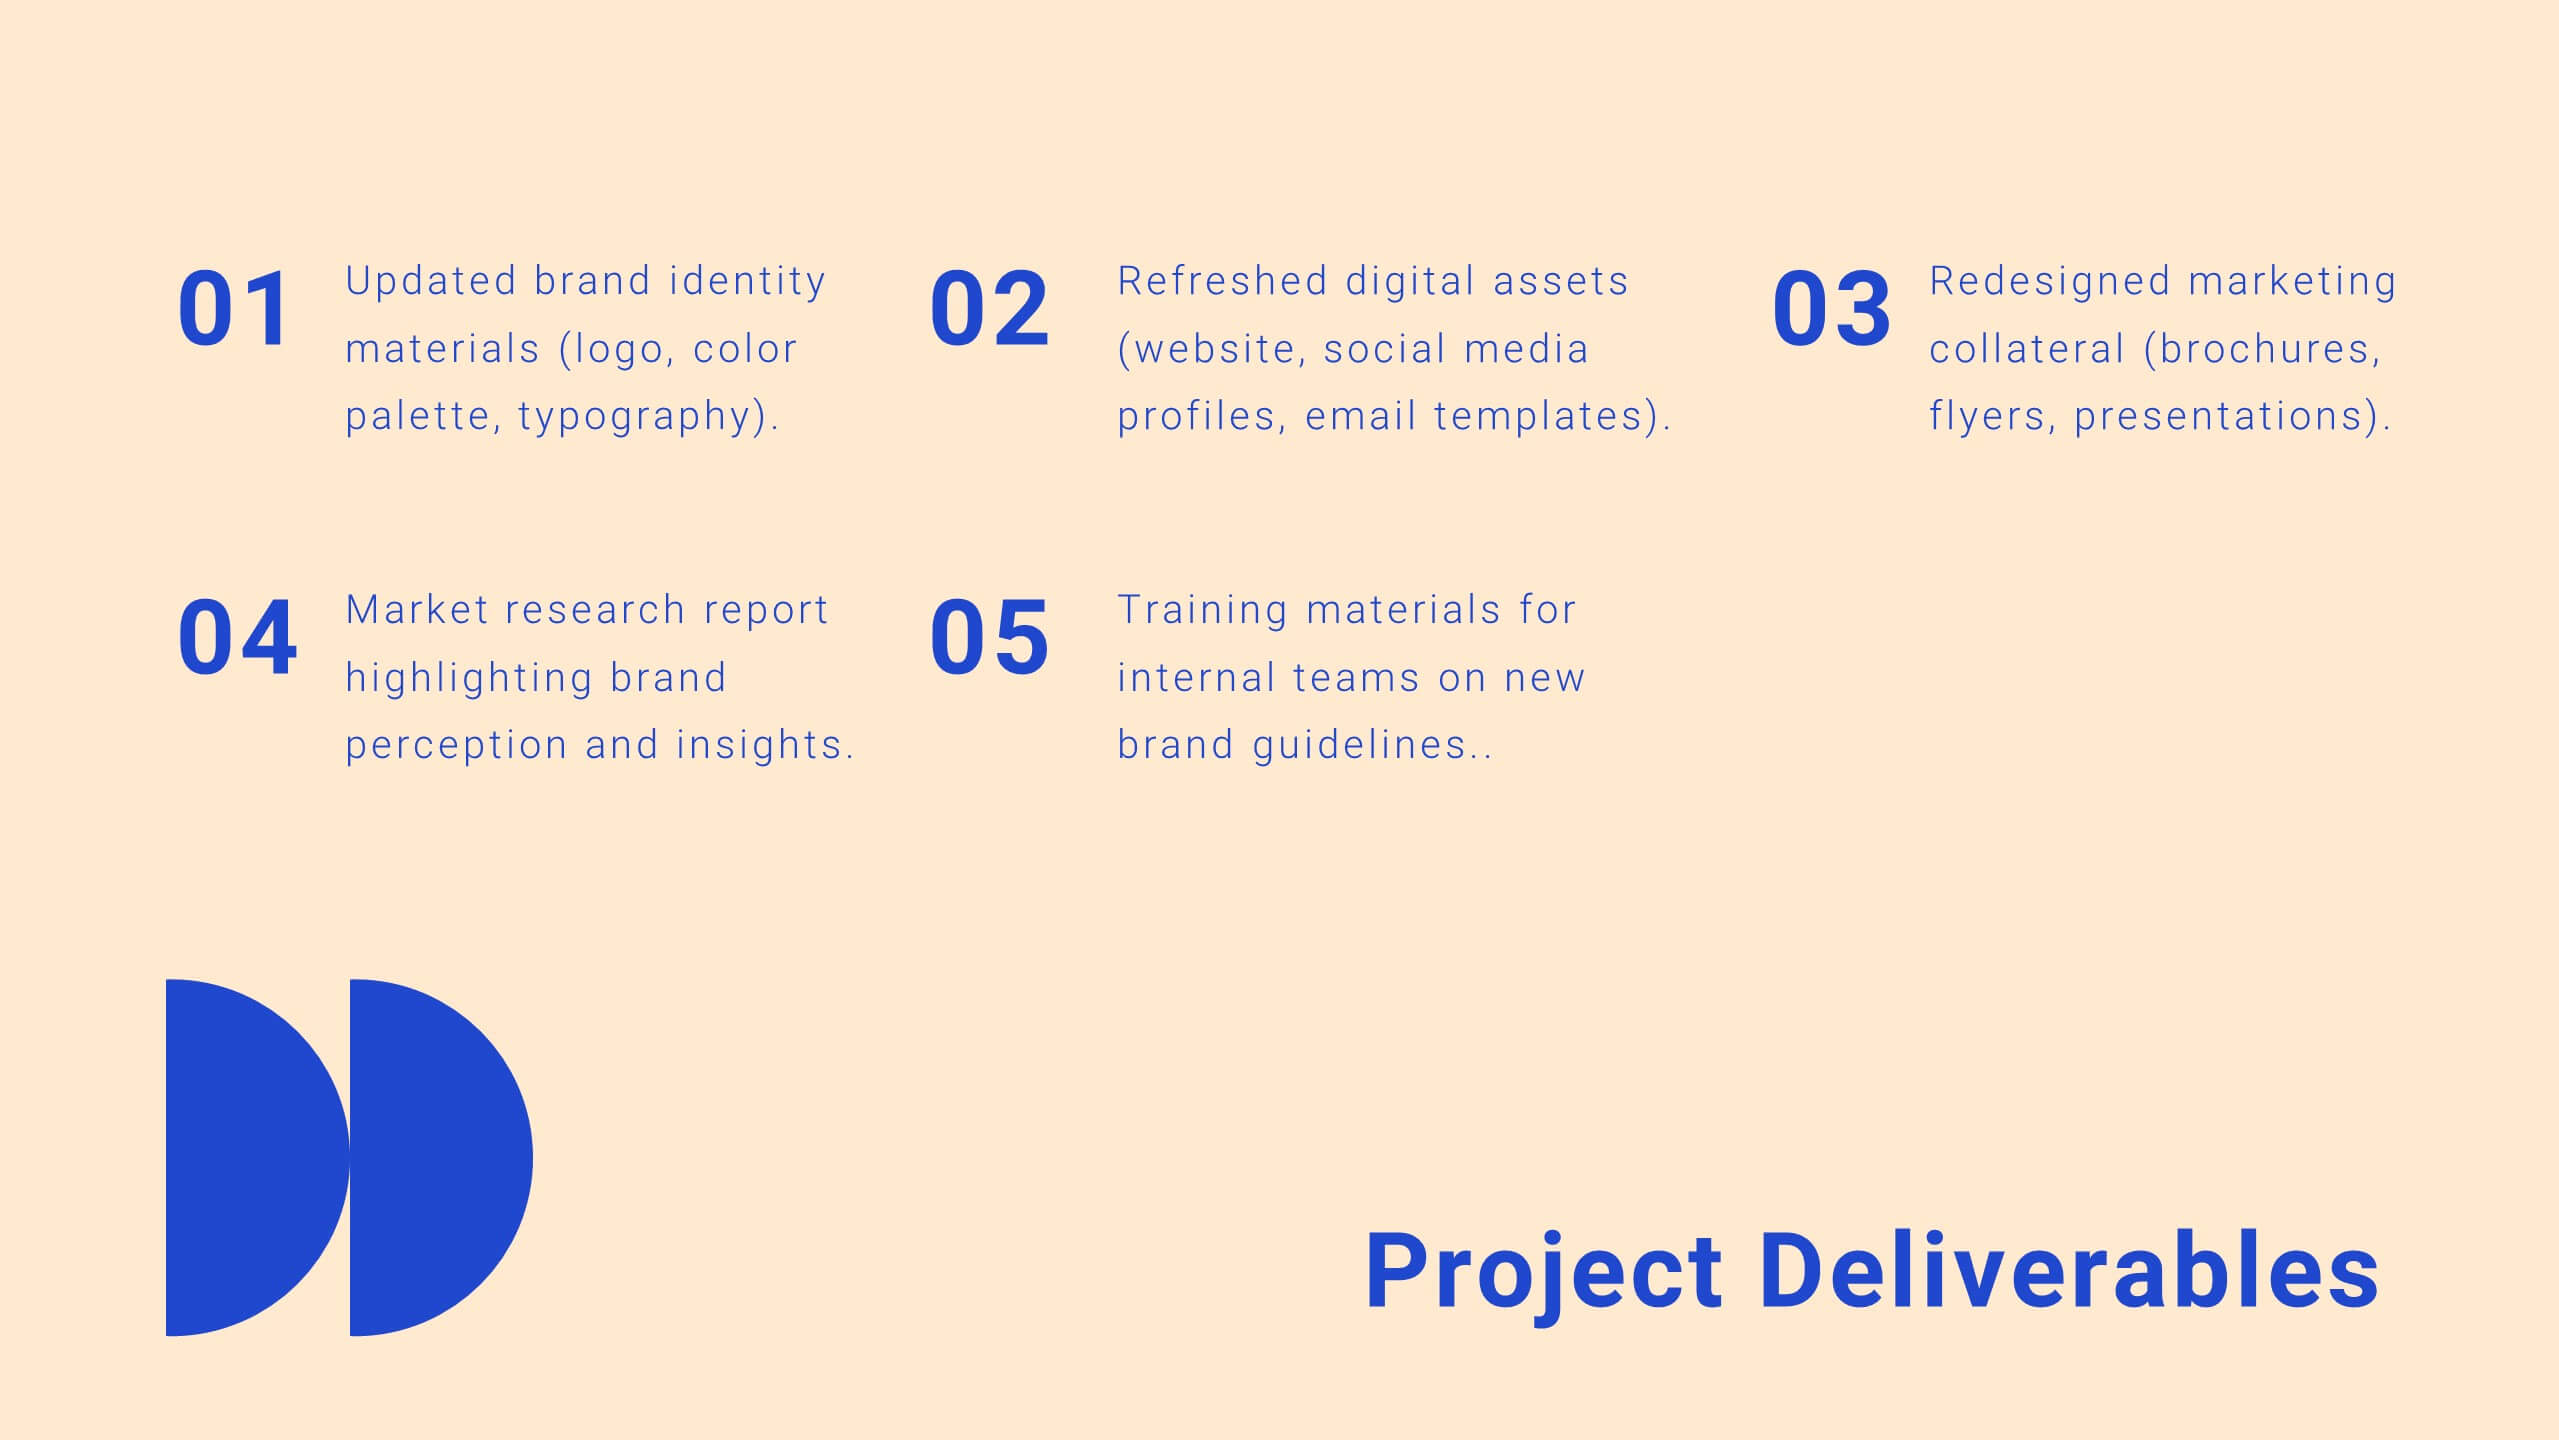
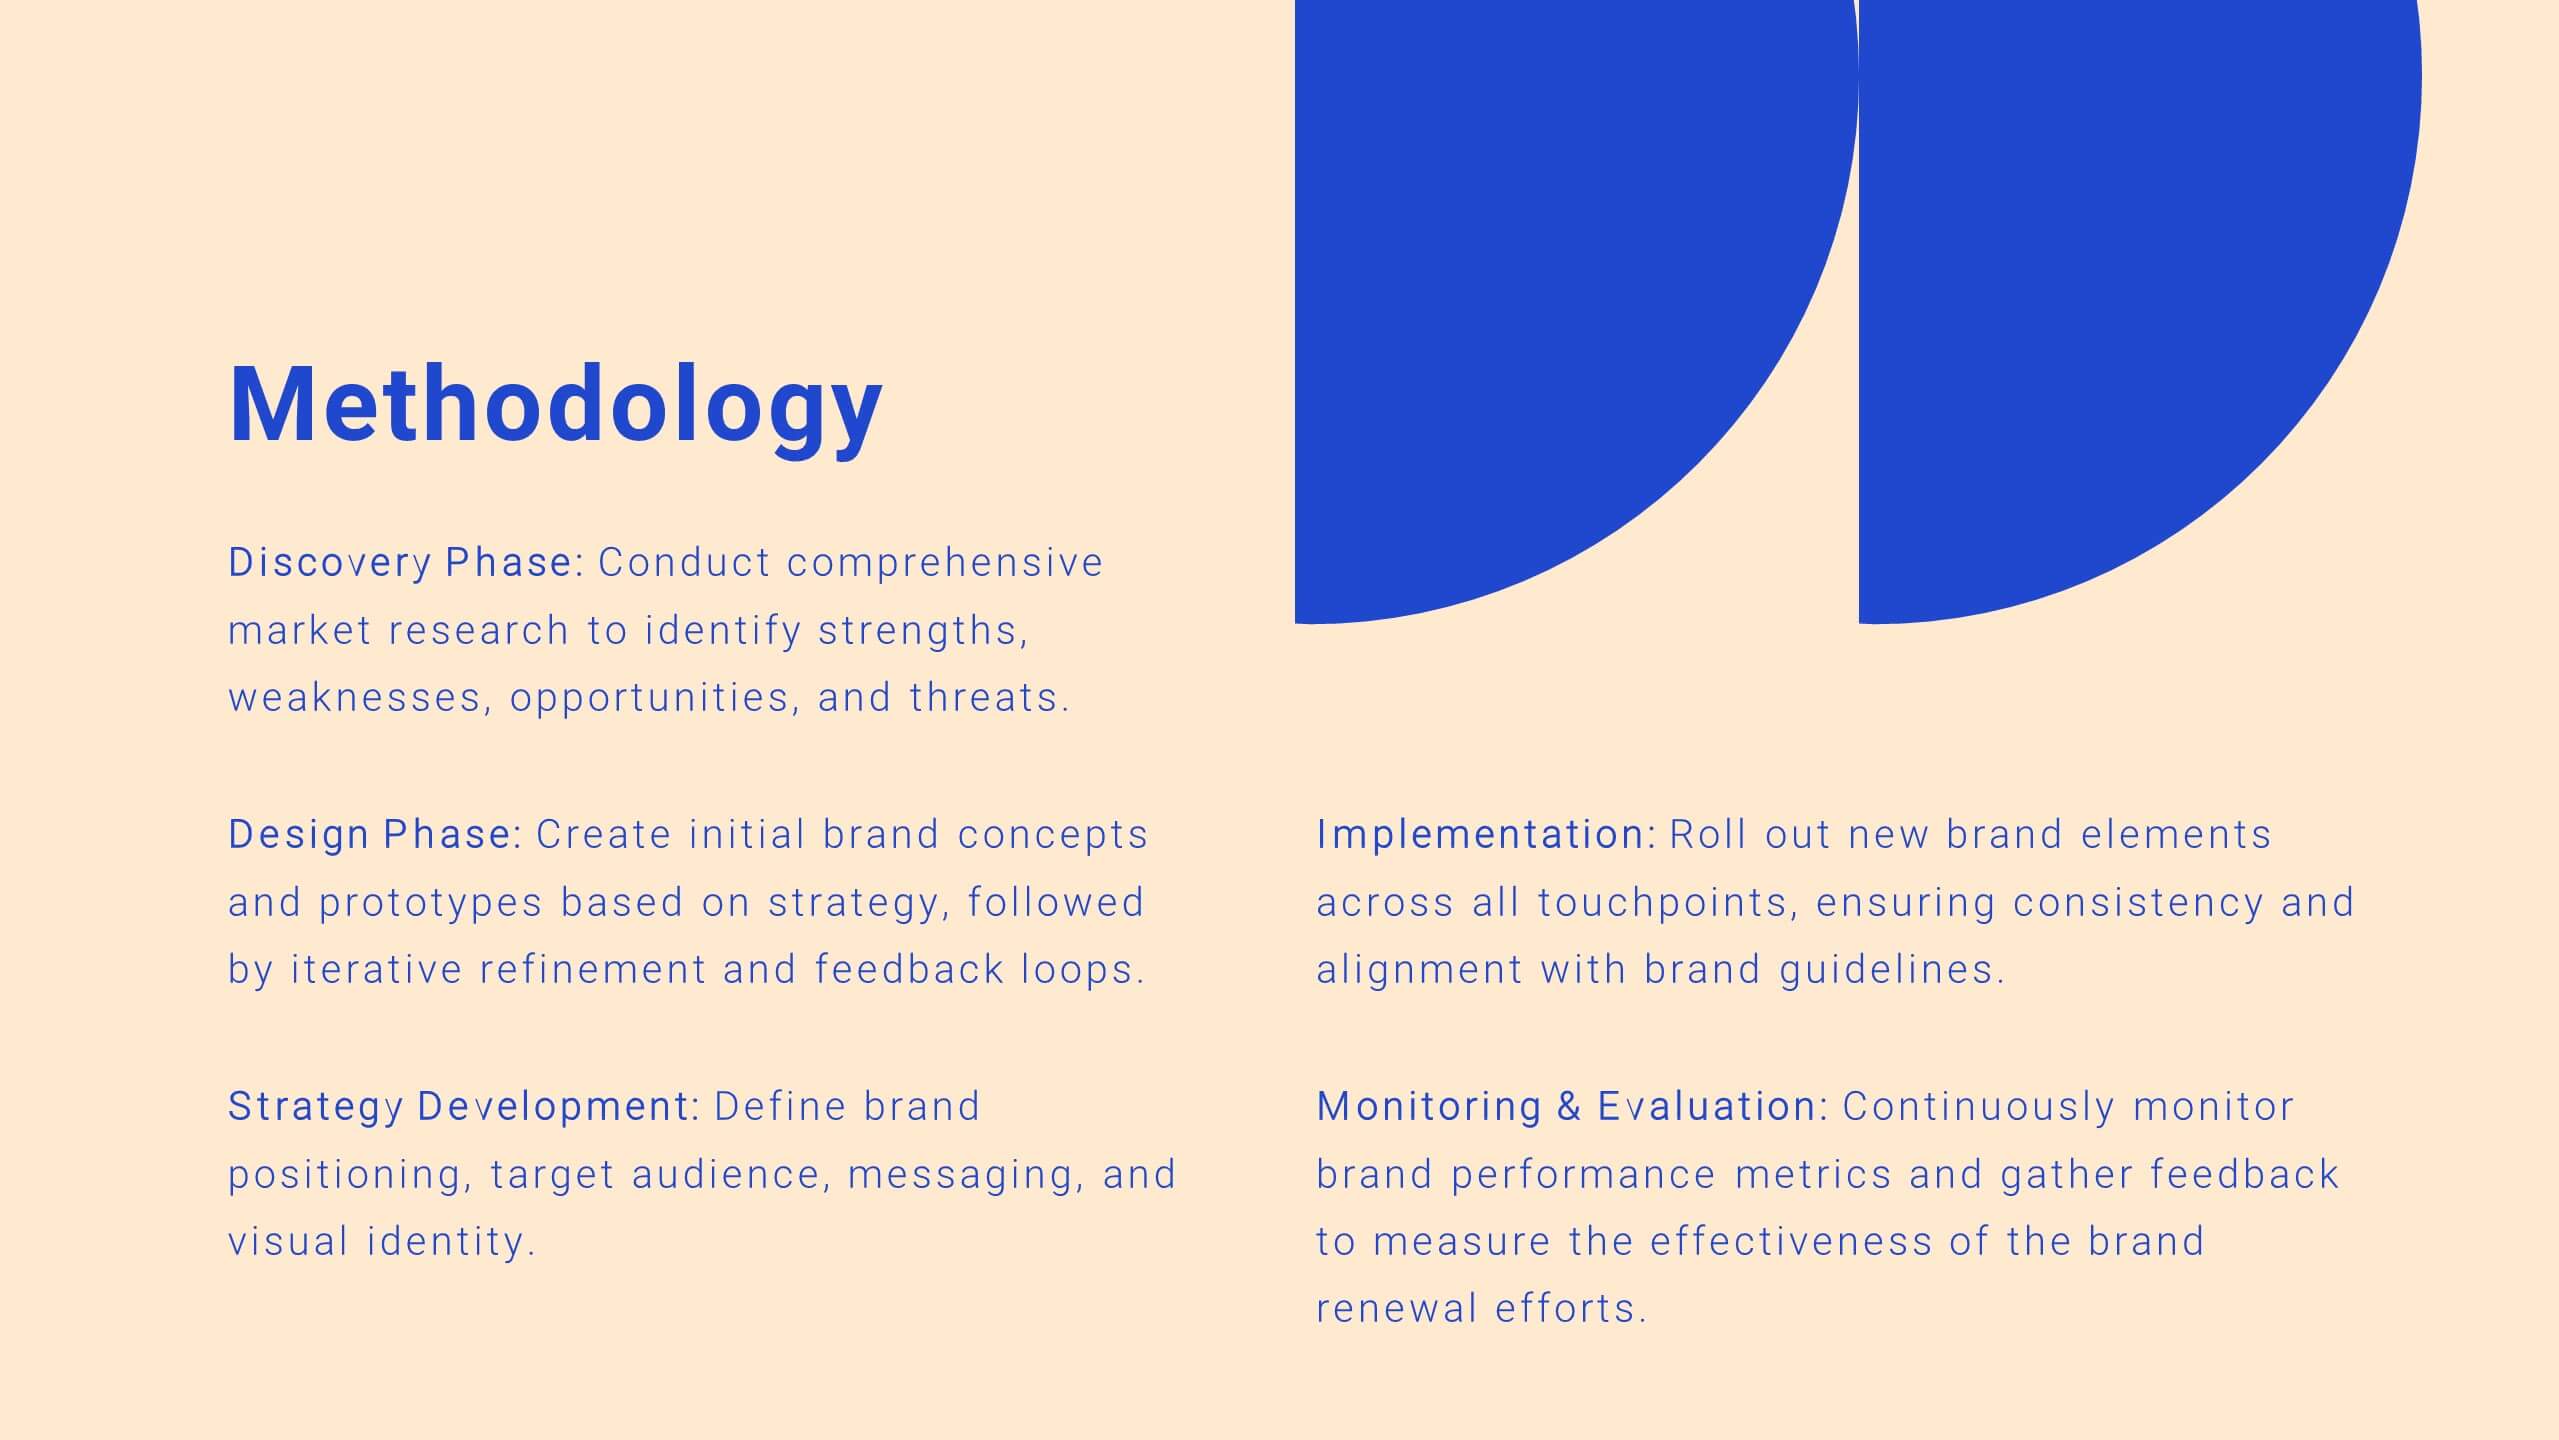
Drift Agile Project Plan Presentation
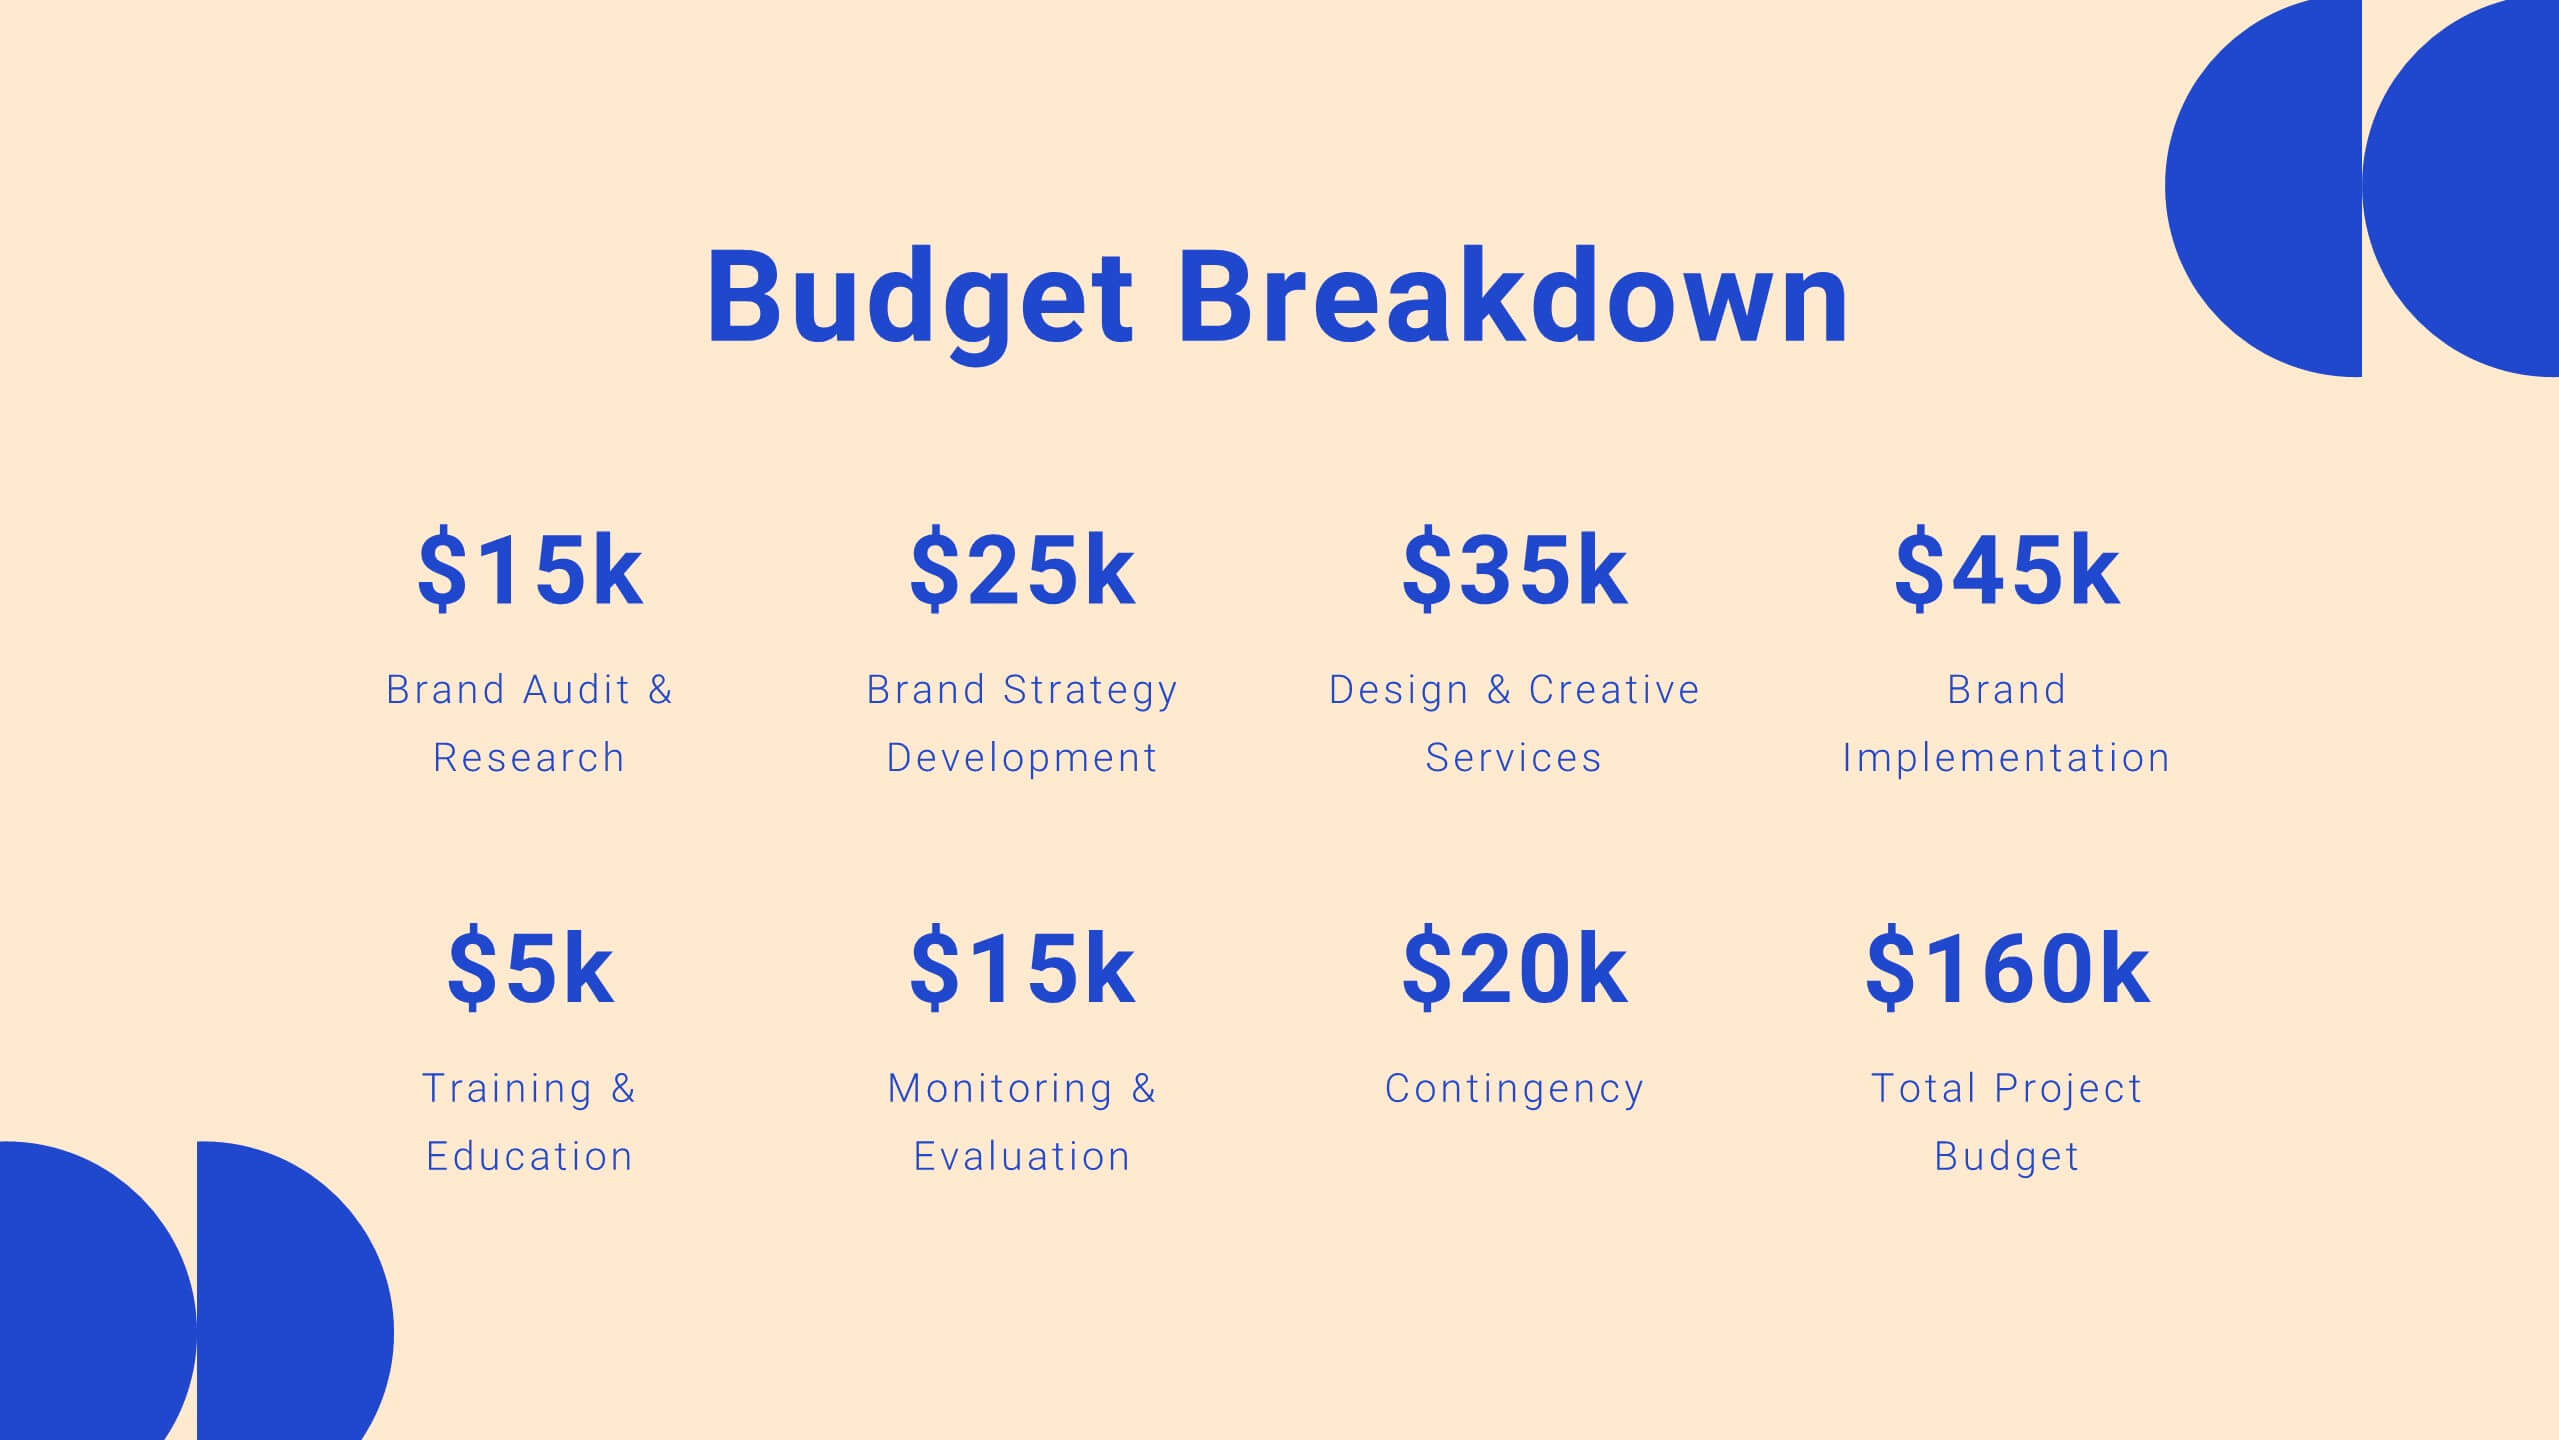
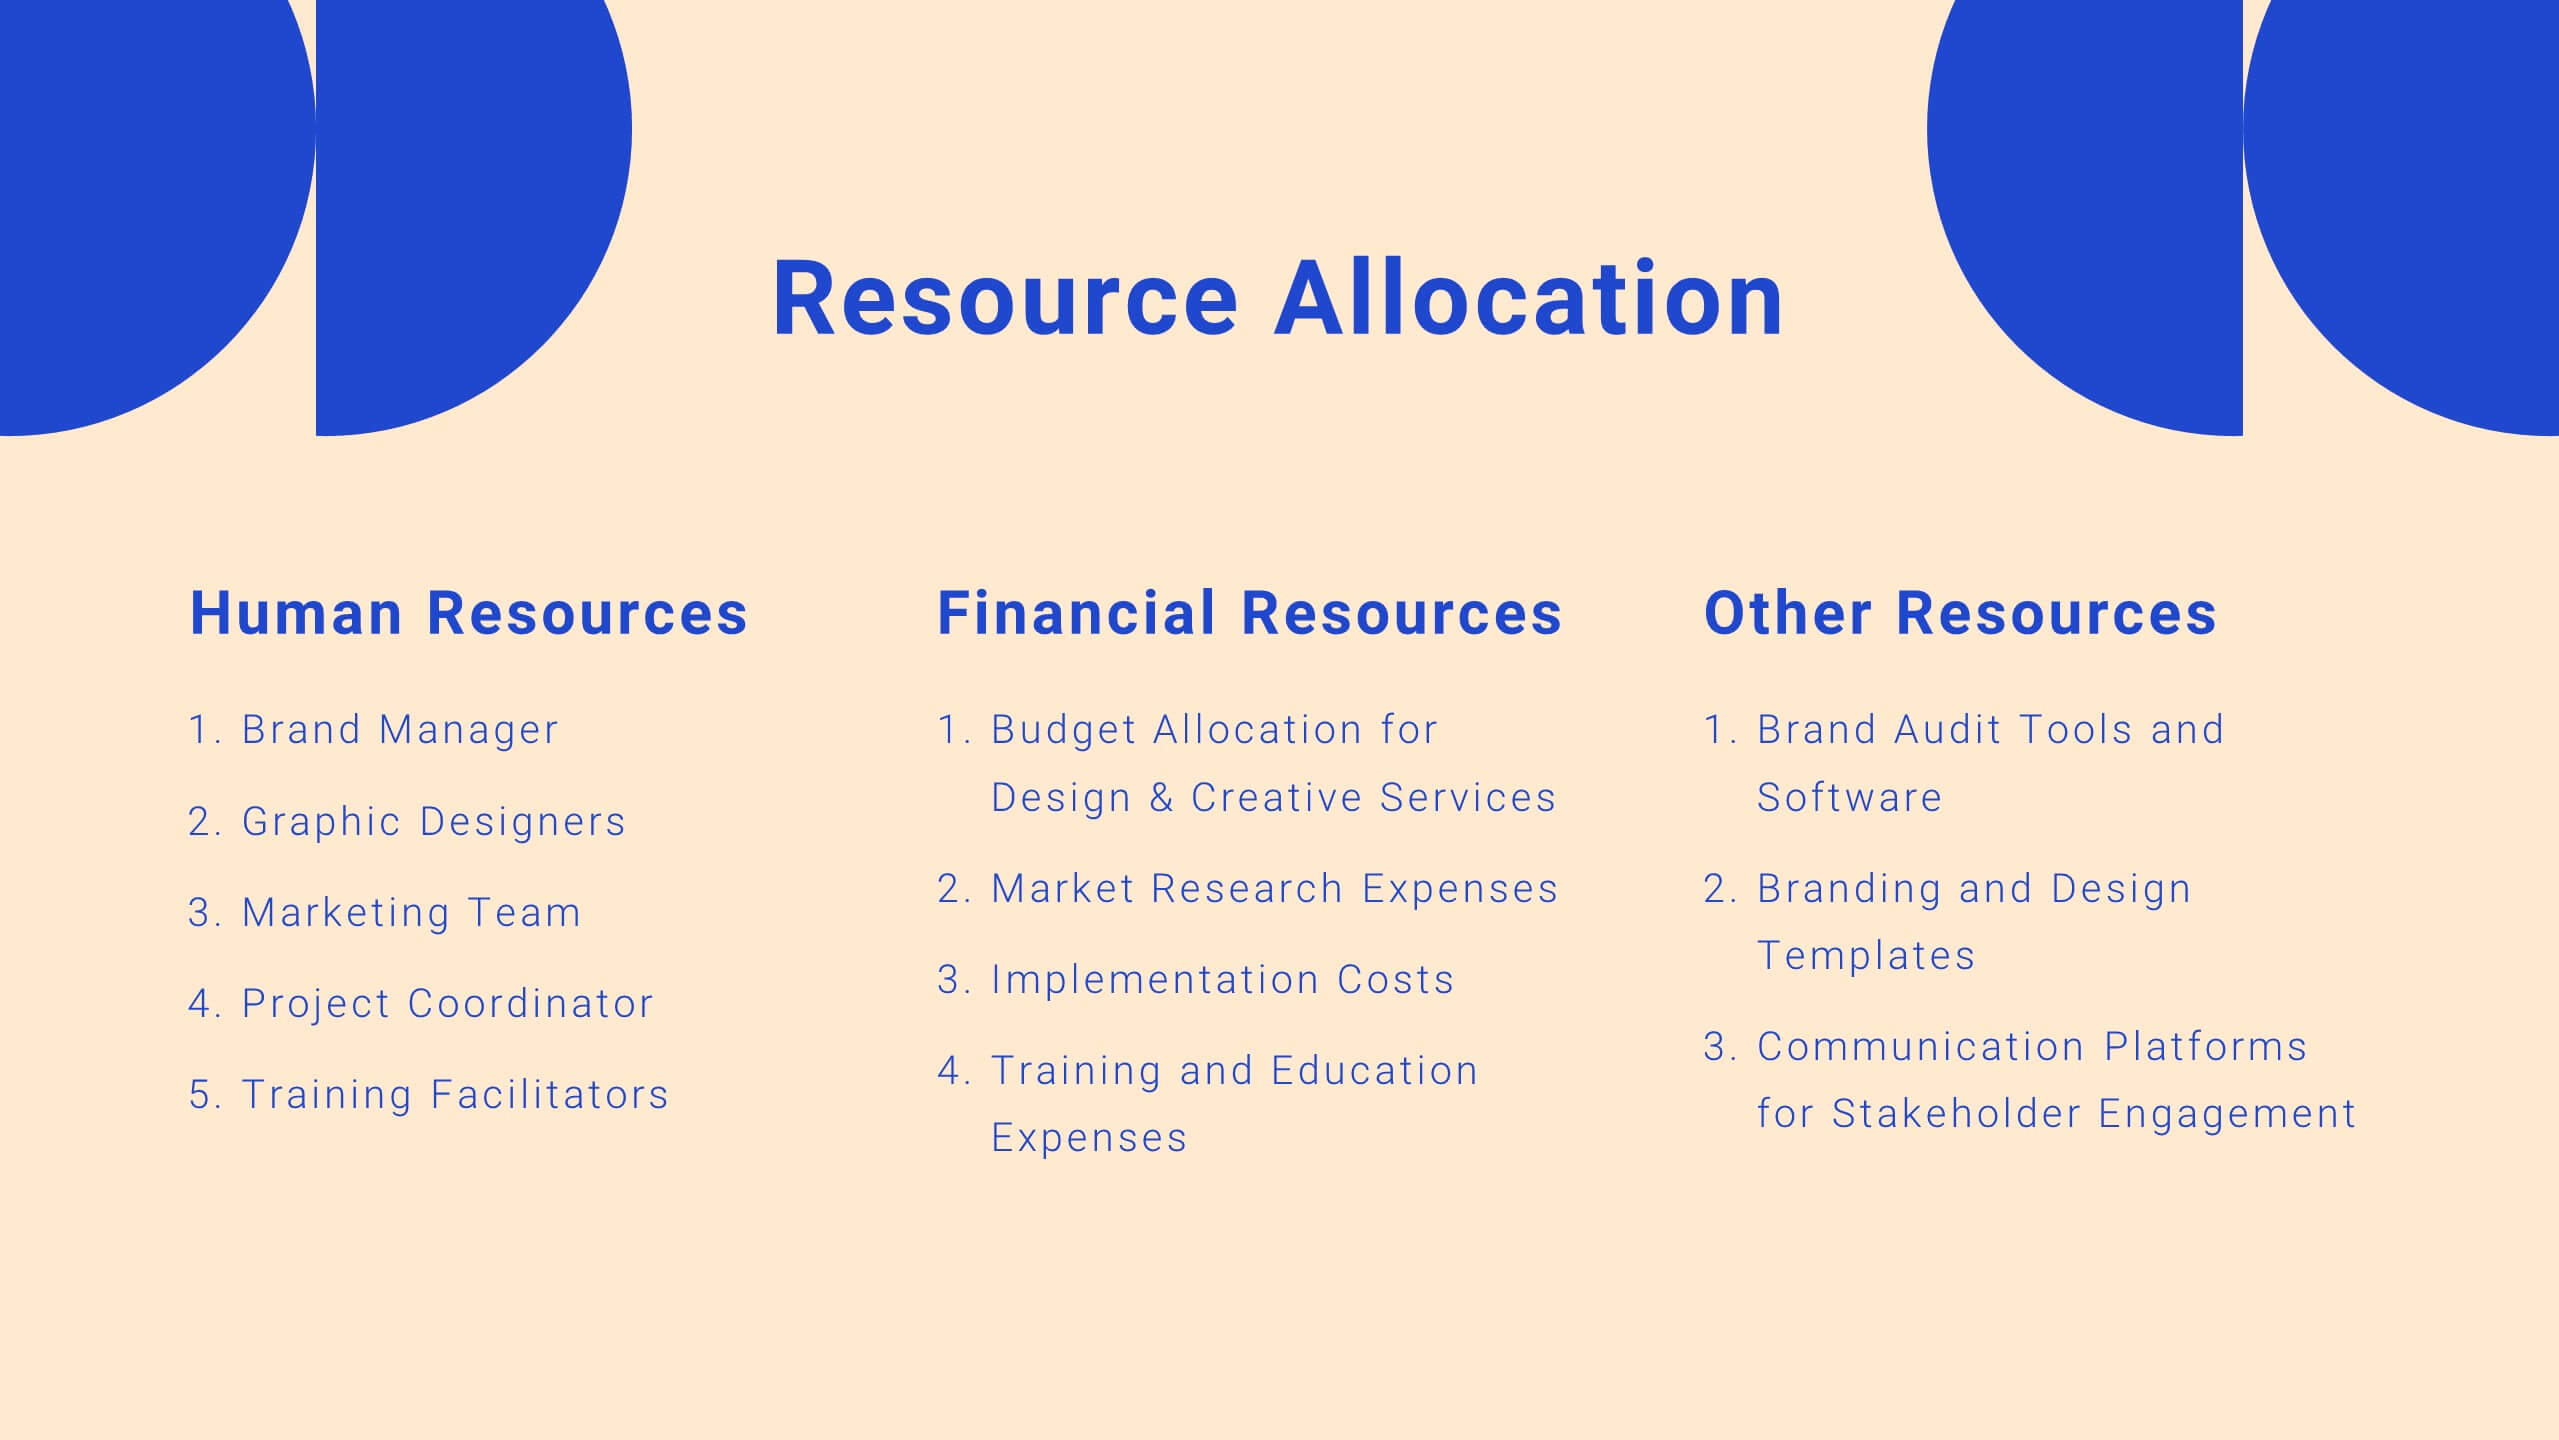
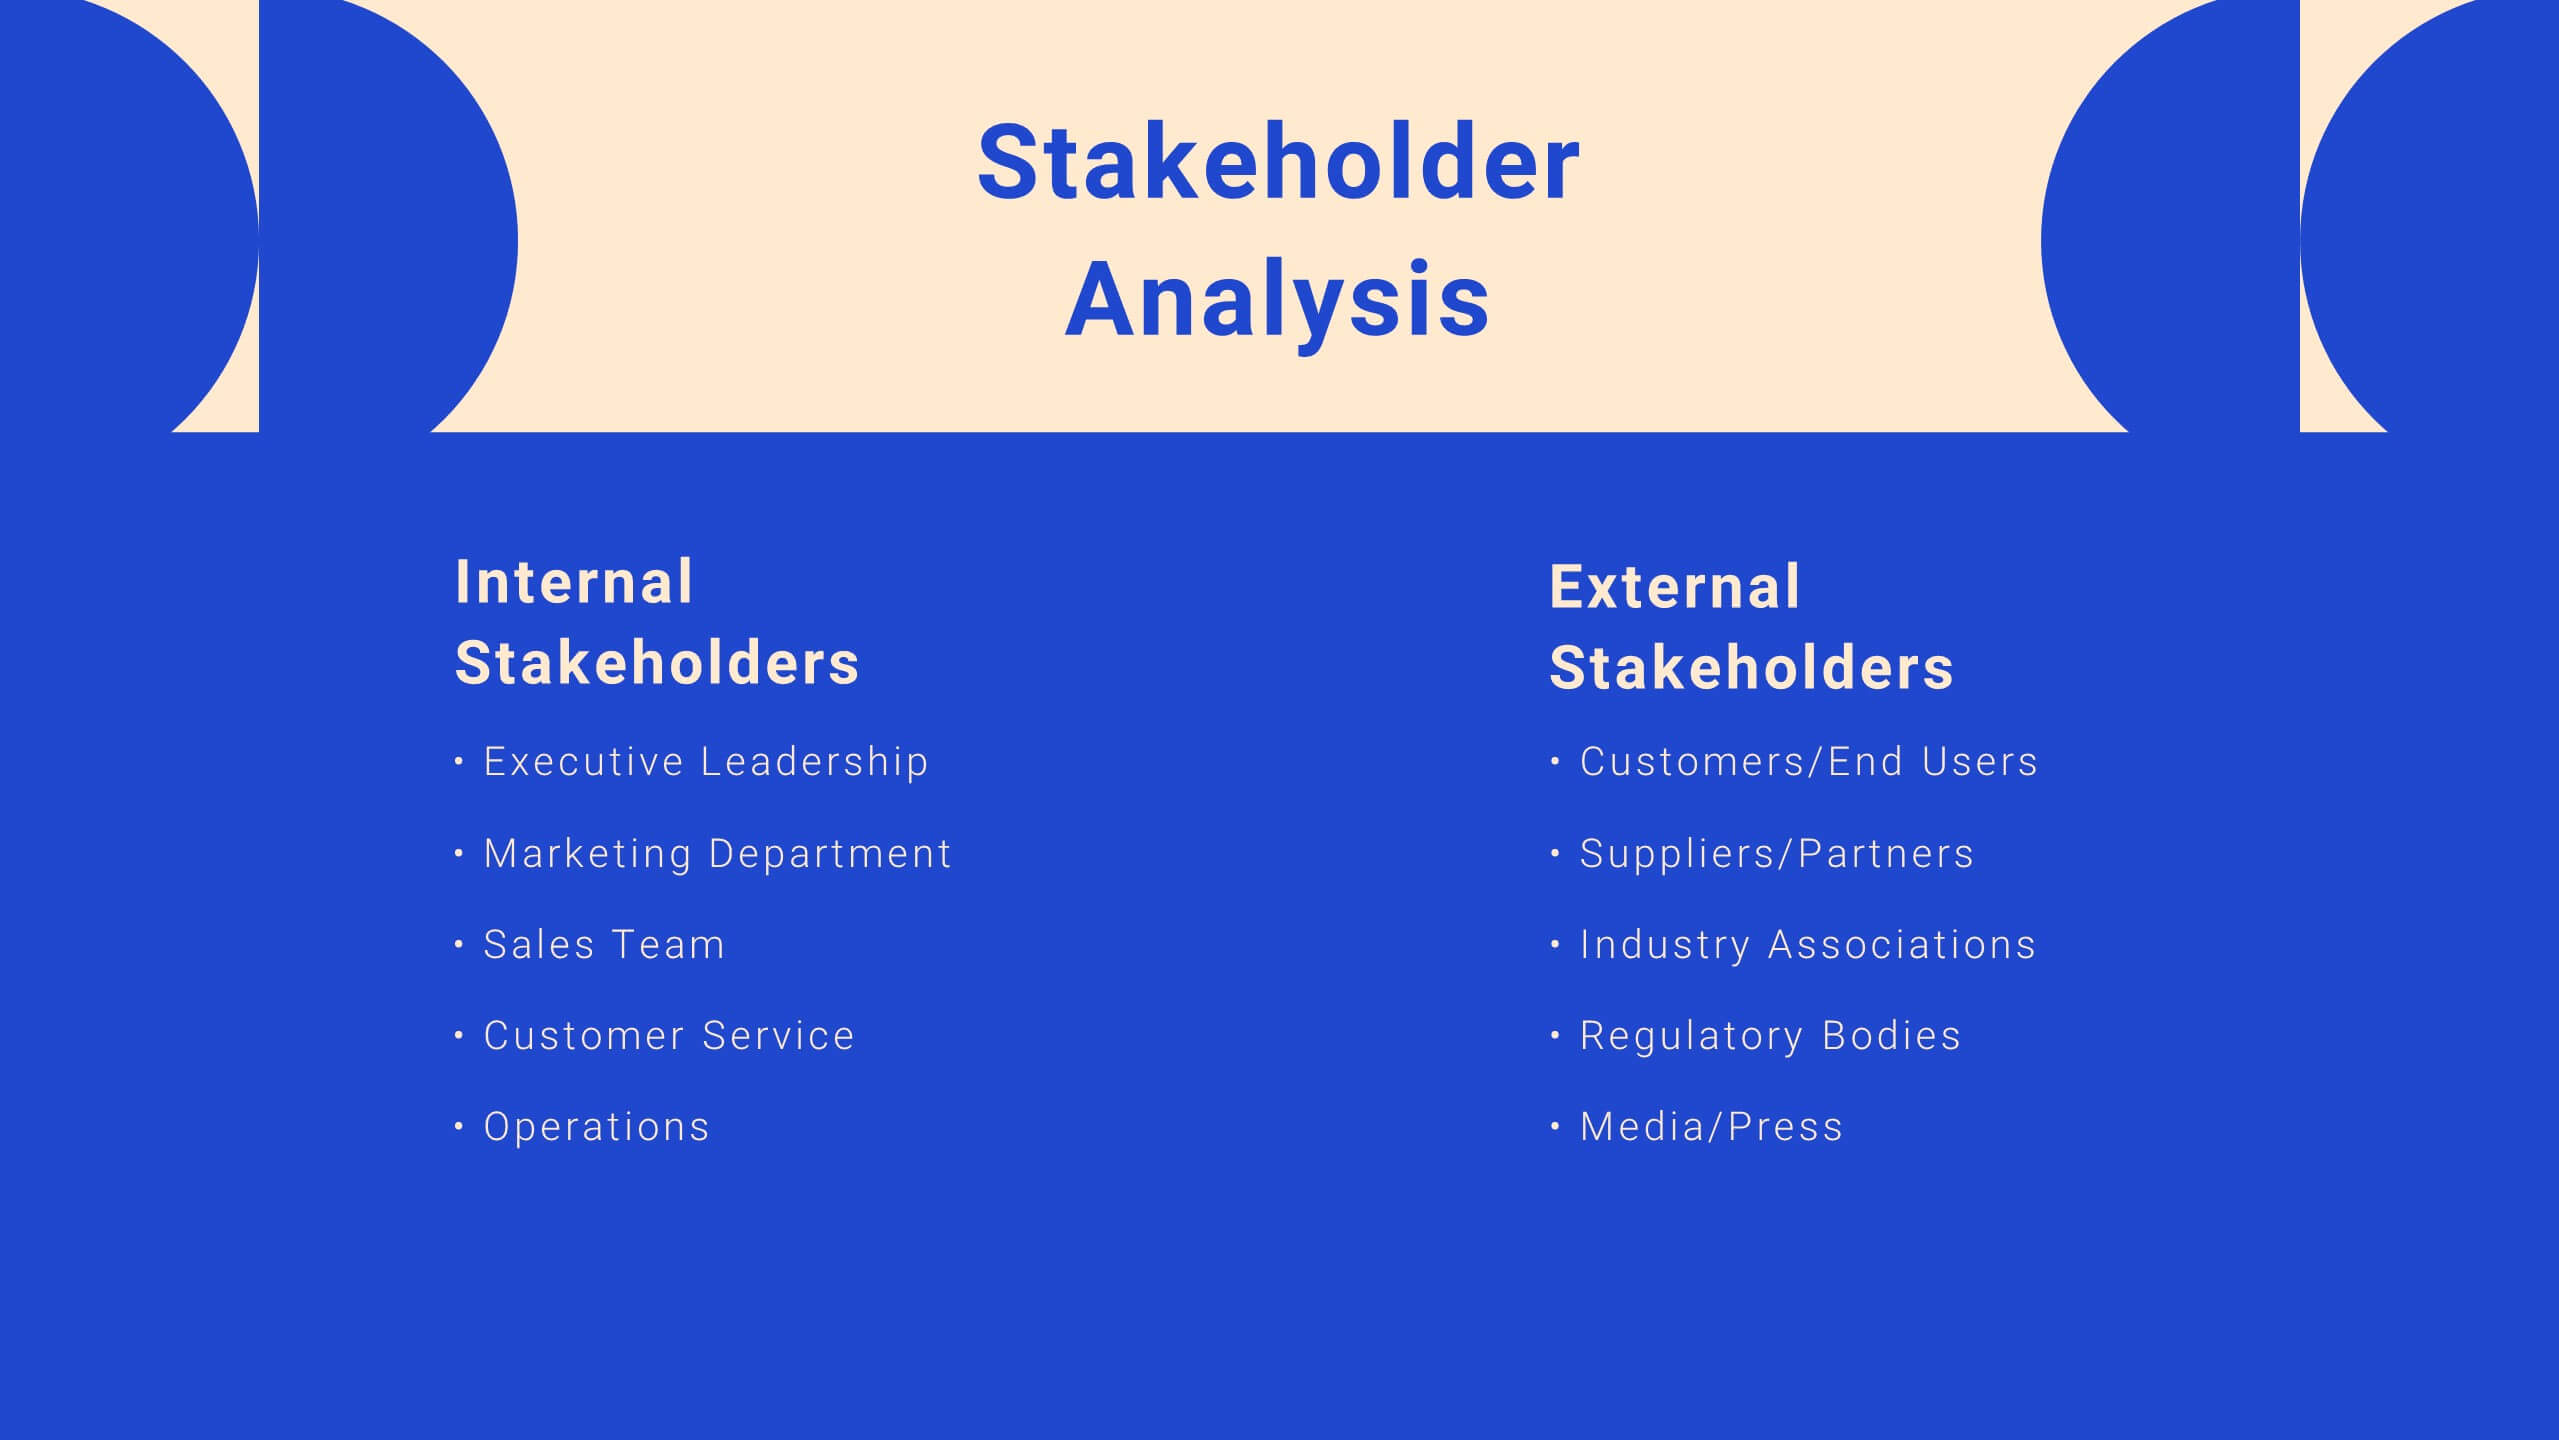
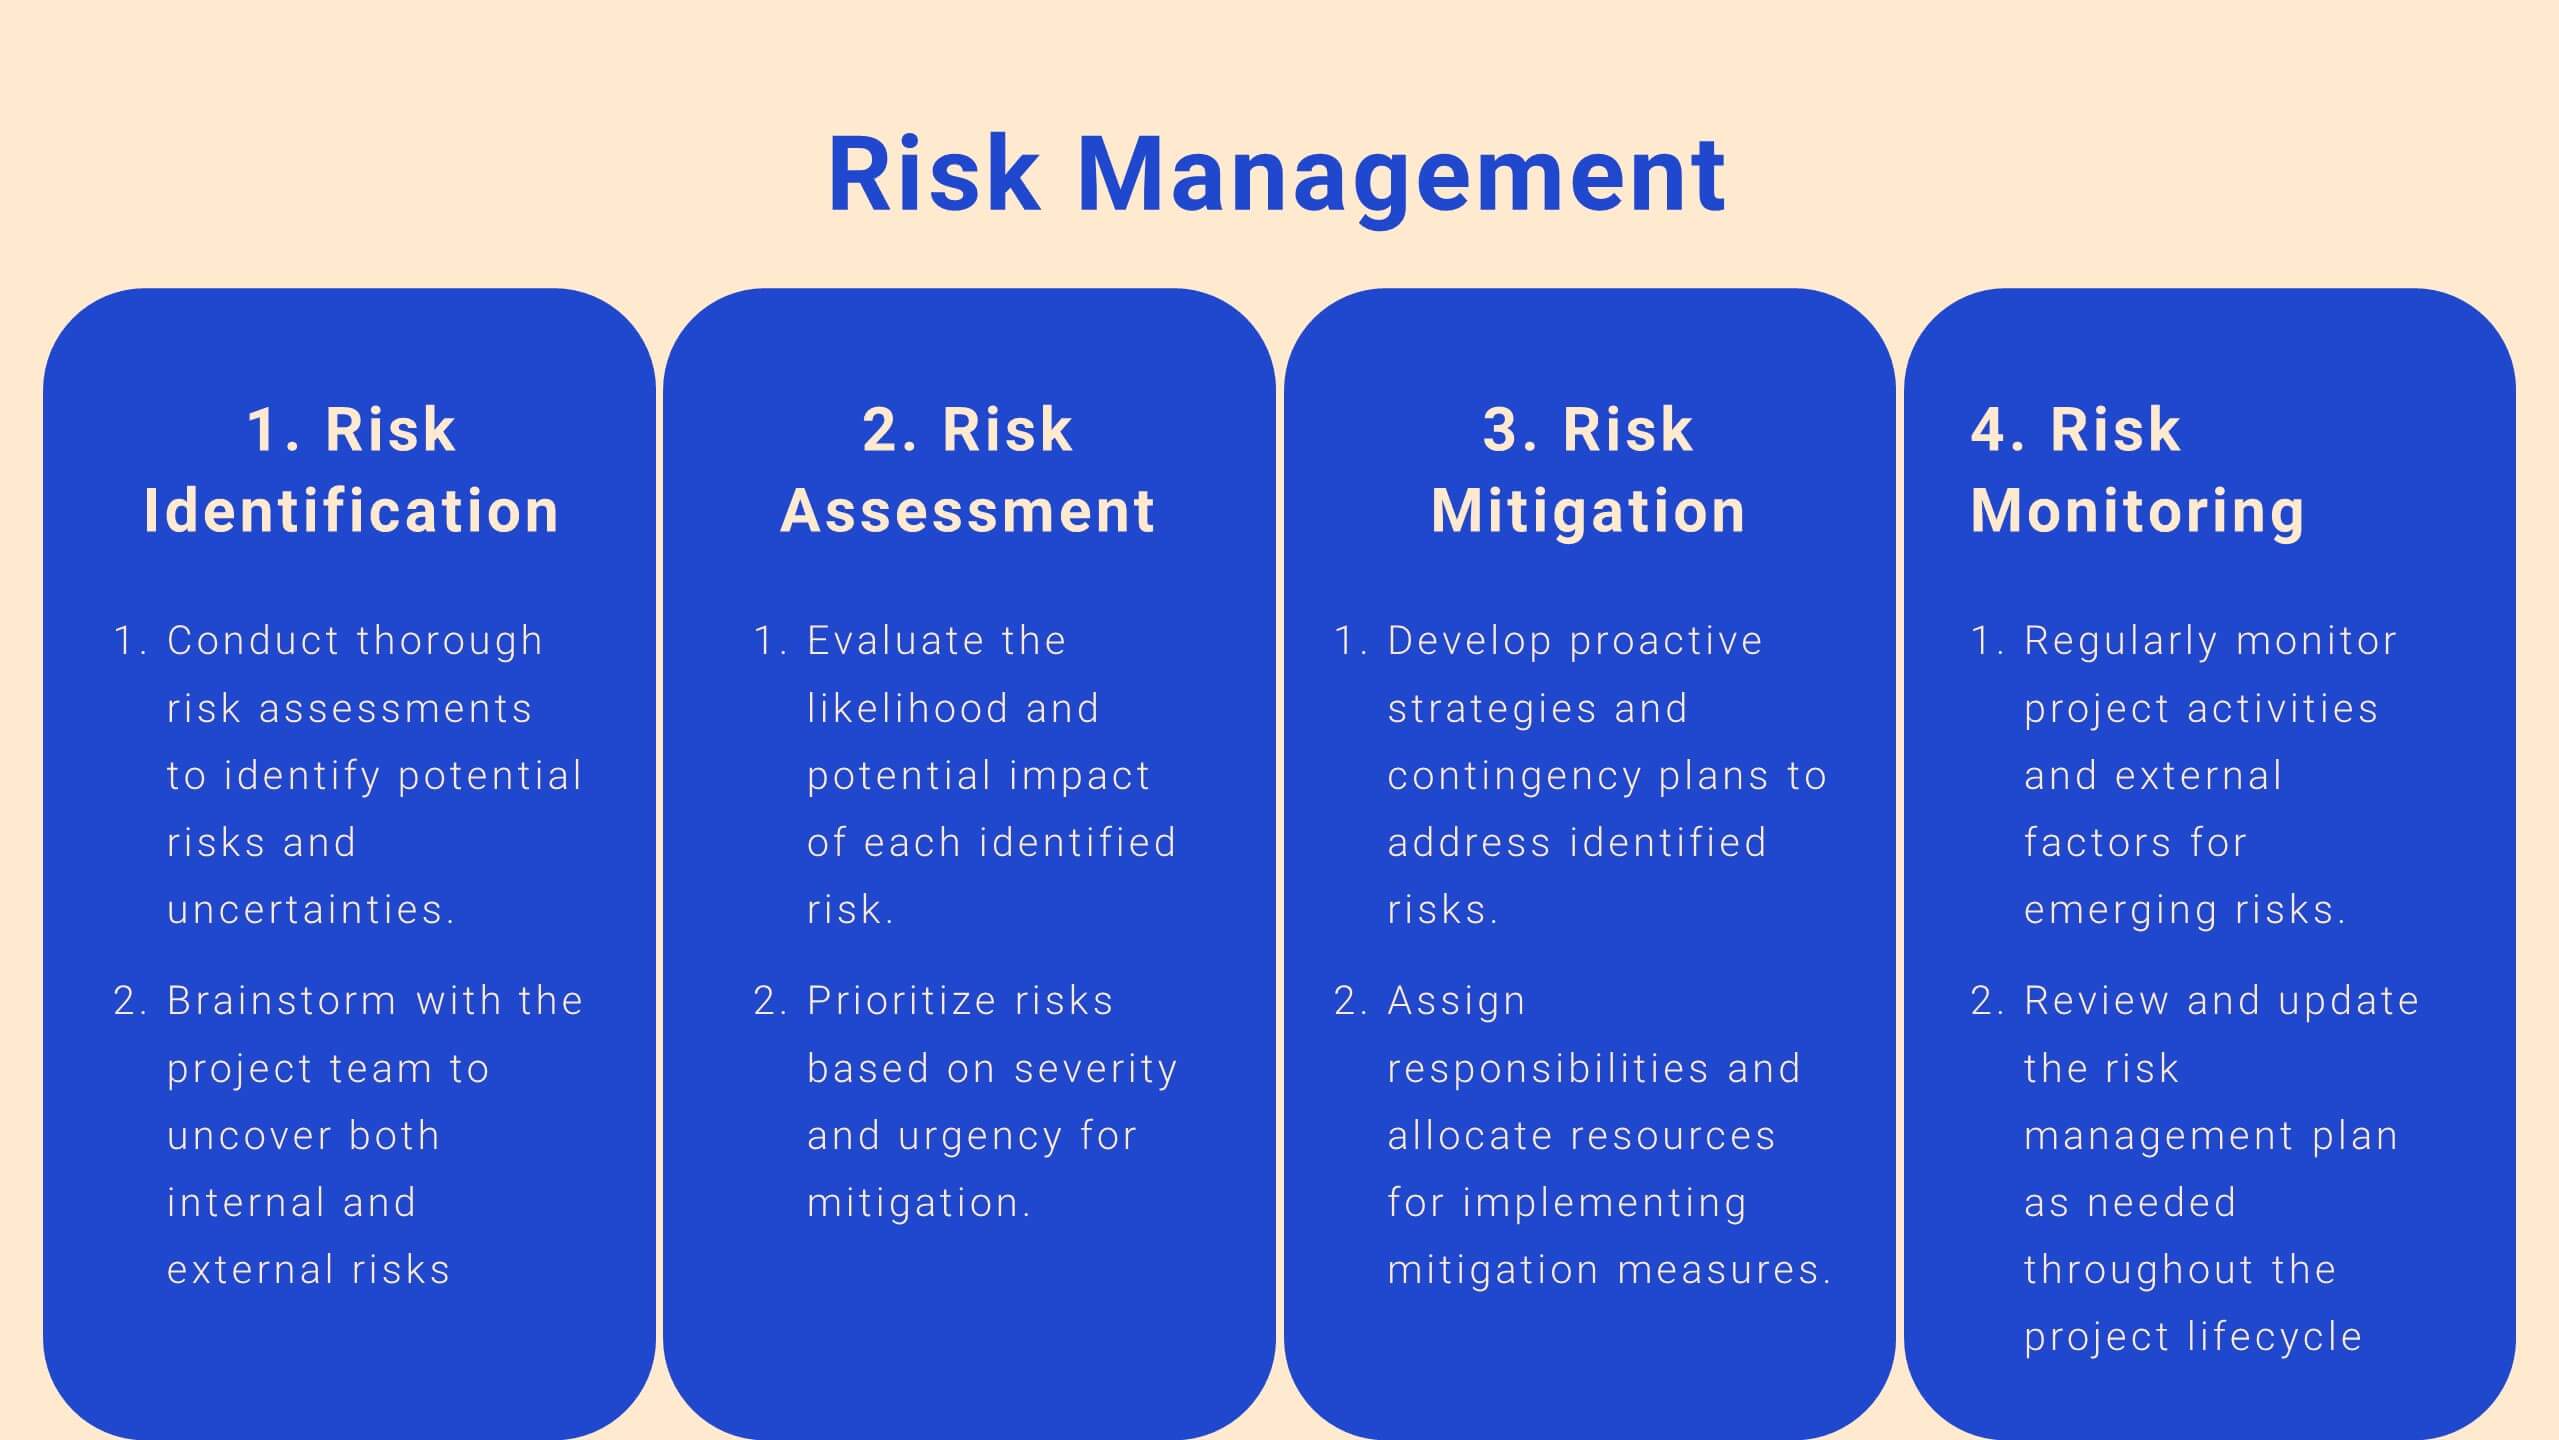
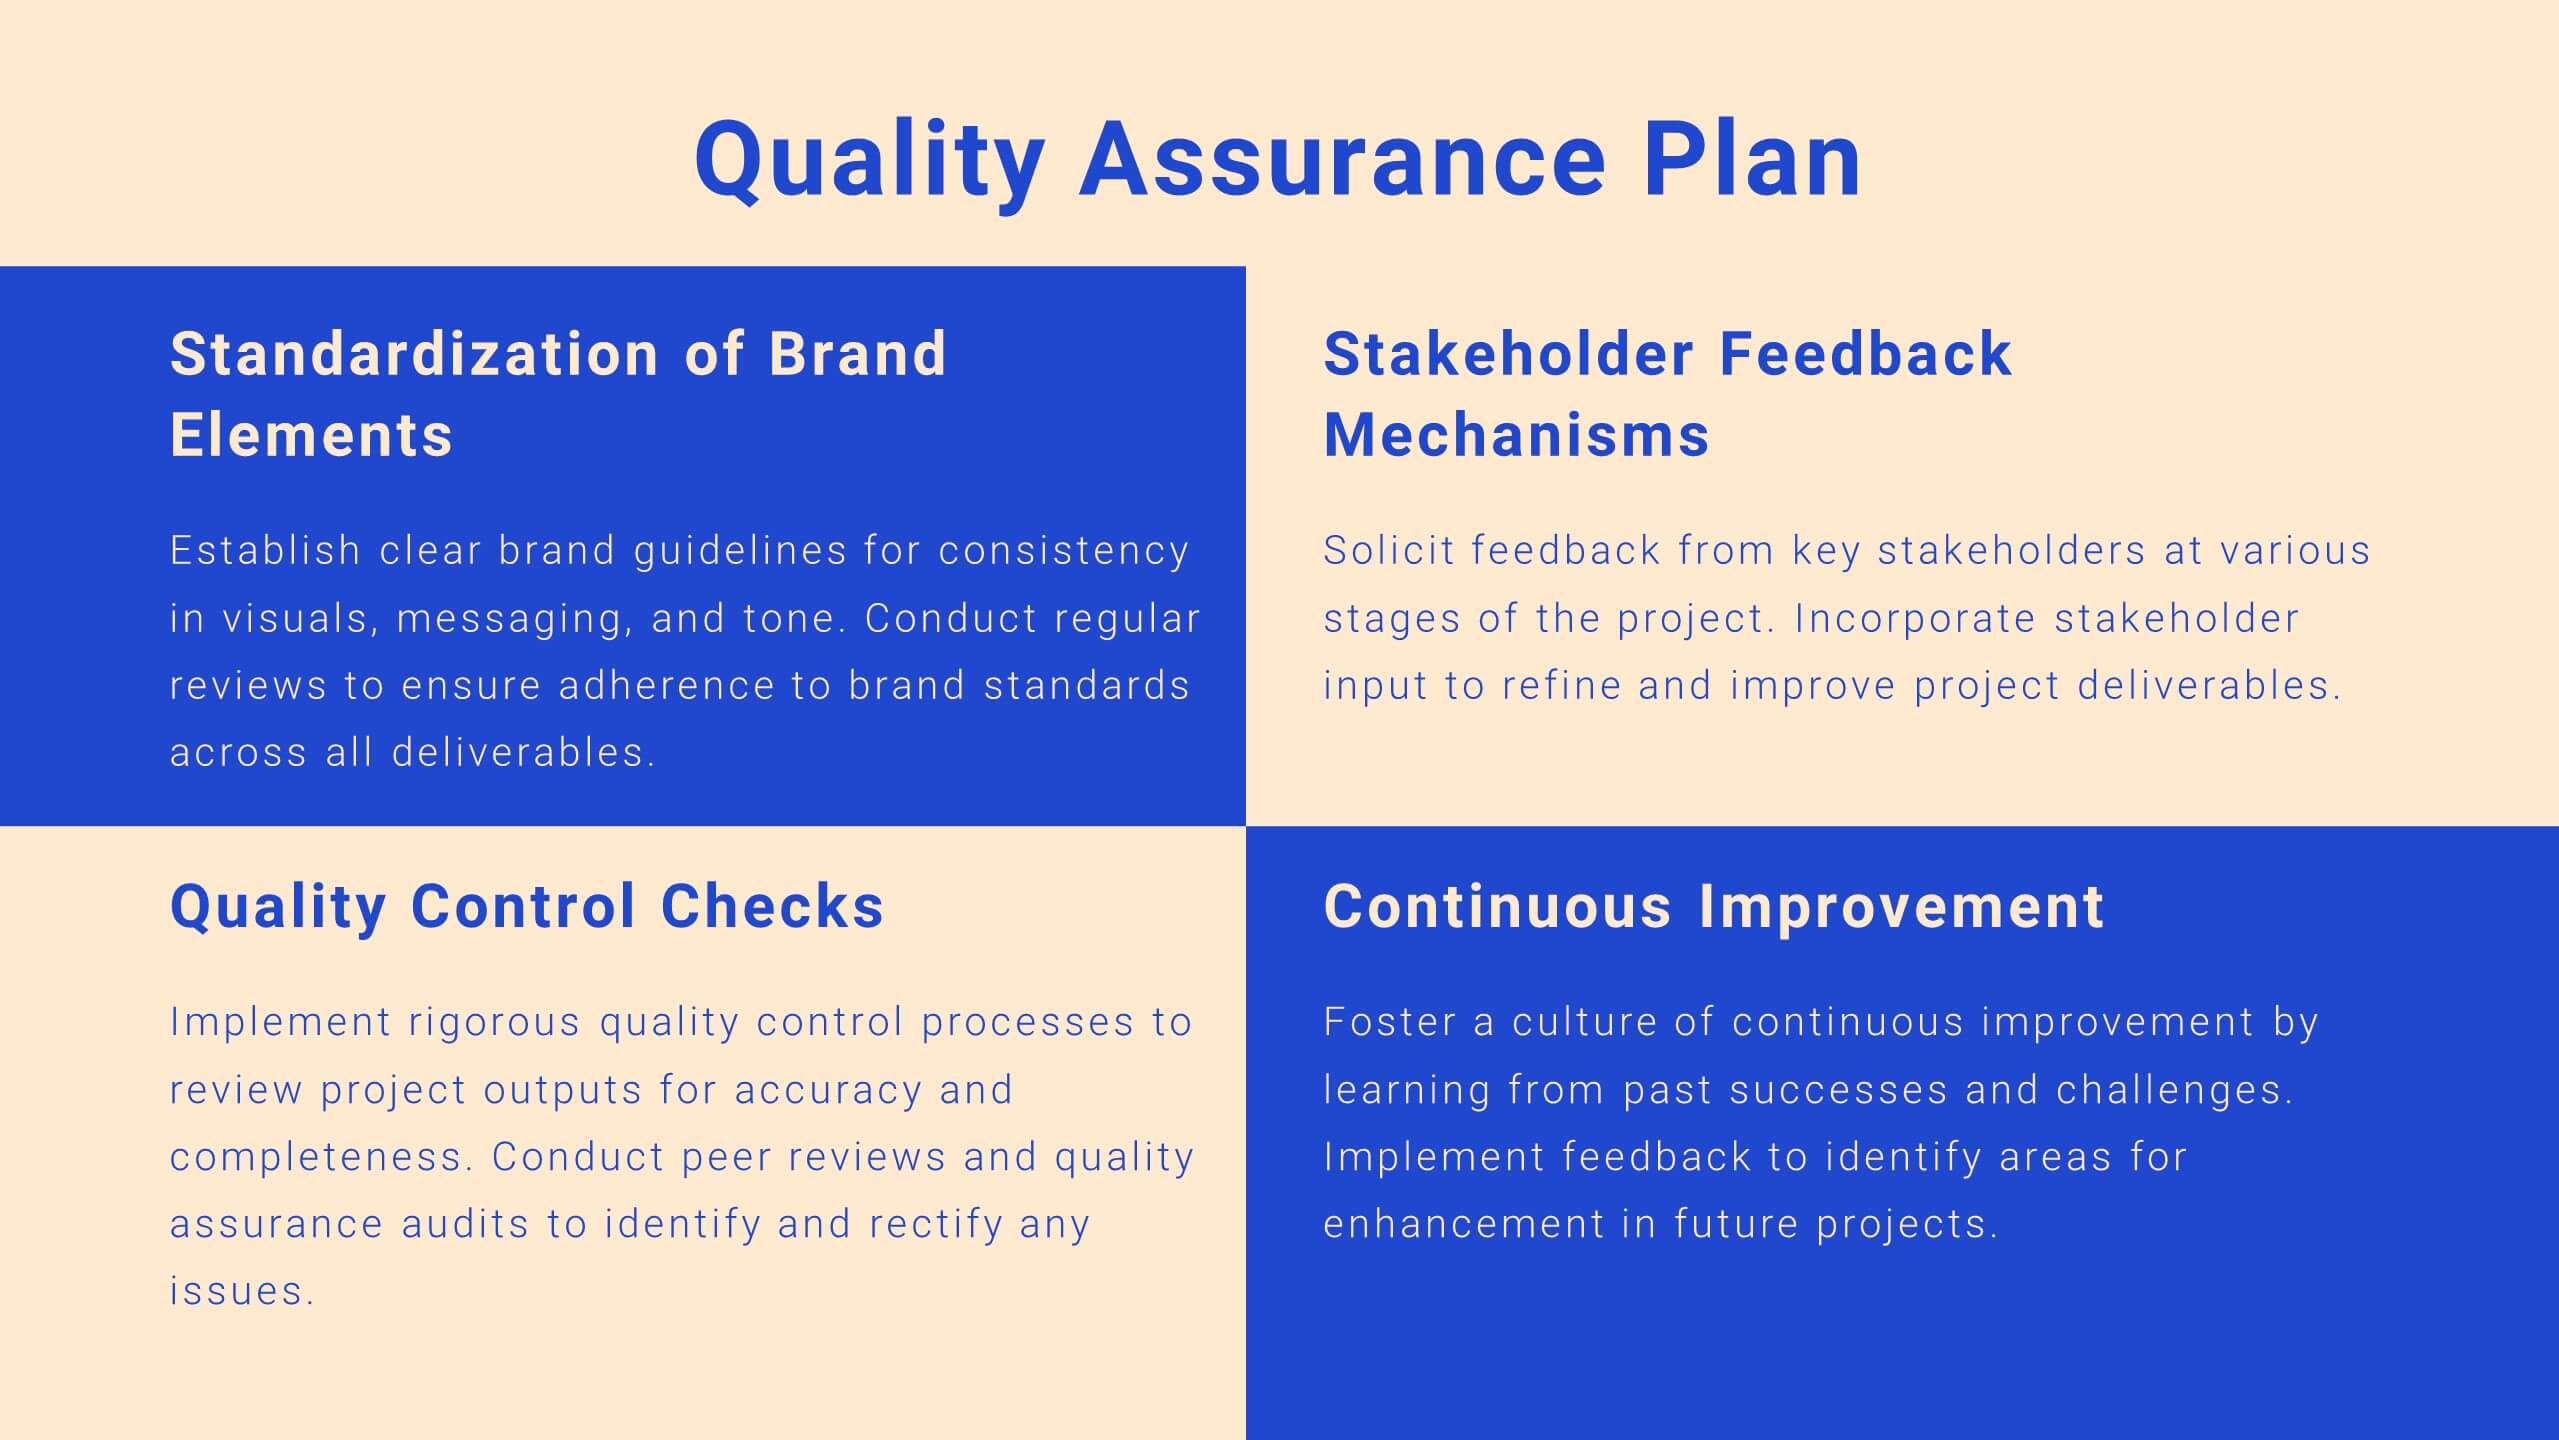
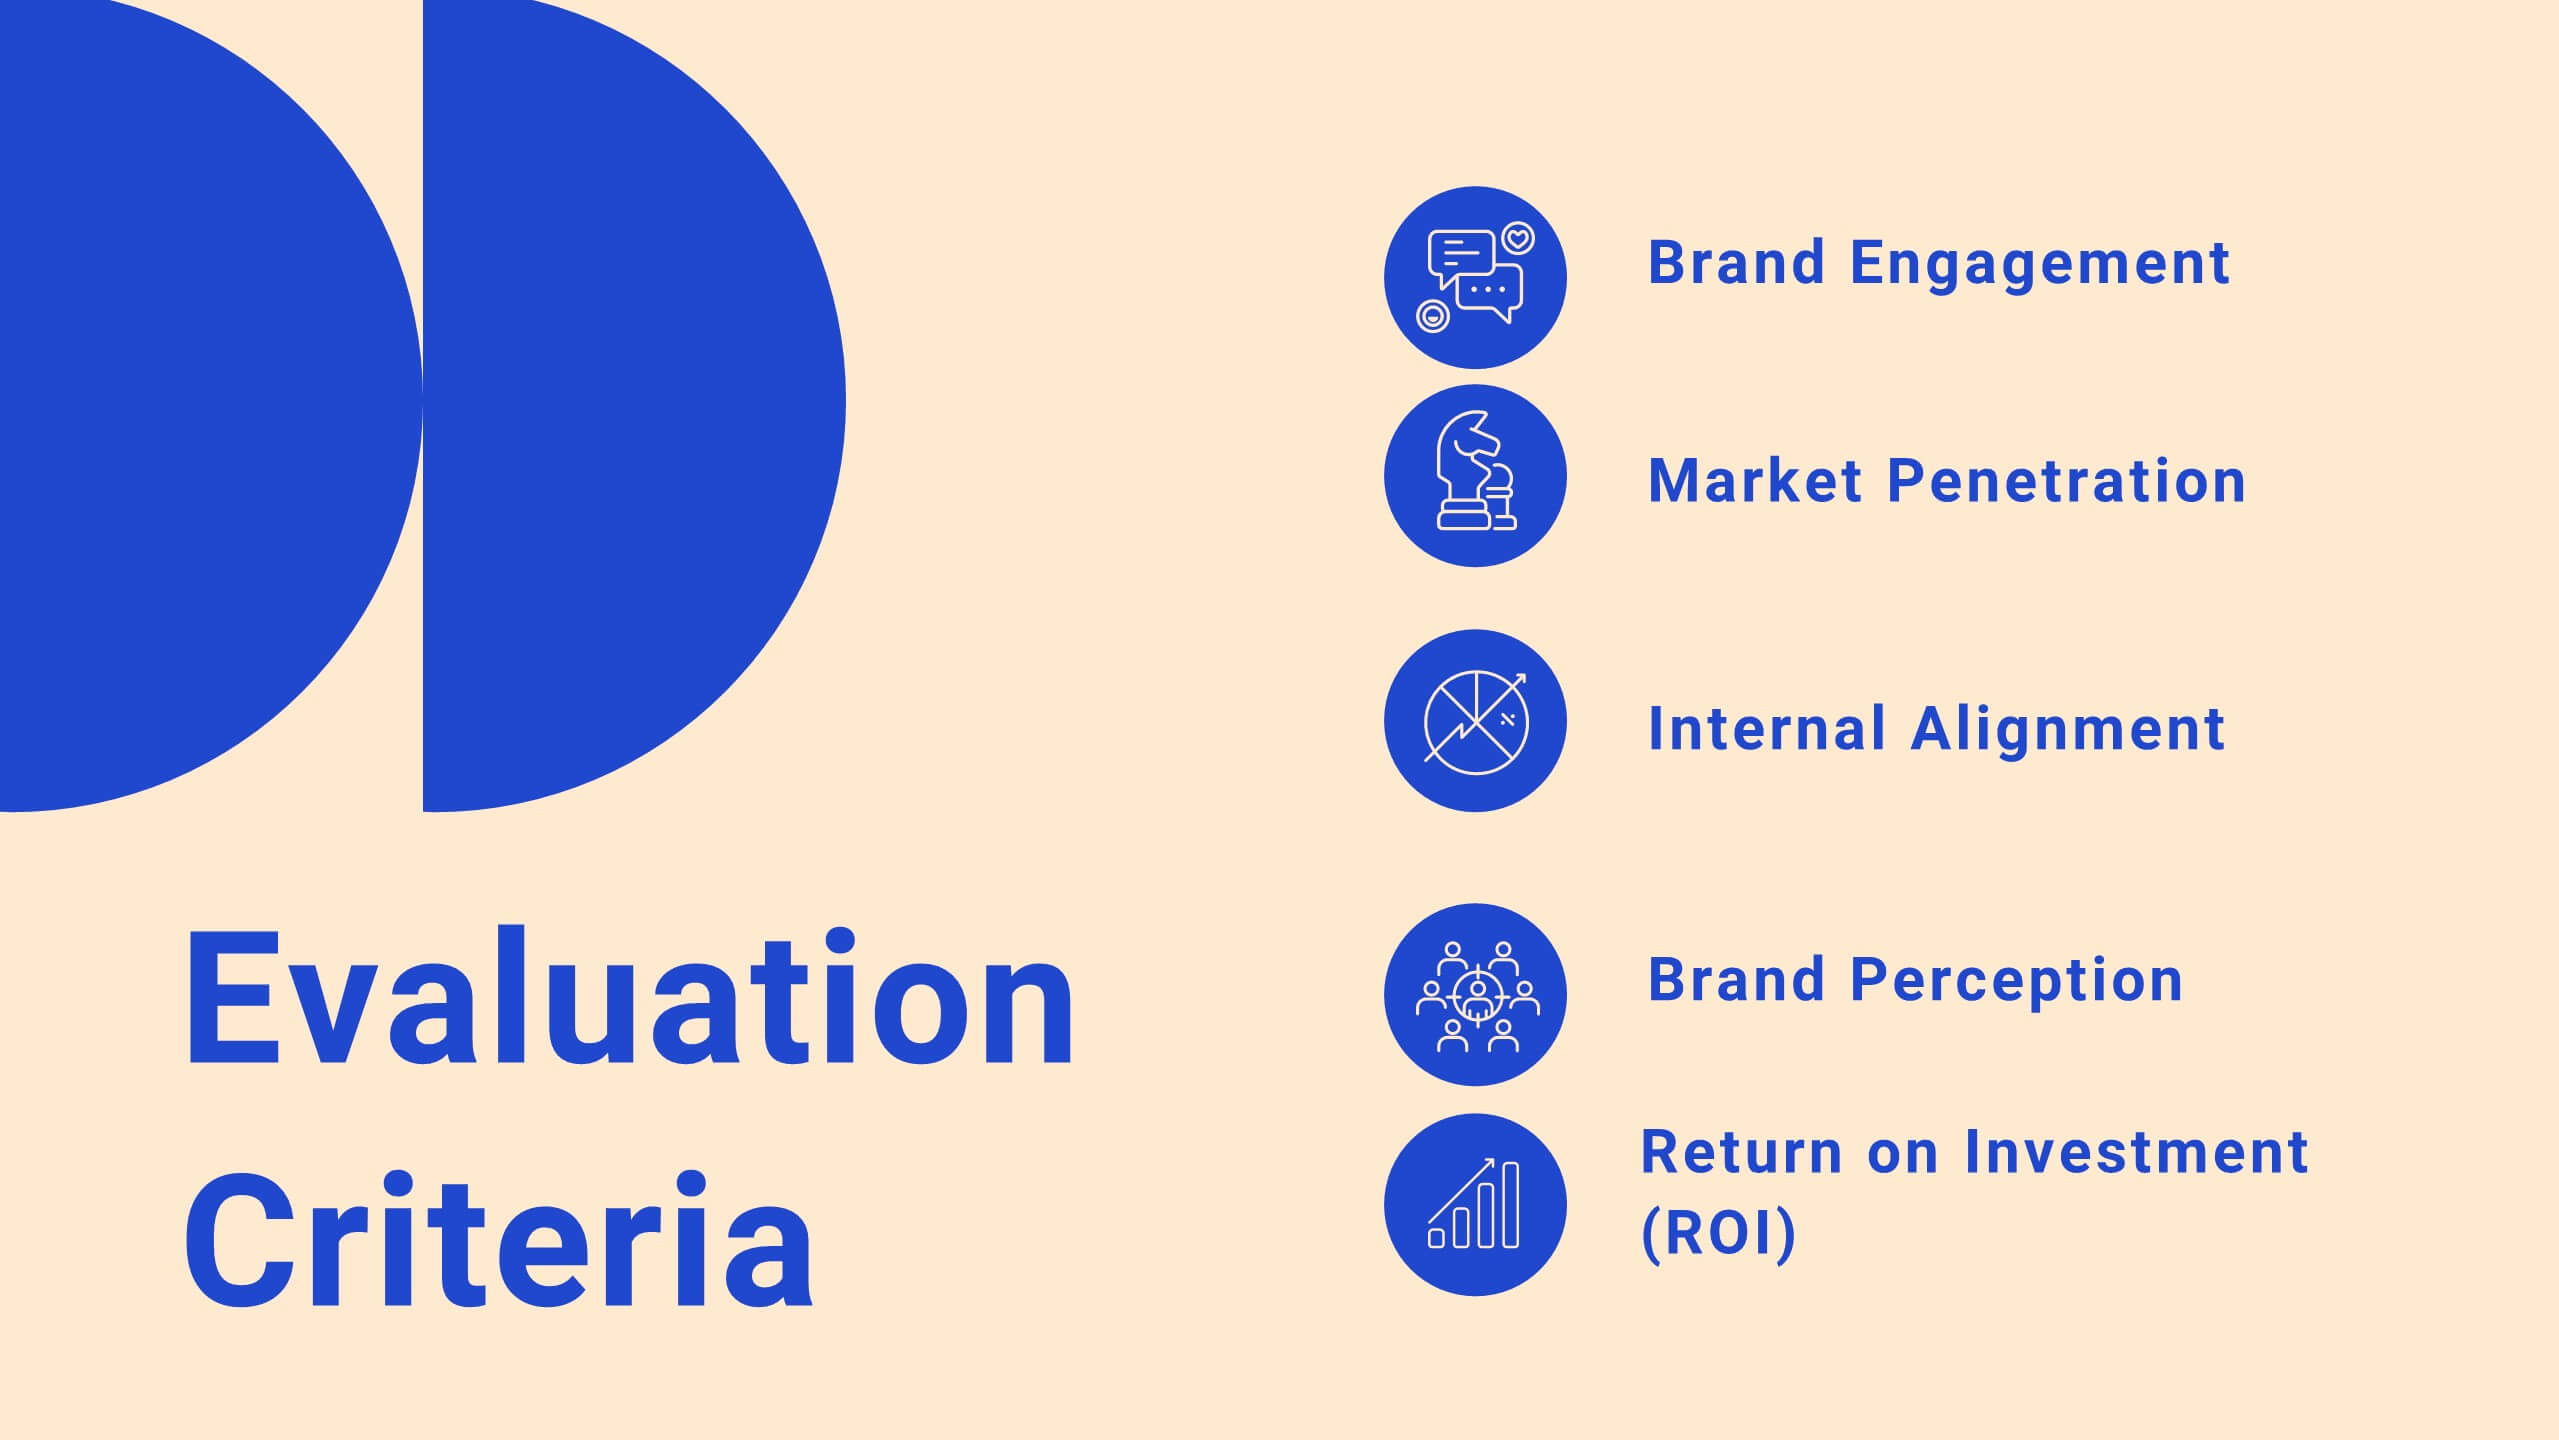
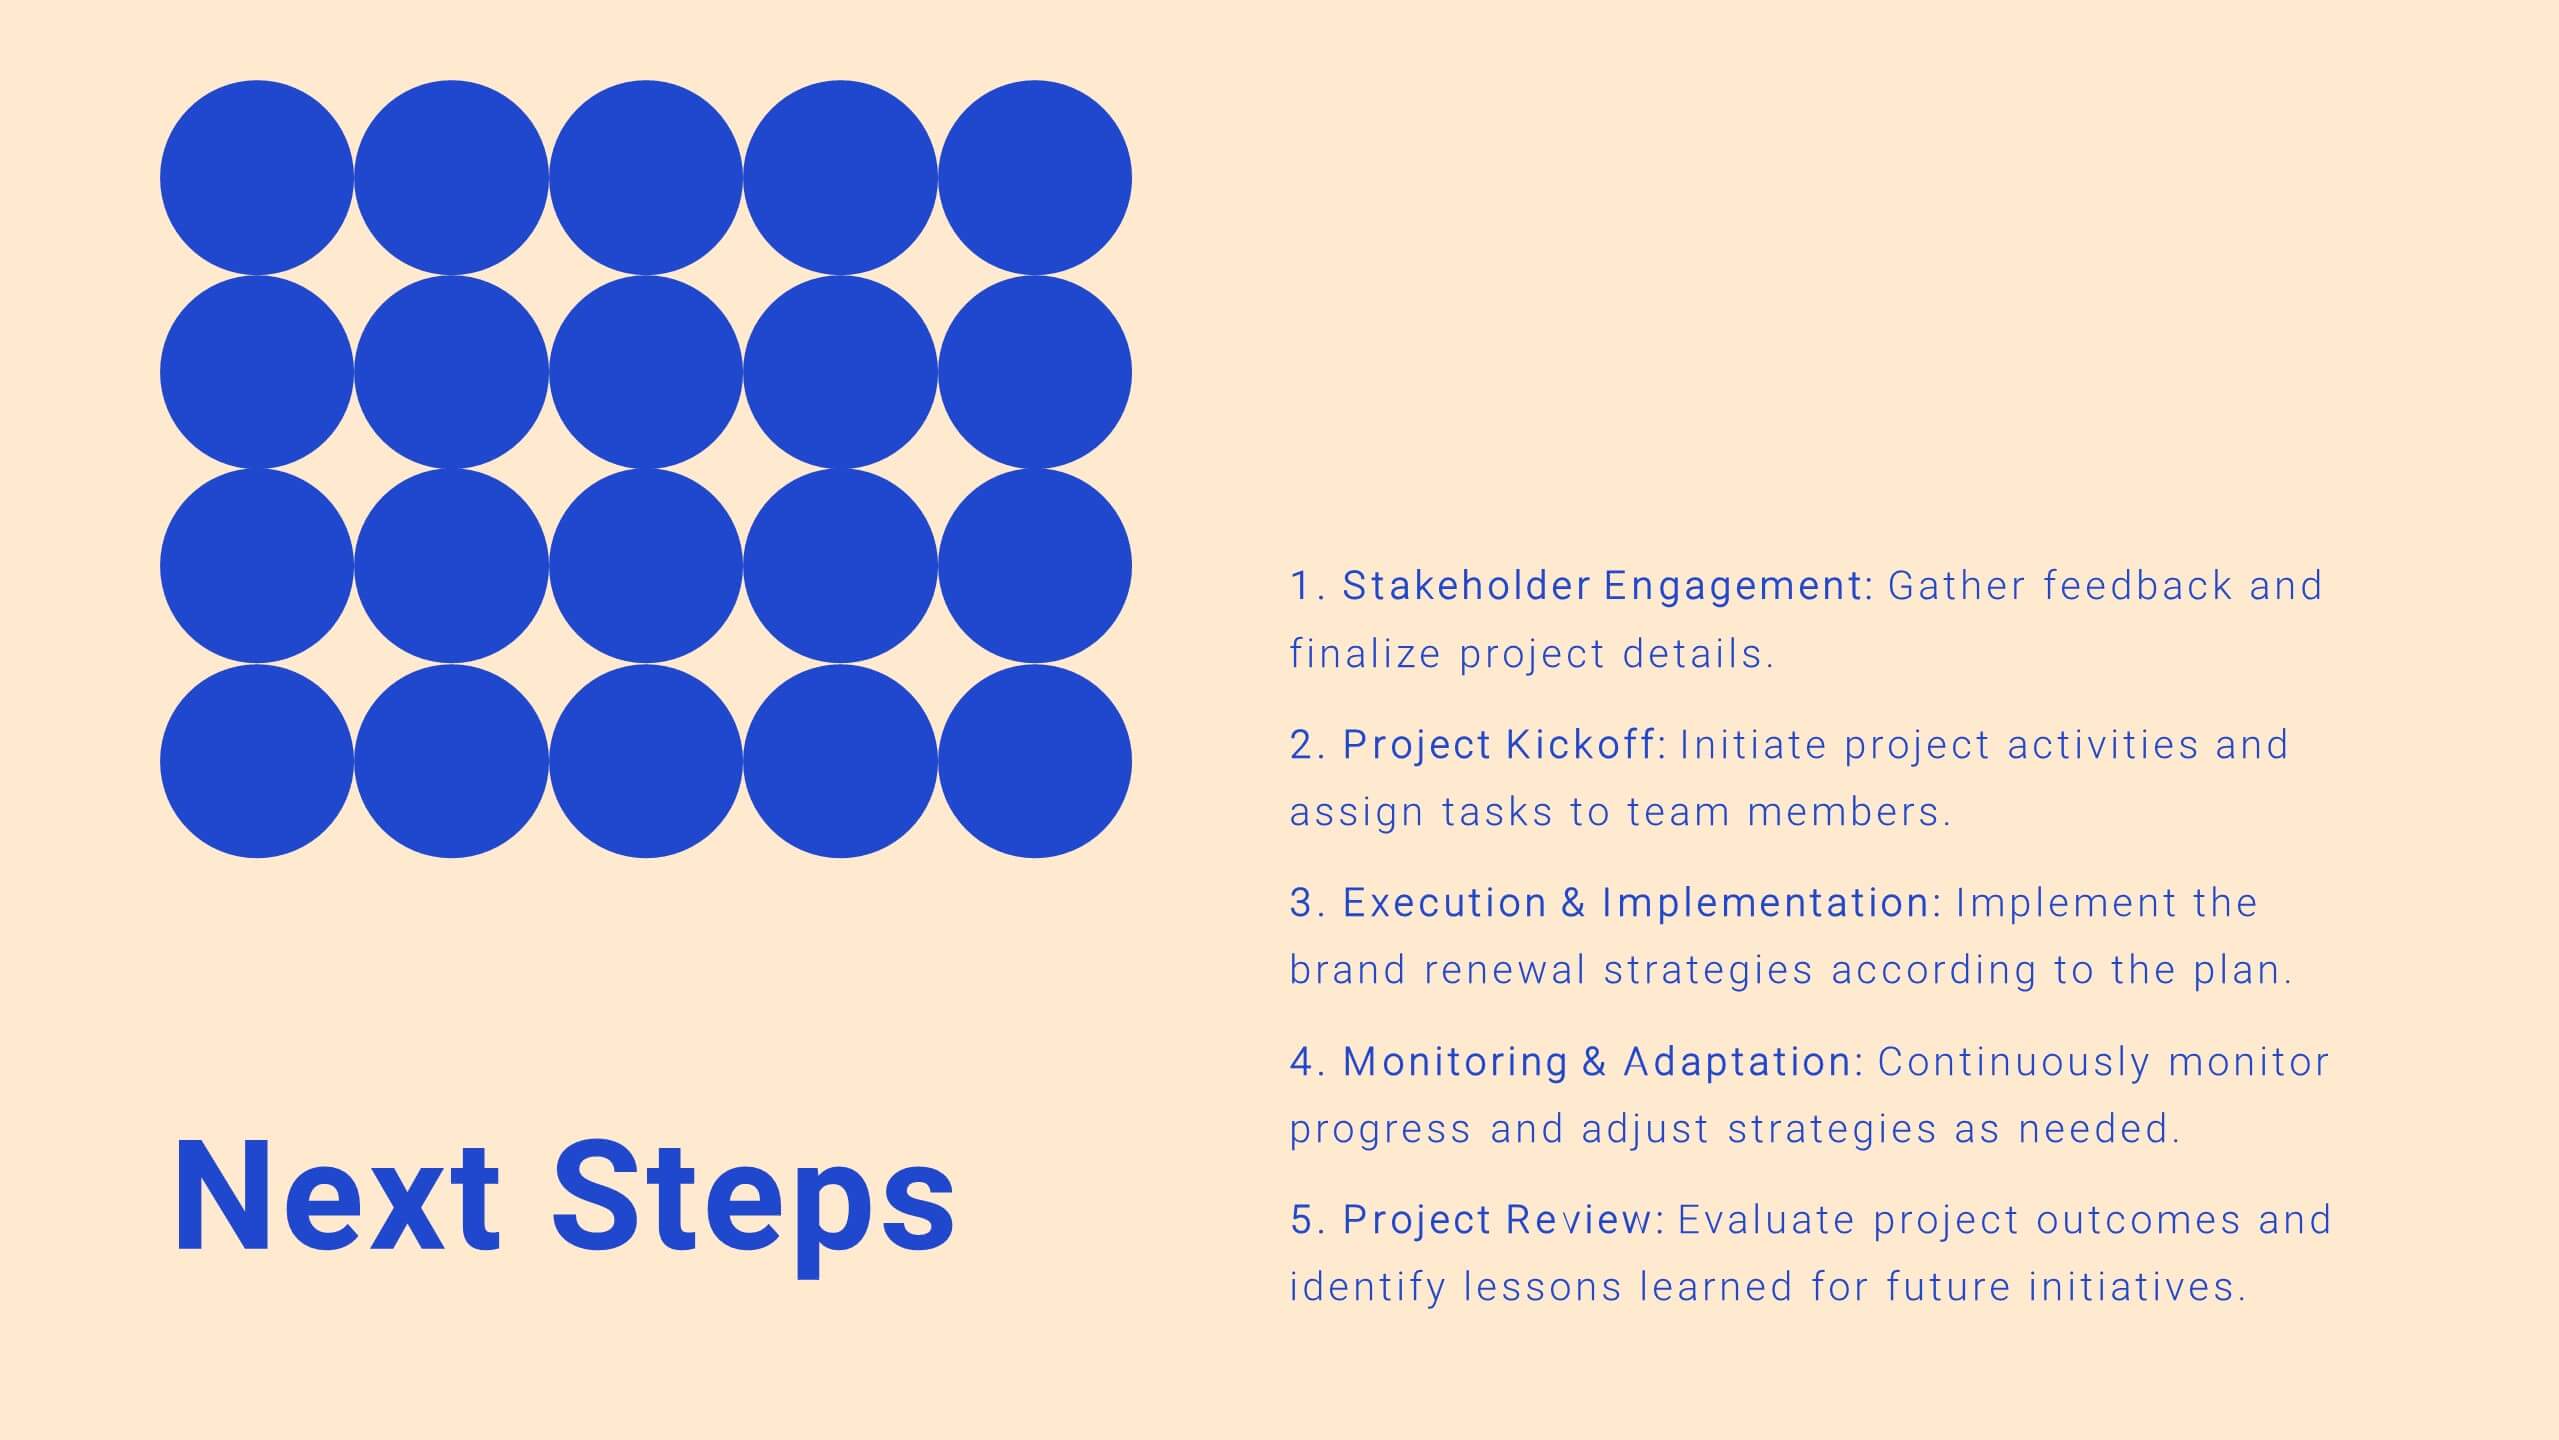
Take control of your projects with this comprehensive project plan template! From introductions to detailed objectives, this template covers scope of work, methodology, timelines, budget breakdowns, and risk management. Ideal for ensuring your project stays on track, it also includes stakeholder analysis and quality assurance plans. Compatible with PowerPoint, Keynote, and Google Slides.


5 slides
Six Sigma DMAIC Process Flow Presentation
Streamline your process improvement with this Six Sigma DMAIC Flow template. Visually organize each stage—Define, Measure, Analyze, Improve, Control—using clean, professional layouts. Perfect for Lean Six Sigma projects, quality control, and operational excellence. Fully customizable in PowerPoint, Keynote, and Google Slides for versatile team presentations and process reviews.


8 slides
Business Funding Pitch Deck
Present your growth story with confidence using this bold and engaging Funding Pitch Deck slide. Designed with vibrant visuals, key funding milestones, and clean icons, it's perfect for showcasing your business’s financial traction. Fully editable in PowerPoint, Keynote, and Google Slides for versatile startup presentations.


7 slides
Iceberg Model Infographic Presentation
Iceberg diagrams are versatile, multi-purpose infographics that can be used to show all the factors that will affect your company. It is a great way to visualize information and organize it into one place. With this template, you’ll have the perfect way to analyze your vision and drive growth. The iceberg is used to divide and give detailed information that can be valuable in planning your strategy. Analyze, evaluate and provide data on a specific product or service. This eye-catching template is compatible with PowerPoint, Keynote and Google Slides and includes customizable photo layouts.


6 slides
Audience Targeting and Segmentation
Get to know your audience like never before with this human-centered visual layout—ideal for mapping out key segments, demographics, and targeting strategies. Great for marketing plans, user personas, or customer insights presentations, this slide keeps your data visually focused and easy to digest. Fully compatible with PowerPoint, Keynote, and Google Slides.


6 slides
Market Share Visualization Pie Chart Presentation
Showcase percentage breakdowns with impact using the Market Share Visualization Pie Chart Presentation. This infographic slide features a bold, segmented pie chart styled with cloud-shaped backdrops and colorful wedges, ideal for presenting market analysis, segment comparisons, or share allocation. Each slice is clearly labeled with percentage values and customizable titles, while matching icons reinforce your data points visually. Whether you're pitching to stakeholders or presenting internal reports, this design ensures clarity and engagement. Fully editable in PowerPoint, Keynote, and Google Slides.


20 slides
Whisper Creative Portfolio Presentation
The Creative Portfolio Presentation Template is a visually striking 20-slide design, ideal for showcasing your professional work or services. It features slides for introductions, about us, portfolio overviews, and individual project highlights. Key sections include philosophy, style, creative process, client testimonials, awards, and pricing structures. The vibrant yellow and pink gradient elements provide a modern, creative flair that grabs attention. Fully customizable and compatible with PowerPoint, Keynote, and Google Slides, this template is perfect for designers, agencies, and freelancers aiming to present their work professionally and uniquely.


5 slides
Business Process Checklist Presentation
Ensure smooth workflows with the Business Process Checklist template. This visually structured layout simplifies process tracking, highlighting key steps and completion percentages. Perfect for project managers and teams looking to optimize efficiency. Fully editable and compatible with PowerPoint, Keynote, and Google Slides for easy customization and seamless presentation.


5 slides
Organizational Management Frameworks Overview Presentation
Clarify reporting lines and decision-making roles with the Organizational Management Frameworks Overview Presentation. This clean and color-coded hierarchy chart helps visualize team structure, leadership levels, or departmental breakdowns. Ideal for organizational design, onboarding, or strategic alignment discussions, each placeholder is fully customizable to reflect your company’s framework. Compatible with PowerPoint, Keynote, and Google Slides—perfect for HR professionals, managers, and consultants seeking structure and clarity.