


Features
- 5 Unique slides
- Fully editable and easy to edit in Microsoft Powerpoint, Keynote and Google Slides
- 16:9 widescreen layout
- Clean and professional designs
- Export to JPG, PDF or send by email


Do you have any questions?
Recommend


7 slides
Pyramid Model Infographic
A pyramid model is a visual representation that uses the structure of a pyramid to convey information, concepts, or hierarchies in a clear and visually engaging manner. Our Pyramid Model Infographic template is the perfect tool to depict your concepts in a structured way. This template embodies an essence, enabling you to present your ideas in a way that's both powerful and timeless. This infographic is a powerful representation of your ideas, allowing you to showcase their strength, structure, and enduring potential. Use this template to construct a visual masterpiece that stands tall, just like the pyramids of ancient times!


5 slides
Economy Resumption Infographics
Economy Resumption refers to the process of restarting or restoring economic activity following a period of disruption or decline. This Infographic is a visual representations of information and data related to the economy after a disruption. They are designed to provide insights into the current state of the economy, the factors affecting its recovery, and the measures being taken to stimulate growth. This template can provide valuable insights into the state of the economy by presenting data and information in an accessible and visually engaging way. This can help decision-making and drive positive economic outcomes.


5 slides
Business Influence Stakeholder Analysis Presentation
Enhance your project's success with our Business Influence Stakeholder Analysis Presentation template, designed to identify and prioritize stakeholders based on their influence and impact. This template is ideal for strategic planning and ensuring all key stakeholders are considered. Compatible with PowerPoint, Keynote, and Google Slides."


4 slides
Strategic Risk Assessment and Control Presentation
Highlight layered risk priorities with the Strategic Risk Assessment and Control Presentation. This visual template uses a 3D concentric model (D to A) to illustrate escalating risk levels or control measures. Ideal for risk managers and compliance teams. Fully editable in PowerPoint, Google Slides, and Canva for seamless customization.


4 slides
Cost Breakdown Table Presentation
Make your numbers speak with style using a clean, structured layout that simplifies pricing and cost analysis. This presentation is perfect for comparing plans, budgets, or expenses in a clear and visually engaging way. Fully editable and compatible with PowerPoint, Keynote, and Google Slides.


21 slides
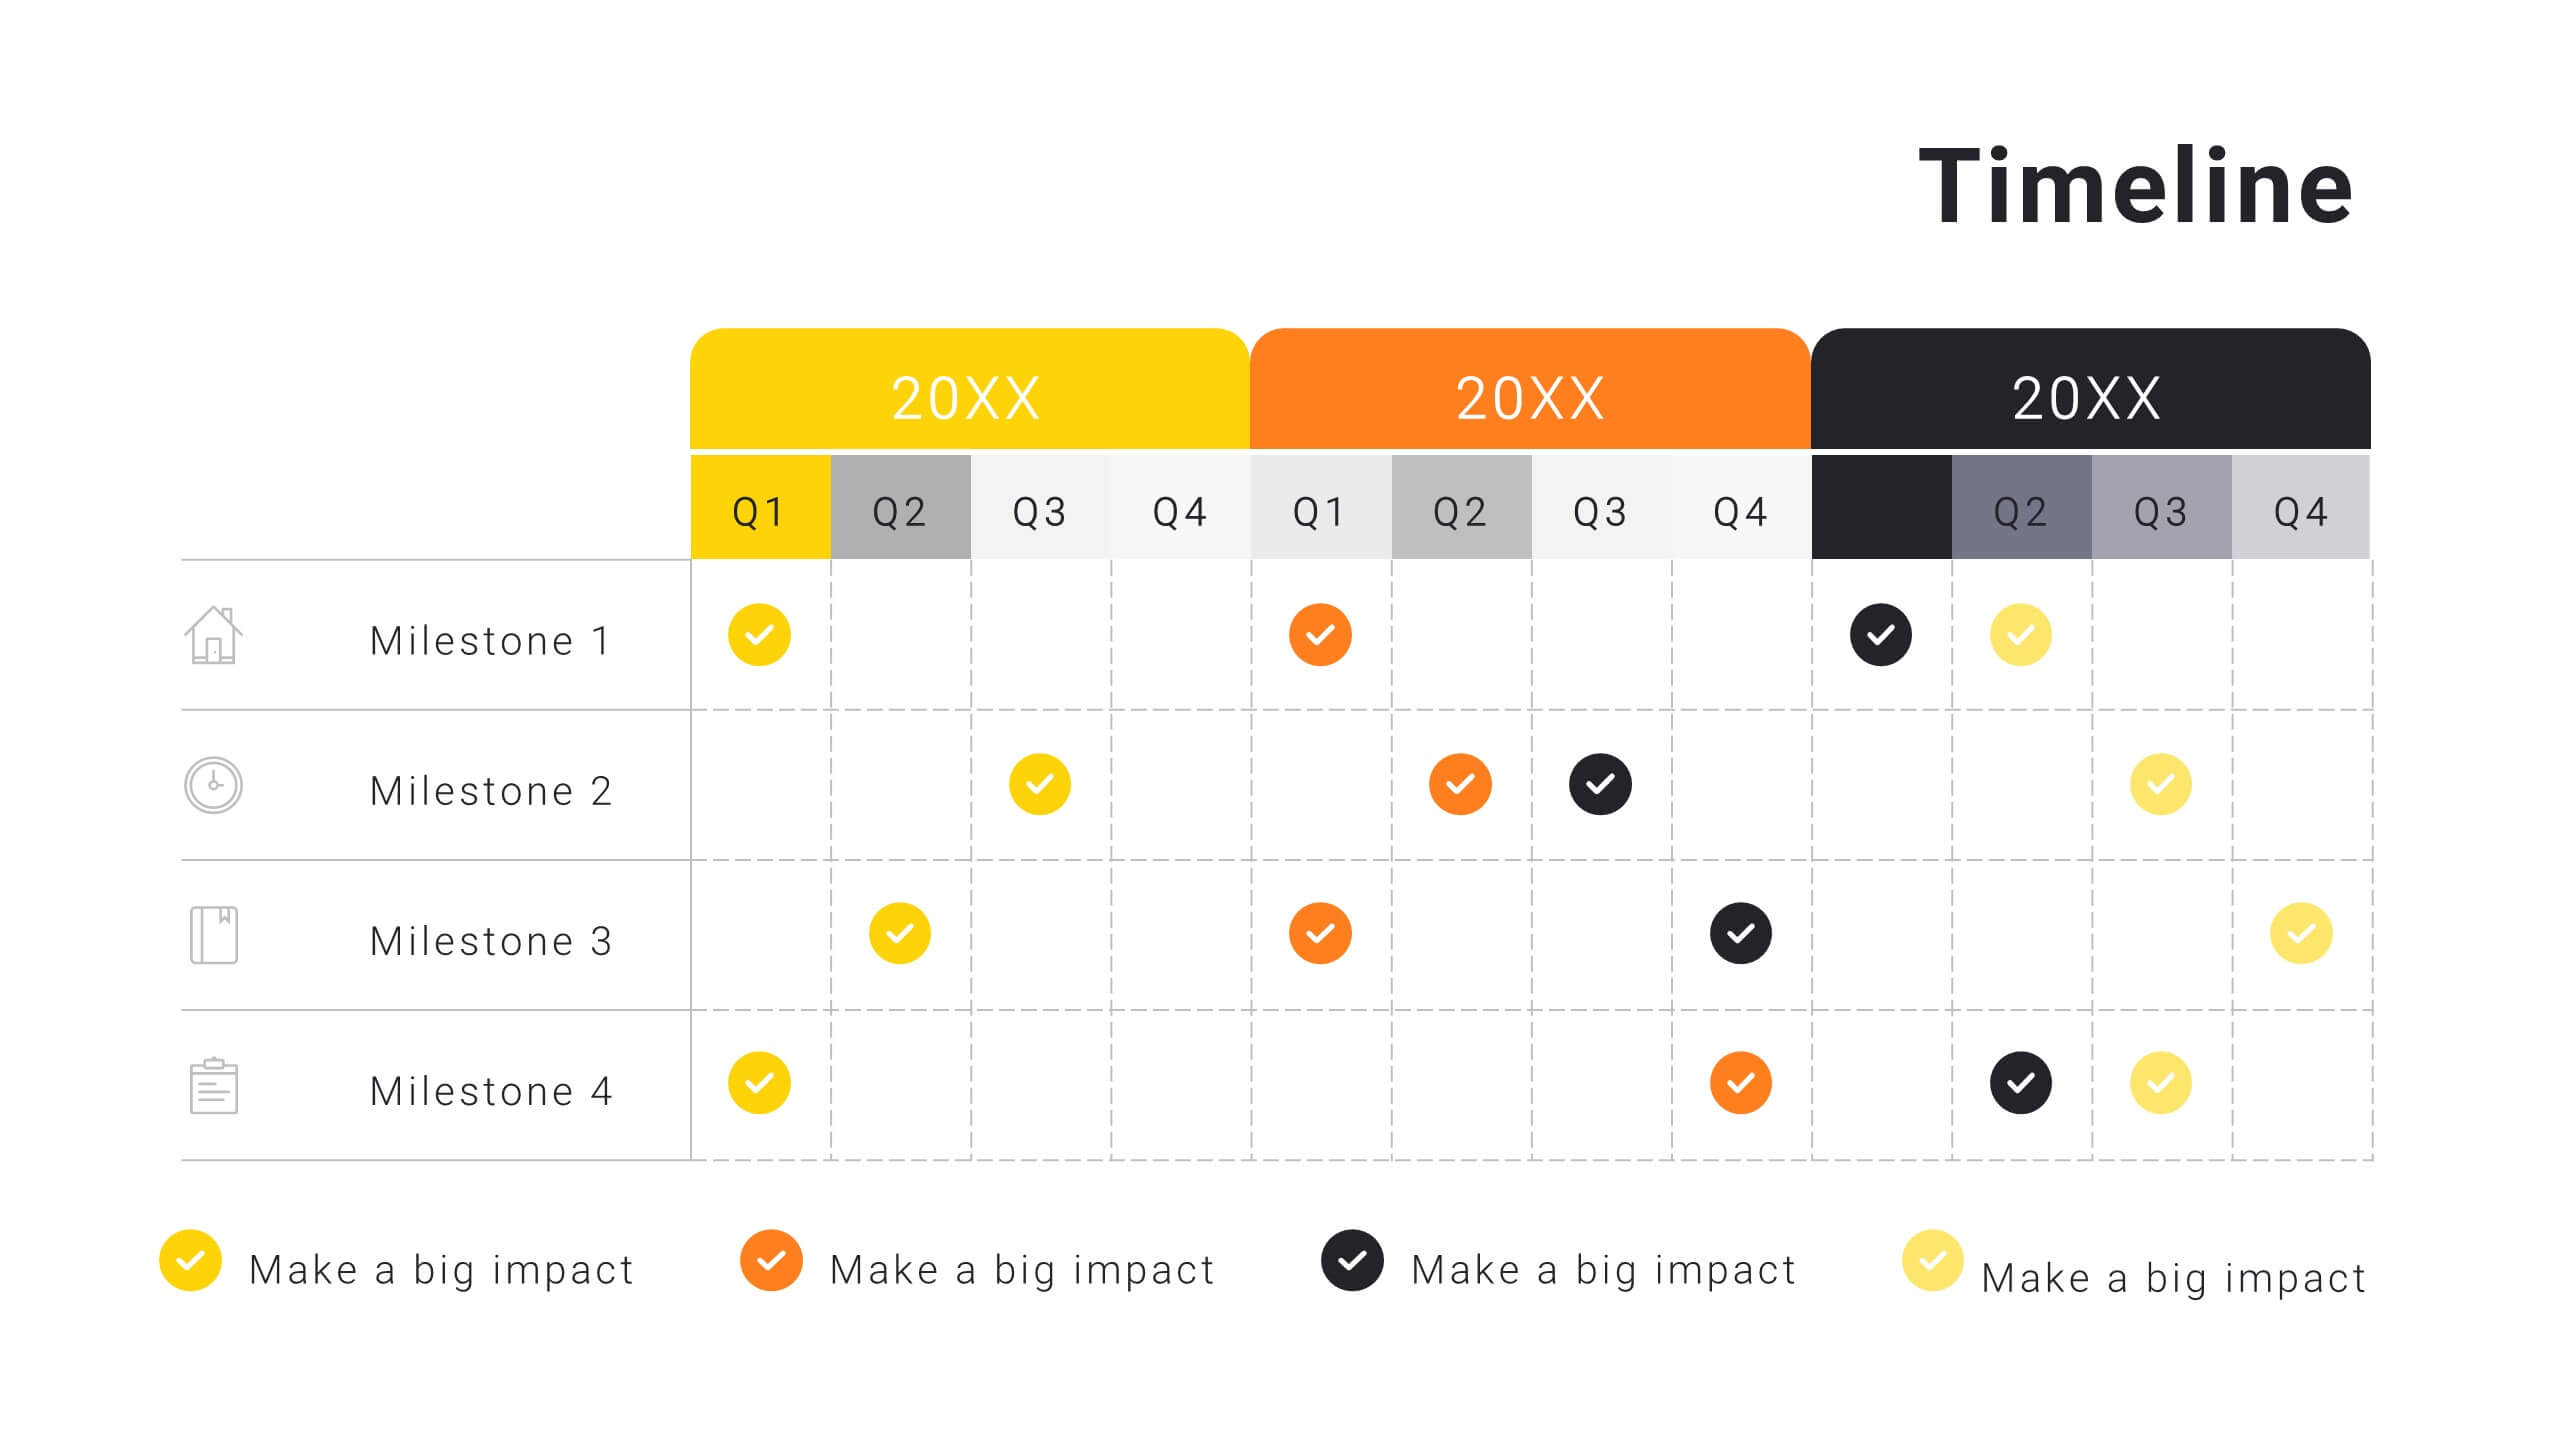
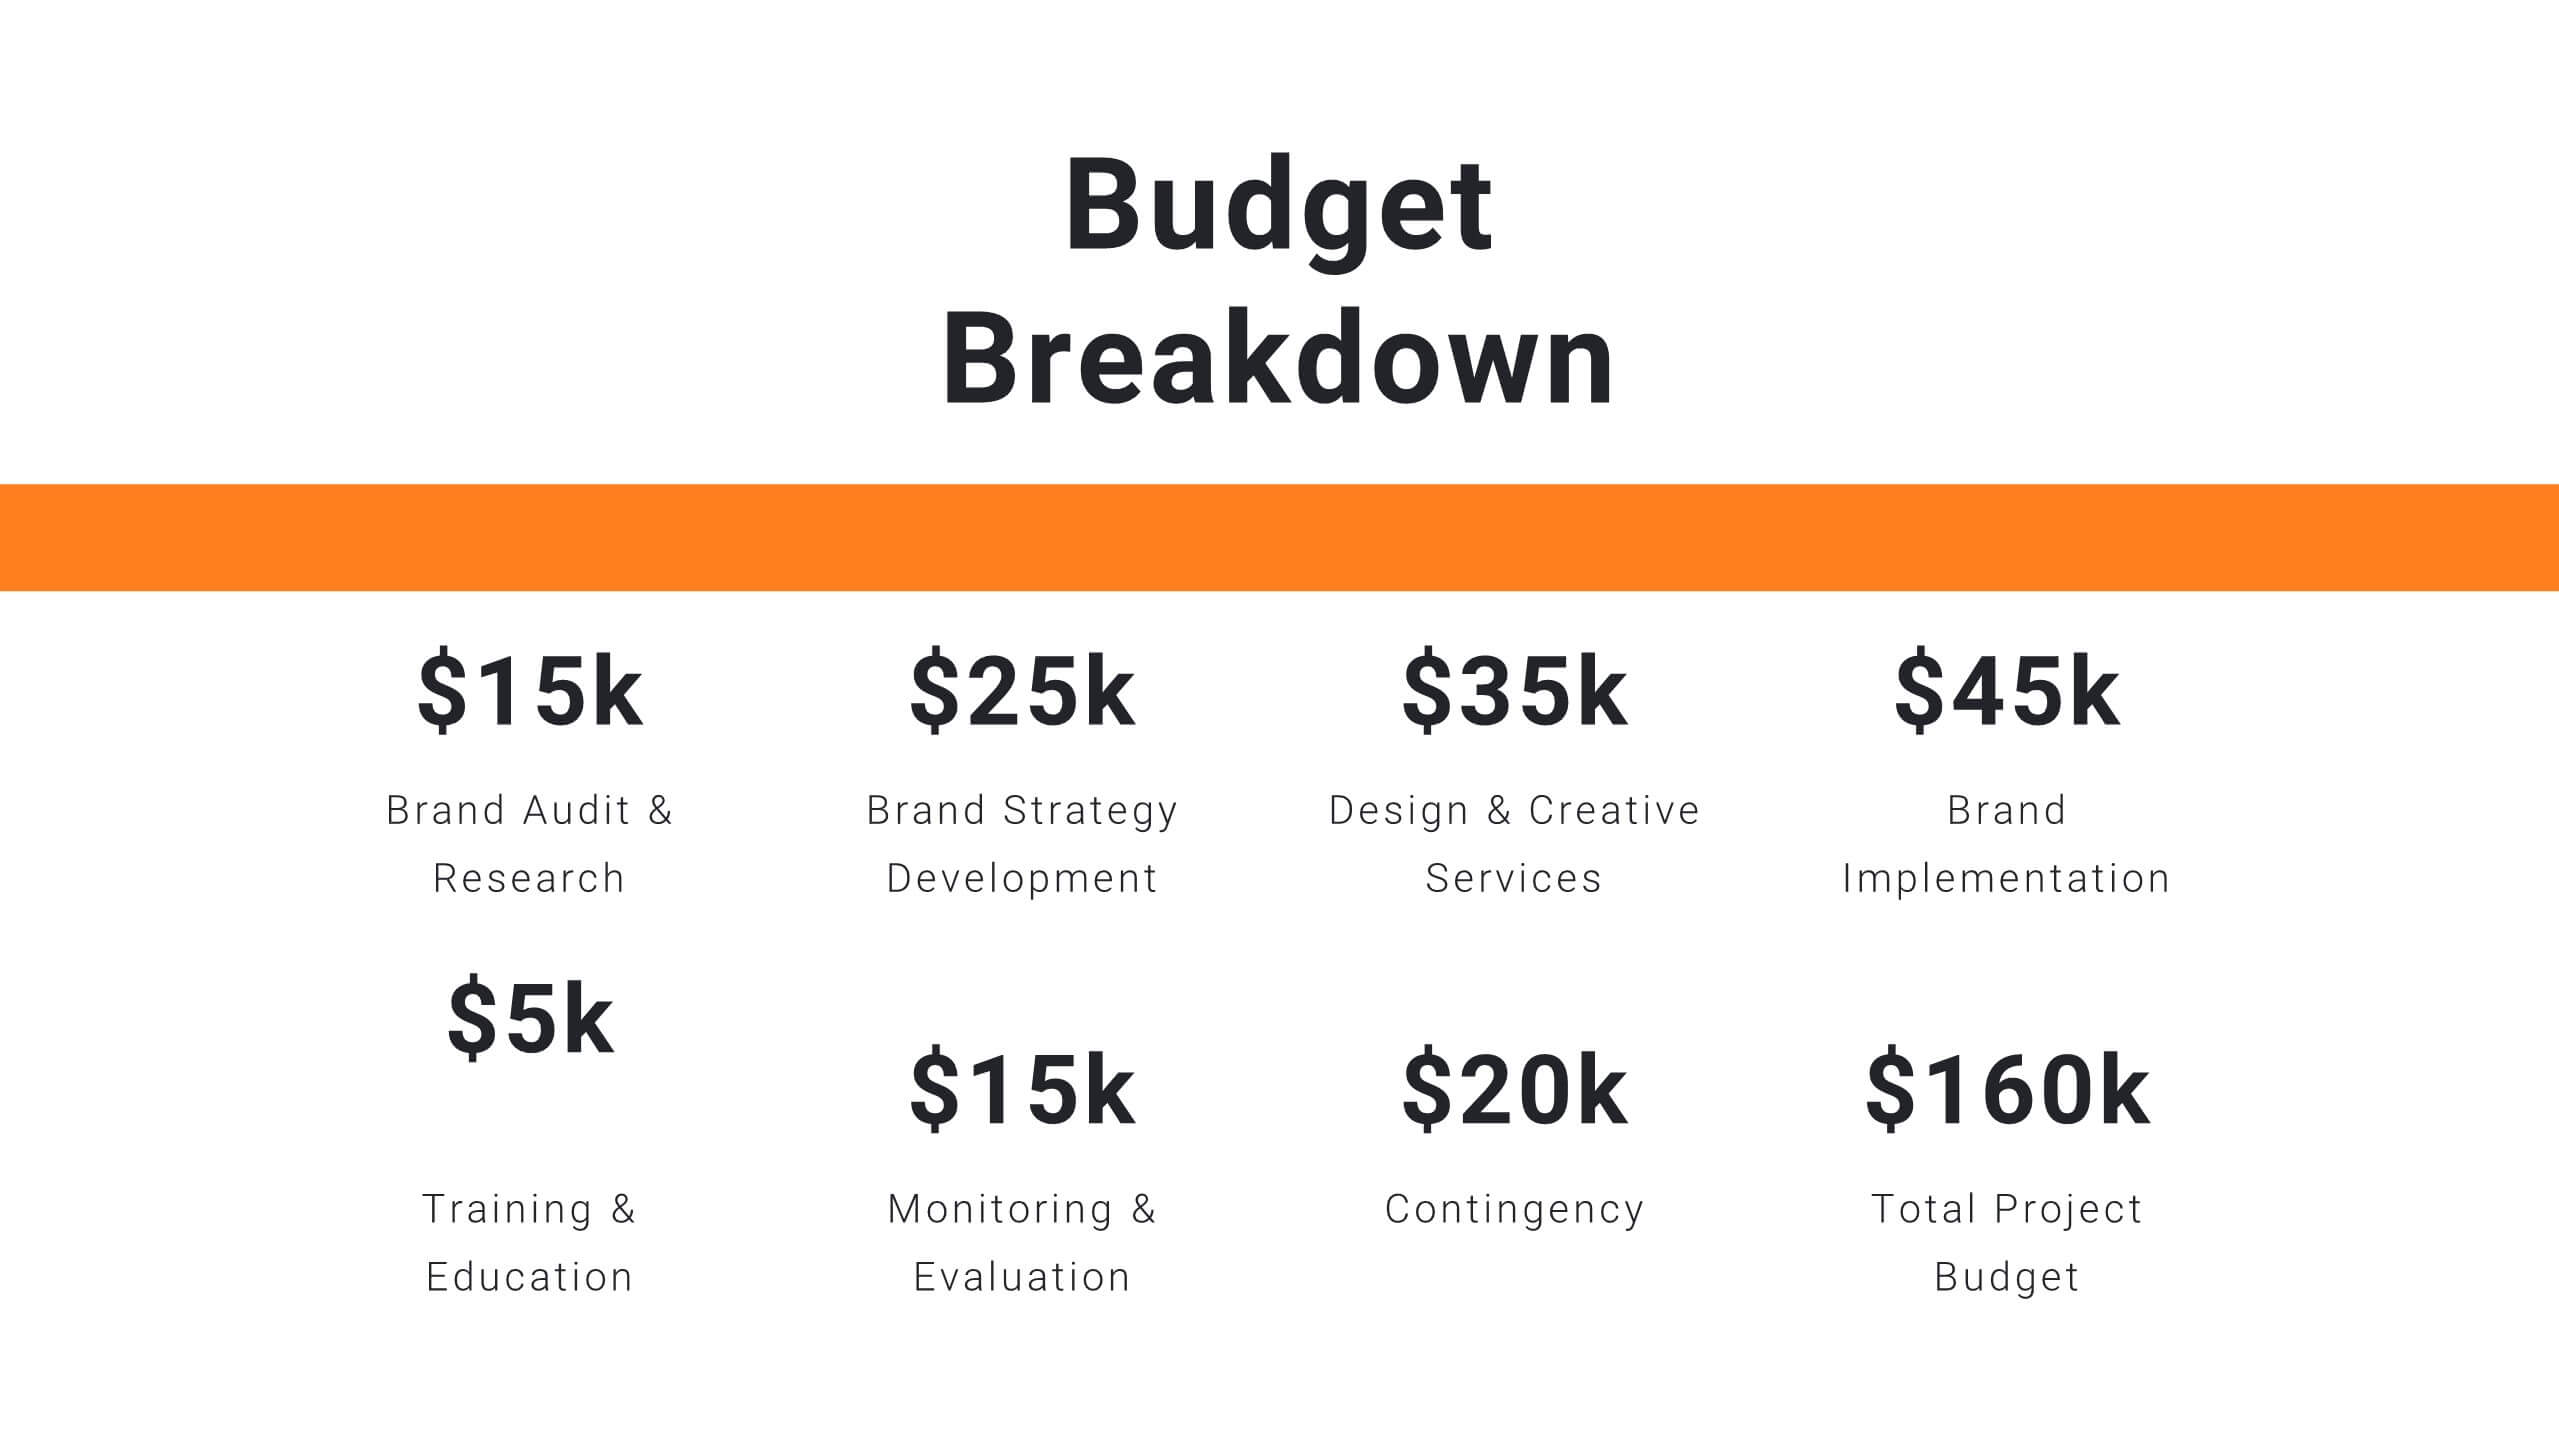
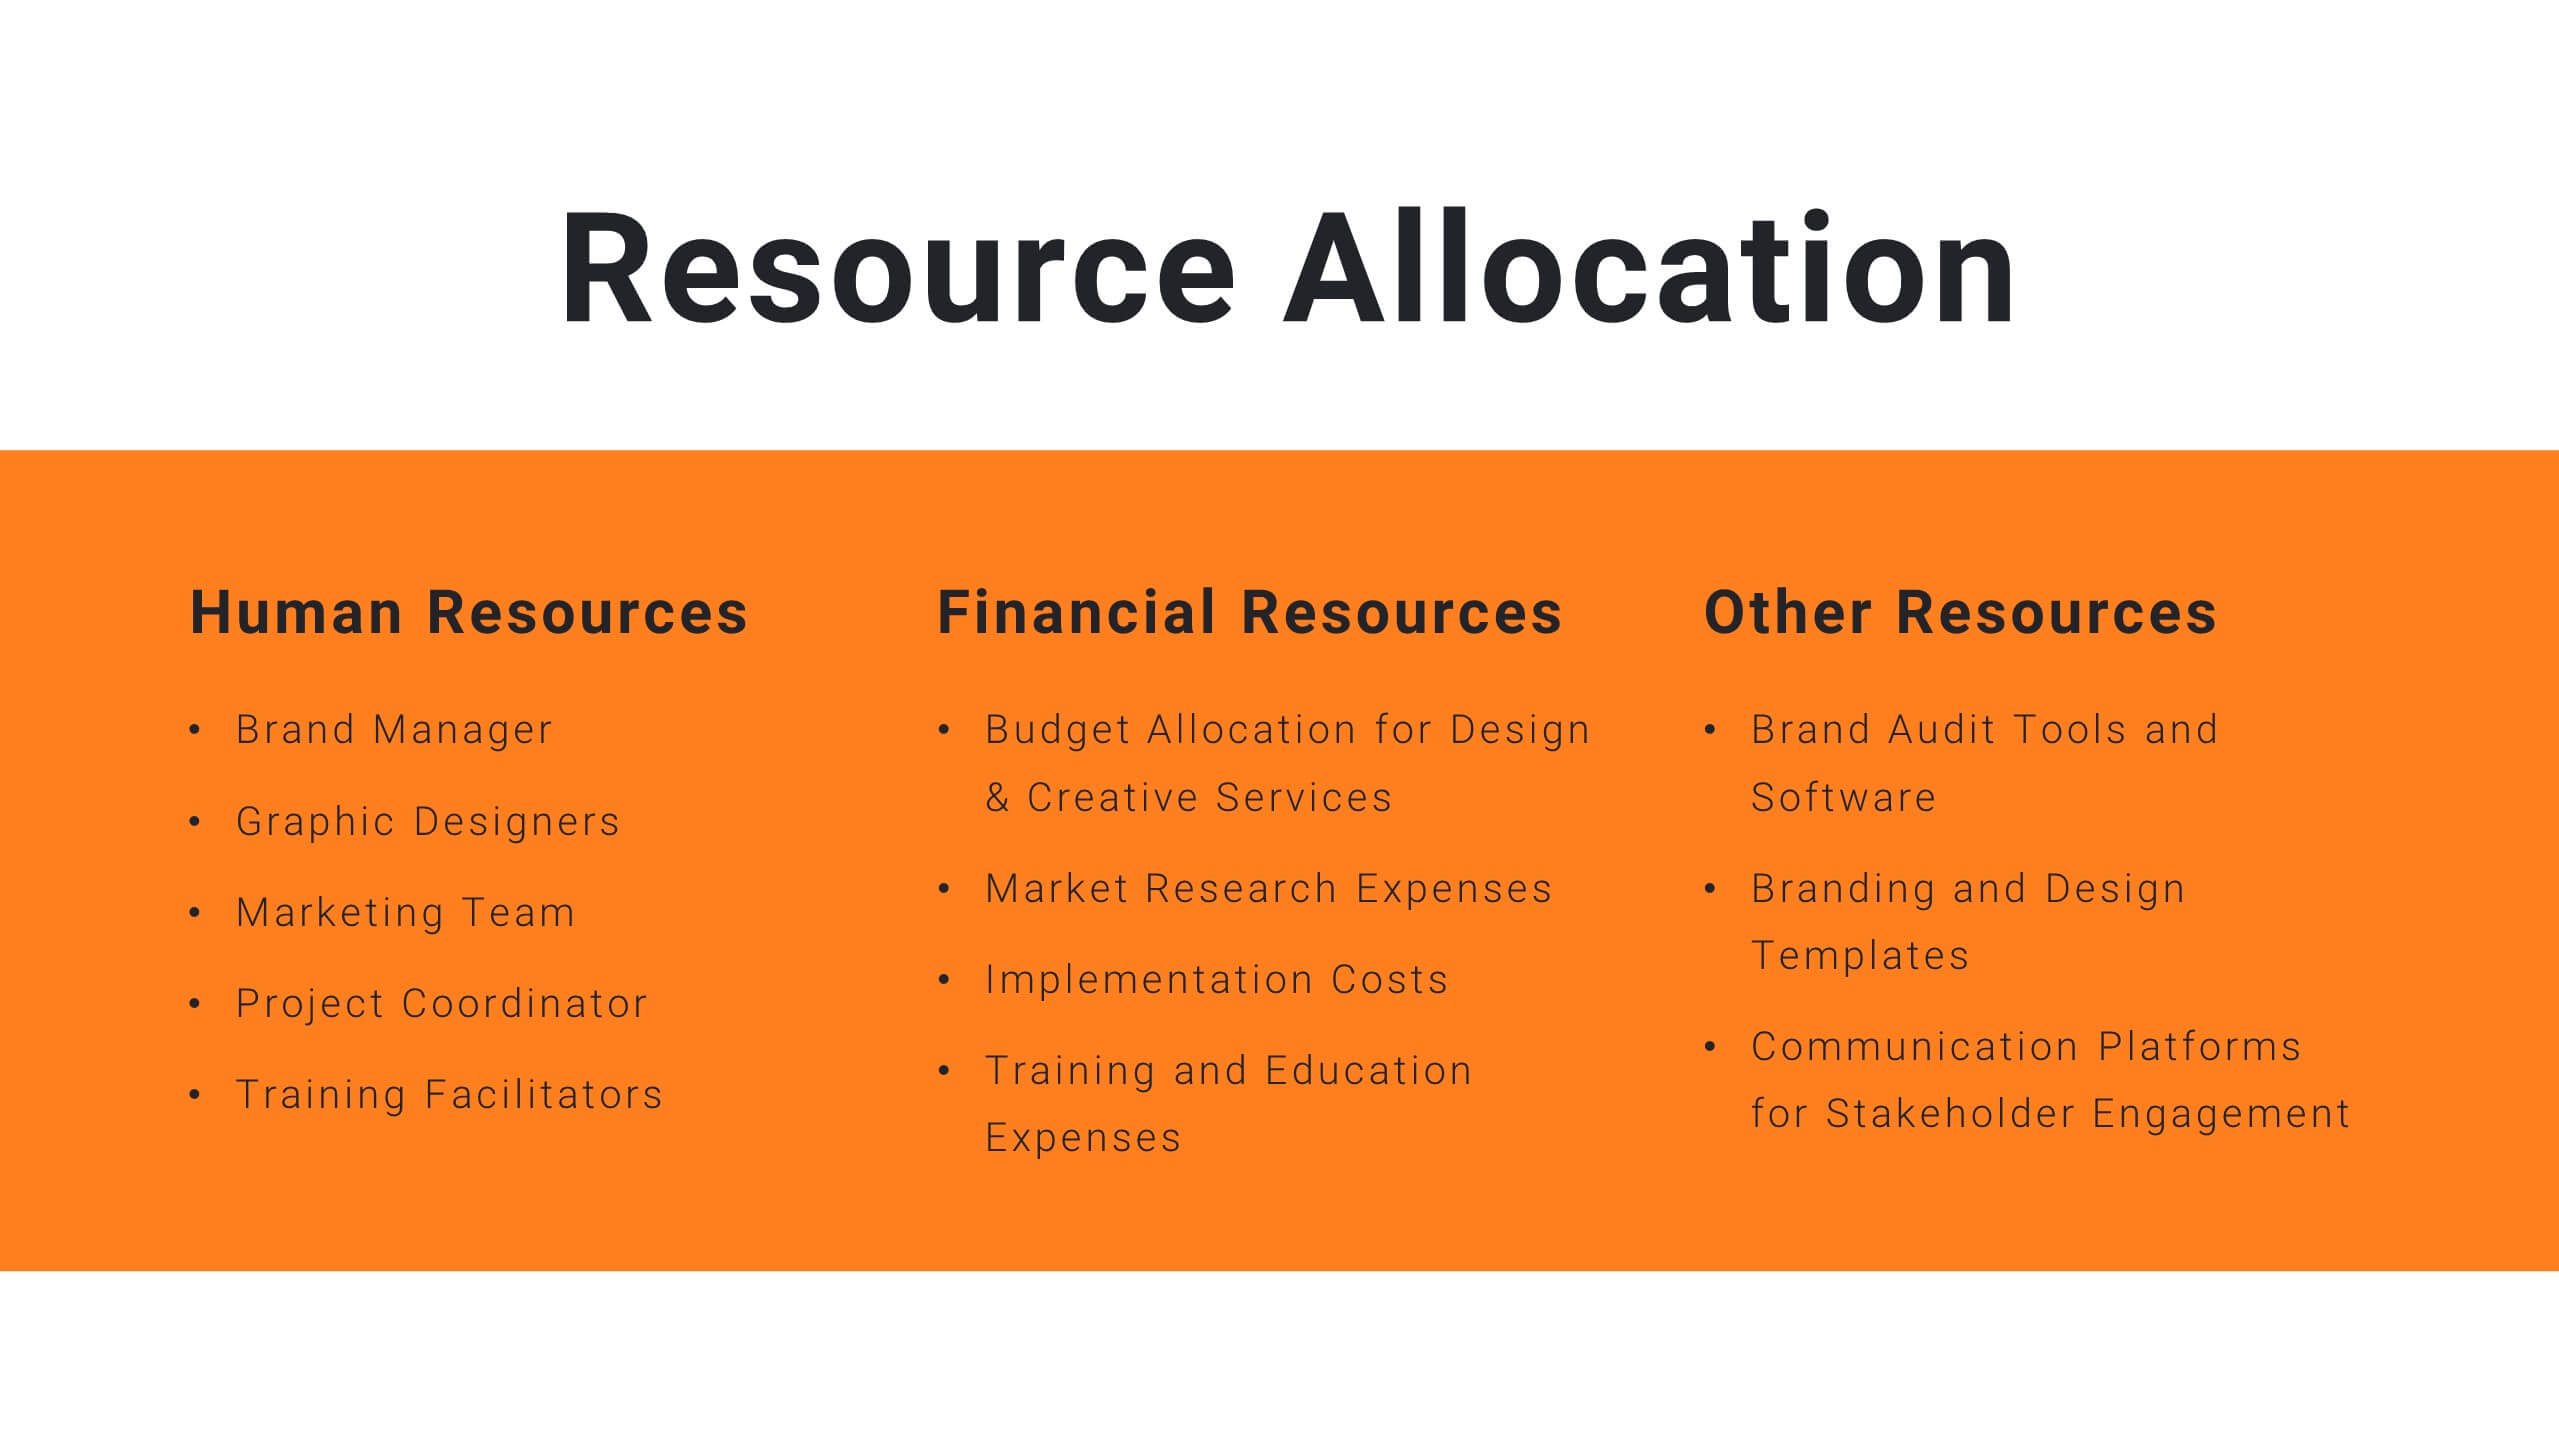
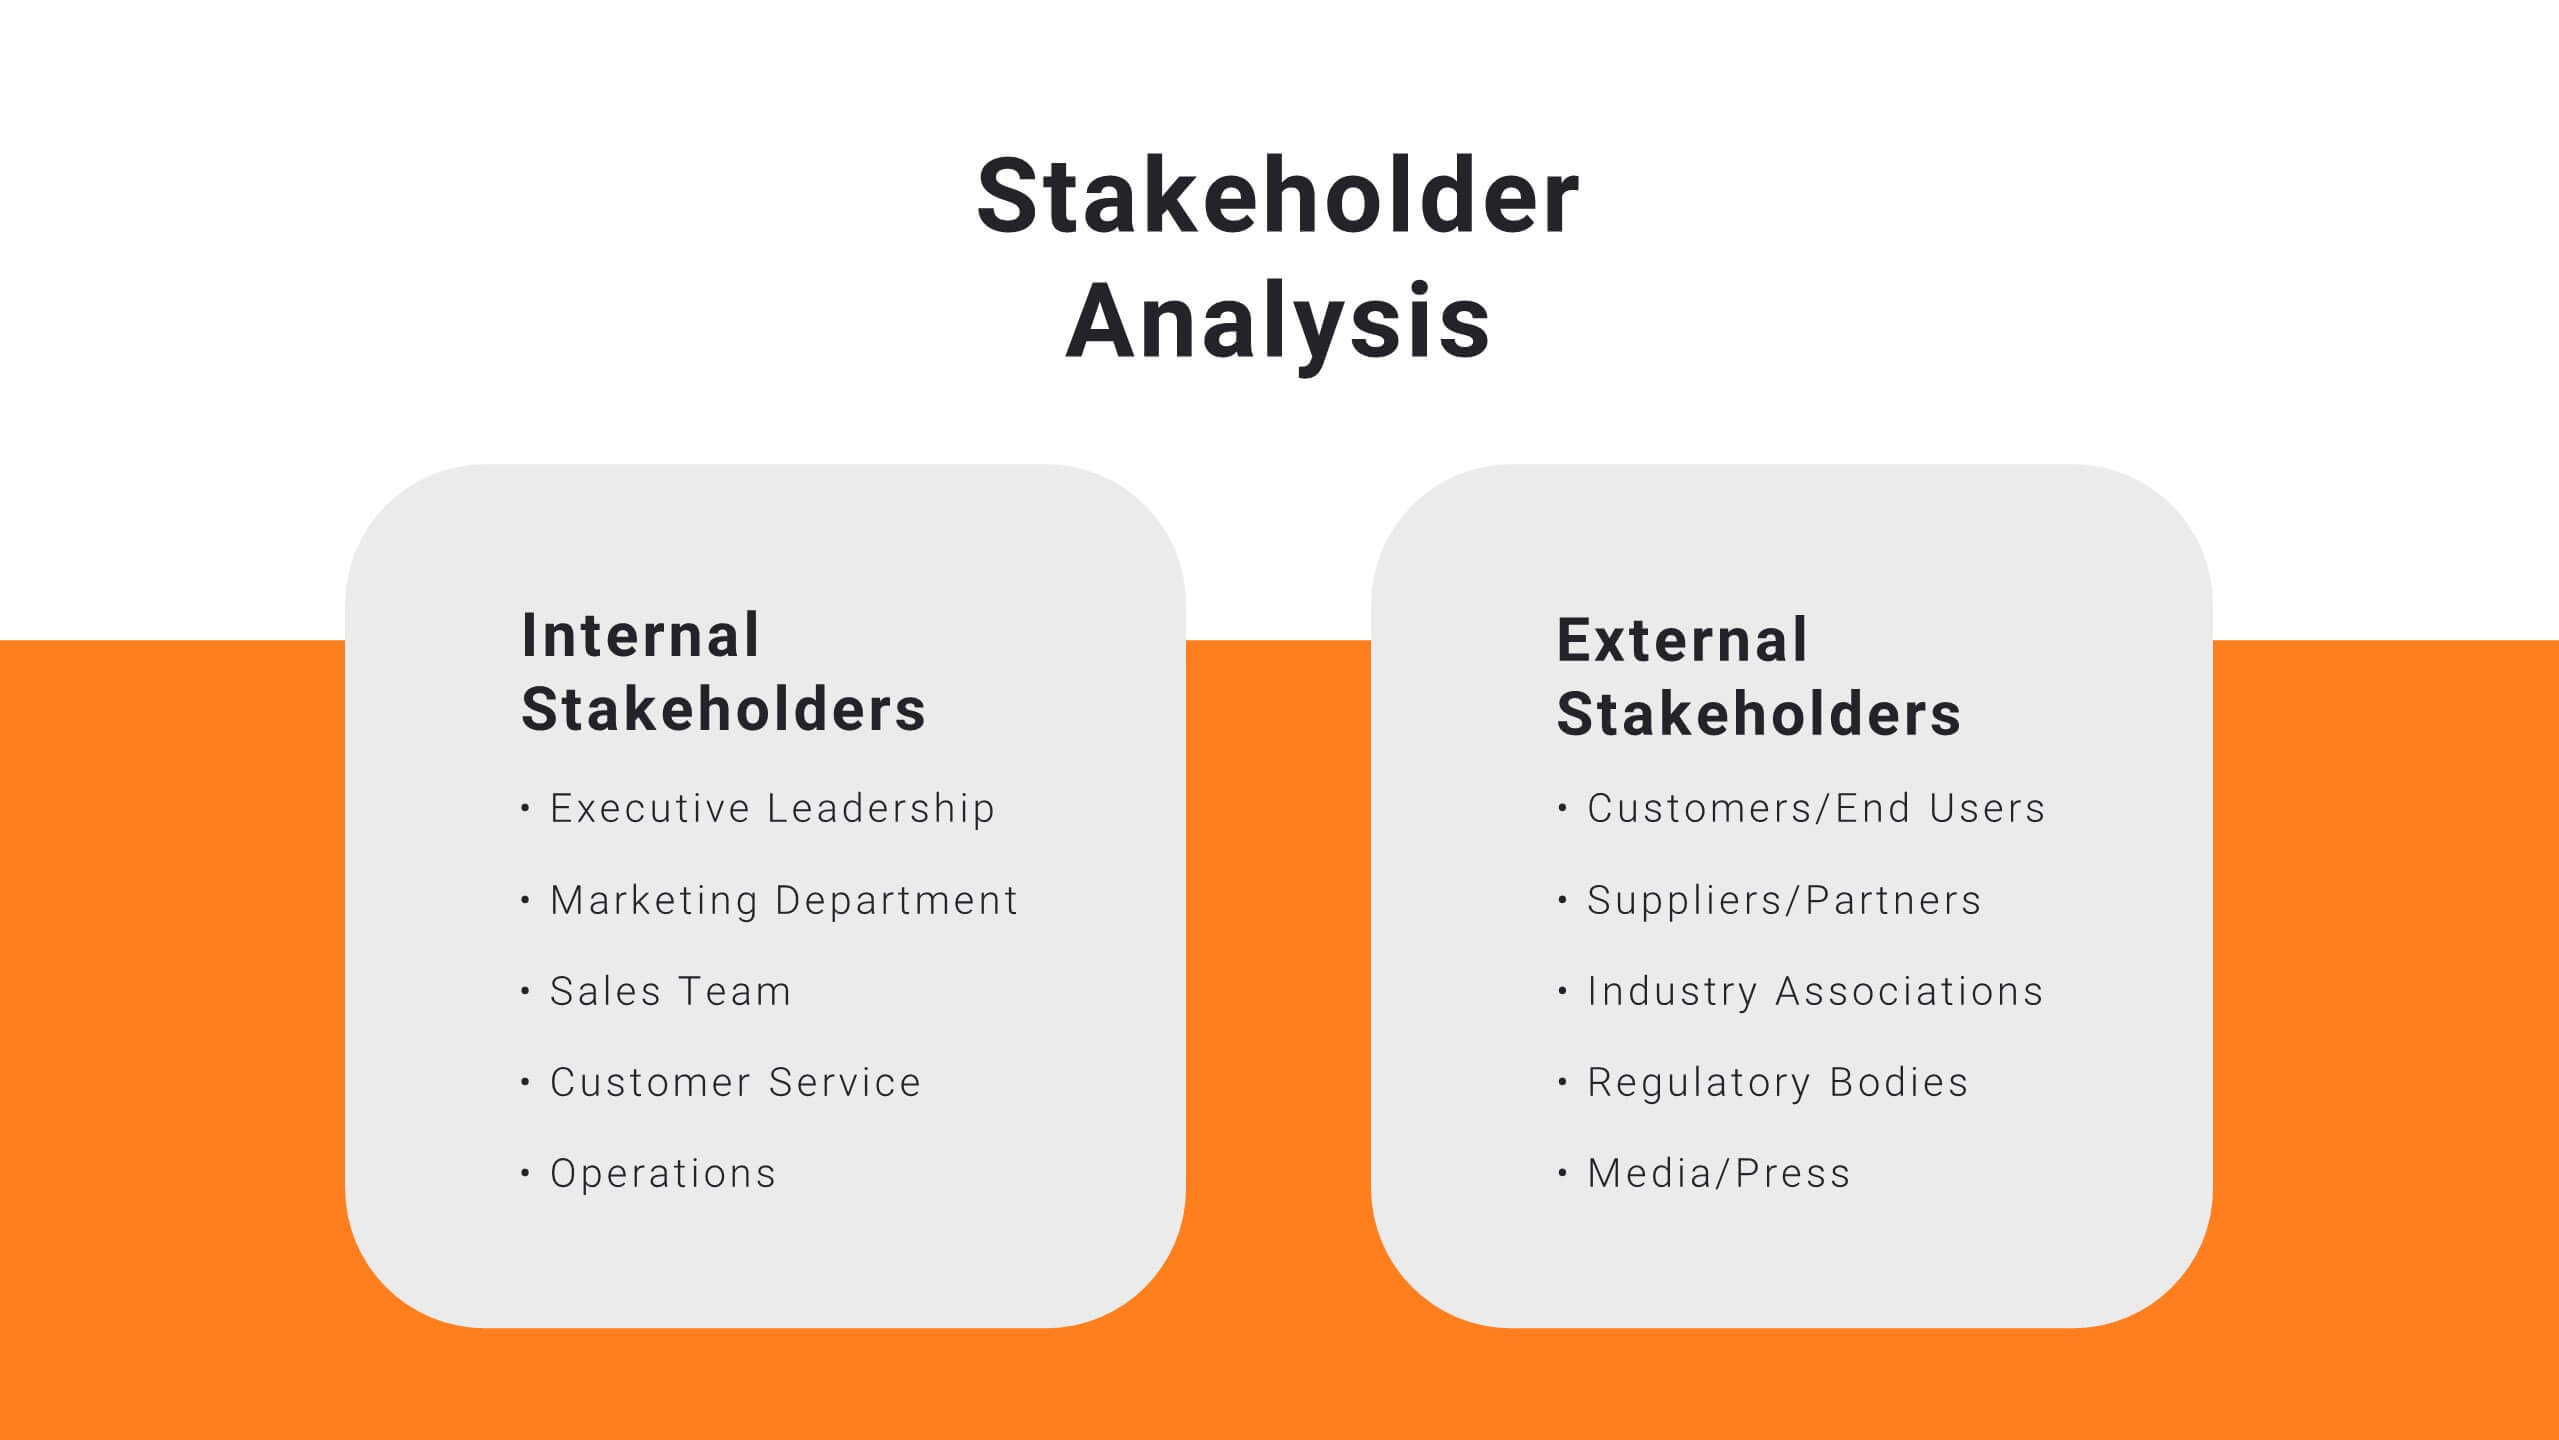
Harmony Project Management Plan Presentation
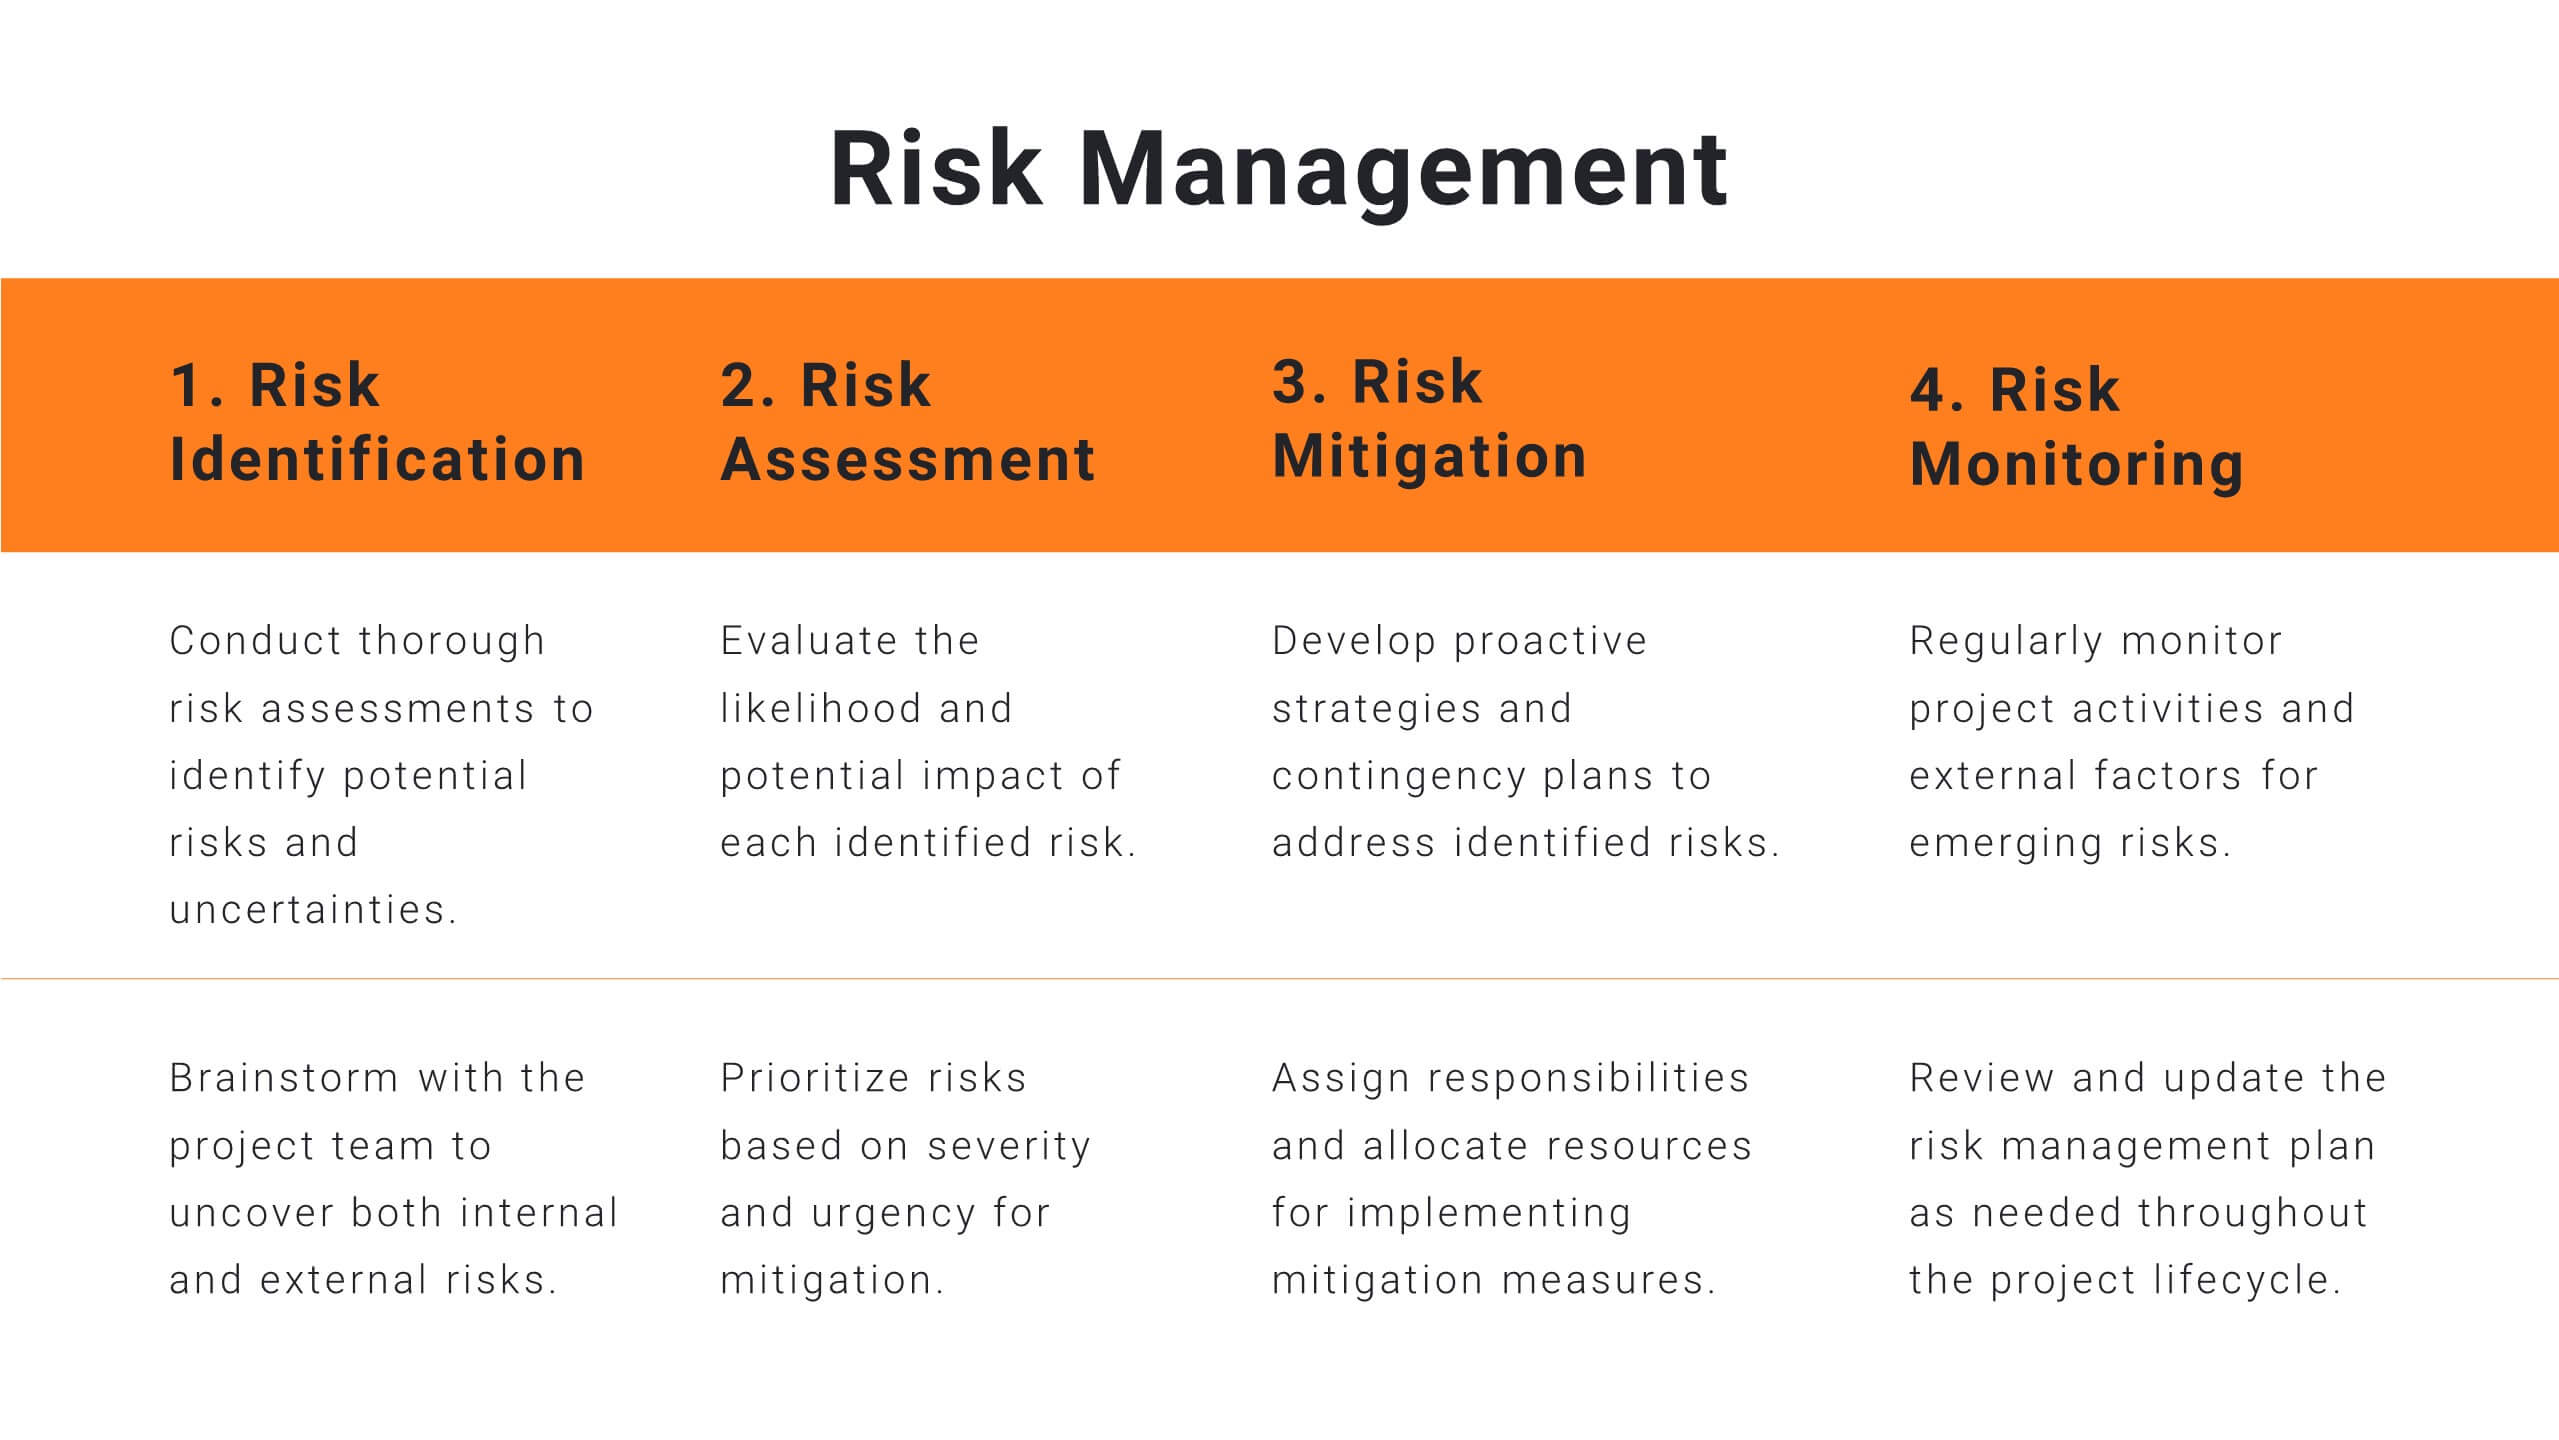
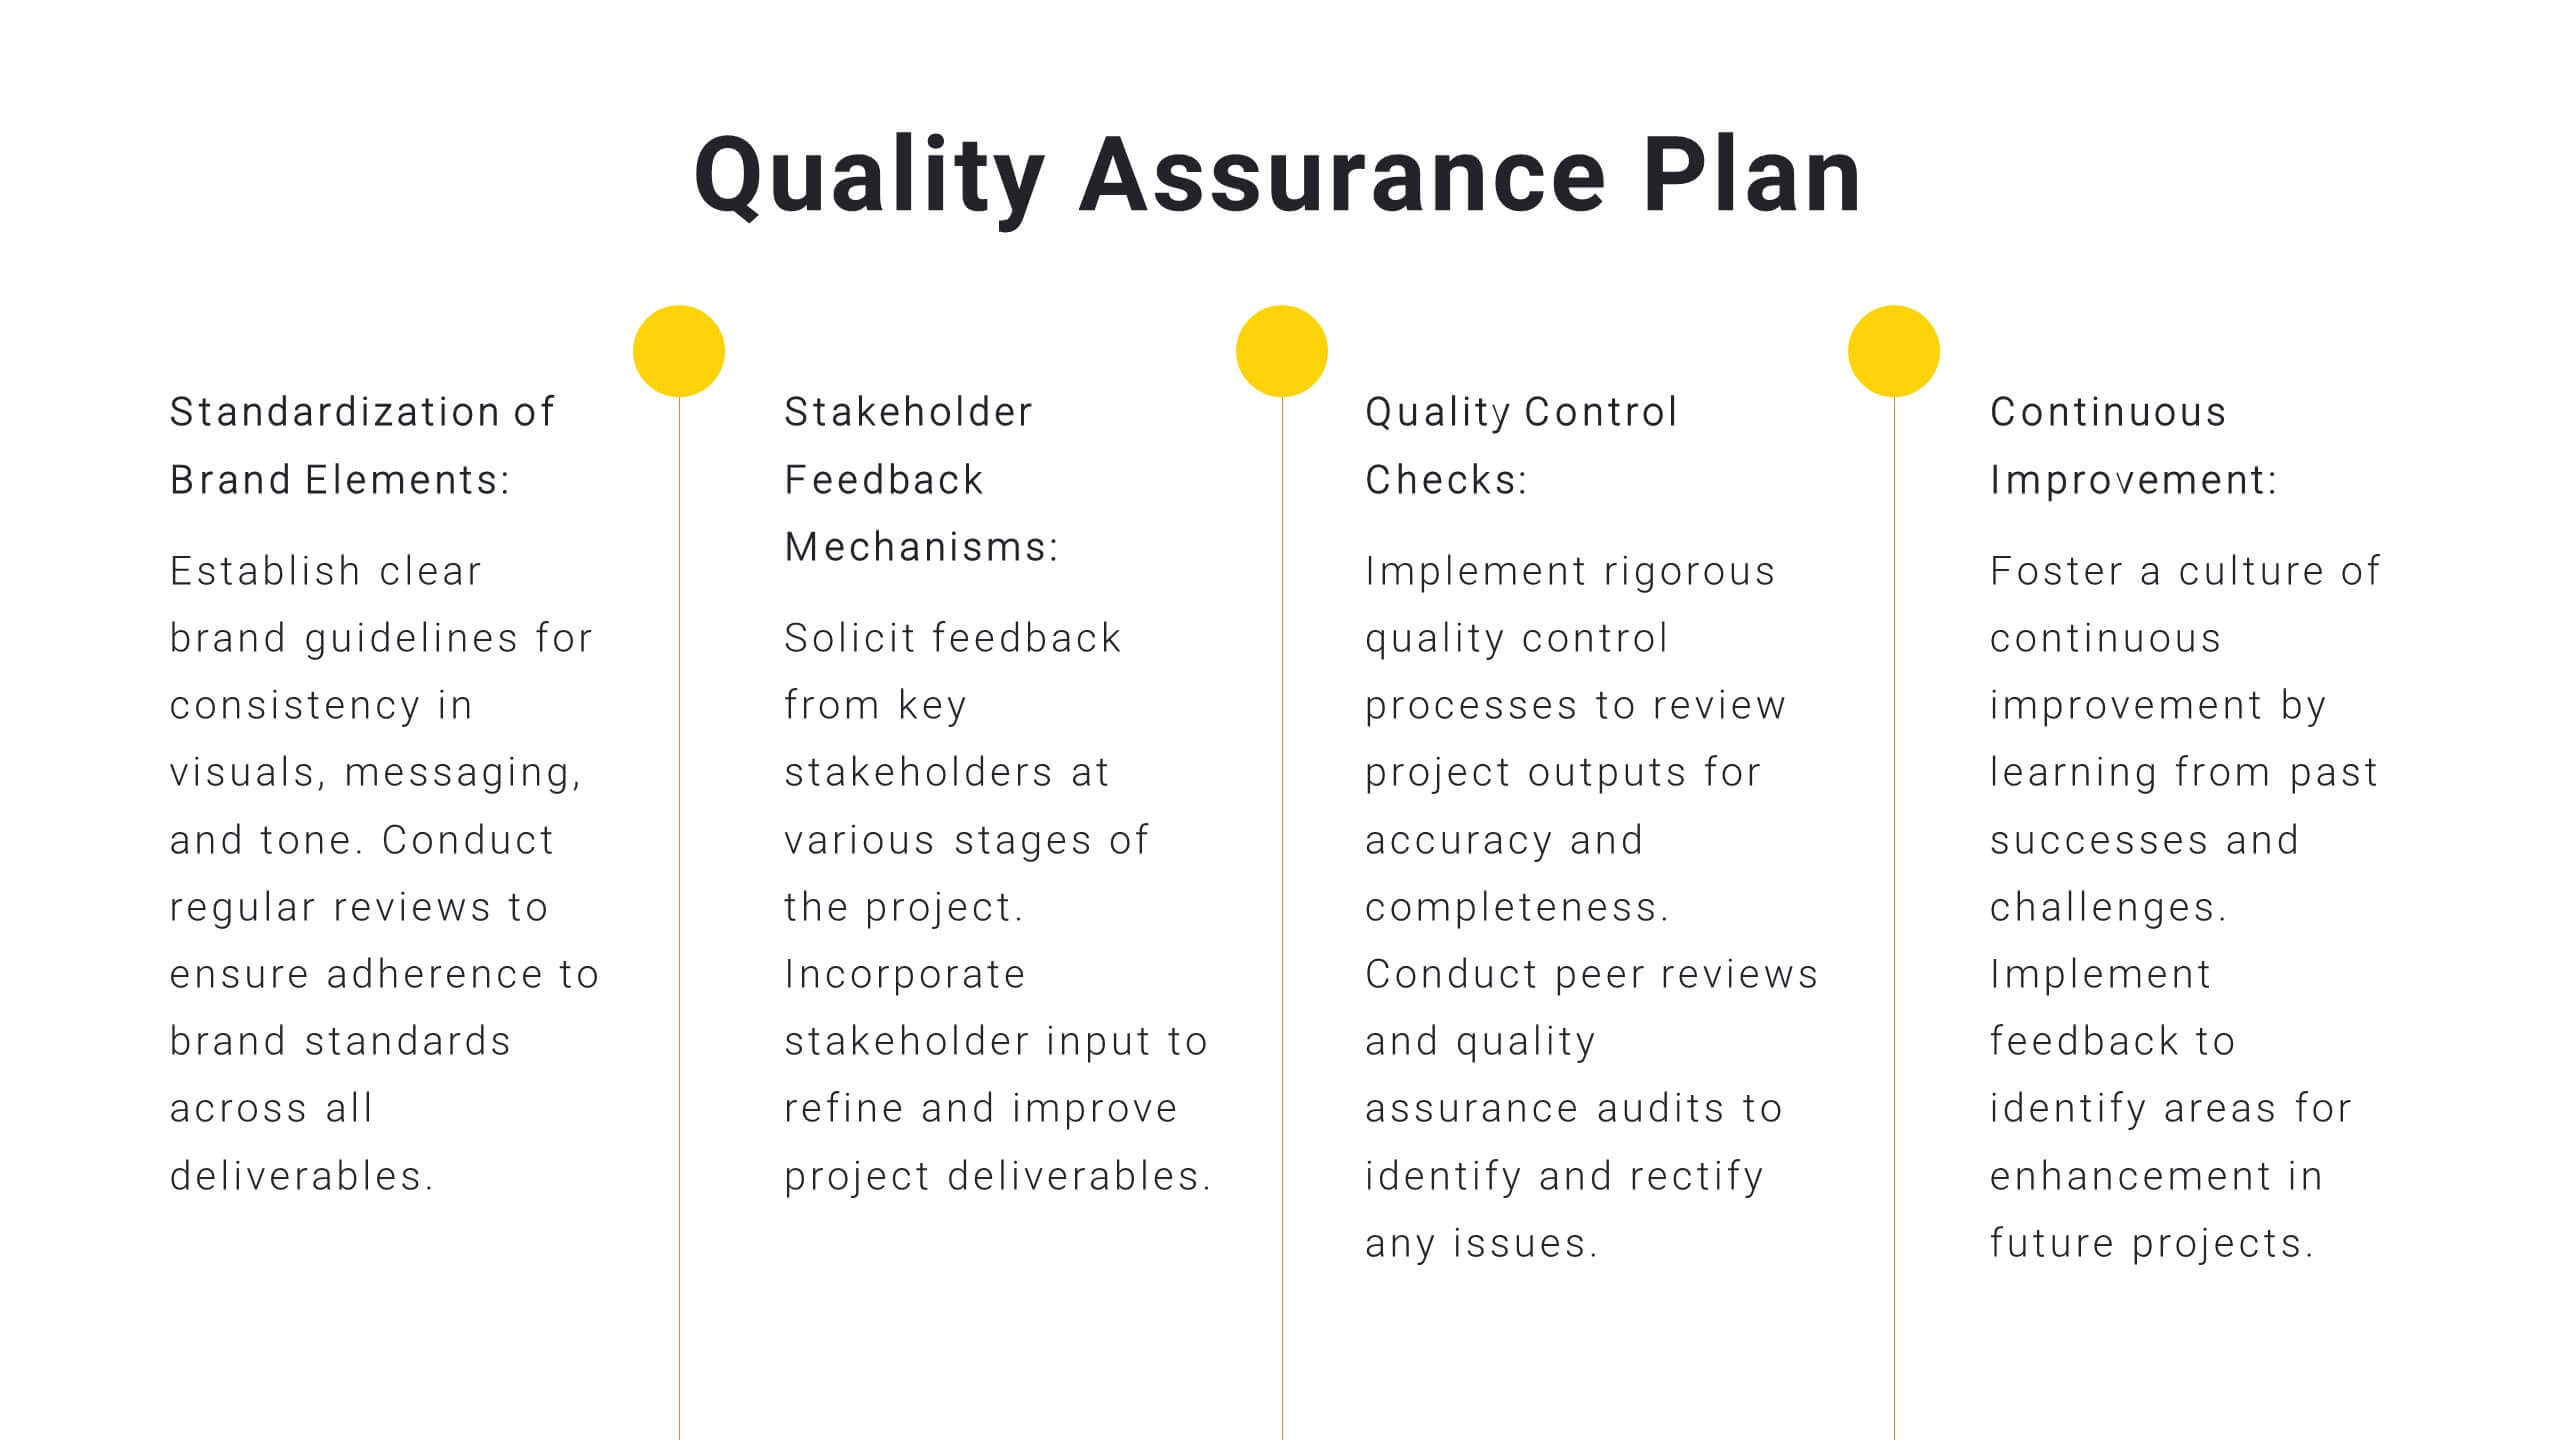
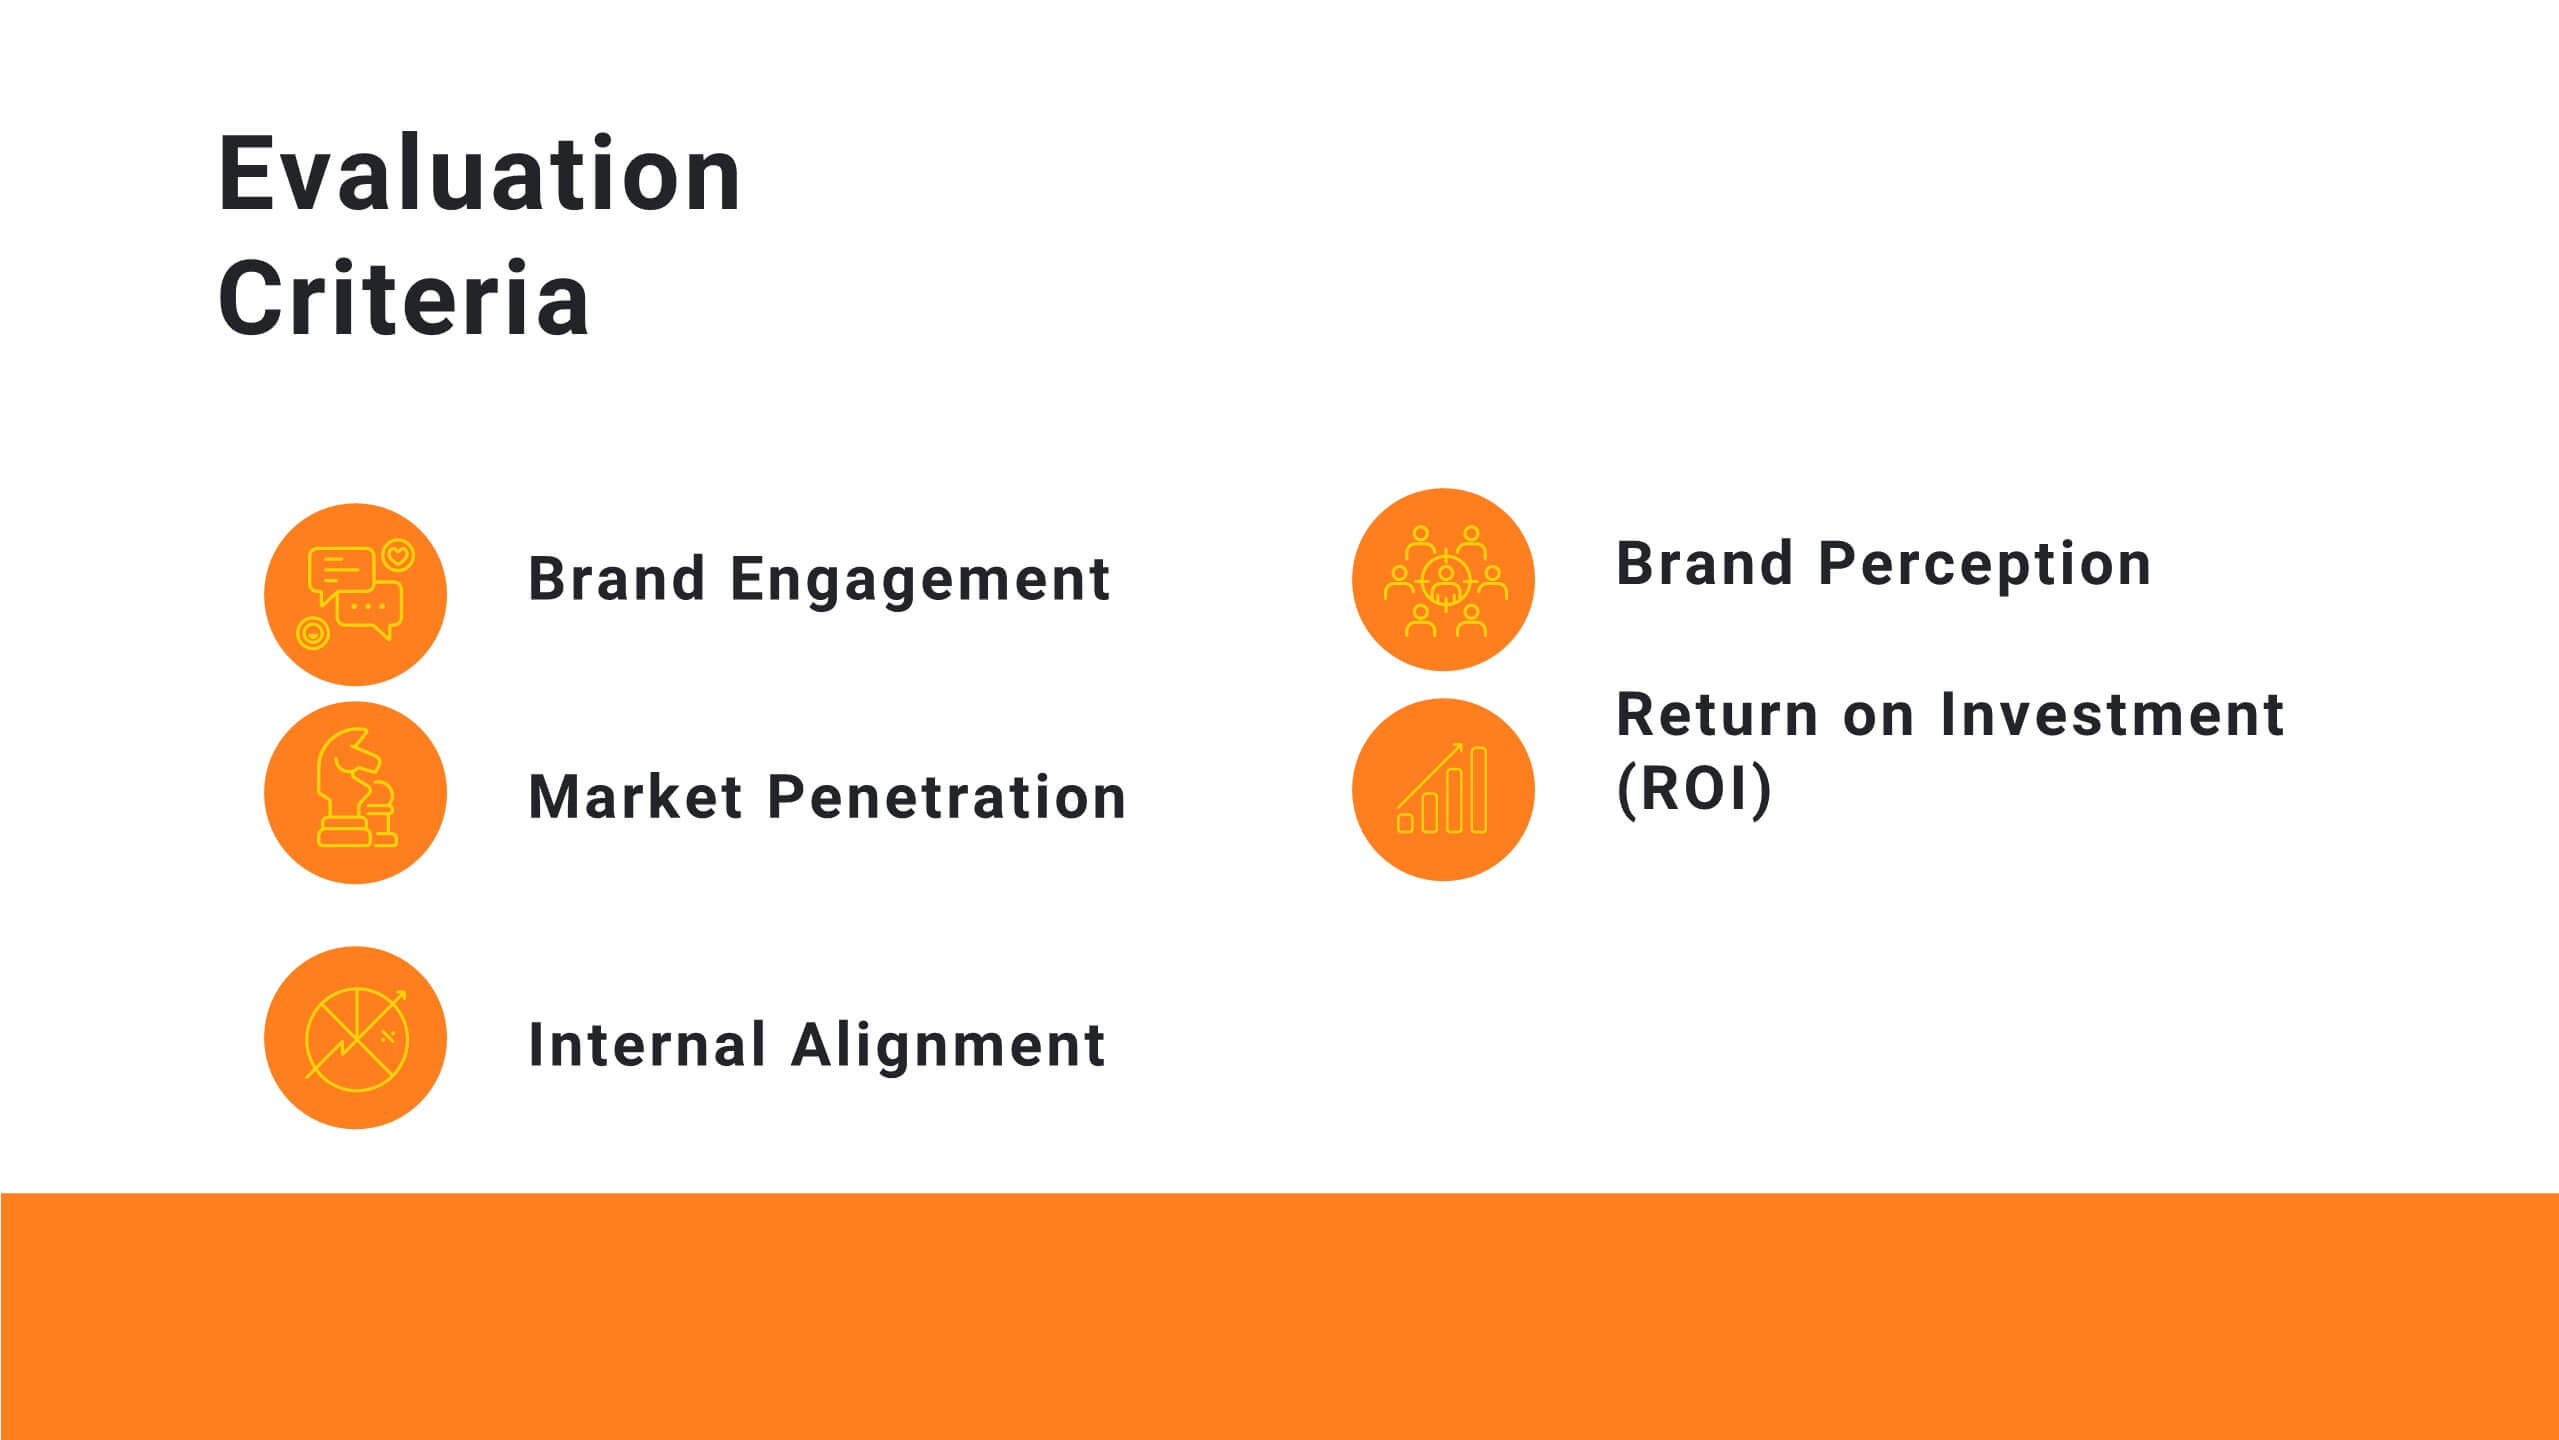
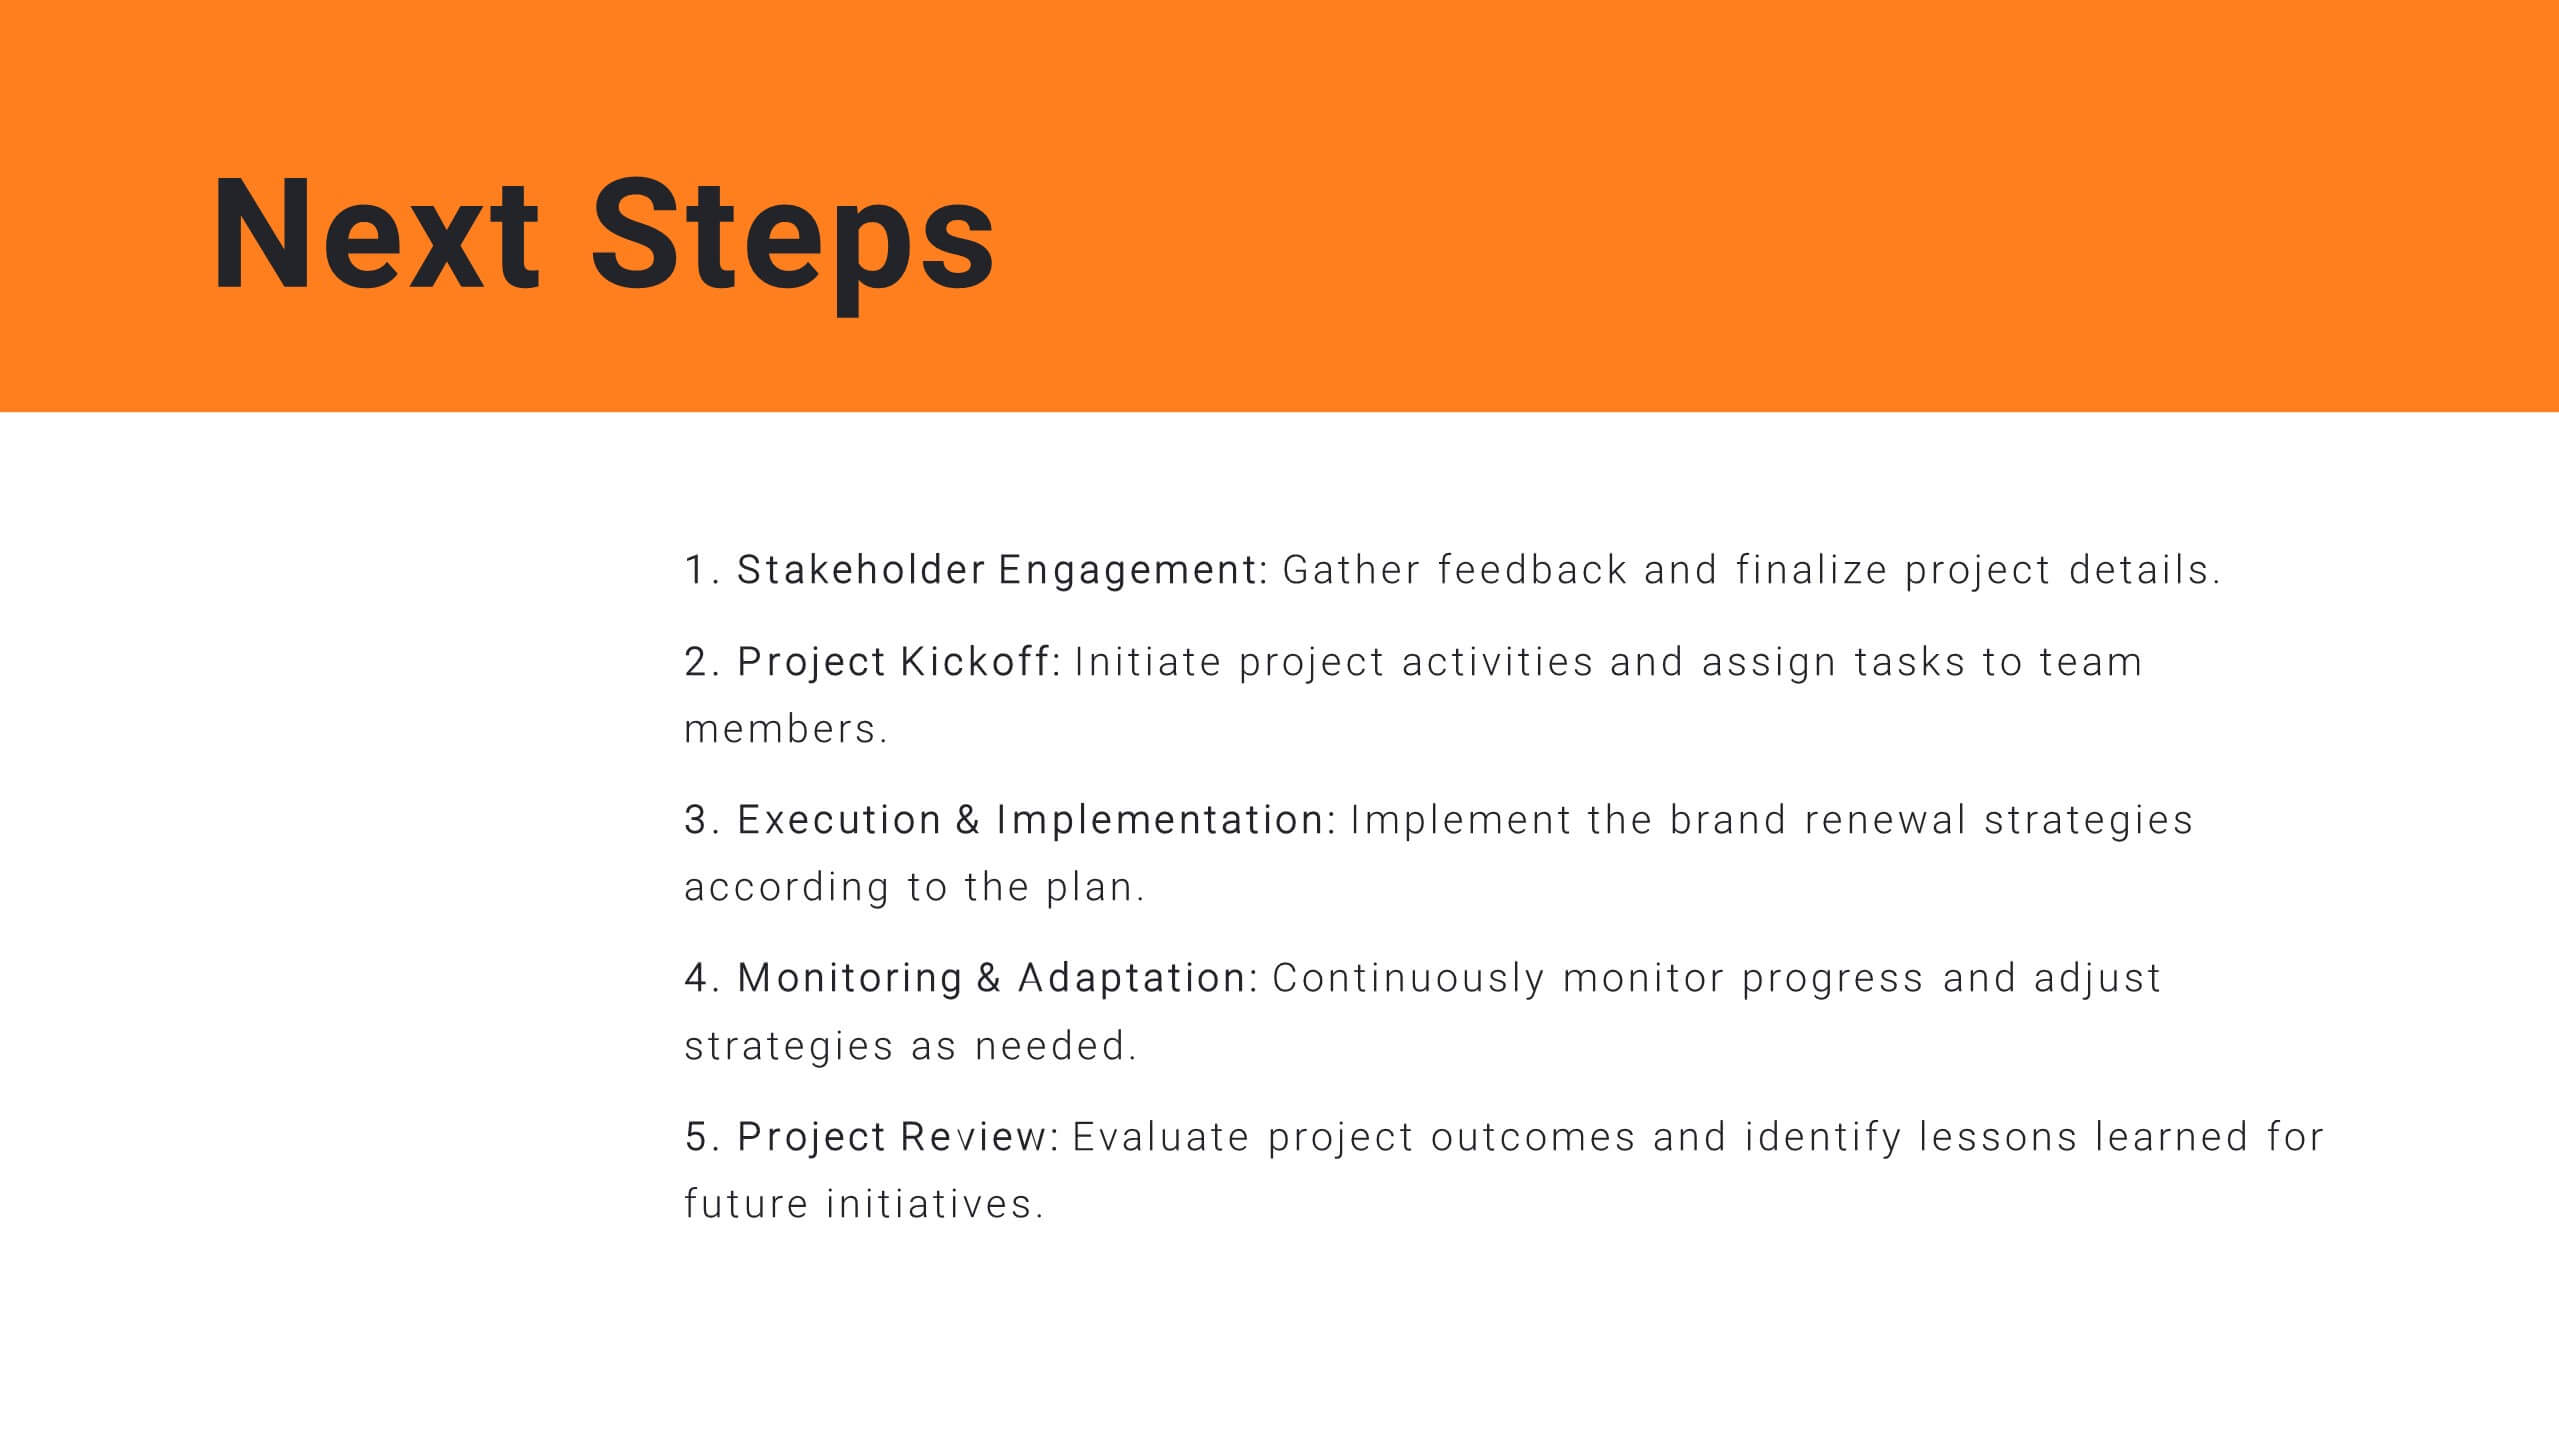
Plan your project efficiently with this comprehensive project management plan template! It covers all essential aspects including timeline, budget, resource allocation, and risk management. Ensure smooth project execution and achieve your objectives. Compatible with PowerPoint, Keynote, and Google Slides, it's designed to streamline your project planning and management process.


20 slides
Stratoshade Project Proposal Presentation
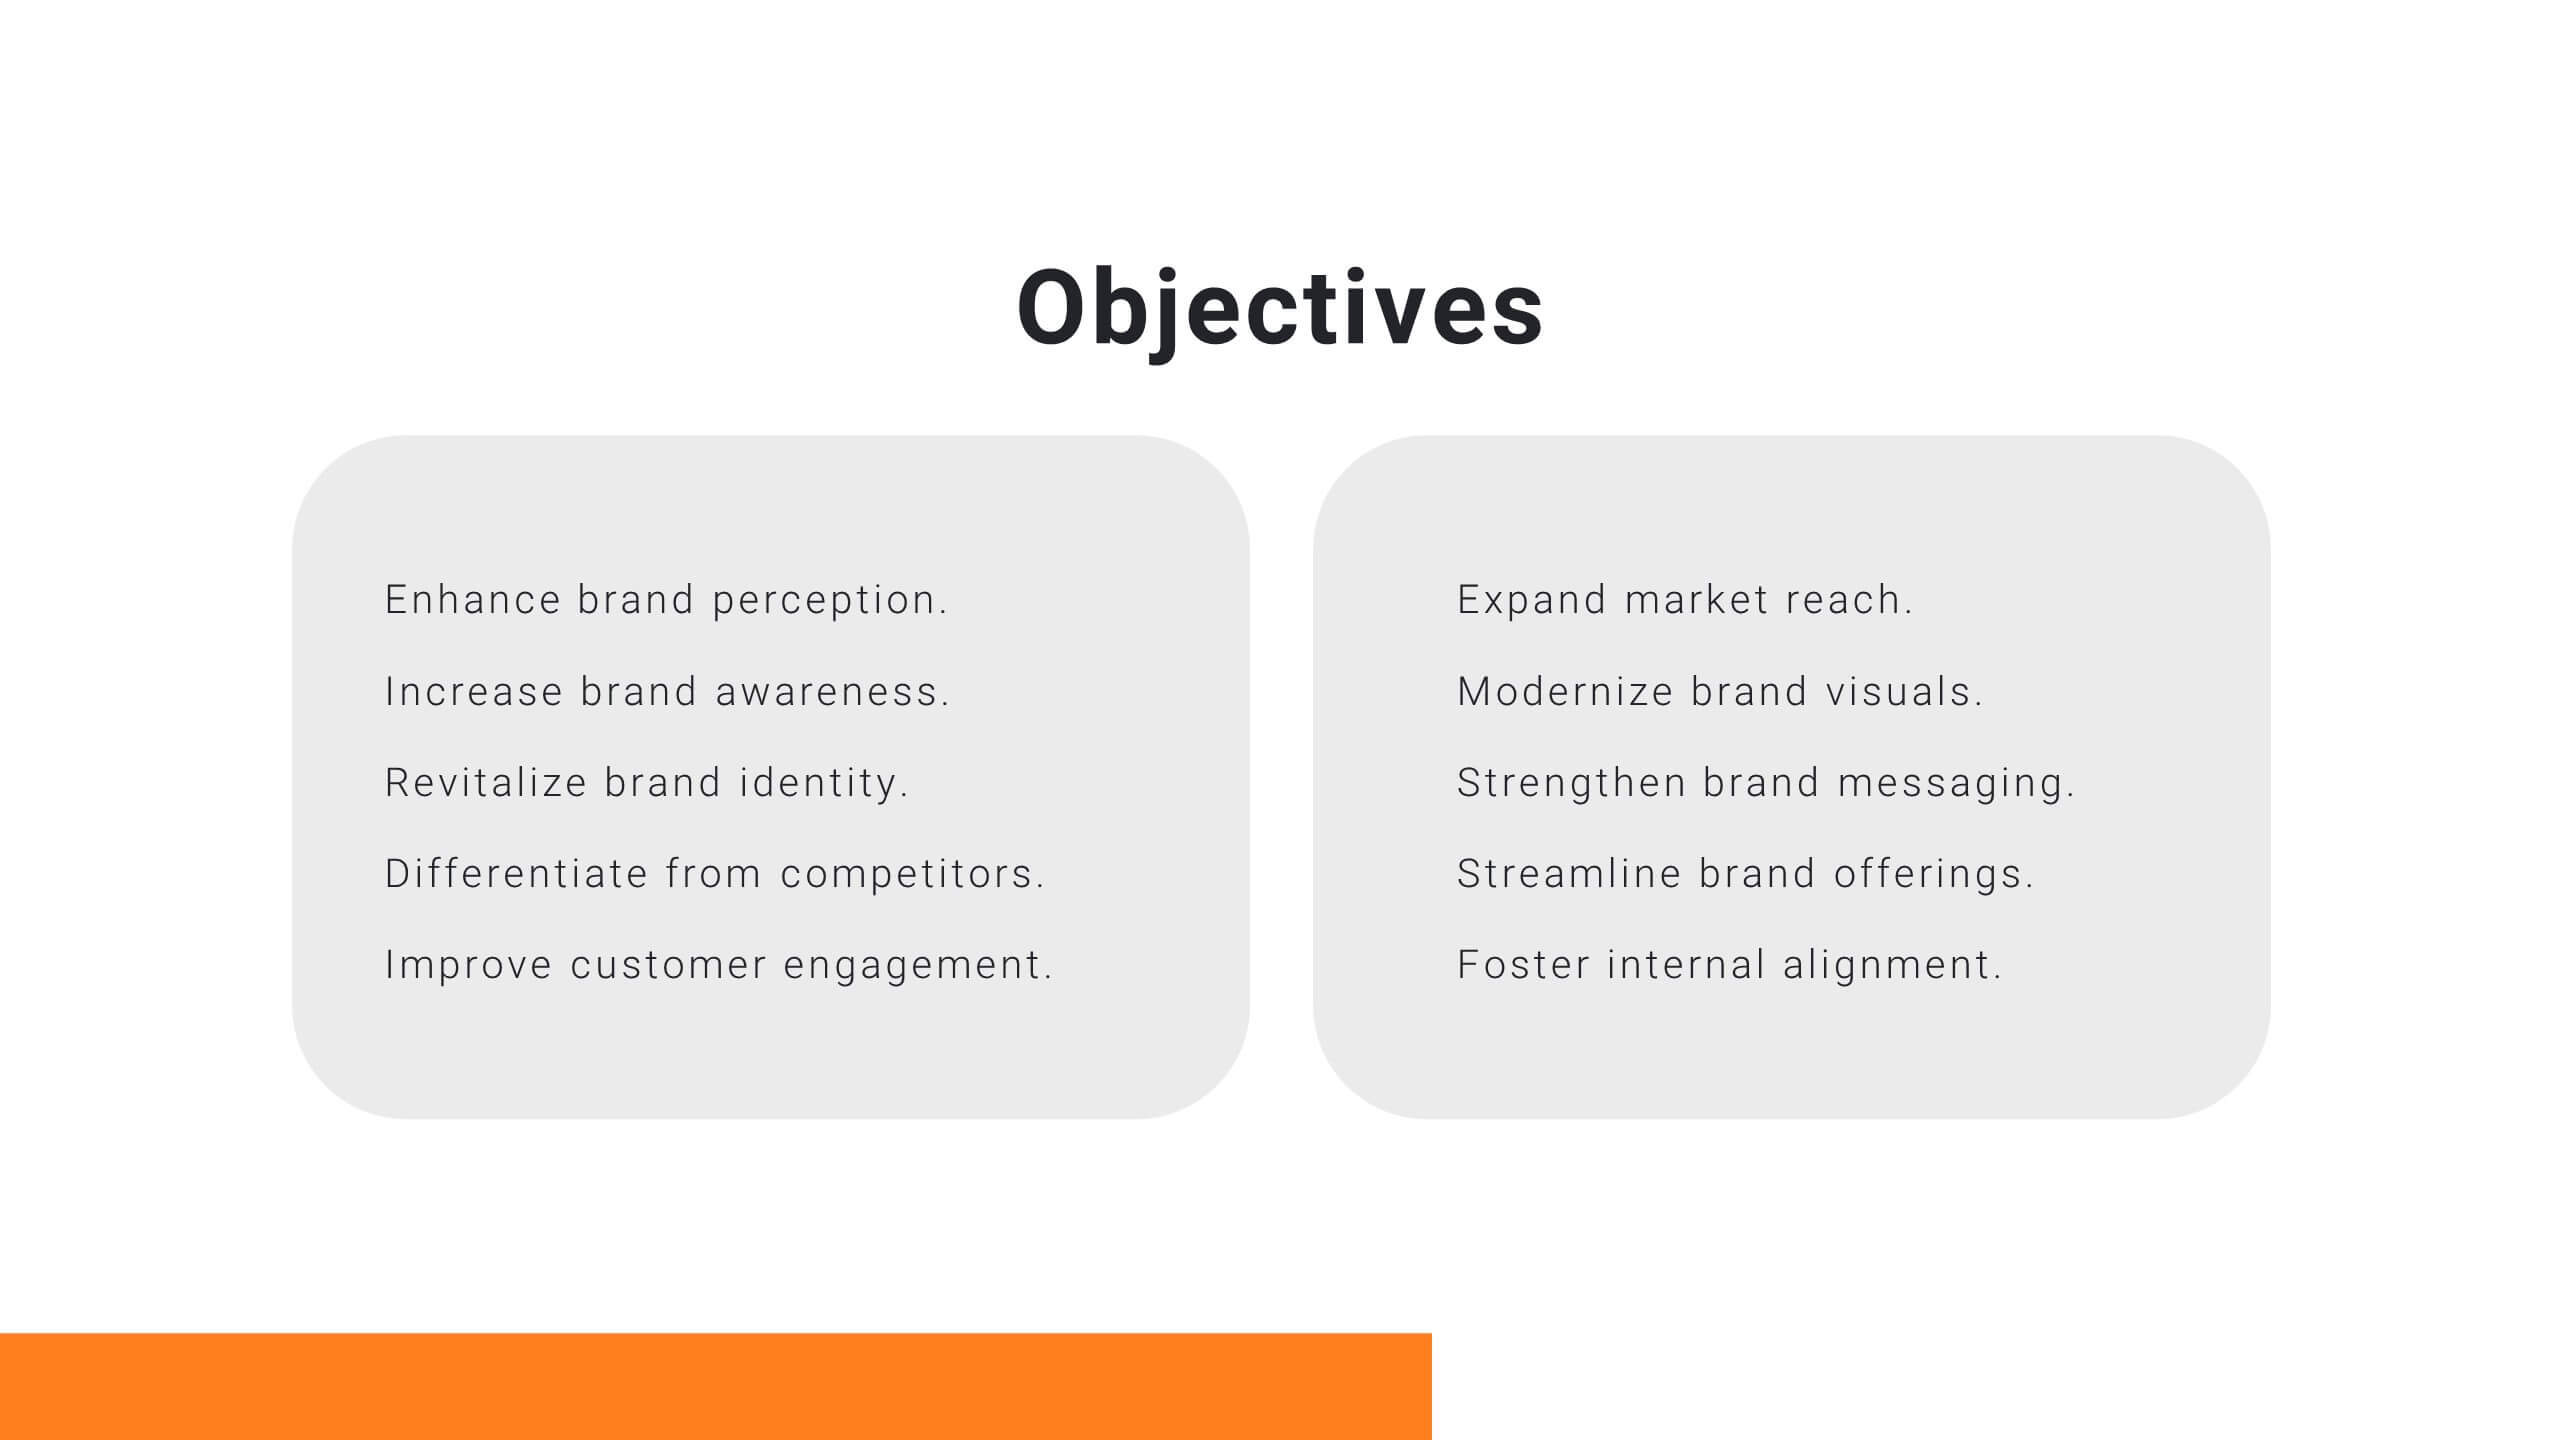
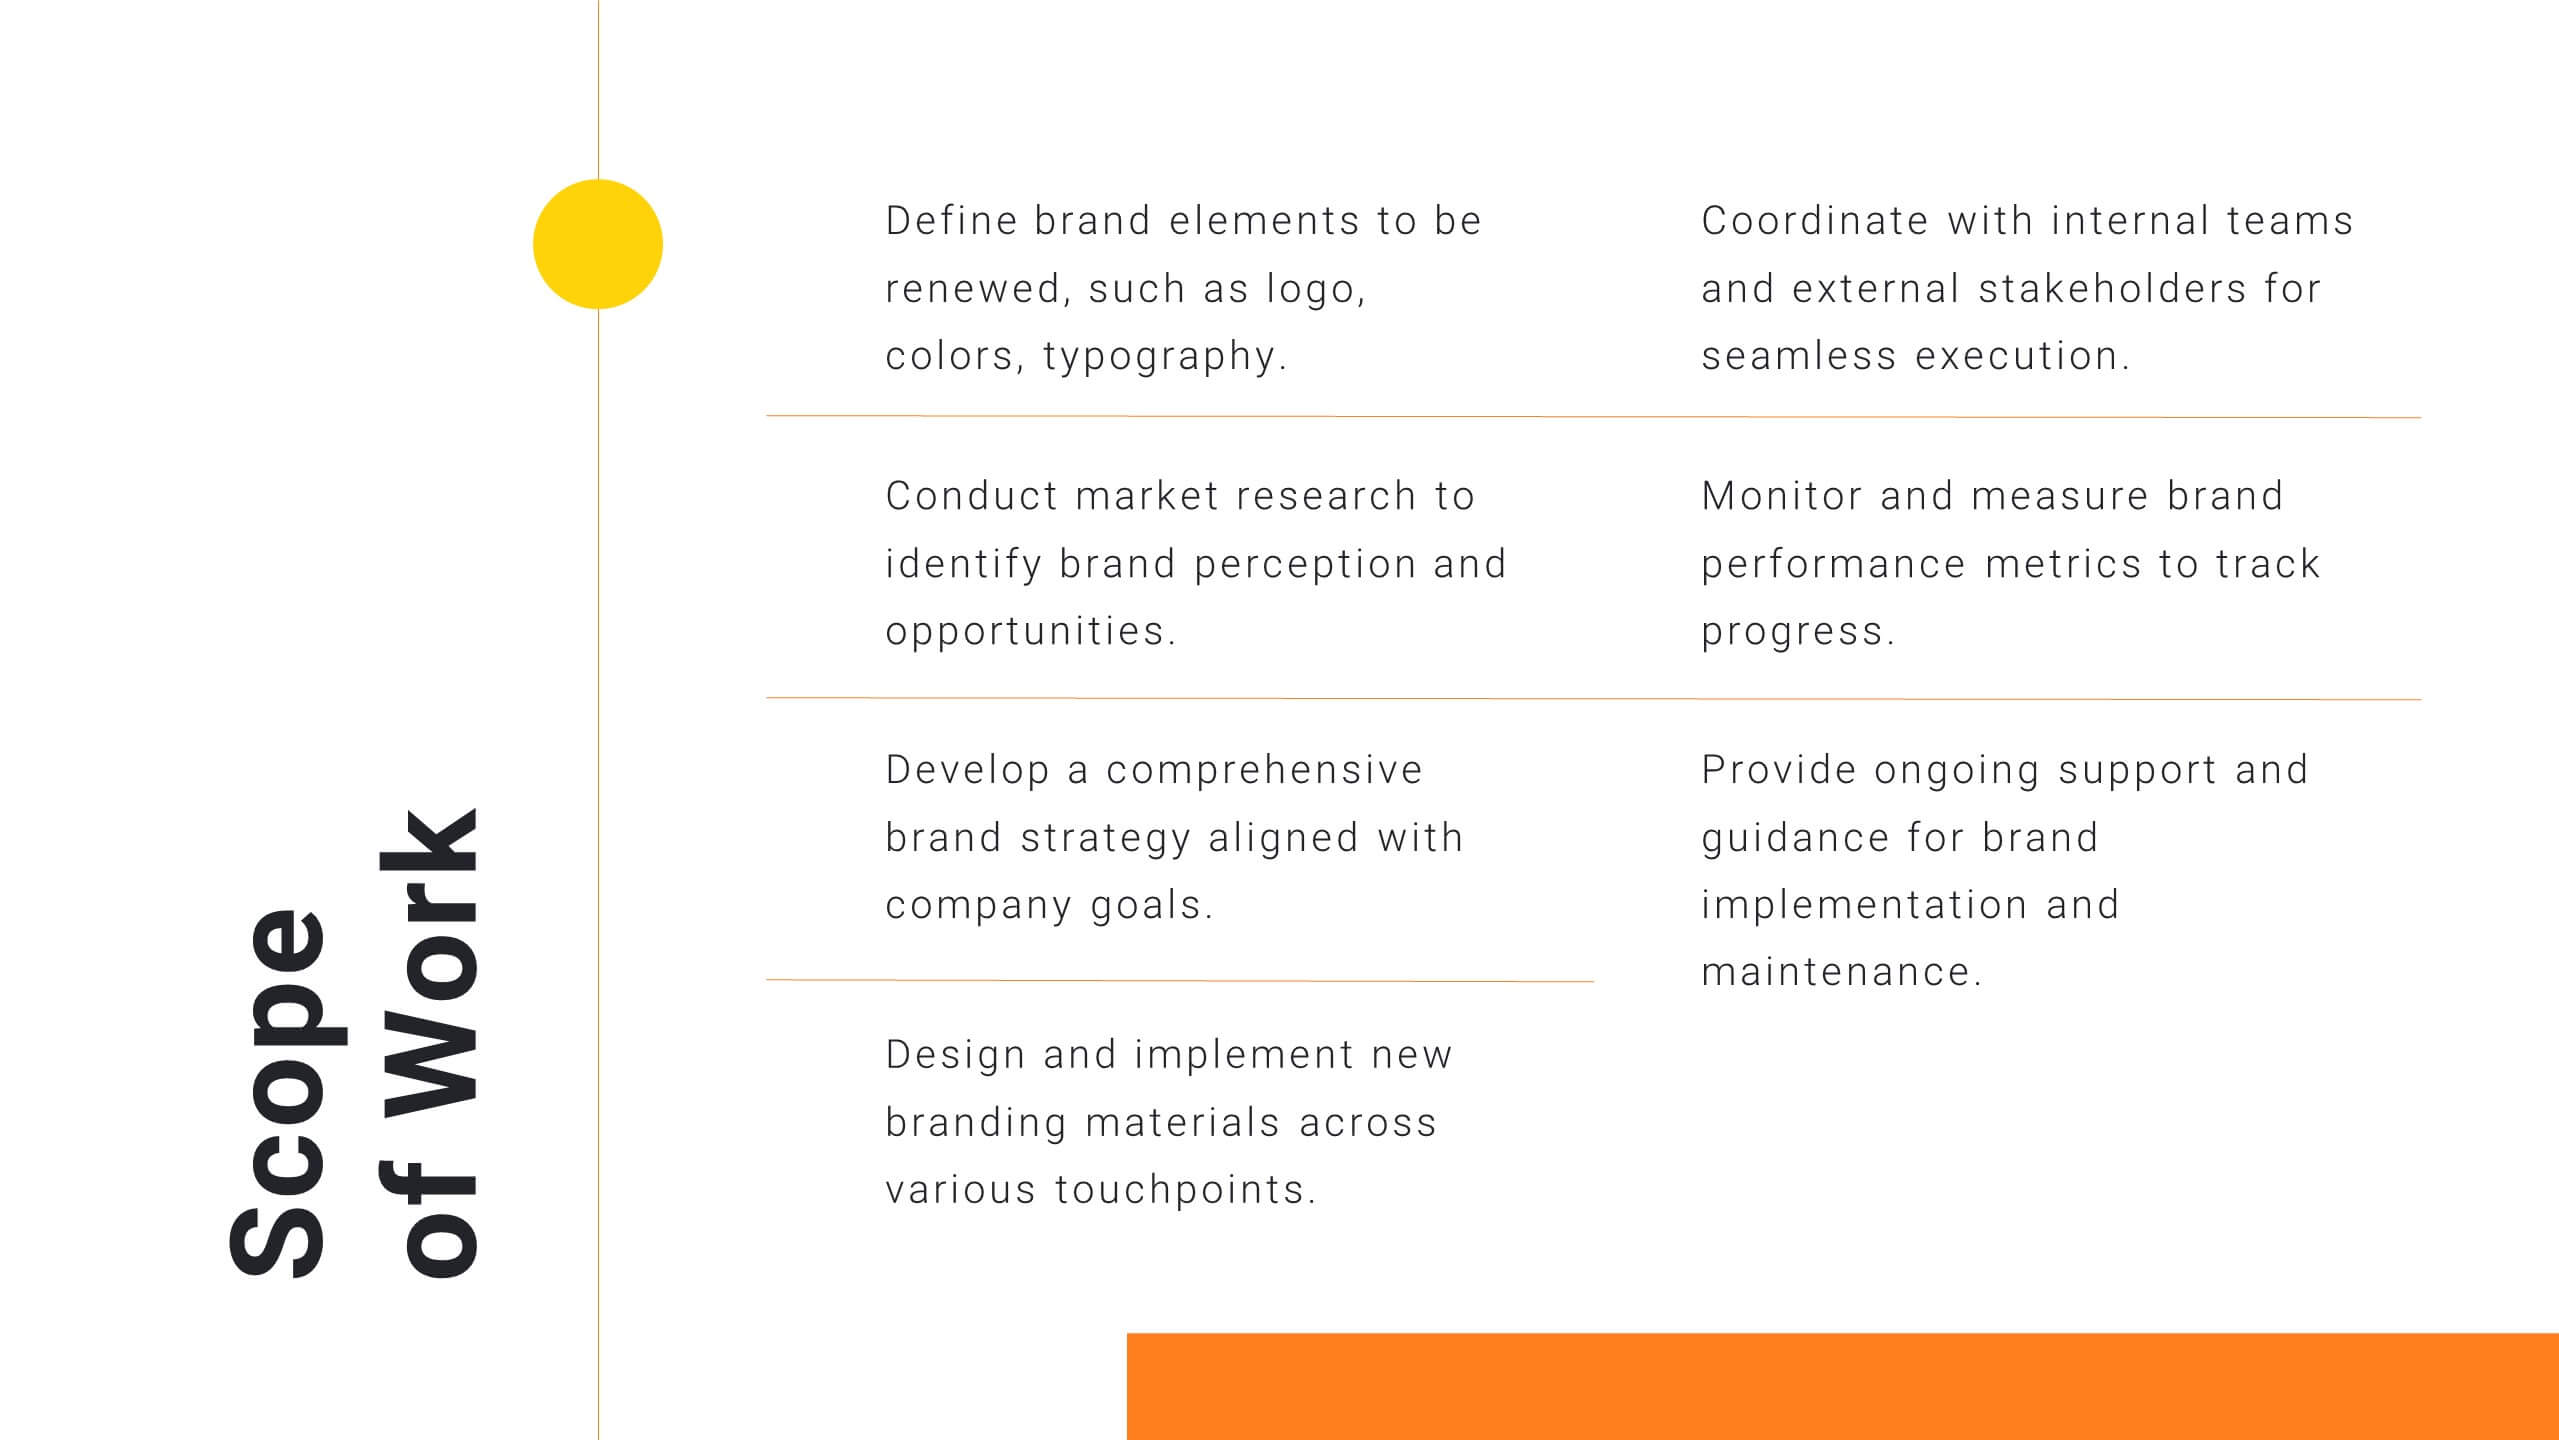
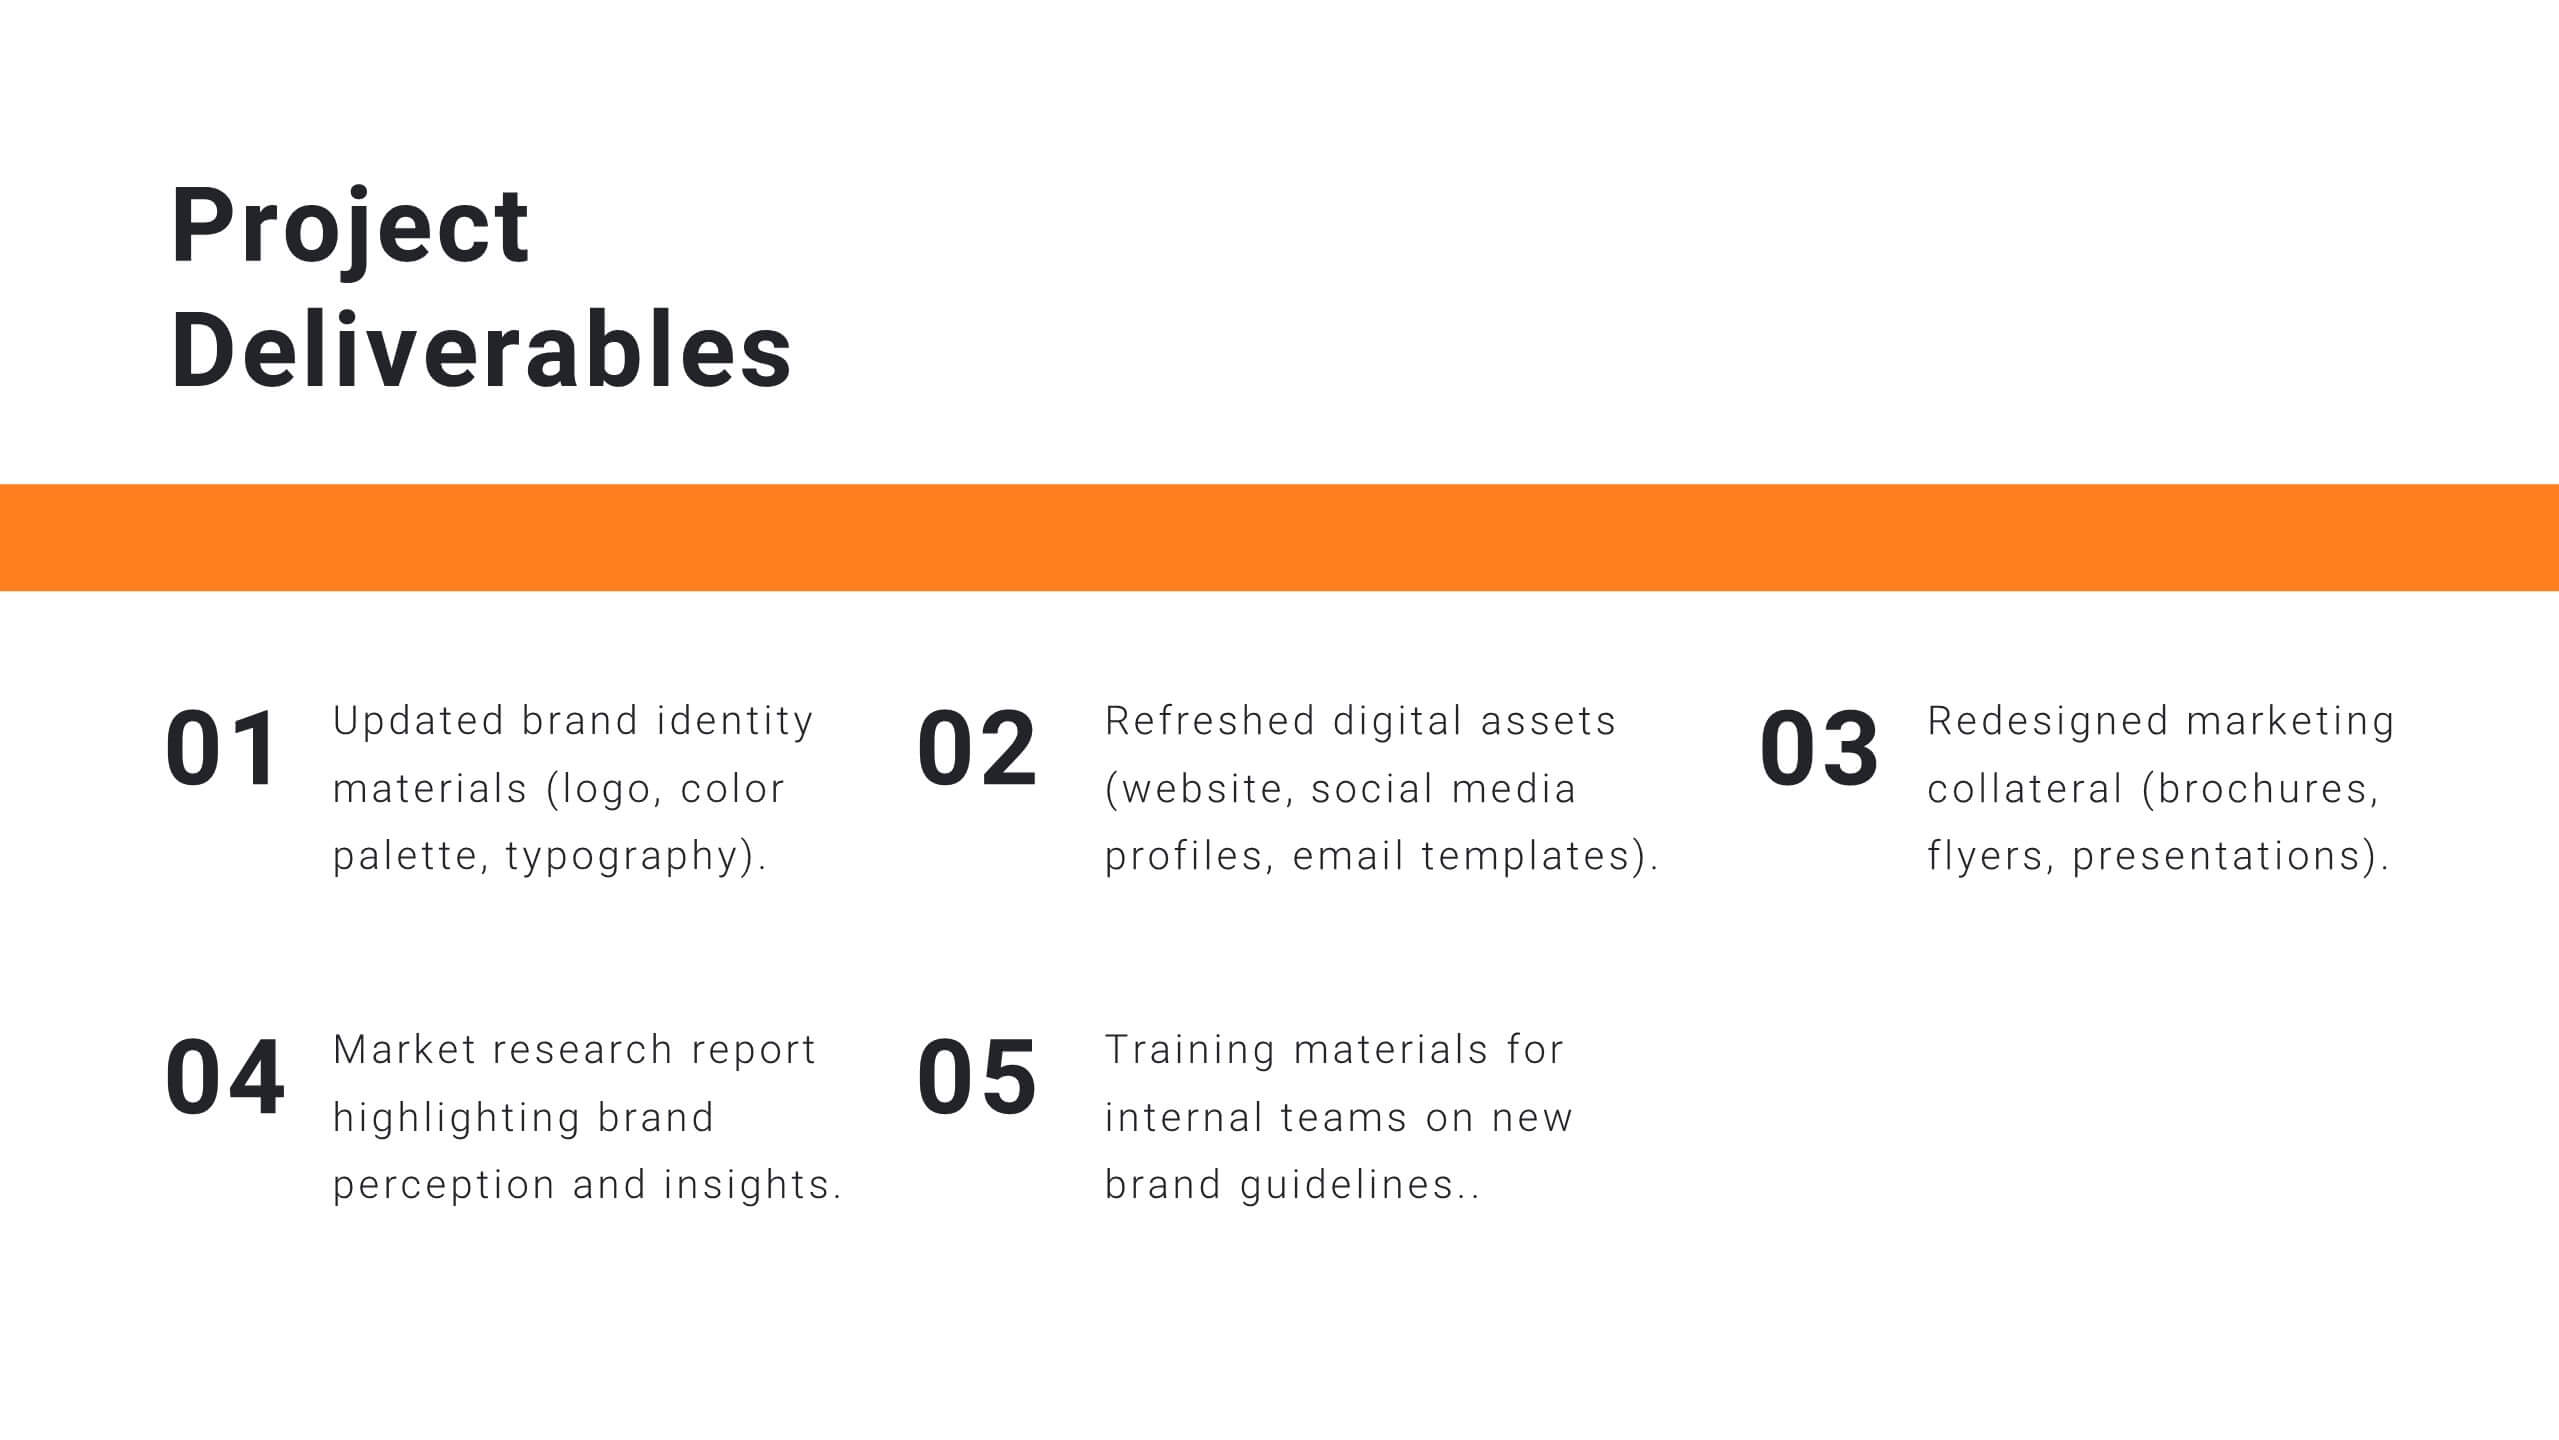
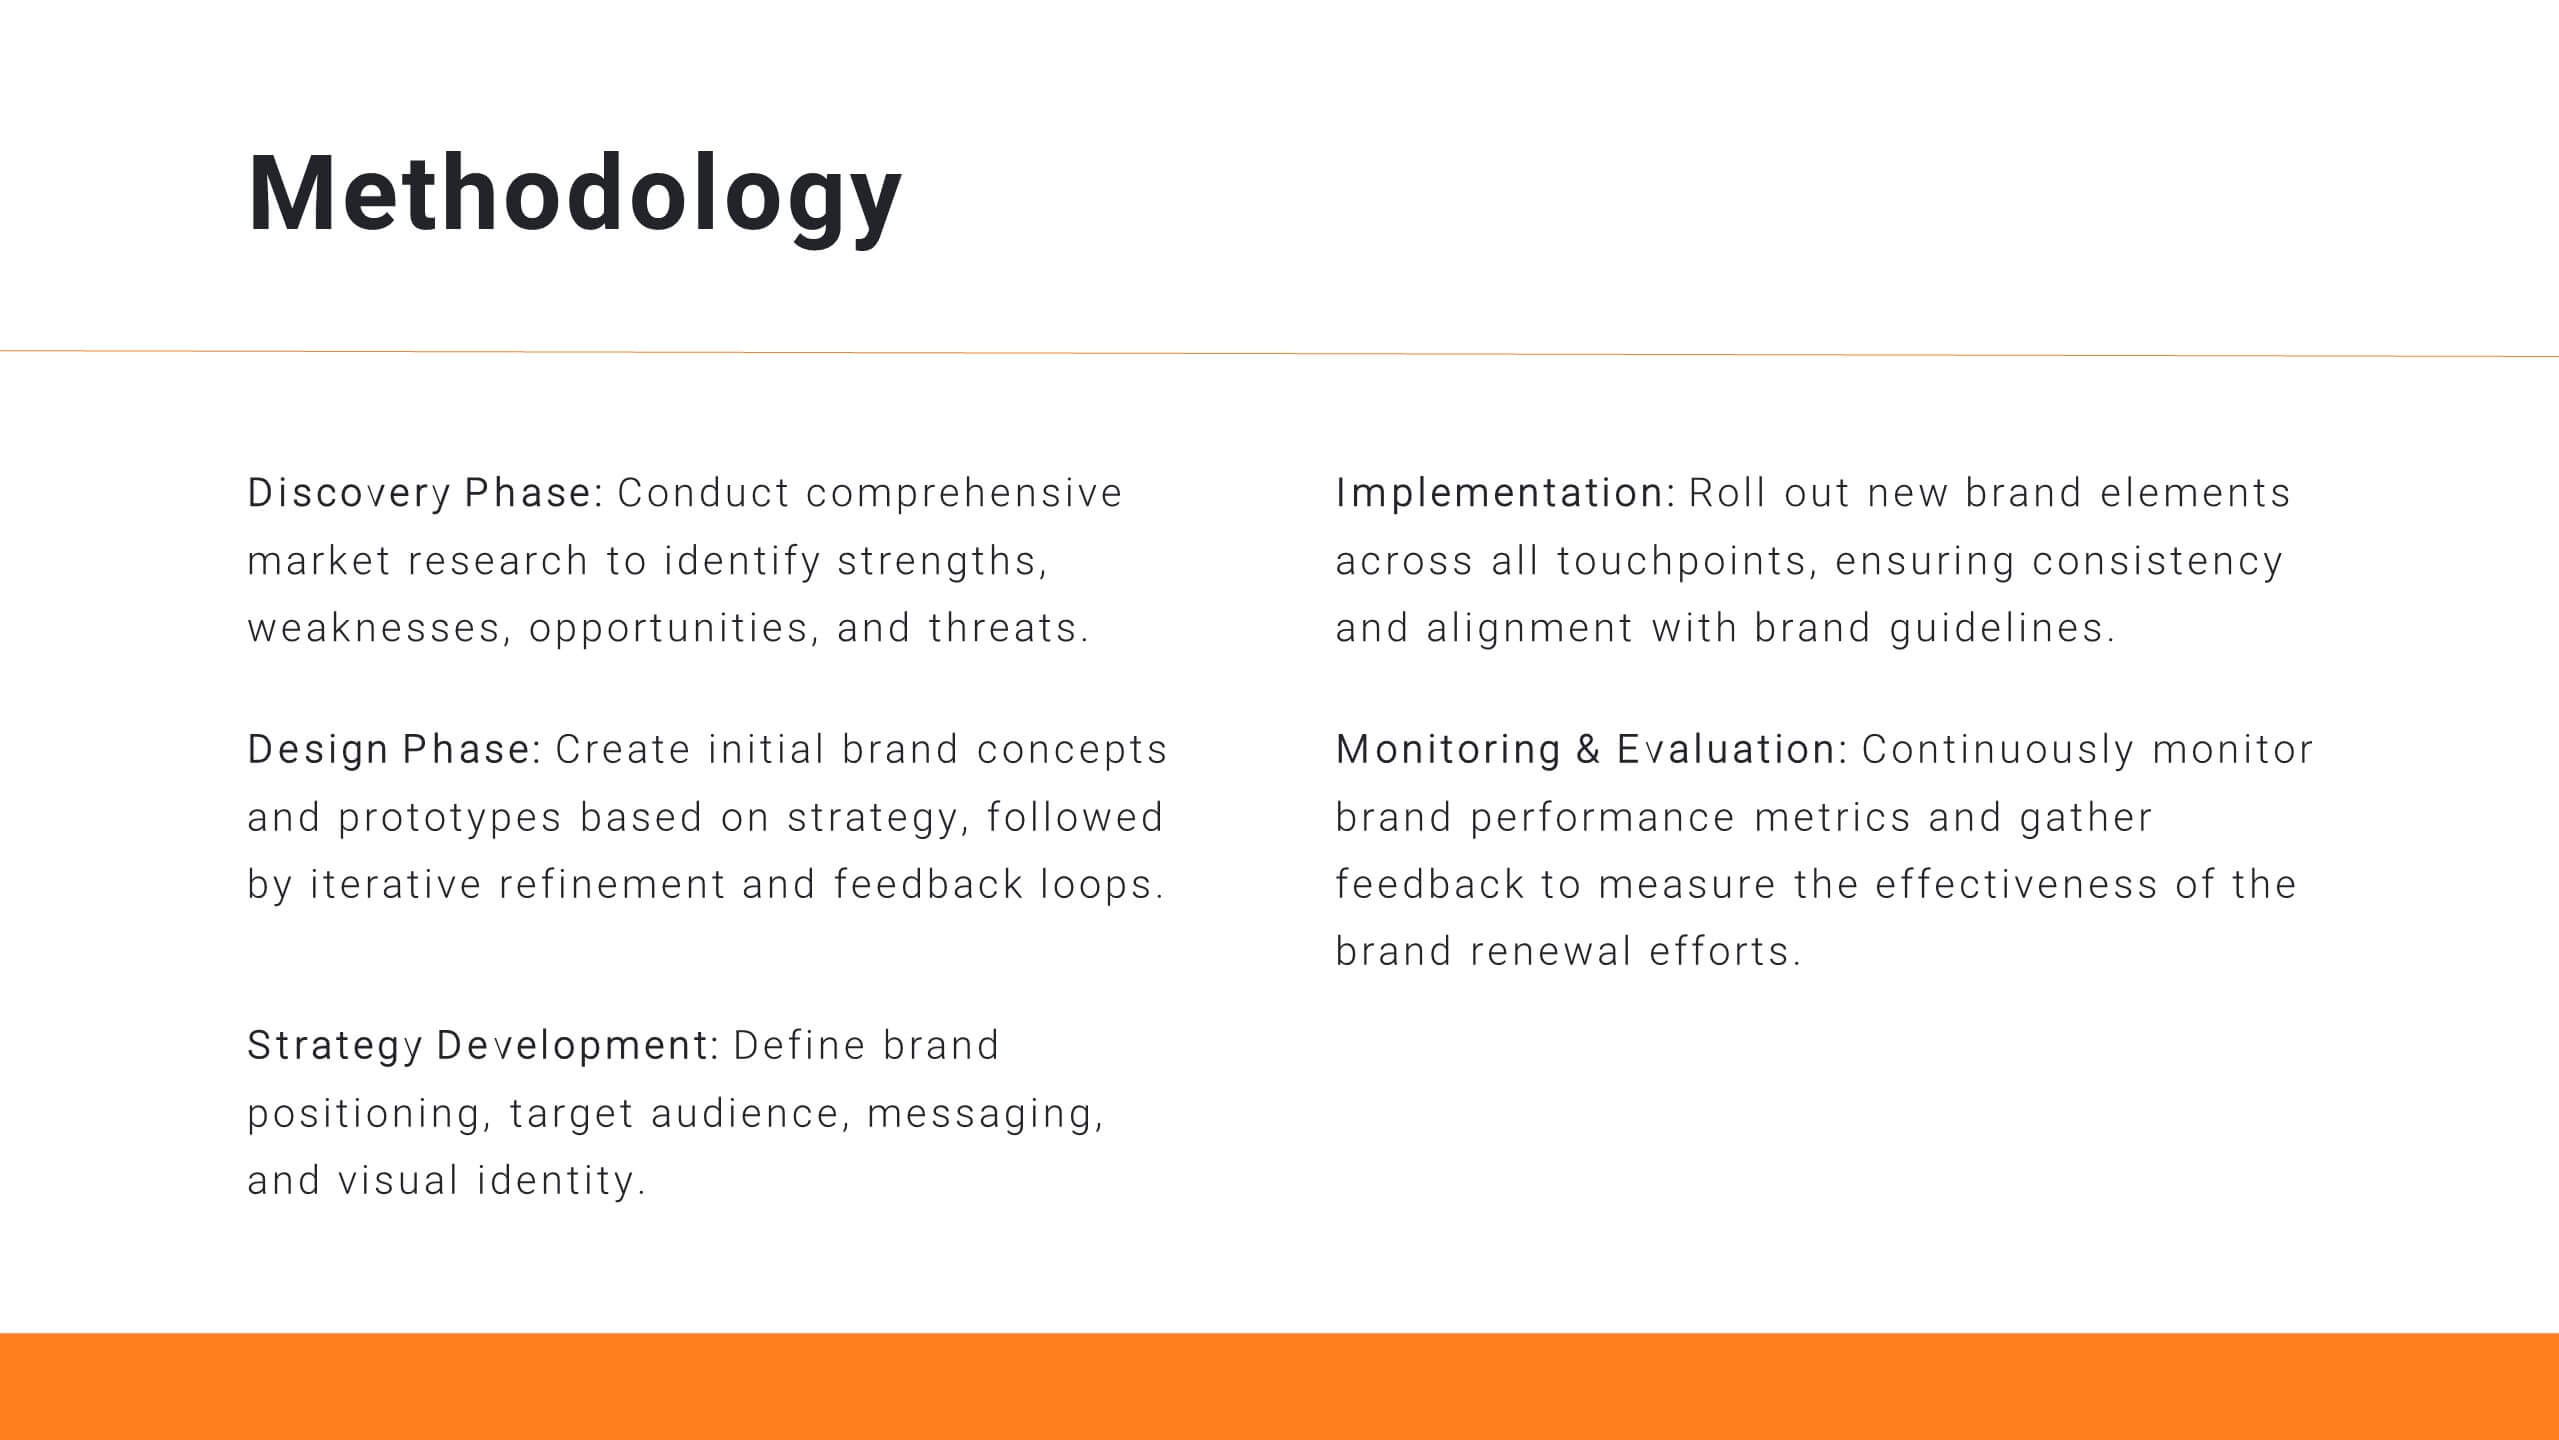
Present a comprehensive project proposal with this template, featuring sections for introduction, objectives, methodology, deliverables, budget breakdown, and client testimonials. Clearly outline goals, timeline, pricing, and risk mitigation strategies. Perfect for PowerPoint, Keynote, and Google Slides, ensuring a polished and professional presentation for project pitches.


10 slides
4-Quadrant Responsibility Chart Presentation
Bring your message to life with a slide that feels bold, modern, and instantly engaging. This presentation helps you outline four key responsibilities or categories in a clean quadrant layout, making complex information easy to follow and visually compelling. It’s perfect for strategy, workflow, or team-based insights. Fully compatible with PowerPoint, Keynote, and Google Slides.


7 slides
Real Estate Housing Market Infographic
Real estate is an important asset class that plays a vital role in the economy and society. This real estate template is perfect for presenting your local housing market statistics to potential homeowners, buyers and renters. Use these charts and tables to show trends in sales prices, gross produce, average household income over time and so much more. This presentation contains 7 slides of the housing market. It is fully customizable with many photo layouts to choose from and all professional charts are included in the file. This template can be used with Powerpoint, keynote or Google Slides.


10 slides
Cause and Effect Fishbone Presentation
Visualize root causes and streamline analysis with this Cause and Effect Fishbone infographic. Ideal for identifying issues across categories, it helps present logical flows clearly. Fully editable and perfect for business, strategy, or process improvement discussions. Compatible with PowerPoint, Keynote, and Google Slides for effortless customization.


7 slides
McKinsey Business Infographic
The McKinsey 7S Model is a management model developed by consulting company McKinsey & Company. This infographic template offers a framework to analyze and align various internal aspects of an organization to ensure its success and effectiveness. Compatible with Powerpoint, Keynote, and Google Slides. Customize the content, design, and visuals to craft an engaging and informative infographic that showcases McKinsey & Company's global impact and expertise in transforming businesses. This business infographic should serve as a snapshot of McKinsey's core strengths and values.


5 slides
Scientific Research Data Presentation
Bring your research to life with a clean, dynamic layout designed to simplify complex findings and highlight key scientific insights. This presentation offers a structured flow for showcasing data, experiments, or results in a clear and engaging way. Fully compatible with PowerPoint, Keynote, and Google Slides.


22 slides
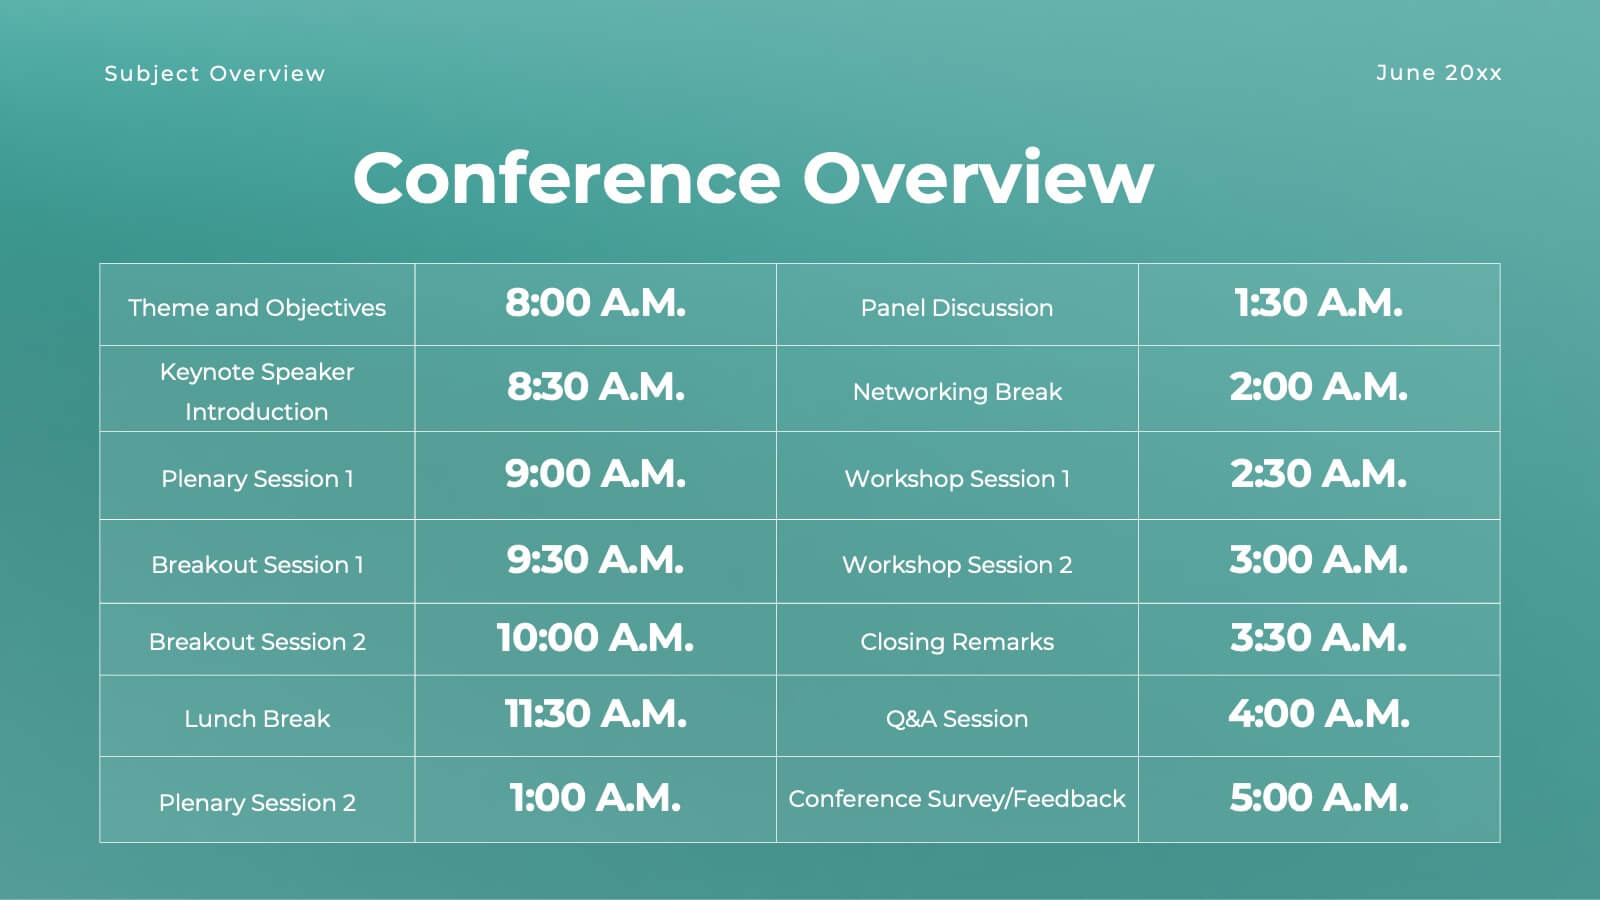
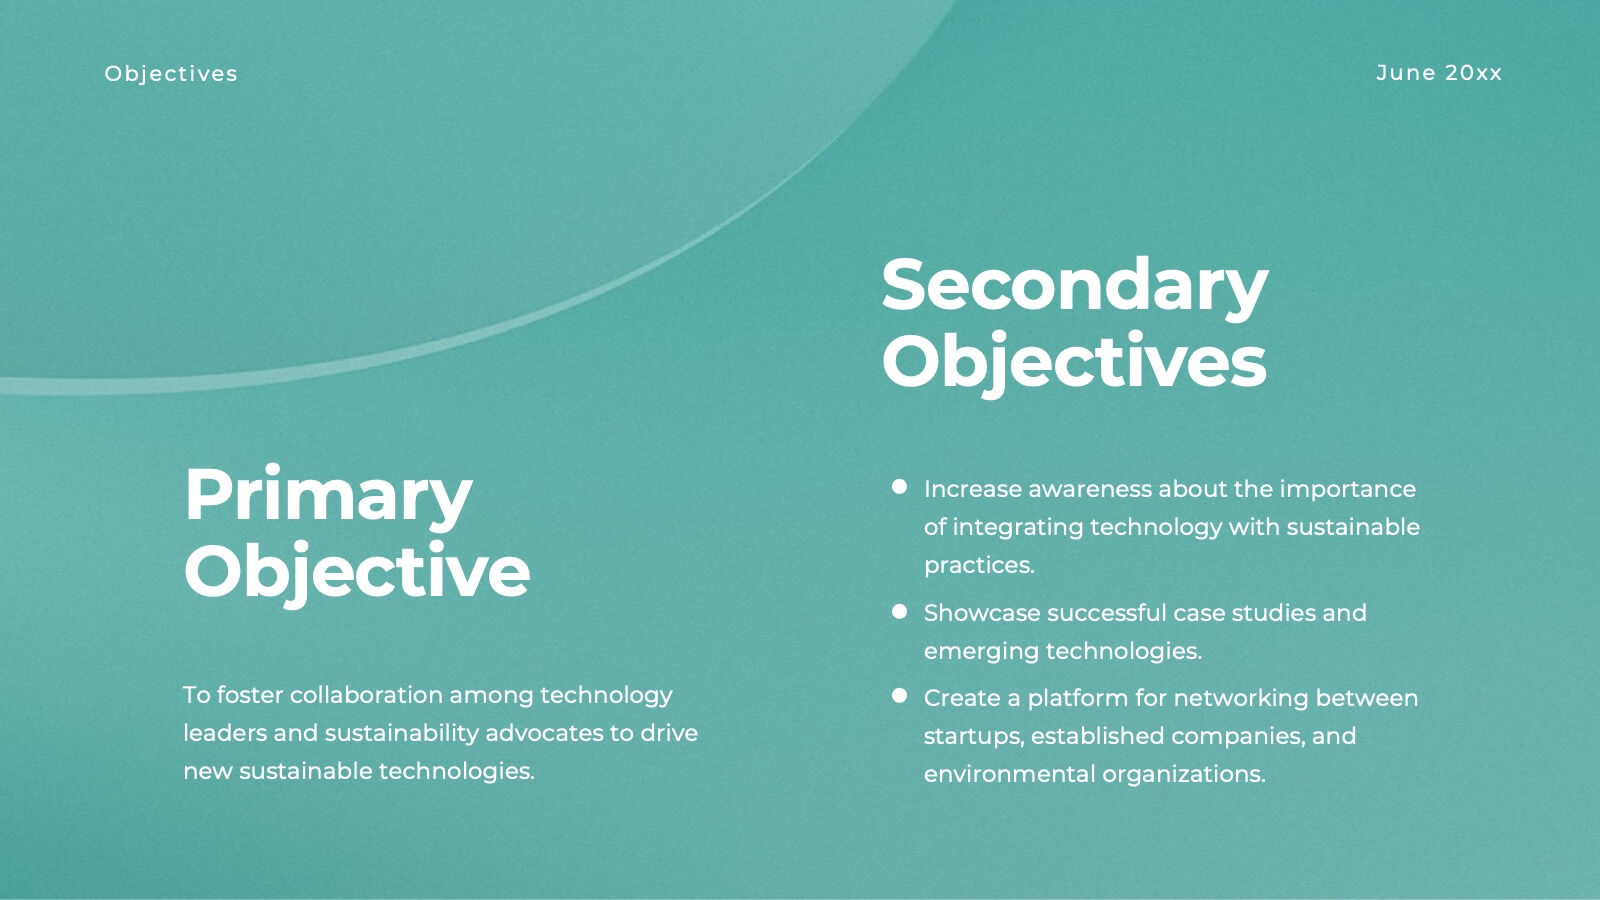
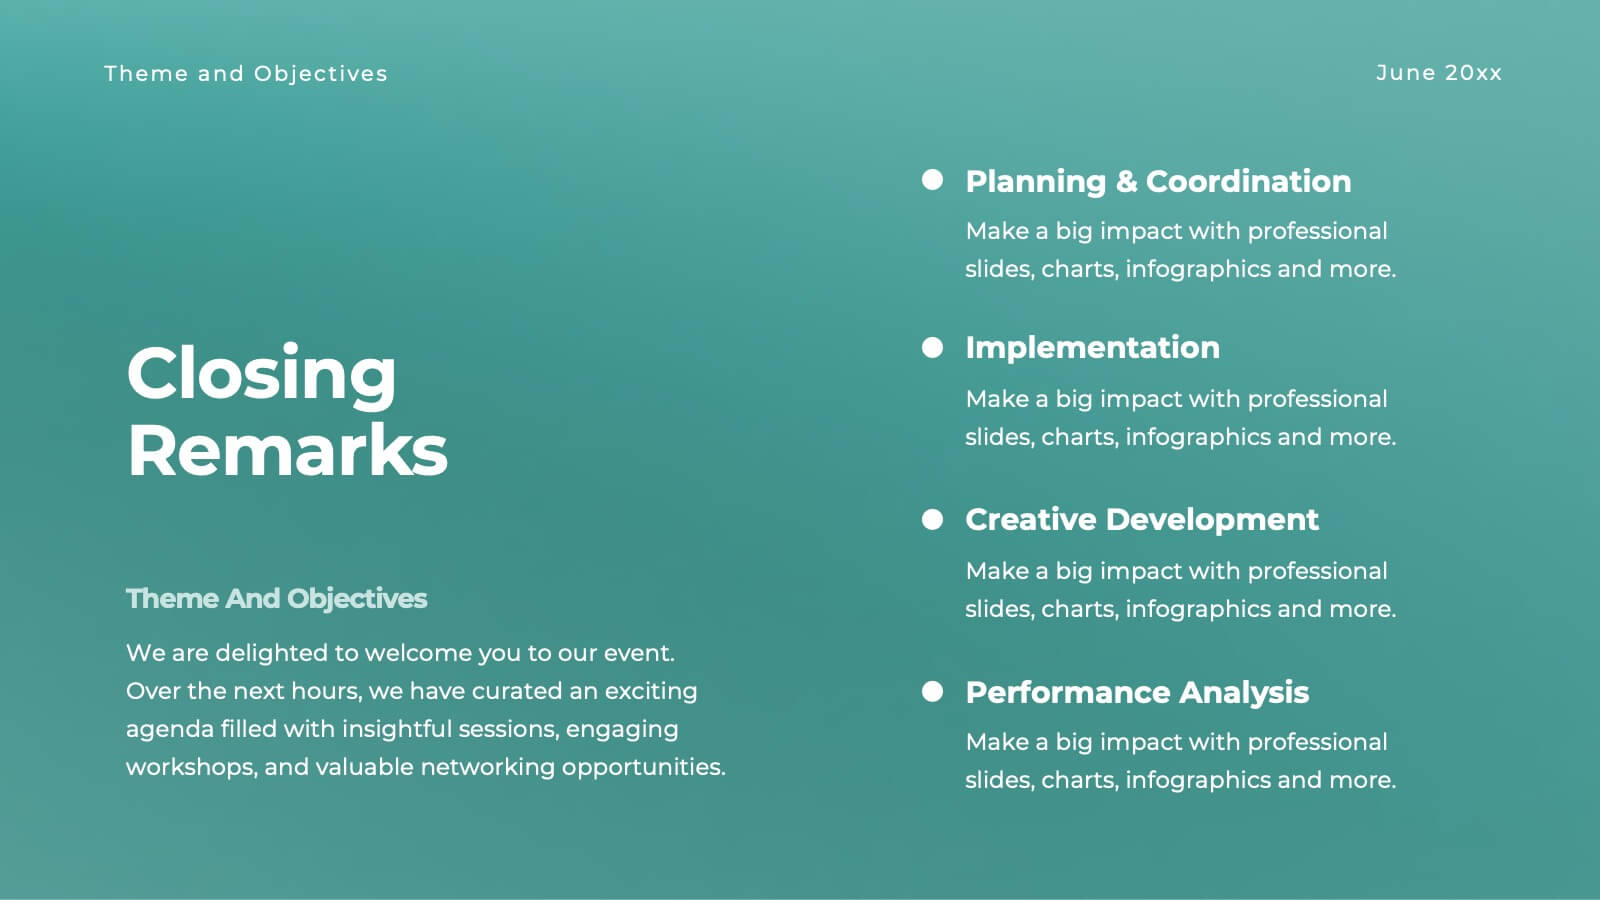
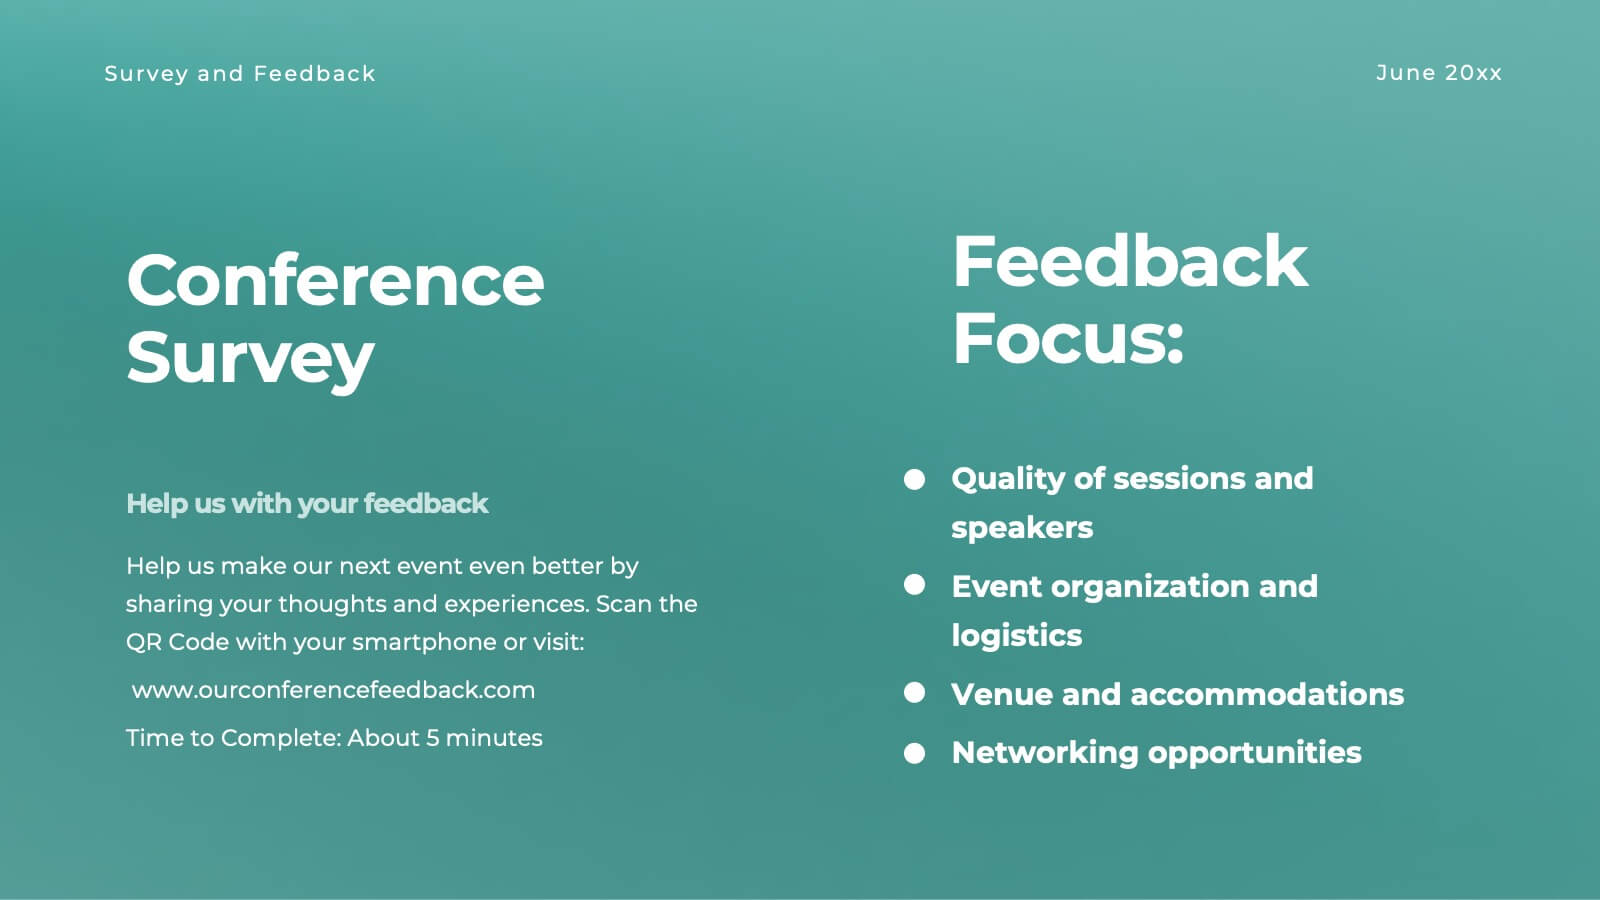
Halo Small Business Pitch Deck Presentation
Streamline your business presentations with this versatile pitch deck template! Ideal for conferences and meetings, it includes slides for objectives, session details, keynote speakers, and panel discussions. Keep your audience engaged with professional design and clear, structured content. Compatible with PowerPoint, Keynote, and Google Slides for seamless presentations on any platform.


5 slides
Environment Articles Infographic
The Environment is important for a number of reasons, it is essential that we take care of it and minimize our impact on it. This vertical Infographic is a visual representations of information related to environmental topics, presented in a vertical format. These infographics are designed to effectively communicate key facts, statistics, and concepts about the environment in a visually appealing and easily digestible manner. This consist of a series of vertically arranged sections or columns, each containing relevant information and visuals. These sections can cover a wide range of environmental topics, such as climate change, renewable energy, pollution, and sustainable practices.


4 slides
Buyer Persona Research and Profile Map Presentation
Make your audience feel like they already know your ideal customer. This creative template helps you visually map out key buyer persona data, such as demographics, goals, behavior, and pain points. Perfect for marketing strategy and customer research presentations. Fully compatible with PowerPoint, Keynote, and Google Slides for seamless editing.


5 slides
Infrastructure and Construction Industry
Showcase progress and performance metrics in the construction sector using this crane-themed, vertical bar chart design. Perfect for engineers, project managers, and developers, this slide uses color-coded scaffolding to illustrate percentages, growth, or completion rates. Fully editable in PowerPoint, Keynote, and Google Slides.


6 slides
Organizational Change Management Presentation
Visualize transformation with clarity using this structured slide, perfect for outlining your change roadmap, initiatives, or strategic phases. The layout features six labeled steps with icons and editable text for seamless communication of your process—from awareness to adoption. Ideal for HR leaders, consultants, and operations managers. Fully editable in PowerPoint, Keynote, and Google Slides.