


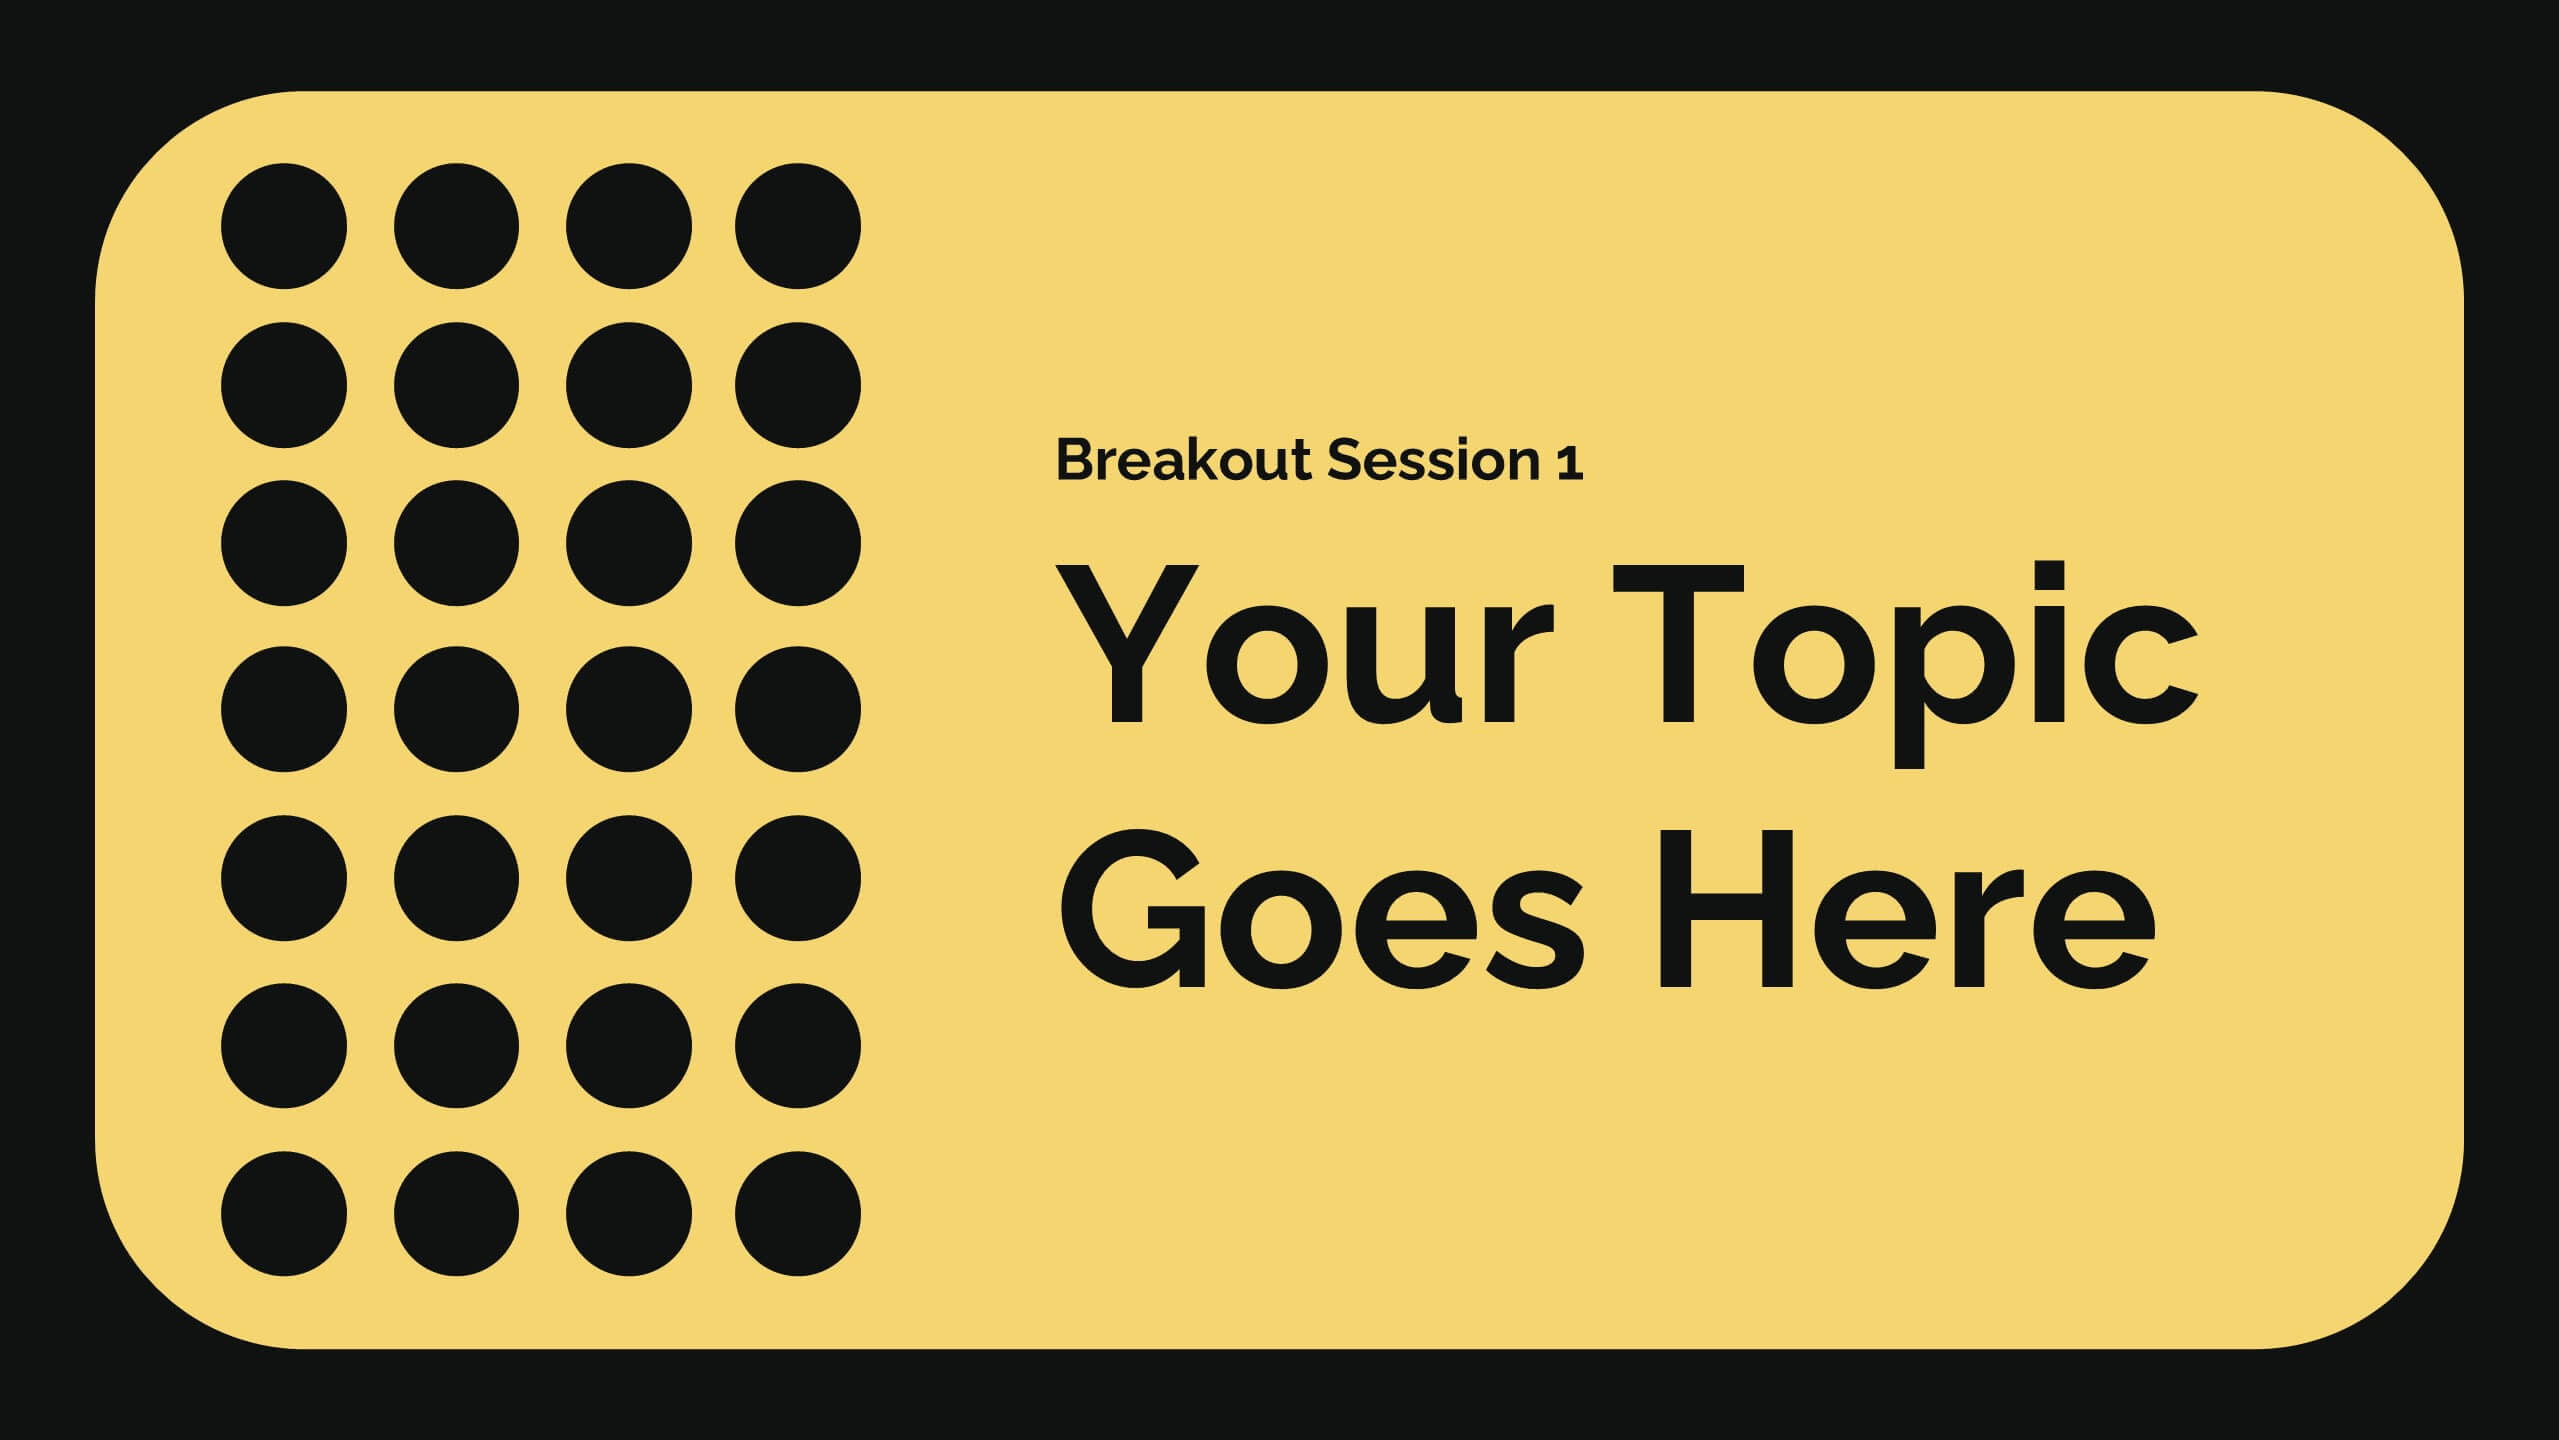
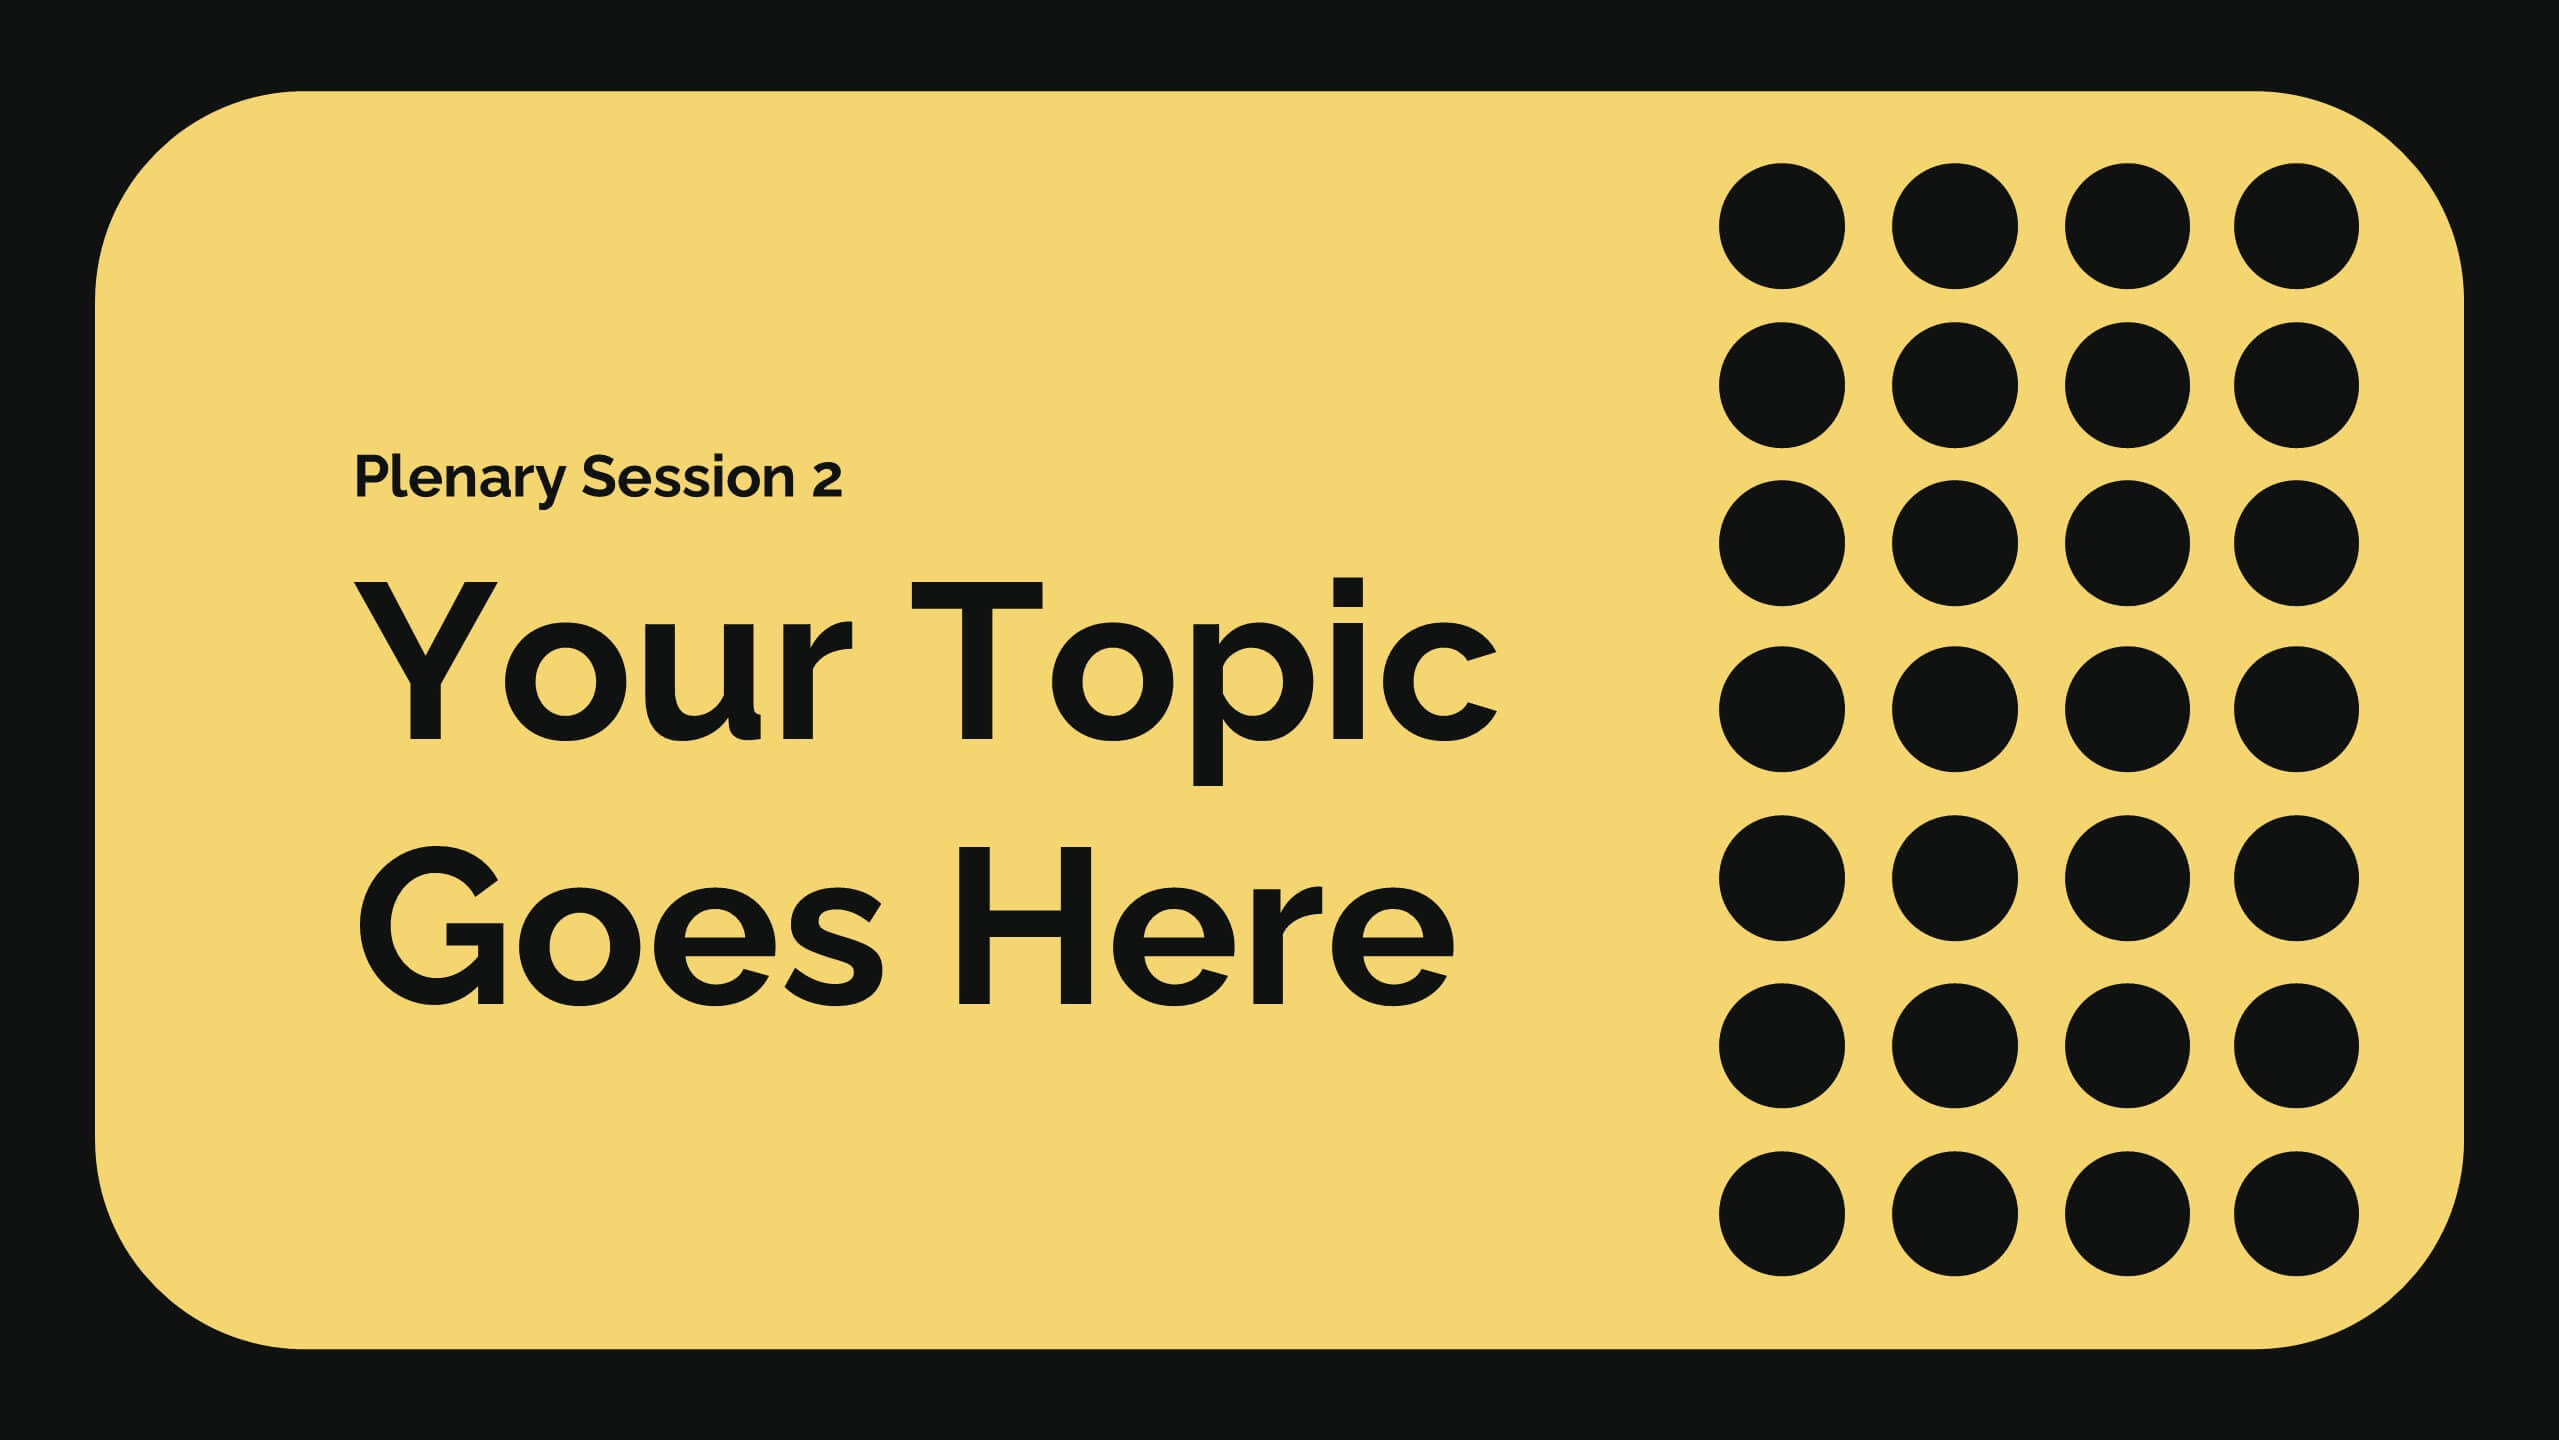
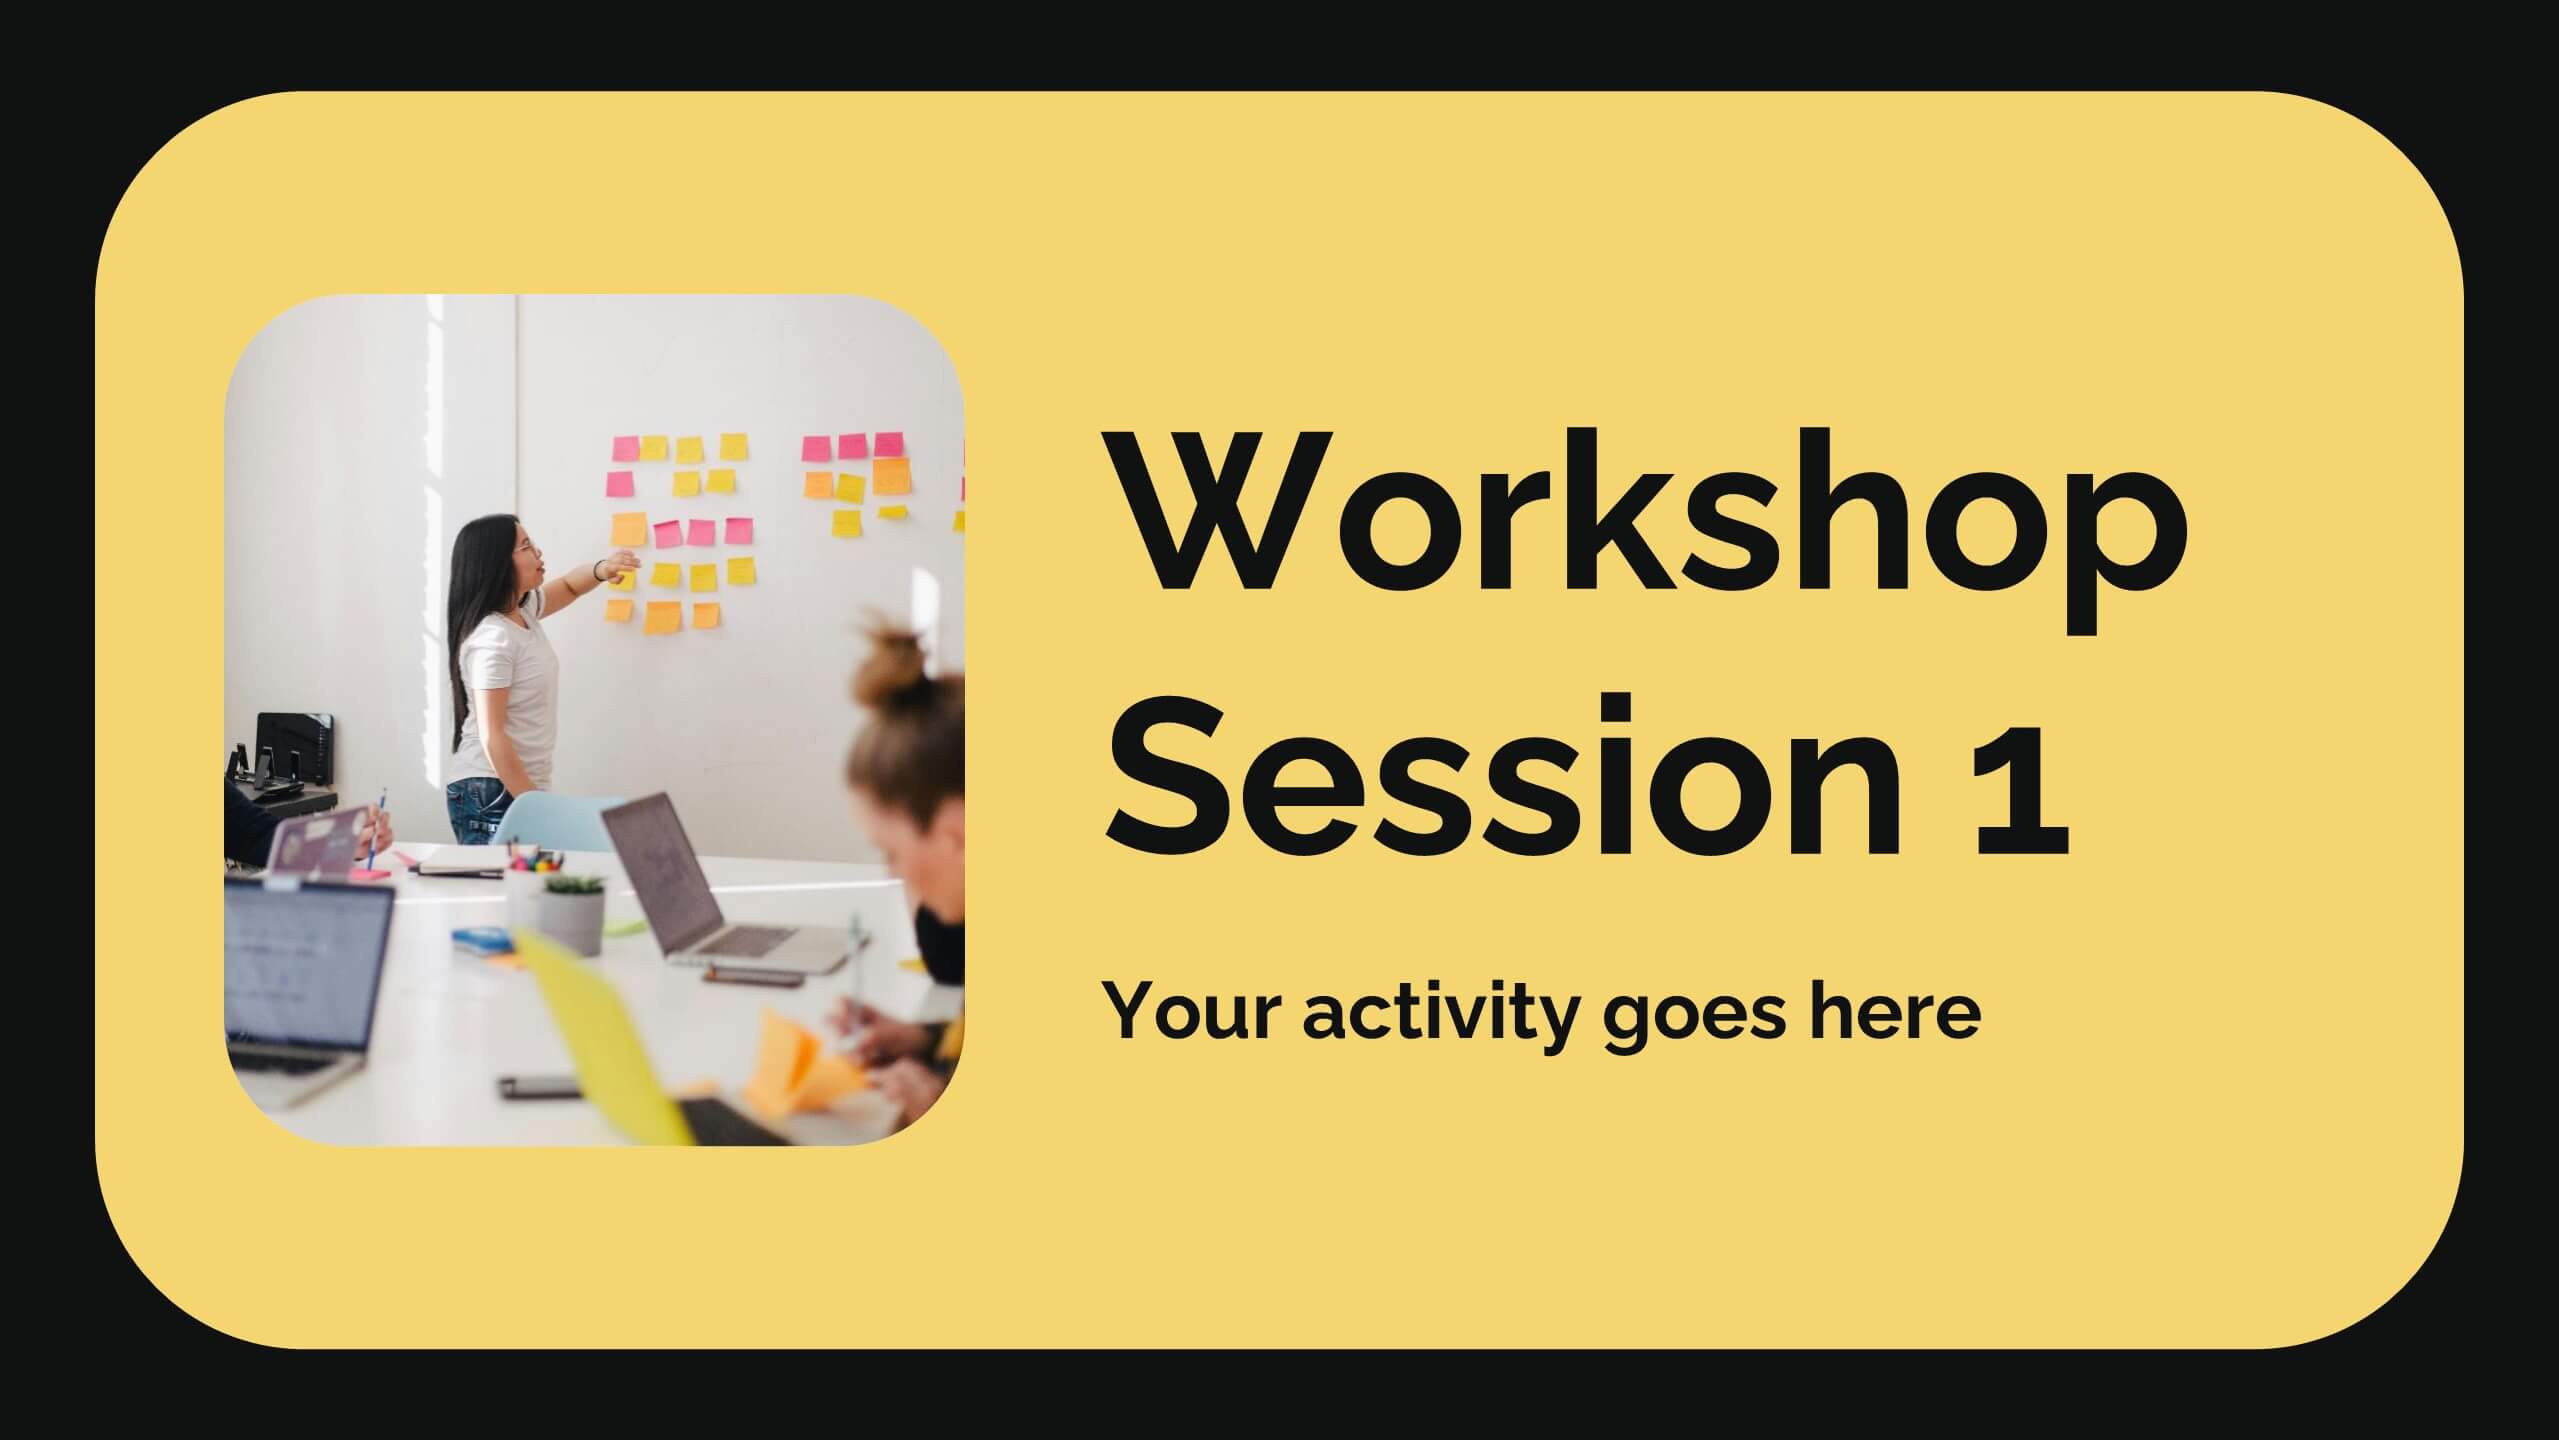
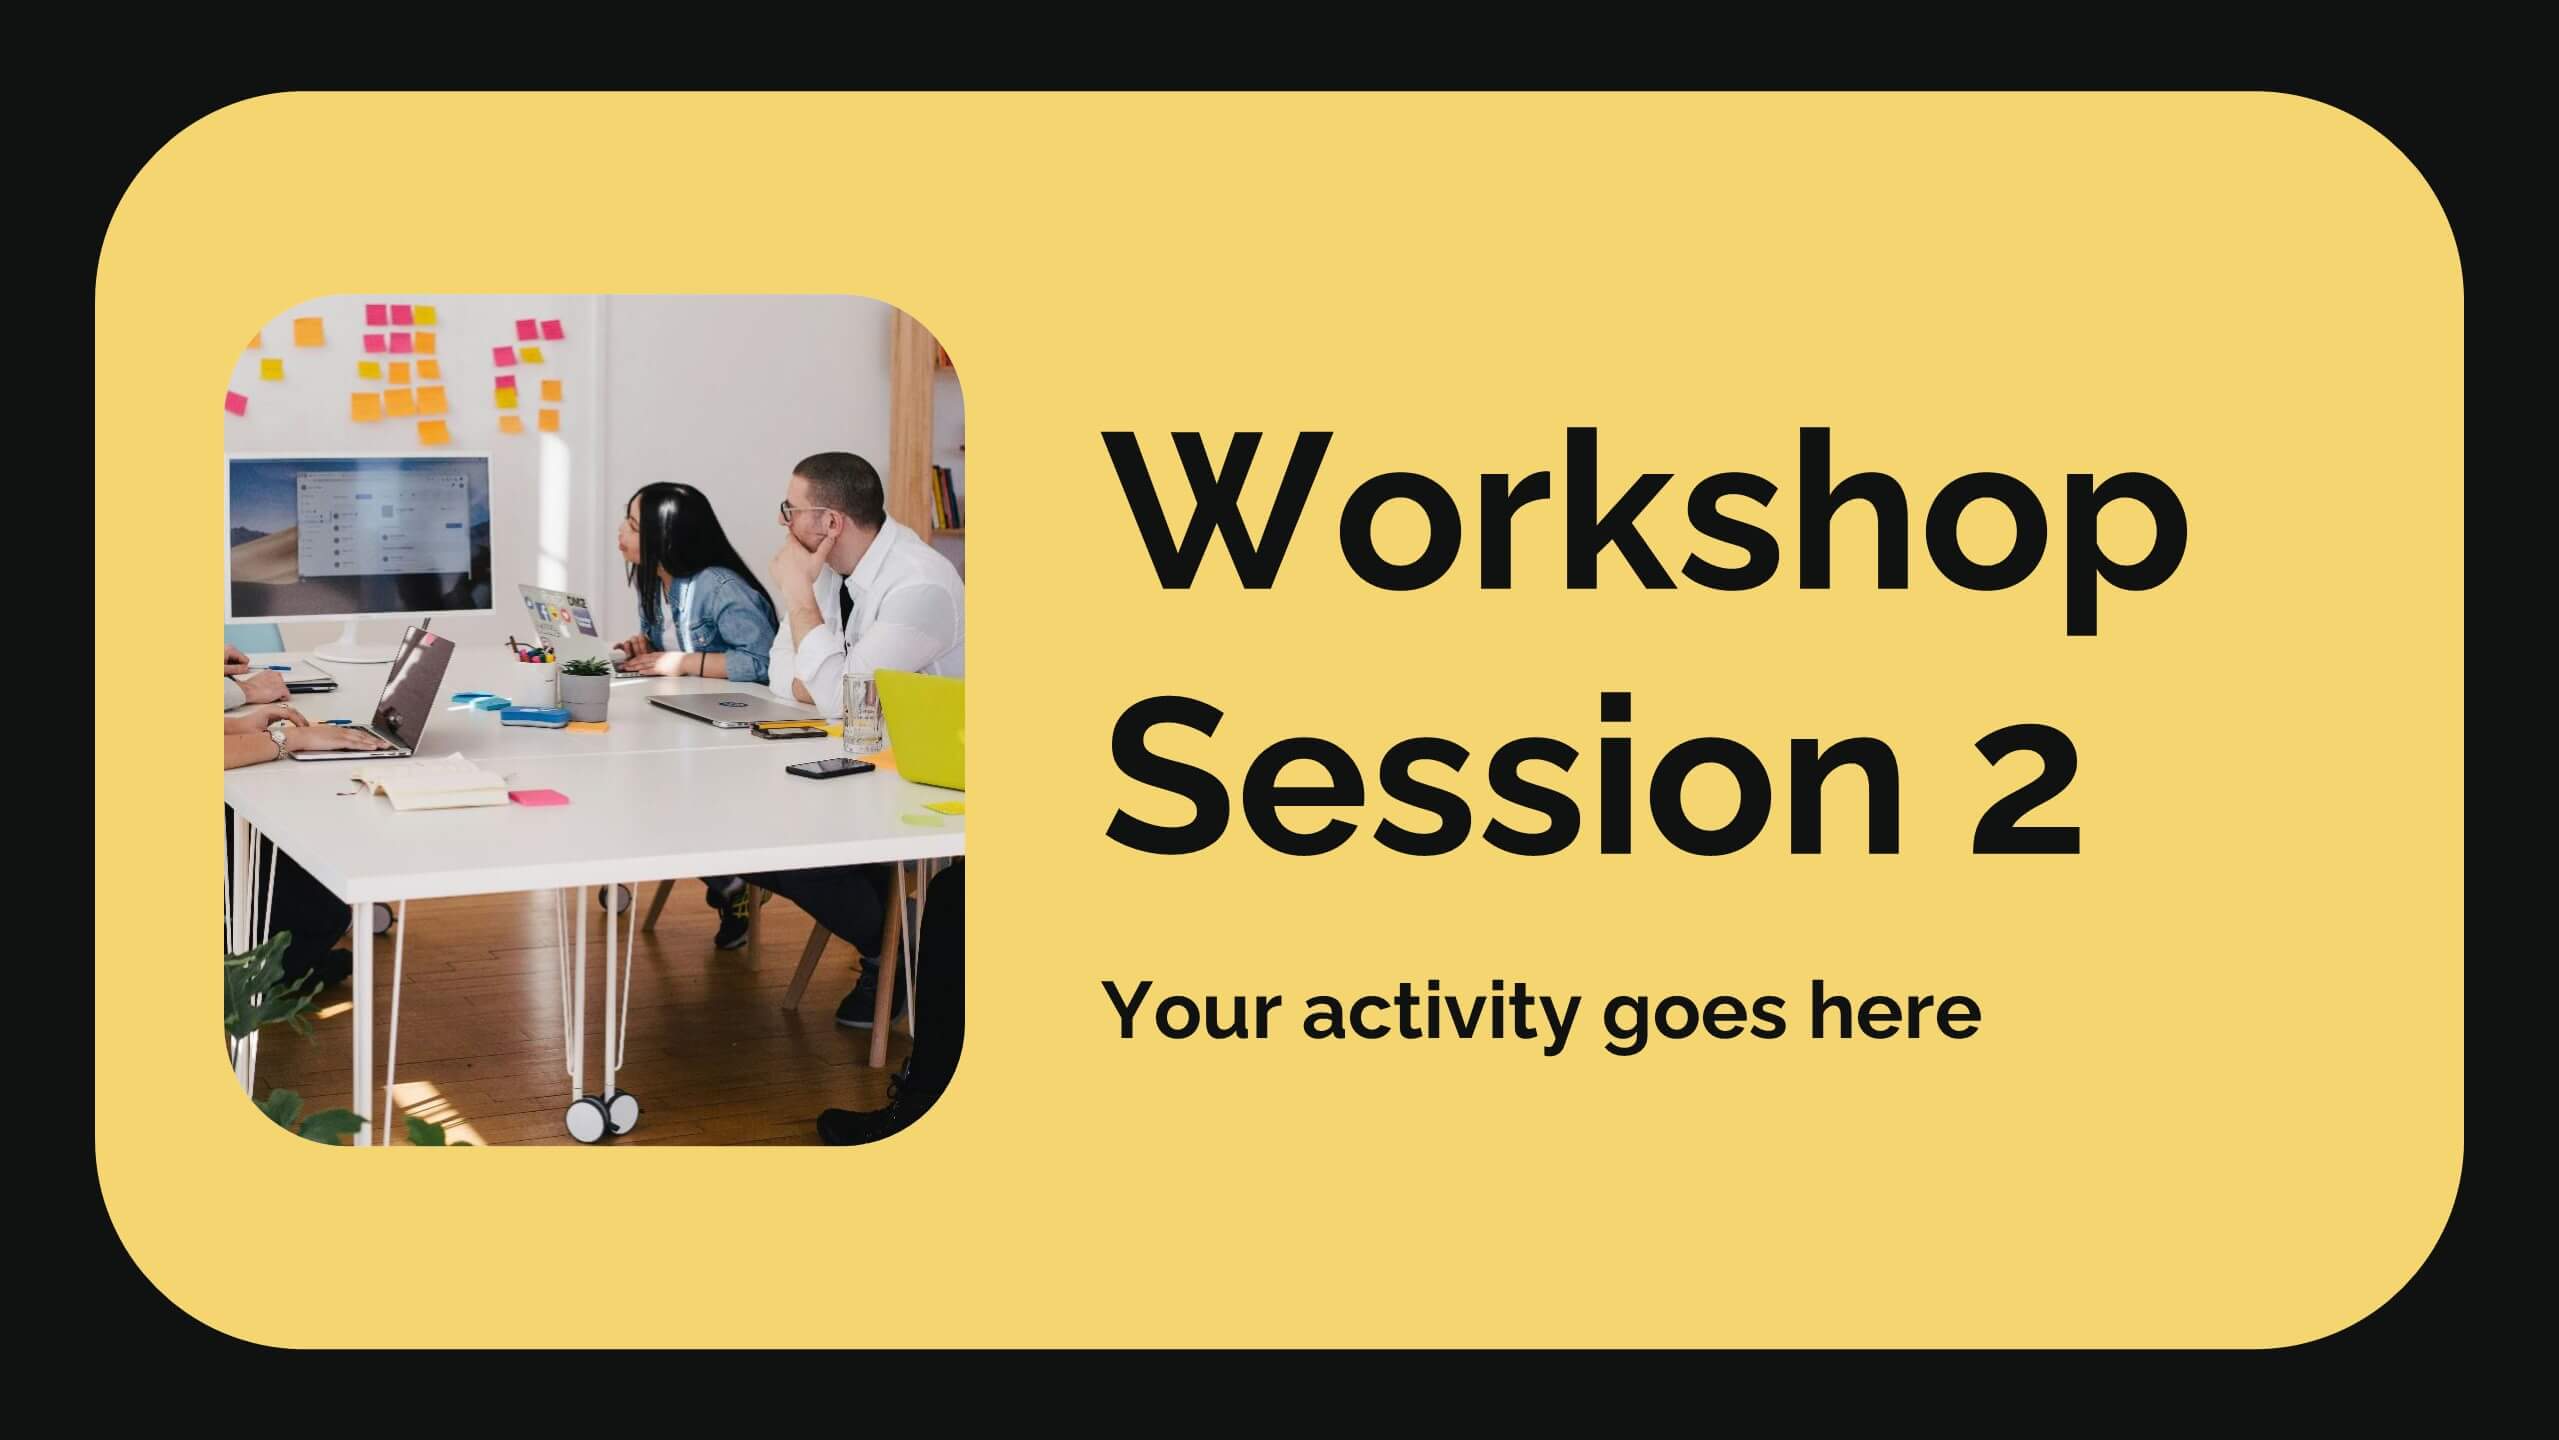
Features
- 6 Unique slides
- Fully editable and easy to edit in Microsoft Powerpoint, Keynote and Google Slides
- 16:9 widescreen layout
- Clean and professional designs
- Export to JPG, PDF or send by email


Do you have any questions?
Recommend


4 slides
Interactive Data Dashboard Display Presentation
Present data with clarity using this Interactive Data Dashboard Display presentation. Designed to showcase multiple metrics at once, it includes pie charts, donut charts, bubble graphs, and bar comparisons. Ideal for business reports, marketing insights, or performance reviews. Fully editable in Canva, PowerPoint, and Google Slides for flexible customization.


24 slides
Djinn Brand Identity Presentation
Unleash the power of your brand with this sleek and modern presentation template! From brand identity components to target audience personas, this template covers everything you need to craft a cohesive and compelling brand strategy. Whether showcasing brand guidelines or success stories, it’s designed for maximum clarity and impact. Compatible with PowerPoint, Keynote, and Google Slides for effortless presentations.


5 slides
Company Success Case Analysis
Showcase key achievements and milestones using this layered 3D staircase layout, perfect for visualizing company progress over time. Each step represents a different phase or success story, helping you present a compelling growth narrative. Fully customizable and compatible with PowerPoint, Keynote, and Google Slides.


6 slides
2-Option Comparison Chart Presentation
Make your decision-making story pop with a clean, energetic layout that clearly contrasts two paths side by side. This presentation helps you compare options, outline pros and cons, and guide audiences toward confident choices with sharp visual structure. Fully compatible with PowerPoint, Keynote, and Google Slides.
5 slides
Business Strategy Arrow Presentation
Enhance your strategic planning with the Business Strategy Arrow Presentation. This visually structured template guides your audience through a step-by-step progression, making it ideal for business roadmaps, strategic plans, and goal-oriented workflows. Easily customize the colors, text, and icons to align with your brand. Fully compatible with PowerPoint, Keynote, and Google Slides for effortless editing and professional presentations.


6 slides
Stages of Product Life Cycle Infographics
Visualize the stages of a product's life cycle with our customizable infographic template. This template is fully compatible with popular presentation software like PowerPoint, Keynote, and Google Slides, allowing you to easily customize it to illustrate and communicate the key phases of a product's life cycle. The Stages of Product Life Cycle infographic template offers a visually engaging platform to depict the various stages, including introduction, growth, maturity, and decline. Whether you're a product manager, marketer, business owner, or student, this template provides a user-friendly canvas to create informative presentations and educational materials. Enhance your understanding of product life cycles with this SEO-optimized infographic template, thoughtfully designed for clarity and ease of use. Customize it to showcase the characteristics, strategies, and challenges associated with each stage, helping you make informed decisions about your products and their market positioning. Start crafting your personalized infographic today to explore the dynamic nature of the product life cycle.


10 slides
Sustainability Management Metrics Framework
Showcase your environmental KPIs with the Sustainability Management Metrics Framework Presentation. This tree-inspired visual design is perfect for highlighting four key metrics across sustainability, compliance, or ESG reporting. Fully editable in PowerPoint, Keynote, or Google Slides, it’s ideal for eco-conscious business reviews, annual reports, or internal strategy updates.


5 slides
Fashion Design Infographics
Fashion Design is the art of creating clothing and accessories, incorporating elements of style, aesthetics, and functionality. These infographic templates offer a visually captivating and informative way to present key concepts, trends, and insights in the world of fashion design. This template is ideal for fashion designers, students, industry professionals, or anyone interested in sharing knowledge about fashion design principles, fashion history, or emerging trends. Featuring a stylish design that reflects the creative and dynamic nature of the fashion industry. This allows for easy customization and seamless integration of your fashion-related content.


23 slides
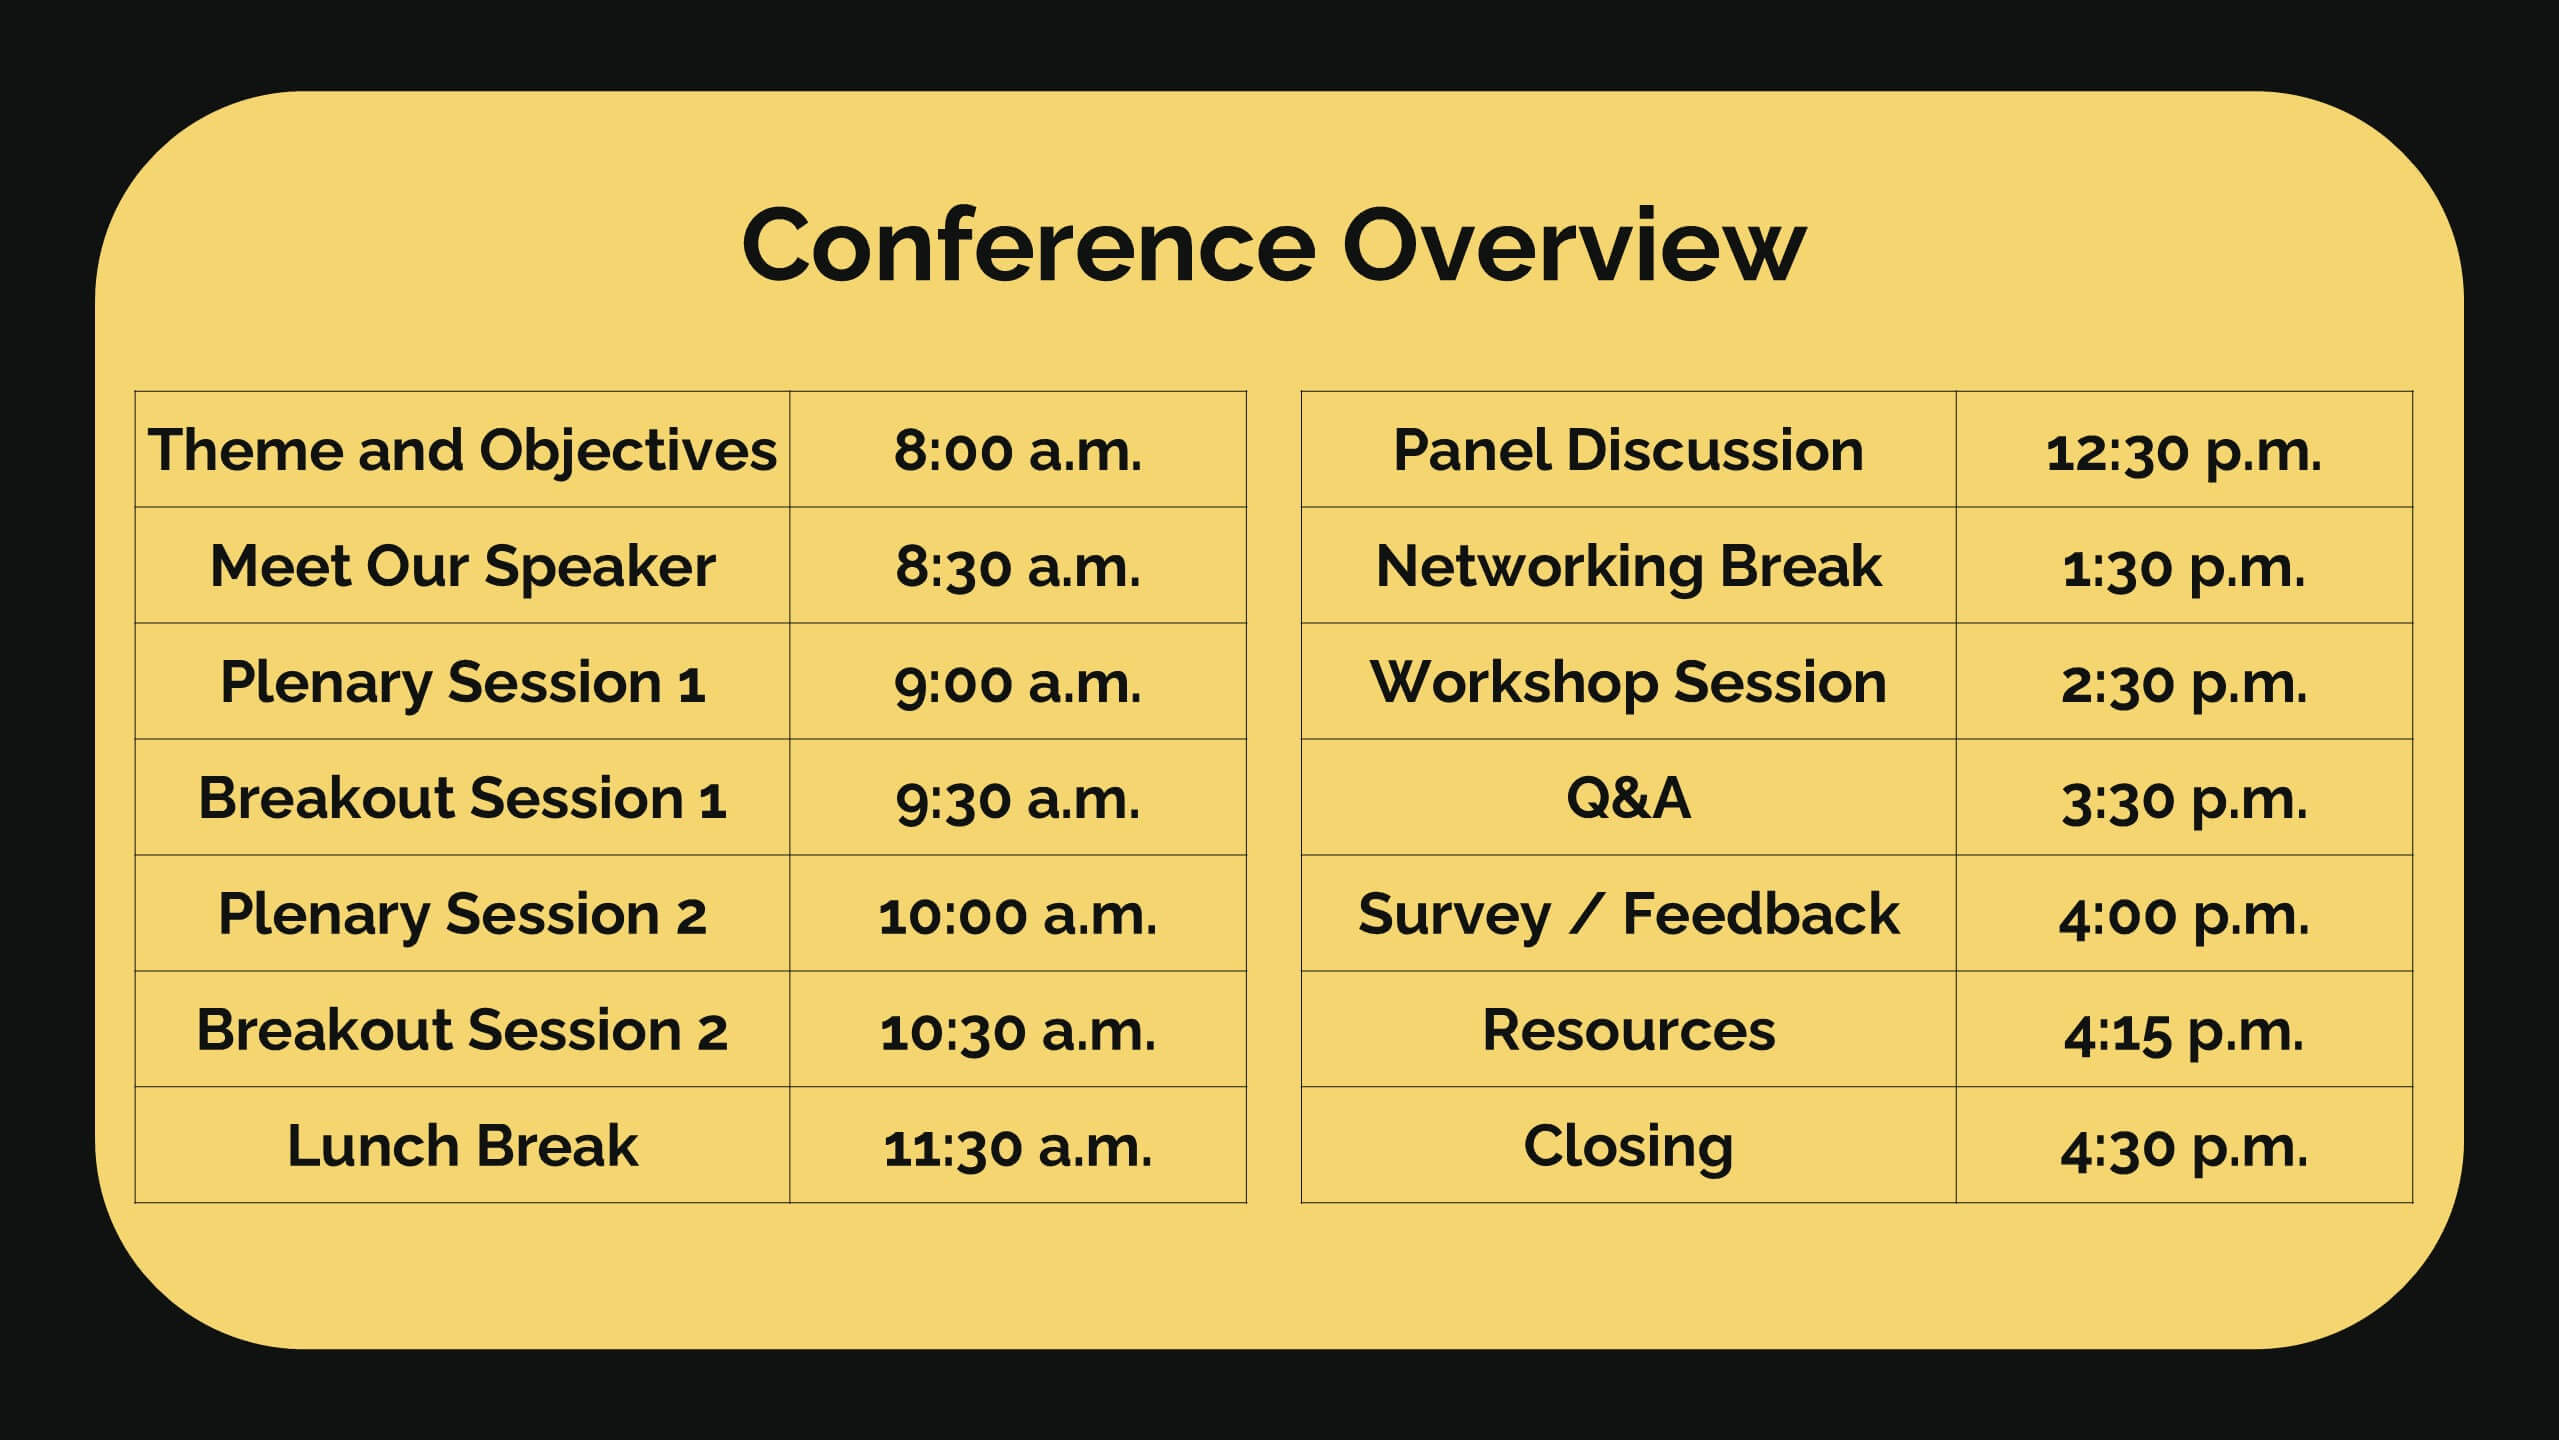
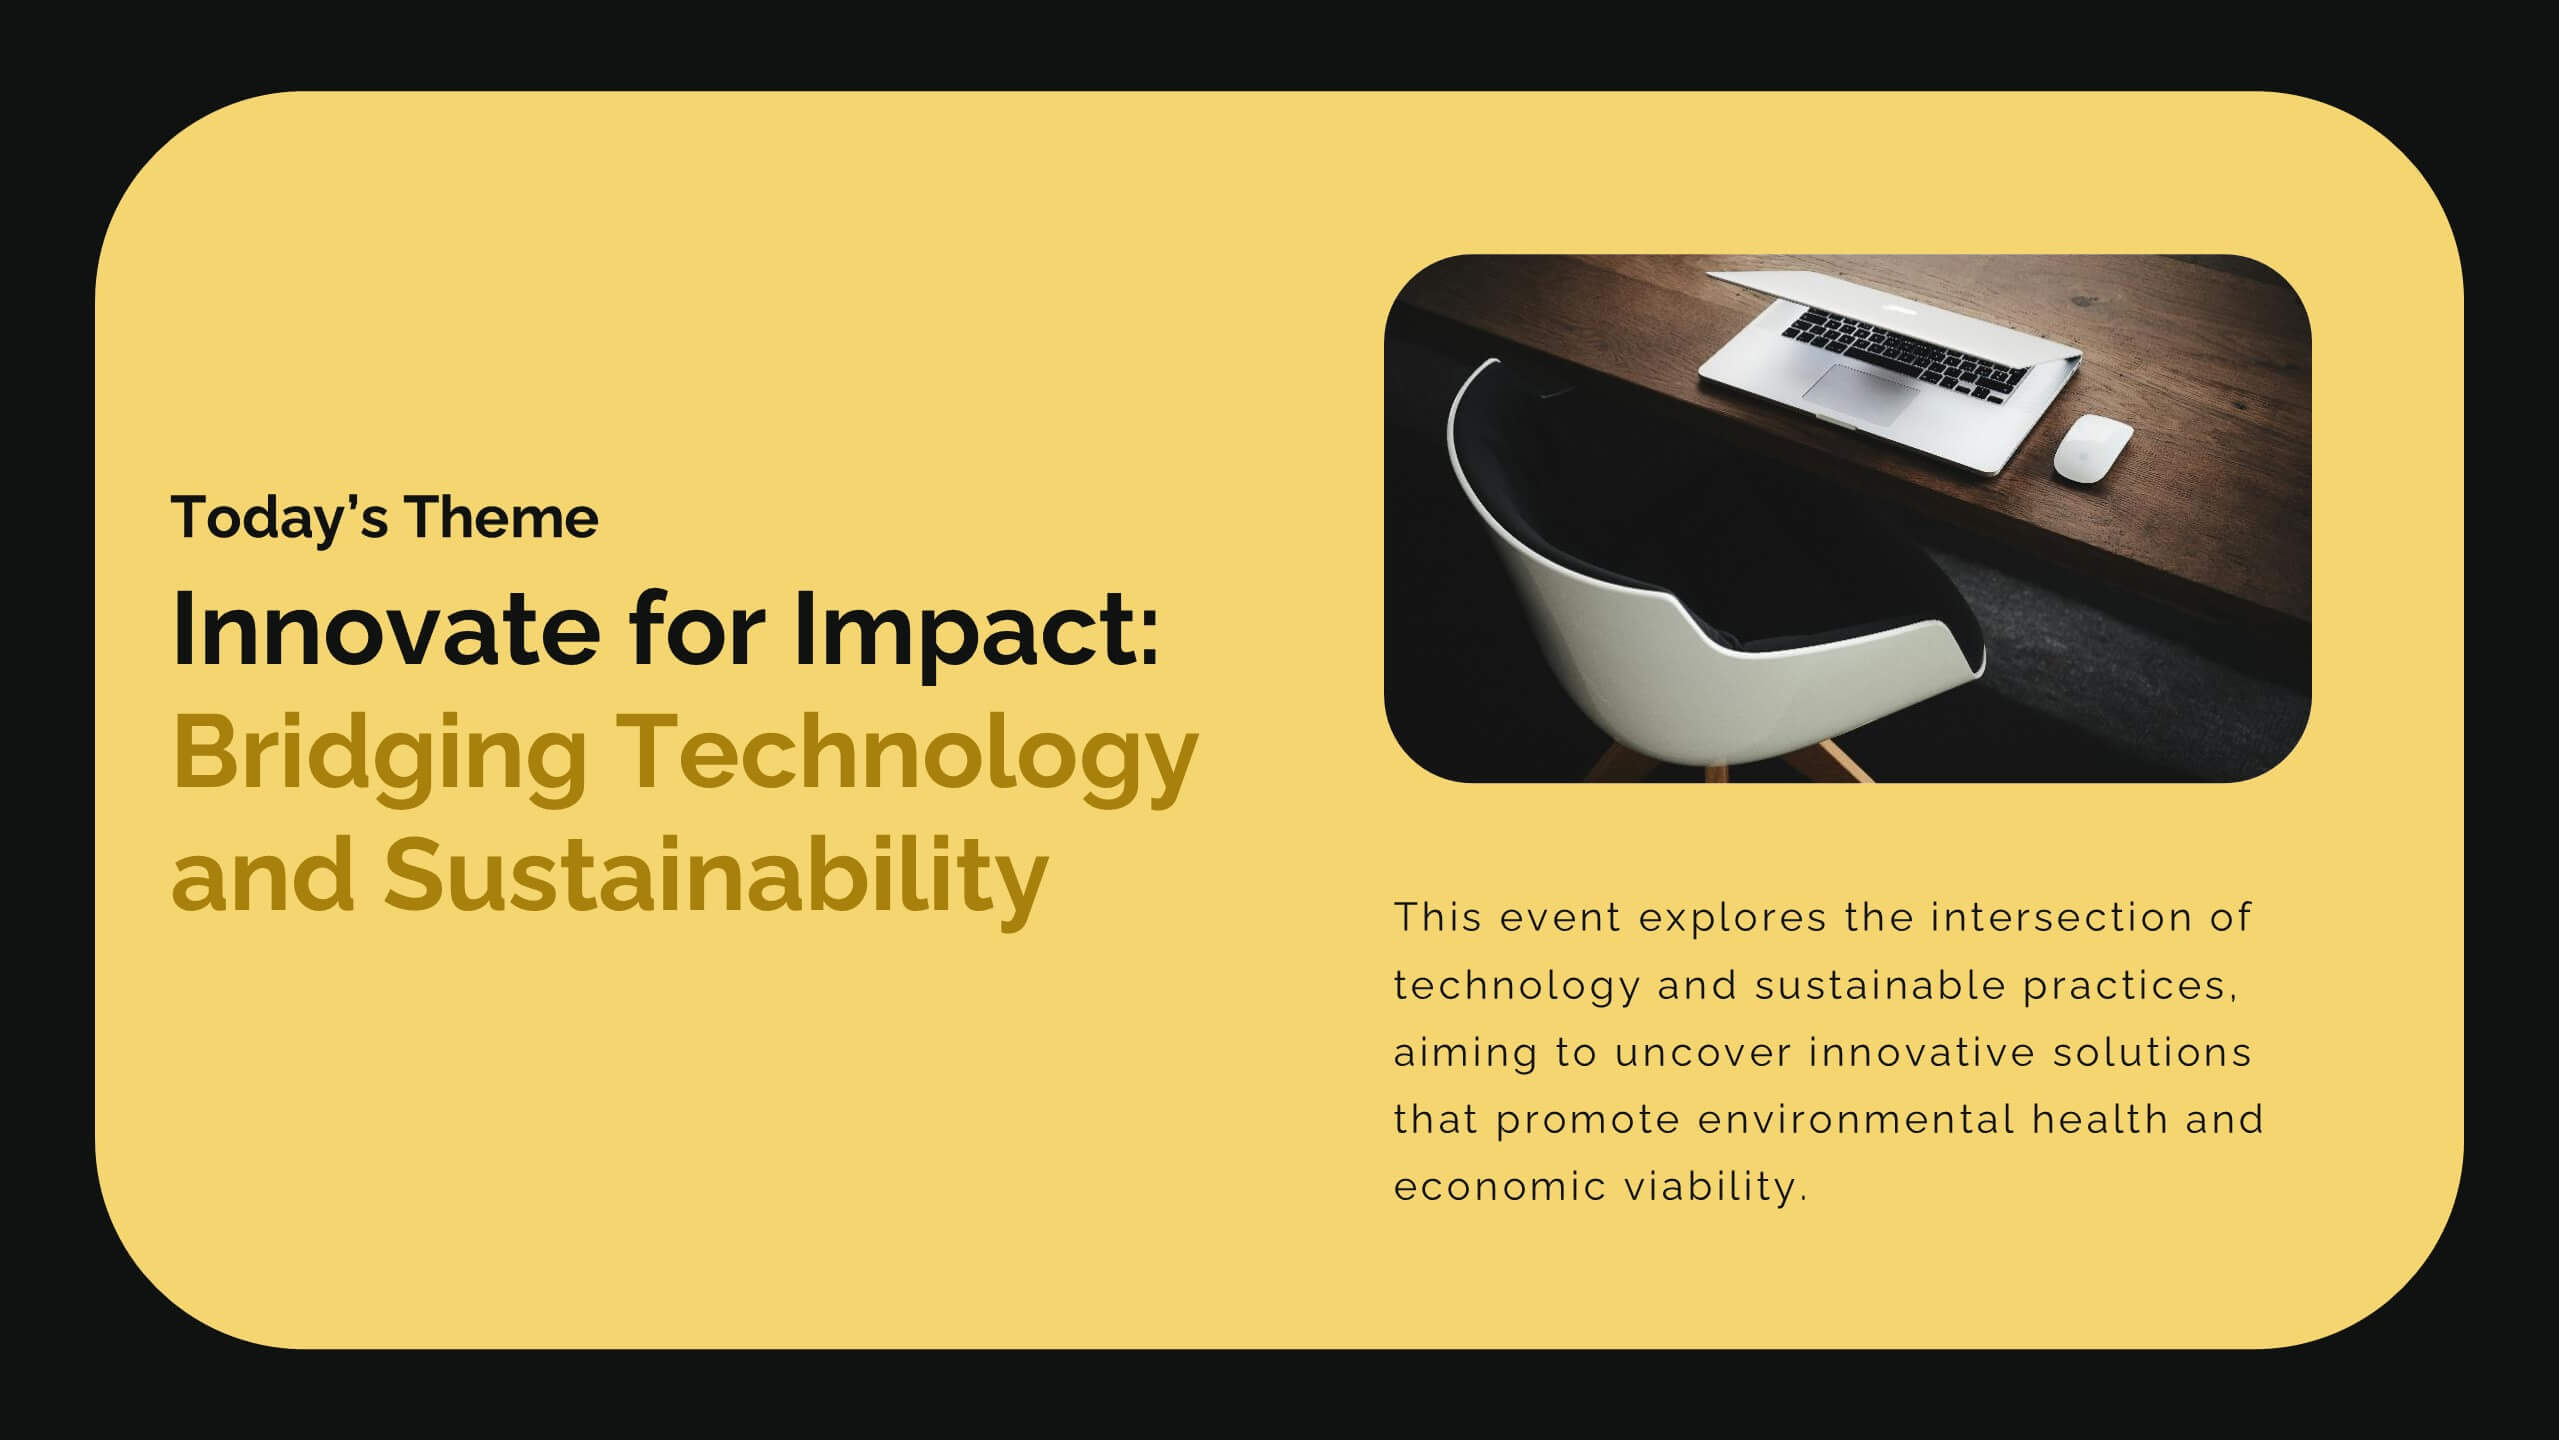
Diamond Business Development Proposal Presentation
Unlock the potential of your business proposals with this bold and engaging presentation template! Perfect for business development pitches, conferences, and workshops, it includes sections for speaker introductions, panel discussions, and session breakdowns. With its clean and professional design, this template ensures clarity and impact. Fully customizable and compatible with PowerPoint, Keynote, and Google Slides.


5 slides
Task Automation Process Flow Presentation
Streamline operations with this visual task automation flowchart. Perfect for illustrating automated sequences, decision nodes, and multi-branch logic. Clearly labeled elements guide viewers through each step. Ideal for tech teams, process designers, and workflow planning. Fully editable in PowerPoint, Keynote, and Google Slides to match your branding and automation strategy.


5 slides
Online Education Training Presentation
Present your digital learning programs with this Online Education Training Presentation. The visual layout highlights a central computer screen connected to key e-learning components, making it perfect for explaining course structures, virtual classroom tools, or distance learning workflows. Designed for trainers, educators, or edtech professionals. Fully editable in PowerPoint, Keynote, and Google Slides.


5 slides
Cryptocurrency Investment Overview Presentation
Capture the excitement of digital investing with this clean, modern layout designed to visualize market performance, asset insights, and portfolio trends. Perfect for financial analysts, startups, and educators, it simplifies complex data into engaging visuals. Fully compatible with PowerPoint, Keynote, and Google Slides for seamless editing and presentation delivery.


4 slides
Step-by-Step Company Workflow Map Presentation
Visually track business processes with this step-by-step workflow map. Each stage is illustrated as a vertical bar, representing progression and task hierarchy. Ideal for project managers, operations teams, and onboarding sessions. Fully editable in PowerPoint, Keynote, and Google Slides for quick customization of labels, icons, and stage descriptions to fit your goals.


5 slides
Business Development Five-Step Plan Presentation
Accelerate your growth with the Business Development Five-Step Plan presentation. This structured template guides you through key stages of business expansion, from strategy to execution. Designed for entrepreneurs, startups, and corporate teams, this clear and engaging format ensures effective planning and communication. Fully customizable for PowerPoint, Keynote, and Google Slides to fit your specific needs.


5 slides
Artificial Intelligence Insights Infographics
Embark on an explorative journey into the future with artificial intelligence insights infographics. Set against a visually stimulating backdrop of purple, blue, and white. It's designed for innovators, educators, and students who strive to understand and communicate the multifaceted impacts of AI in various sectors. By encapsulating trends, innovations, and challenges, these infographics are perfect for presentations, educational materials, or online content. The creative use of graphics and icons, ensures each segment of information is not only informative but also engaging, bringing clarity to the future shaped by artificial intelligence.


5 slides
Business Model Canvas and Strategy Presentation
Visualize your entire business model in one clean, structured slide. This presentation template breaks down key areas—Partners, Activities, Value Propositions, Customers, Channels, Costs, and Revenue—into a color-coded layout for strategic clarity. Perfect for startups, consultants, or internal strategy teams. Fully editable in PowerPoint, Keynote, and Google Slides.


4 slides
30 60 90 Day Plan Goals Presentation
Set your roadmap in motion with a clean, visual timeline that makes each milestone easy to follow and present with confidence. This presentation helps you outline priorities, track progress, and communicate clear goals for the first three months. Fully editable and compatible with PowerPoint, Keynote, and Google Slides.