


Features
- 4 Unique slides
- Fully editable and easy to edit in Microsoft Powerpoint, Keynote and Google Slides
- 16:9 widescreen layout
- Clean and professional designs
- Export to JPG, PDF or send by email


Do you have any questions?
Recommend


6 slides
Supply Chain Management Strategy
Navigate your next big idea with a flow that’s clear, visual, and sharp. This presentation template breaks down key business logistics and process steps into a bold, easy-to-follow infographic layout. Ideal for showcasing strategic planning and operational structure, it's fully compatible with PowerPoint, Keynote, and Google Slides for effortless use.


6 slides
Progressive Insurance Infographics
Explore Progressive Insurance with our customizable infographic template. This template is fully compatible with popular presentation software like PowerPoint, Keynote, and Google Slides, allowing you to easily customize it to showcase various aspects of Progressive Insurance, its services, and achievements. The Progressive Insurance infographic template offers a visually engaging platform to highlight the company's history, insurance offerings, customer satisfaction, and industry leadership. Whether you're an insurance professional, a potential customer, or a financial analyst, this template provides a user-friendly canvas to create informative presentations and educational materials about Progressive Insurance. Learn more about Progressive Insurance with this SEO-optimized infographic template, thoughtfully designed for clarity and ease of use. Customize it to showcase Progressive's unique features, coverage options, and innovations, making it a valuable resource for sharing information about the company with your audience. Start crafting your personalized infographic today to explore the world of Progressive Insurance.


4 slides
Strategic Project Proposal Plan Presentation
Plan with Precision! The Strategic Project Proposal Plan Presentation helps you outline key objectives, strategies, and milestones with a structured, professional design. Perfect for project managers, consultants, and business leaders, this template ensures clarity and impact. Fully editable and compatible with PowerPoint, Keynote, and Google Slides for effortless customization.


6 slides
Framework Architect Infographics
Explore the role of a Framework Architect with our customizable infographic template. This template is fully compatible with popular presentation software like PowerPoint, Keynote, and Google Slides, allowing you to easily customize it to illustrate and communicate the responsibilities and key aspects of a Framework Architect's role. The Framework Architect infographic template offers a visually engaging platform to define and explain the responsibilities, skills, and contributions of a Framework Architect within the field of software development or architecture. Whether you're a software architect, IT professional, or simply interested in understanding this role, this template provides a user-friendly canvas to create informative presentations and educational materials. Deepen your understanding of the Framework Architect role with this SEO-optimized infographic template, thoughtfully designed for clarity and ease of use. Customize it to highlight key responsibilities, architectural frameworks, collaboration methods, and the importance of this role in software development projects. Ensure that your audience gains valuable insights into the world of Framework Architecture. Start crafting your personalized infographic today to explore the role of a Framework Architect in greater depth.


7 slides
Balance Sheet and Profit Overview Presentation
Give your financial summary a clean, modern look with the Balance Sheet and Profit Overview Presentation. This slide offers a dual-column layout with icons and space for six key financial metrics or business insights—ideal for summarizing assets, liabilities, profits, and more. Easily editable in Canva, PowerPoint, and Google Slides.


4 slides
Product Life Cycle Stages Explained Presentation
Turn complex business growth phases into a clear visual journey with this clean, modern layout. Ideal for explaining product development, marketing strategies, or performance tracking, it helps you communicate each stage with precision and style. Fully editable and compatible with PowerPoint, Keynote, and Google Slides for seamless customization.


6 slides
McKinsey Model for Business Optimization Presentation
Illustrate business alignment with the McKinsey Model for Business Optimization Presentation. This hexagonal diagram clearly maps out the seven interdependent elements of the 7S Framework—Structure, Strategy, Systems, Skills, Staff, Style, and Shared Values—at the core. Ideal for strategy consultants, executive teams, and transformation leaders. Editable in PowerPoint, Keynote, Canva, and Google Slides.


6 slides
Environmental Policy and Sustainability Plan Presentation
Bring your sustainability message to life with a visual that flows as smoothly as your plan. This infographic presentation template helps explain your environmental goals, action steps, and policy structure using a dynamic, easy-to-follow circular layout. Perfect for eco reports and green strategy briefs. Compatible with PowerPoint, Keynote, and Google Slides.


7 slides
Work From Home Jobs Infographic Presentation
Working from home provides businesses with increased flexibility and can help ensure continuity of operations during times of disruption. This template is a great way to create a infographic about work from home jobs, or if you want to market your own work at home business. This template is easy to customize and full of useful design elements and tools that make it very easy to create stunning presentations. It includes a title slide with vibrant background colors for each section and a clean layout design. This template will help you make your own unique presentation in just minutes!


21 slides
Glacieron Financial Report Presentation
This Financial Report Presentation Template is a professional and visually engaging tool to showcase financial performance, key metrics, and strategic initiatives. It includes slides for performance metrics, financial summaries, competitor insights, and future goals, making it ideal for business reviews and stakeholder meetings. Compatible with PowerPoint, Keynote, and Google Slides for easy customization.


4 slides
Funding & Investor Startup Presentation
Present your investment strategy with clarity and impact using this triangle diagram slide. Ideal for showcasing the relationship between key funding stages, investor types, or business milestones, this layout offers a clean structure with labeled nodes (A, B, C) and supporting icons. Fully editable in PowerPoint, Keynote, and Google Slides for seamless customization.


7 slides
Product Life Cycle Analysis Infographic
Our Product Life Cycle Infographic template is the perfect tool for businesses that want to visually represent the various stages of their products' life cycles, from introduction to decline. Our engaging and easy-to-understand visuals help to illustrate the stages of a product's life cycle in a compelling way, making it easier for businesses to gain a better understanding of their products and how they evolve over time. In short, our Product Life Cycle Infographic template is a valuable tool for businesses that want to stay ahead of the curve and gain a deeper understanding of their products. So why wait? Try our template today and take your product development, marketing, sales, and financial planning to the next level!


6 slides
Business RAPID Model Diagram Presentation
Turn decision-making into a visual story with this bold, professional diagram that highlights each stage of responsibility and collaboration. Designed to simplify complex workflows, it’s perfect for outlining business strategies, performance reviews, or team structures. Fully compatible with PowerPoint, Keynote, and Google Slides for easy editing and presentation.


4 slides
Visual Relationships in Venn Format Presentation
Highlight similarities and differences between two or more ideas using this clean, two-circle Venn diagram layout. Ideal for comparing concepts, teams, or strategies. Customize icons, text, and color themes effortlessly. Compatible with PowerPoint, Keynote, and Google Slides—perfect for business meetings, educational content, and marketing comparisons.


5 slides
E-Learning and Digital Education Trends Presentation
Stay ahead in the digital learning space with the E-Learning and Digital Education Trends Presentation template. Designed for educators, trainers, and e-learning professionals, this modern and insightful layout highlights key trends, innovative tools, and strategies in online education. With fully customizable elements, you can tailor the slides to your audience’s needs. Compatible with PowerPoint, Keynote, and Google Slides for a seamless presentation experience.


7 slides
Responsibility Assignment Matrix Infographic Presentation Template
The Responsibility Assignment Matrix is a graphical tool used to visually represent the various assignments and the roles of each individual in a project. It helps in better understanding who is responsible for what, and who is accountable for results. This is a matrix that identifies the key tasks involved in a project, and maps them to the individuals responsible for completing them. Use this template to emphasizes on the role of managers and the organizational goals. This simple template is designed to help teams create an effective accountability model, perfect for your next project!


20 slides
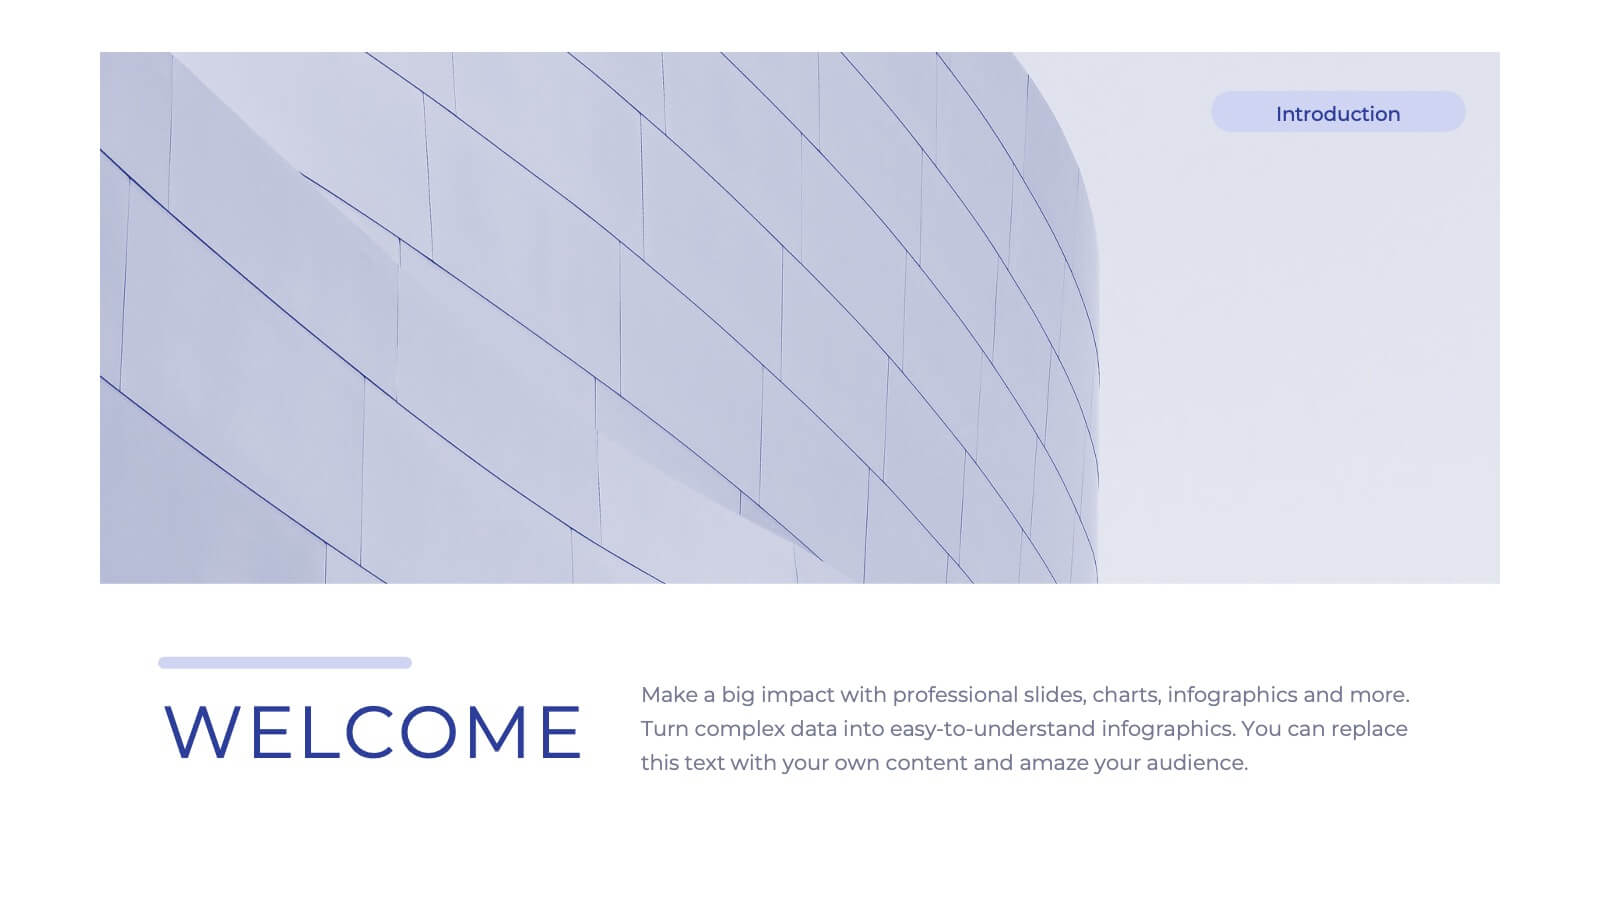
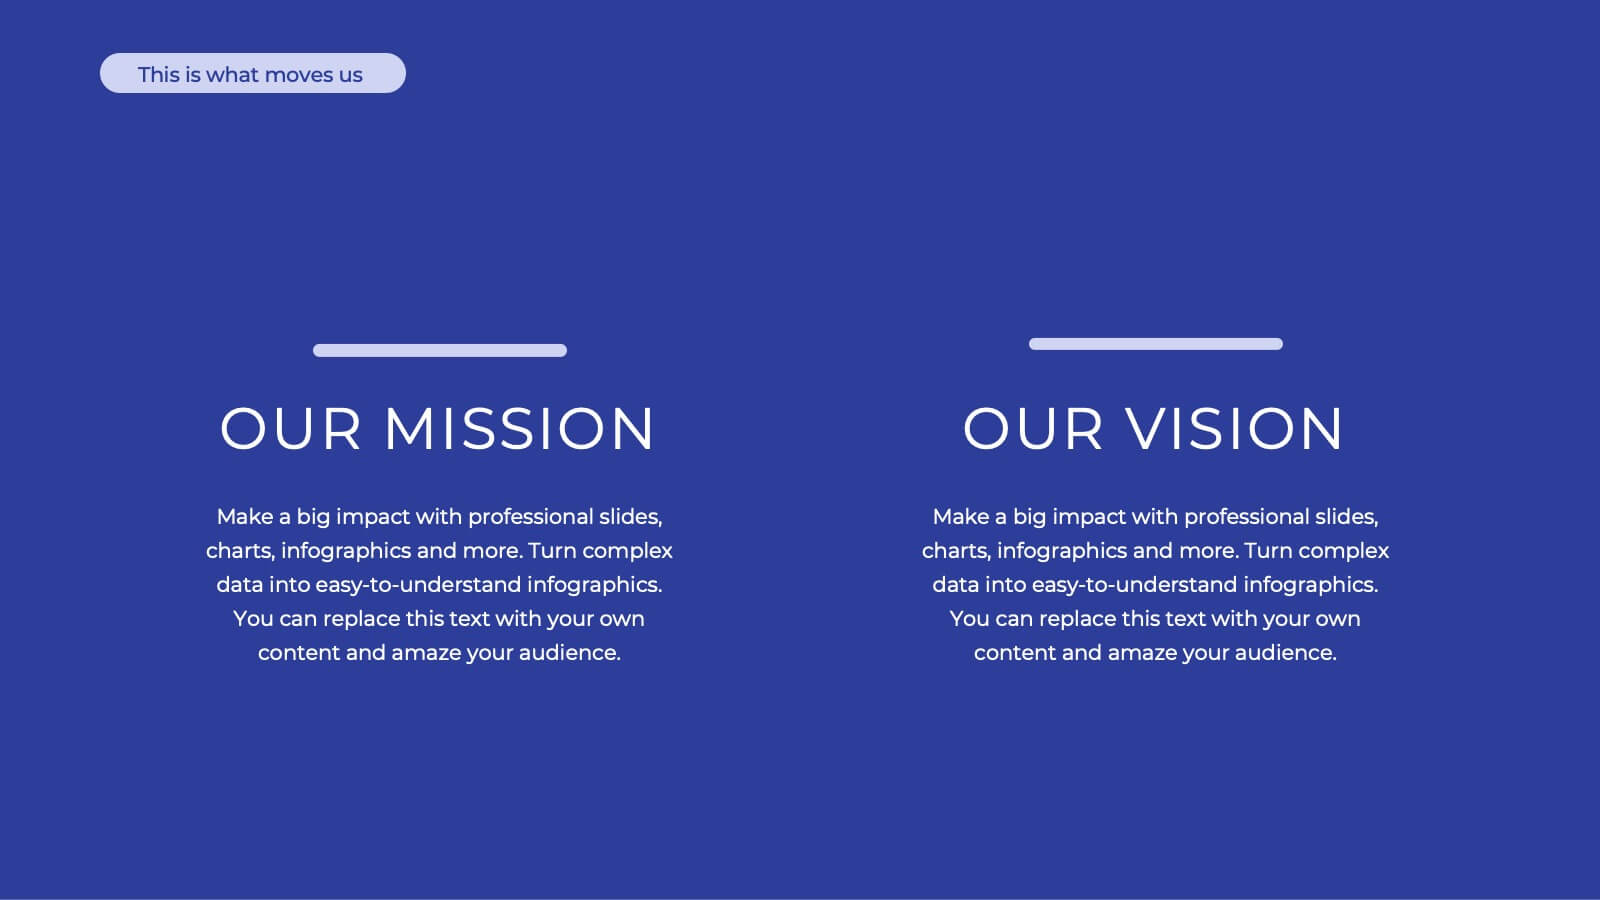
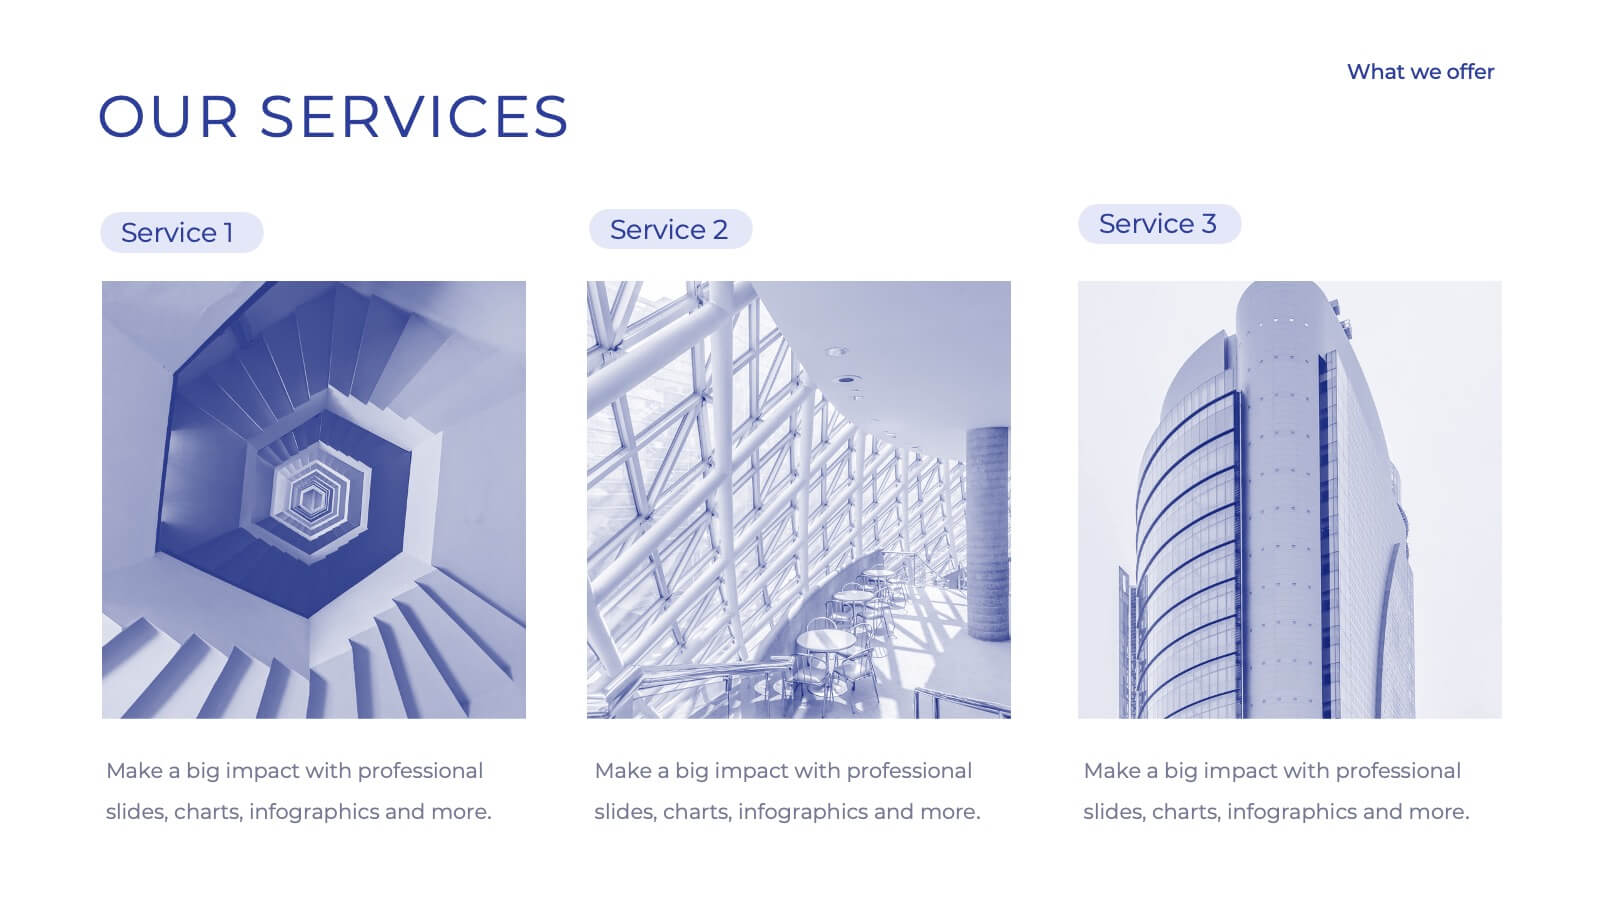
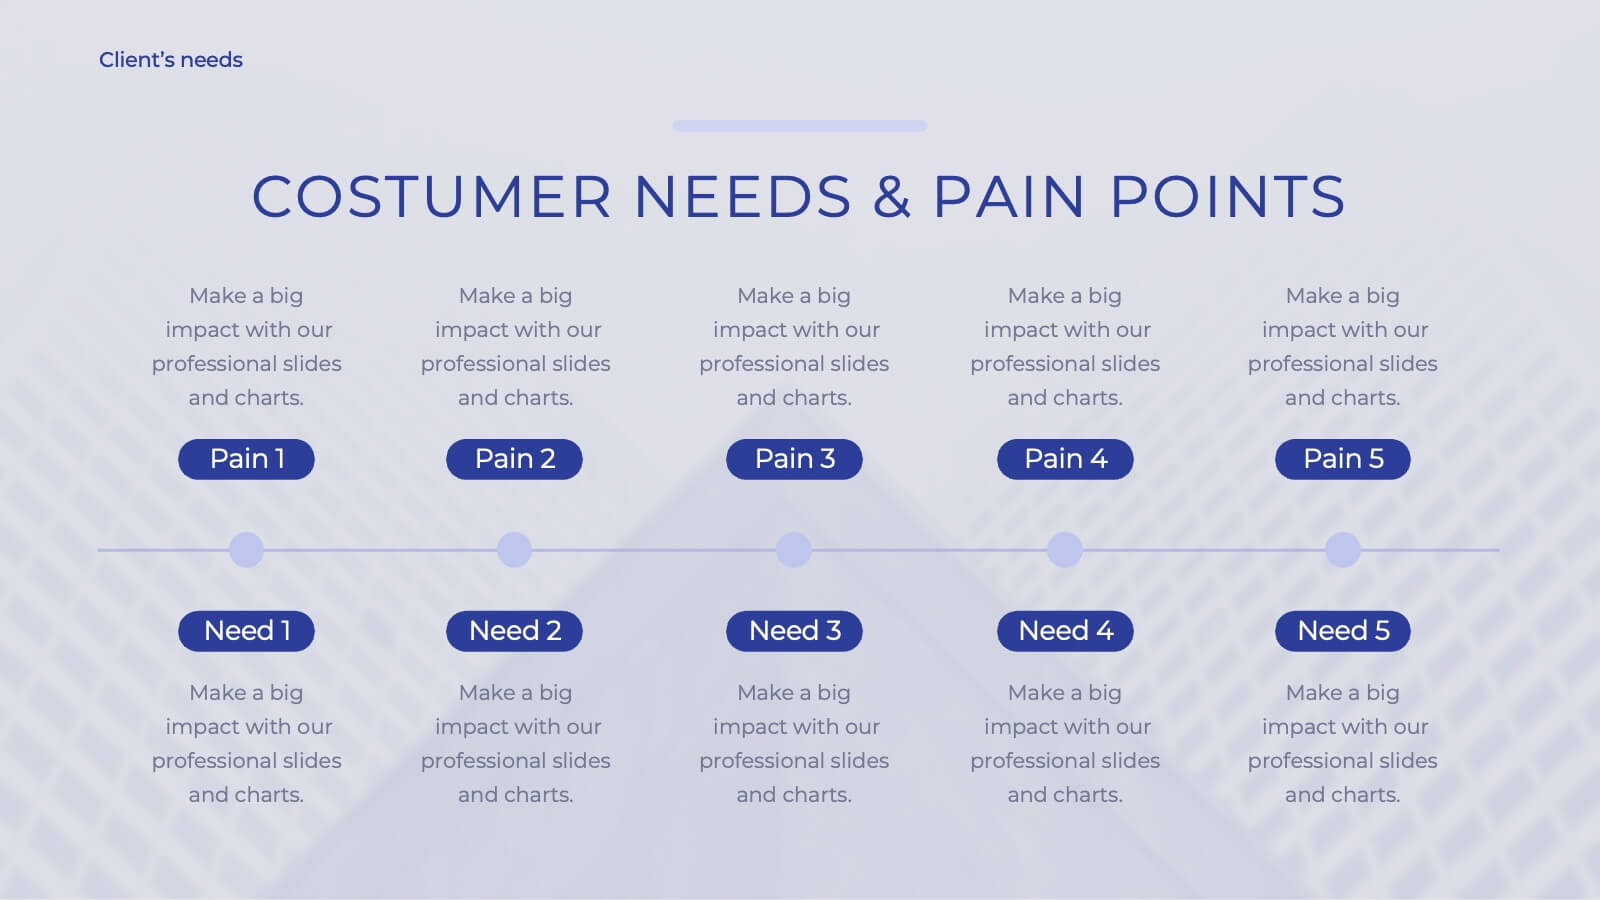
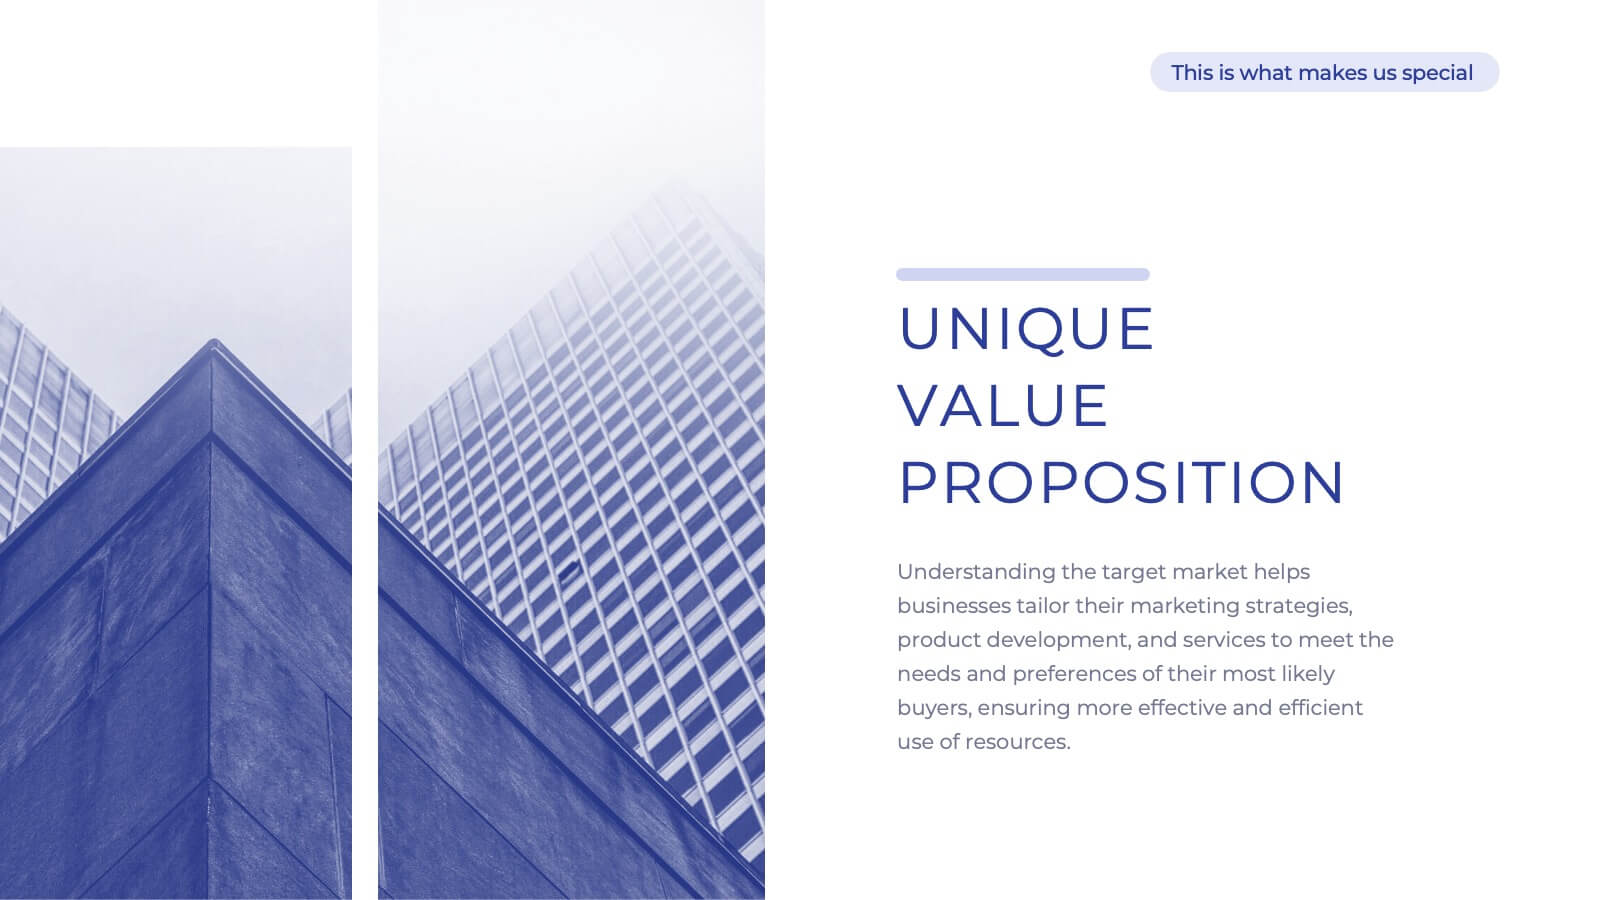
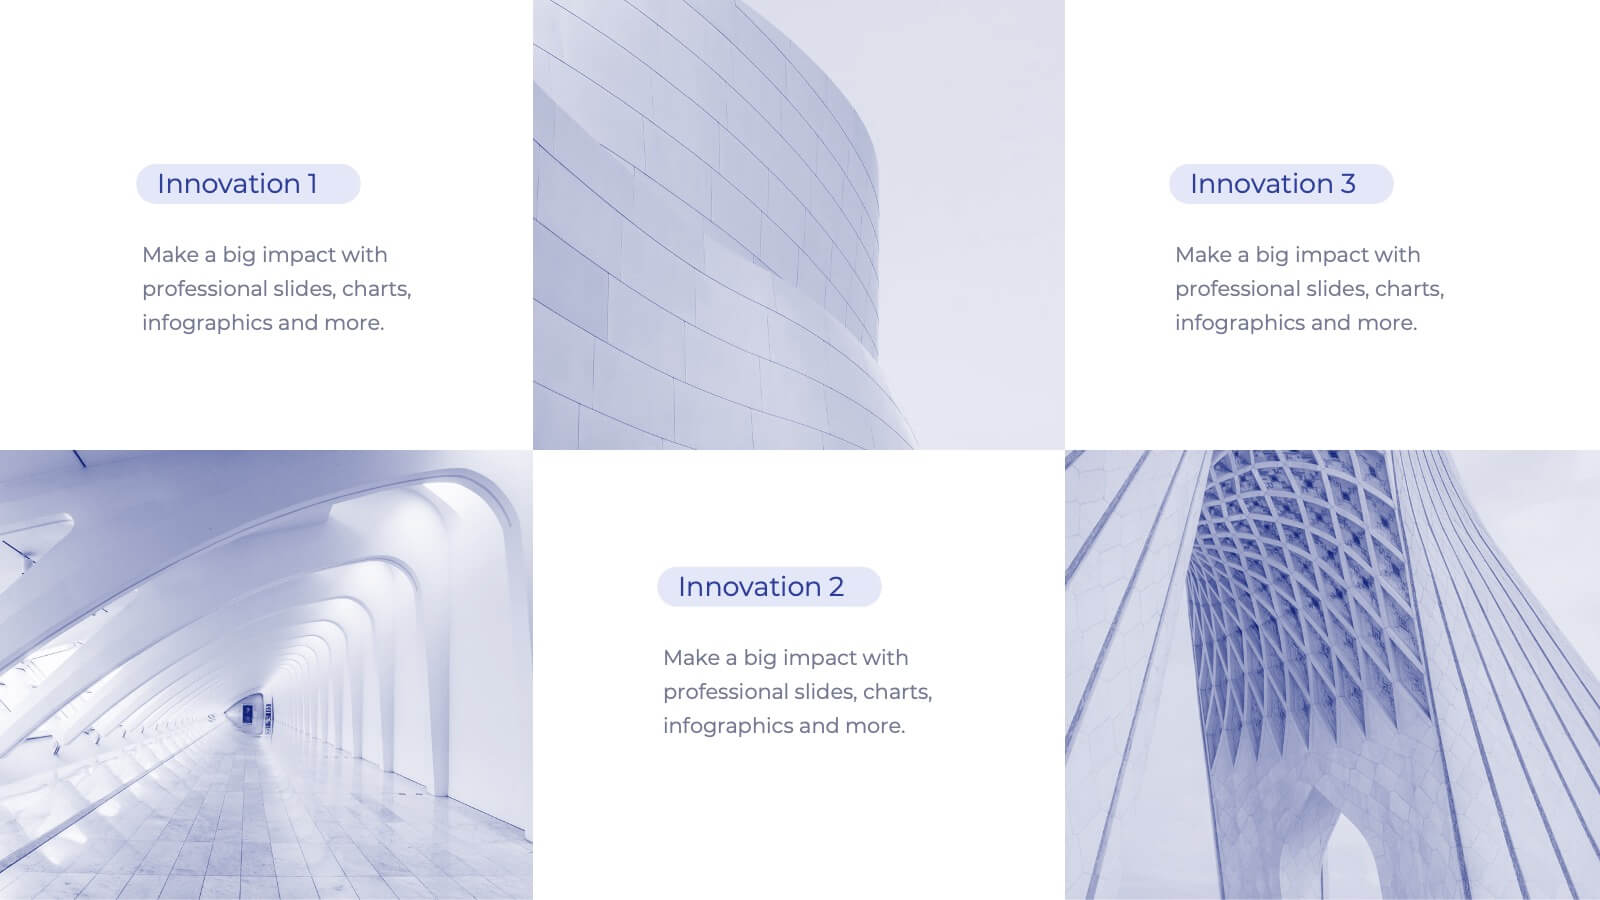
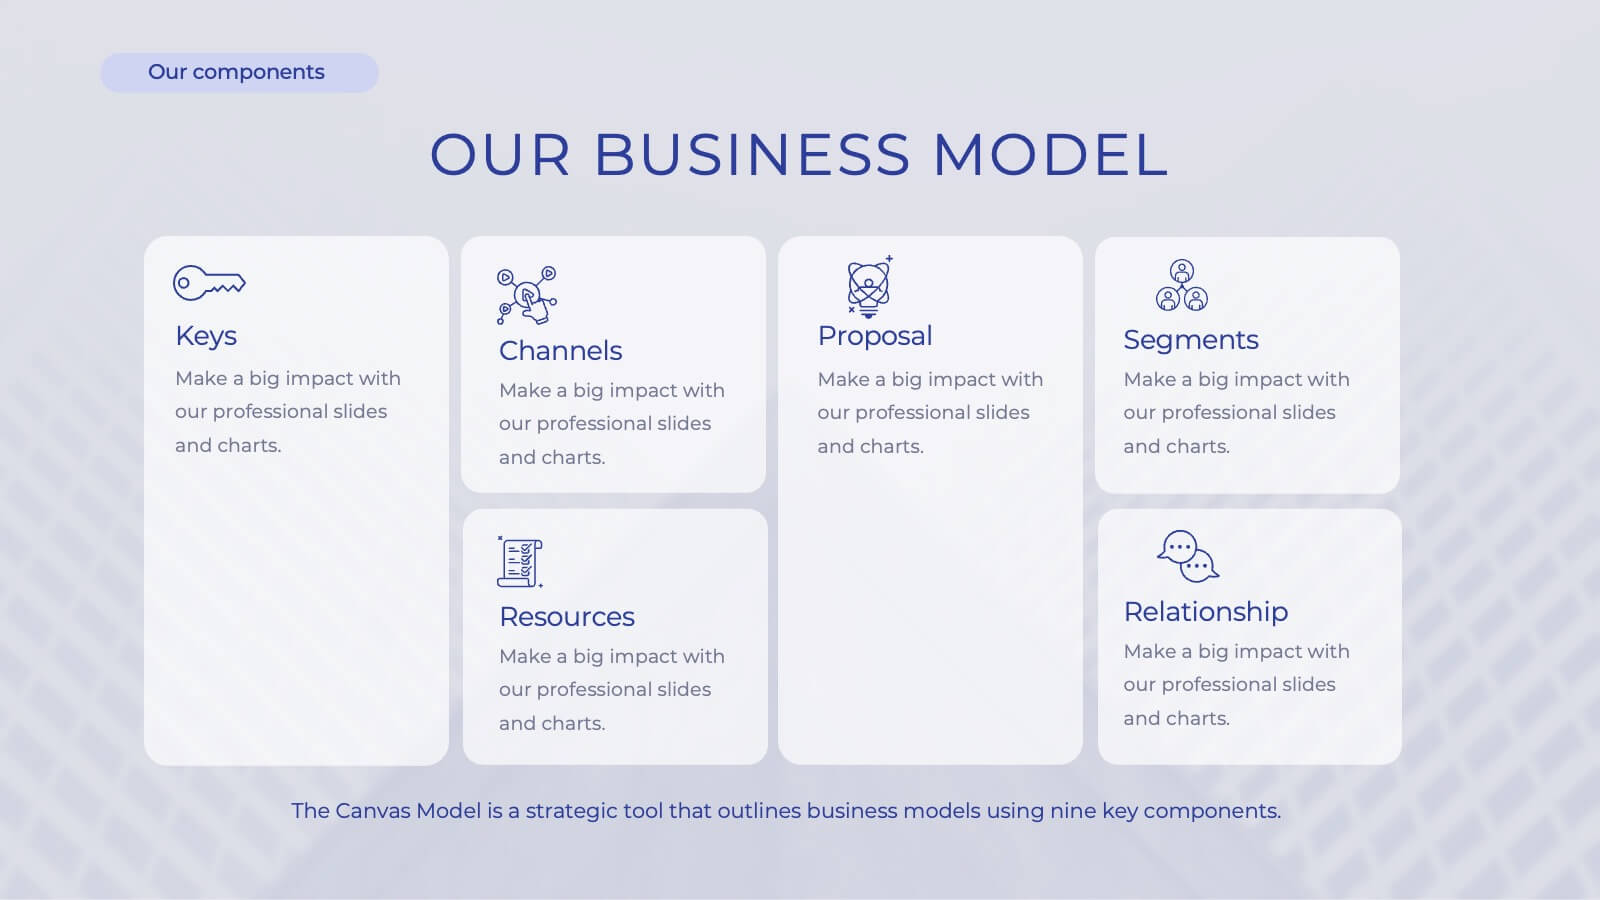
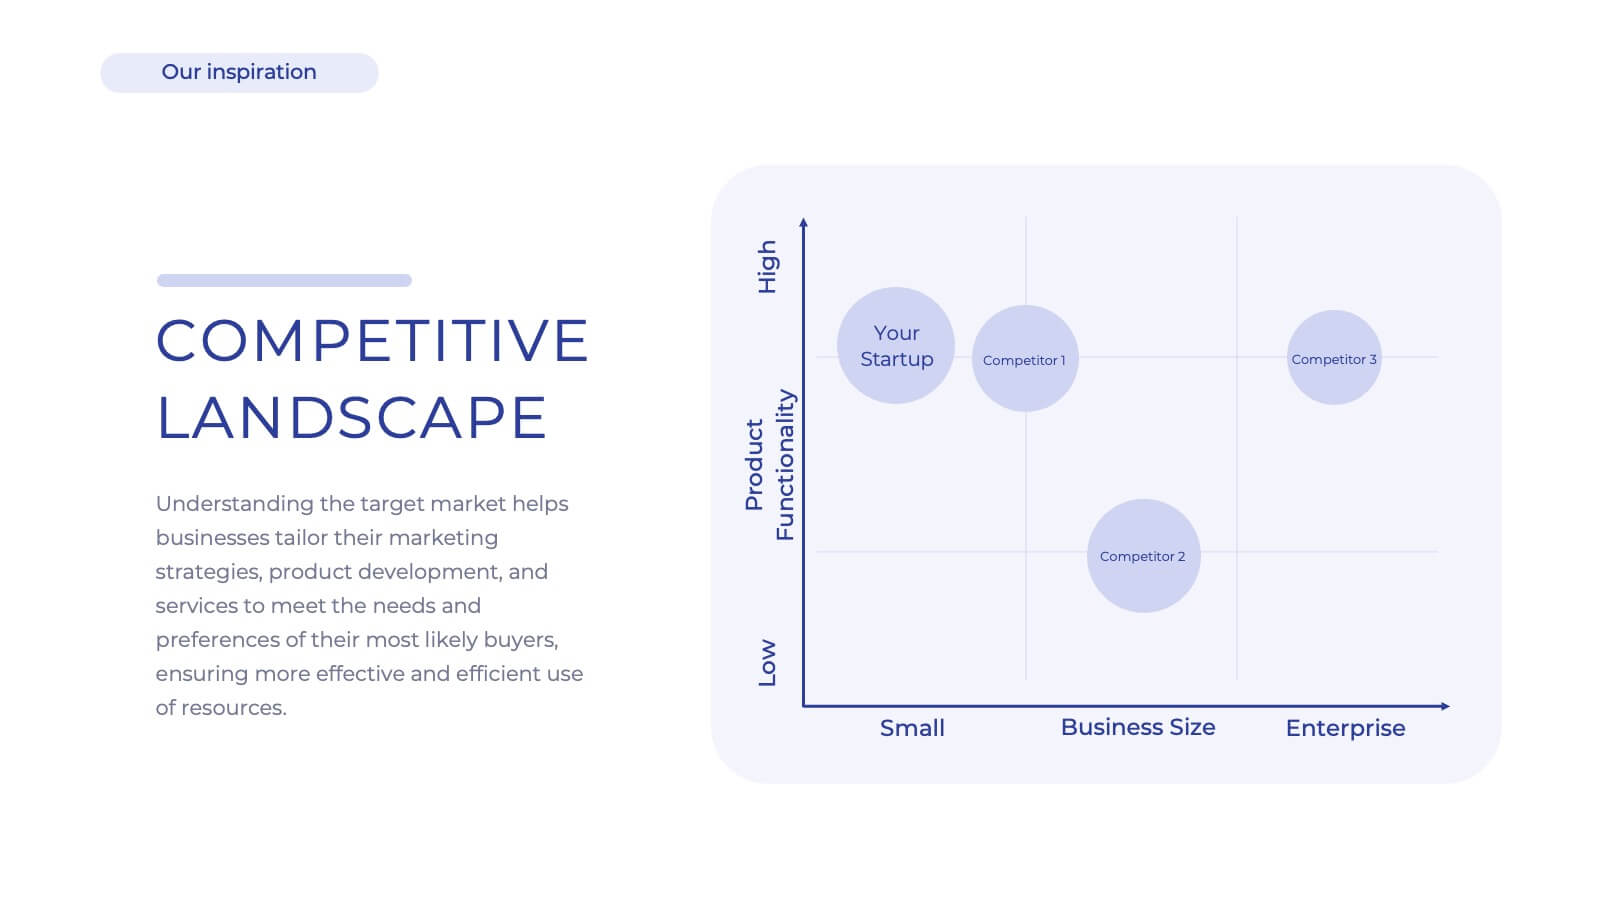
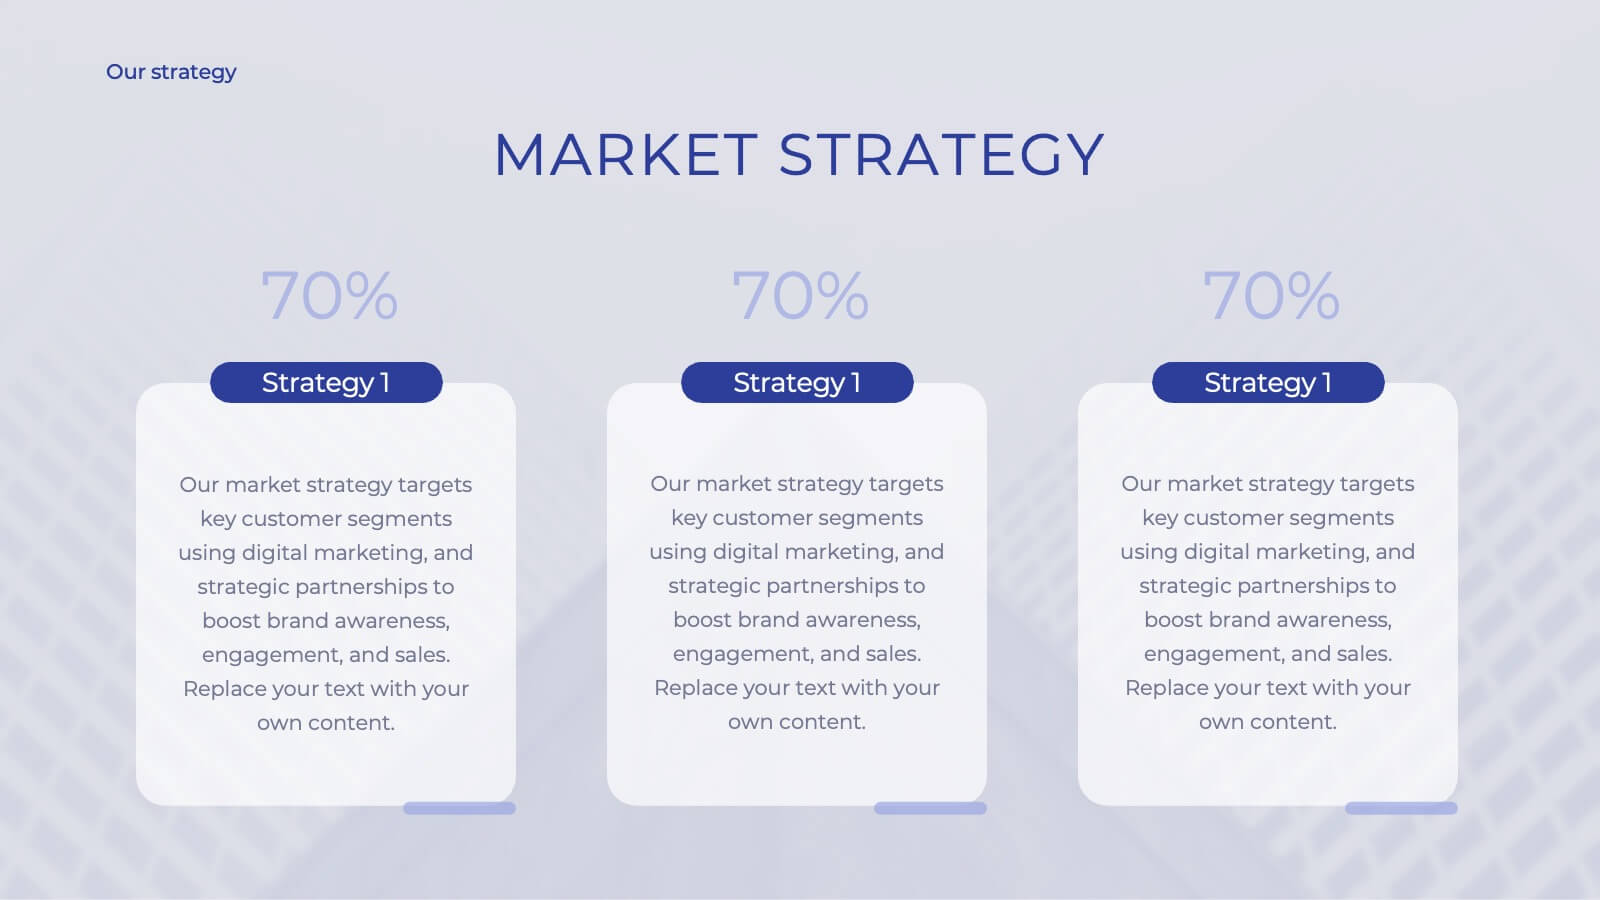
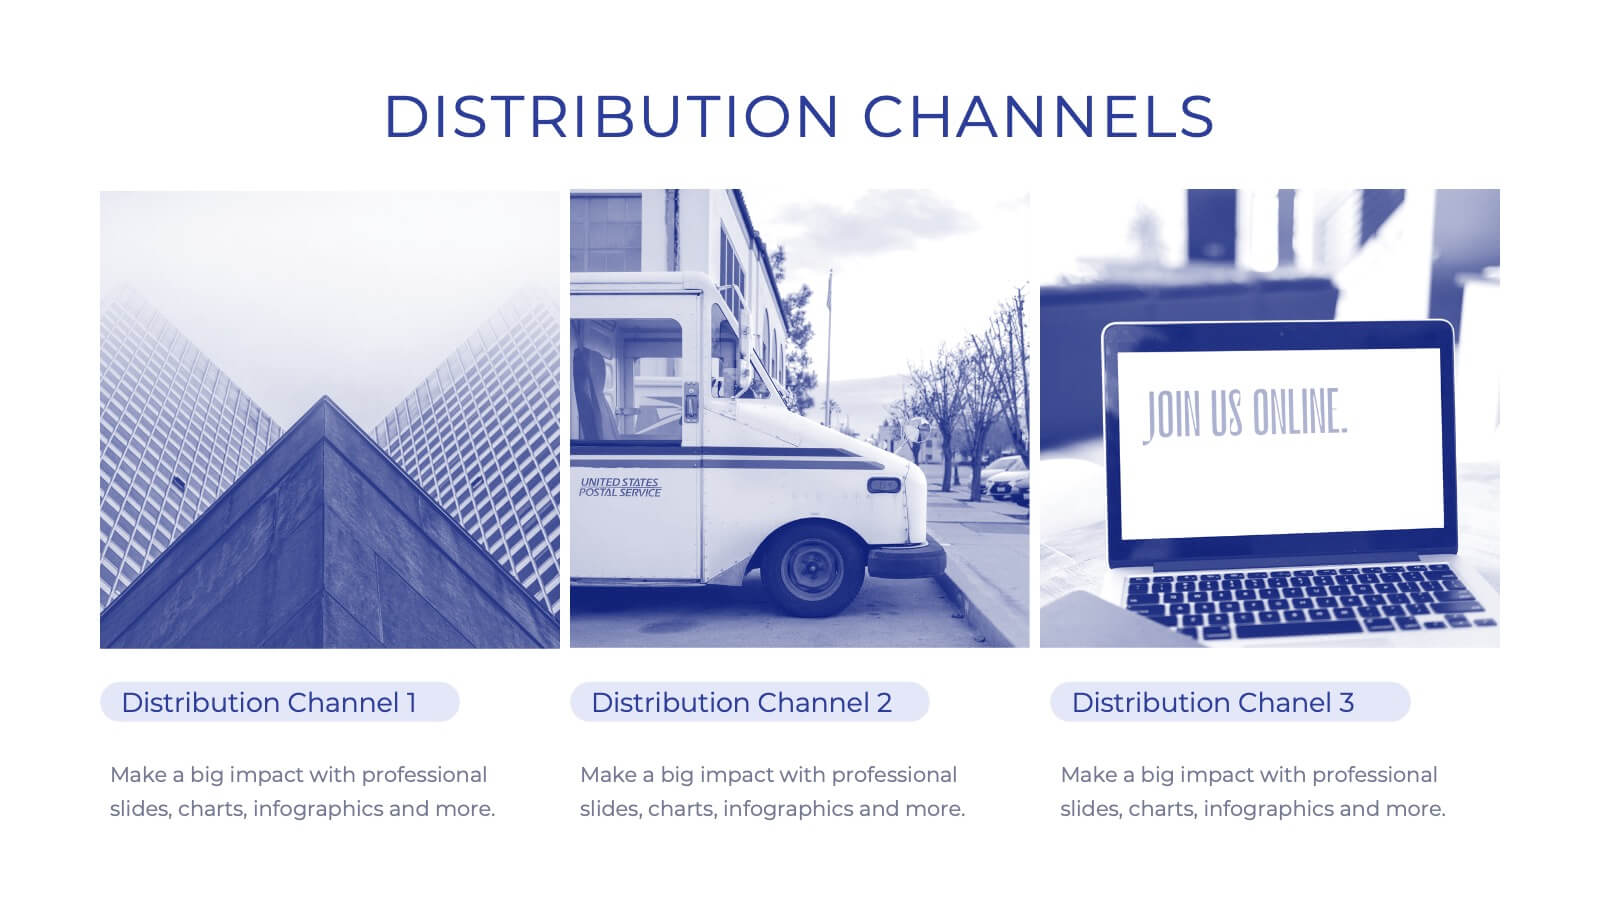
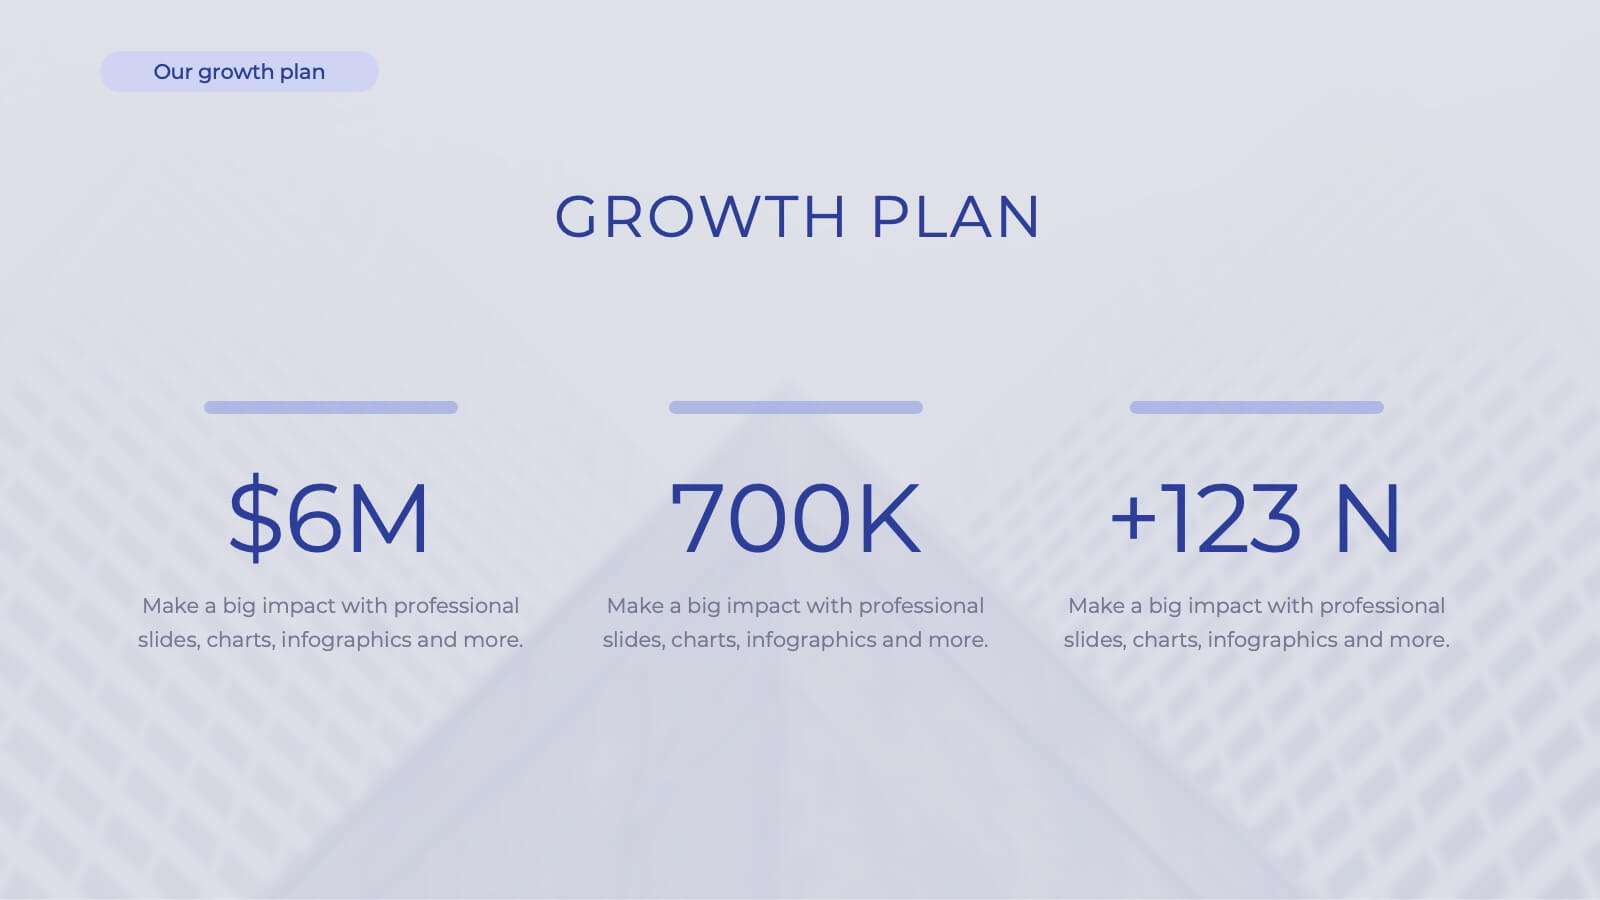
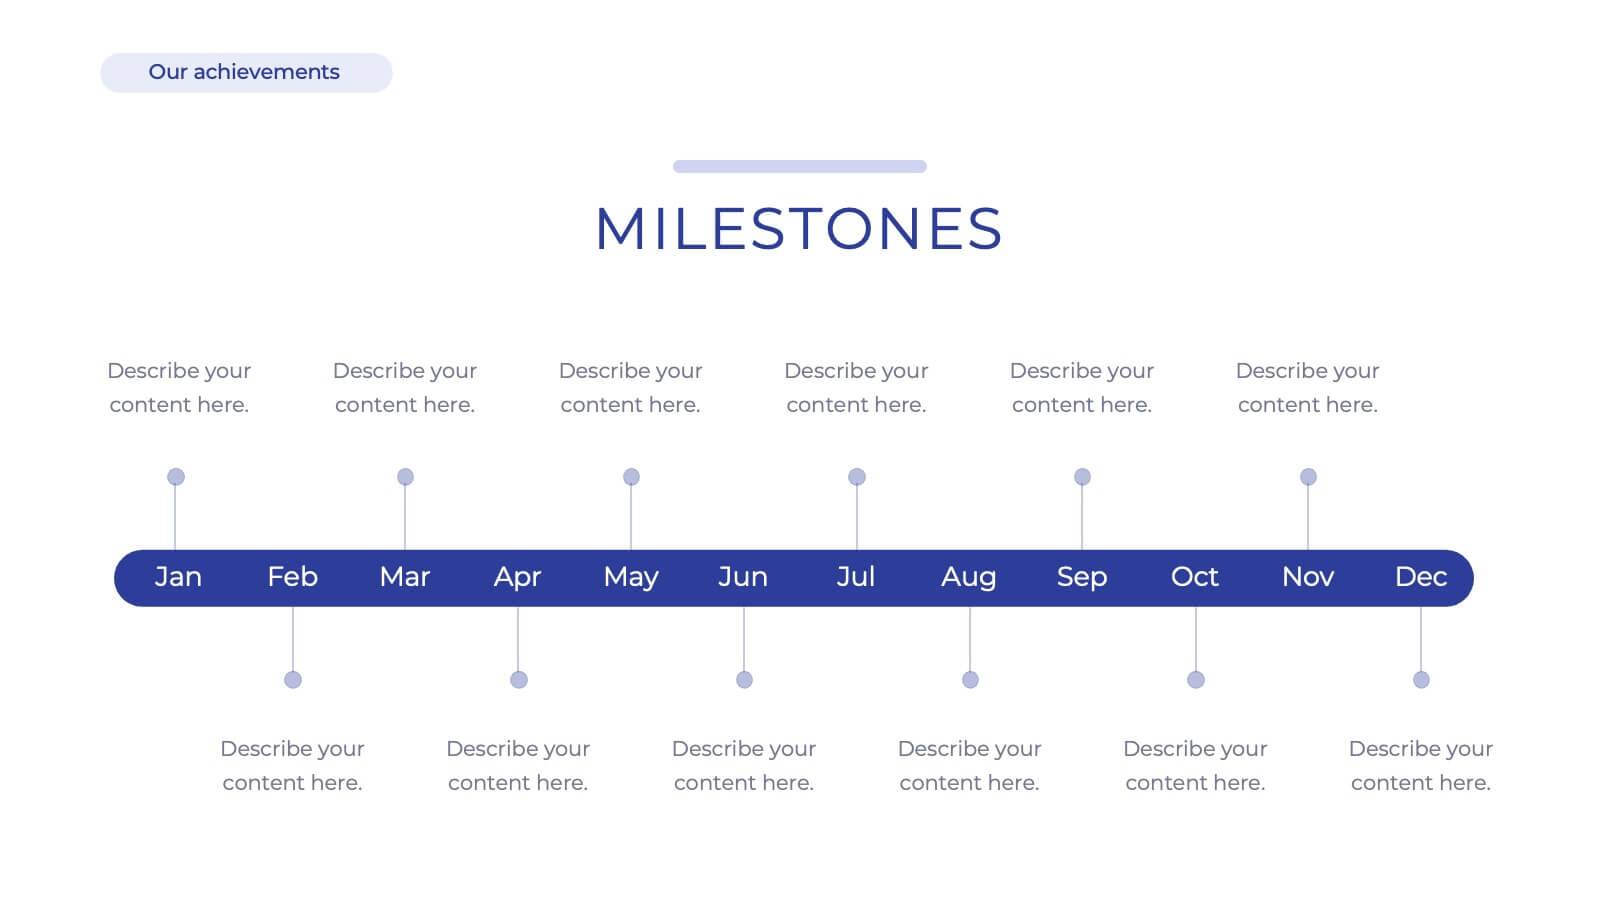
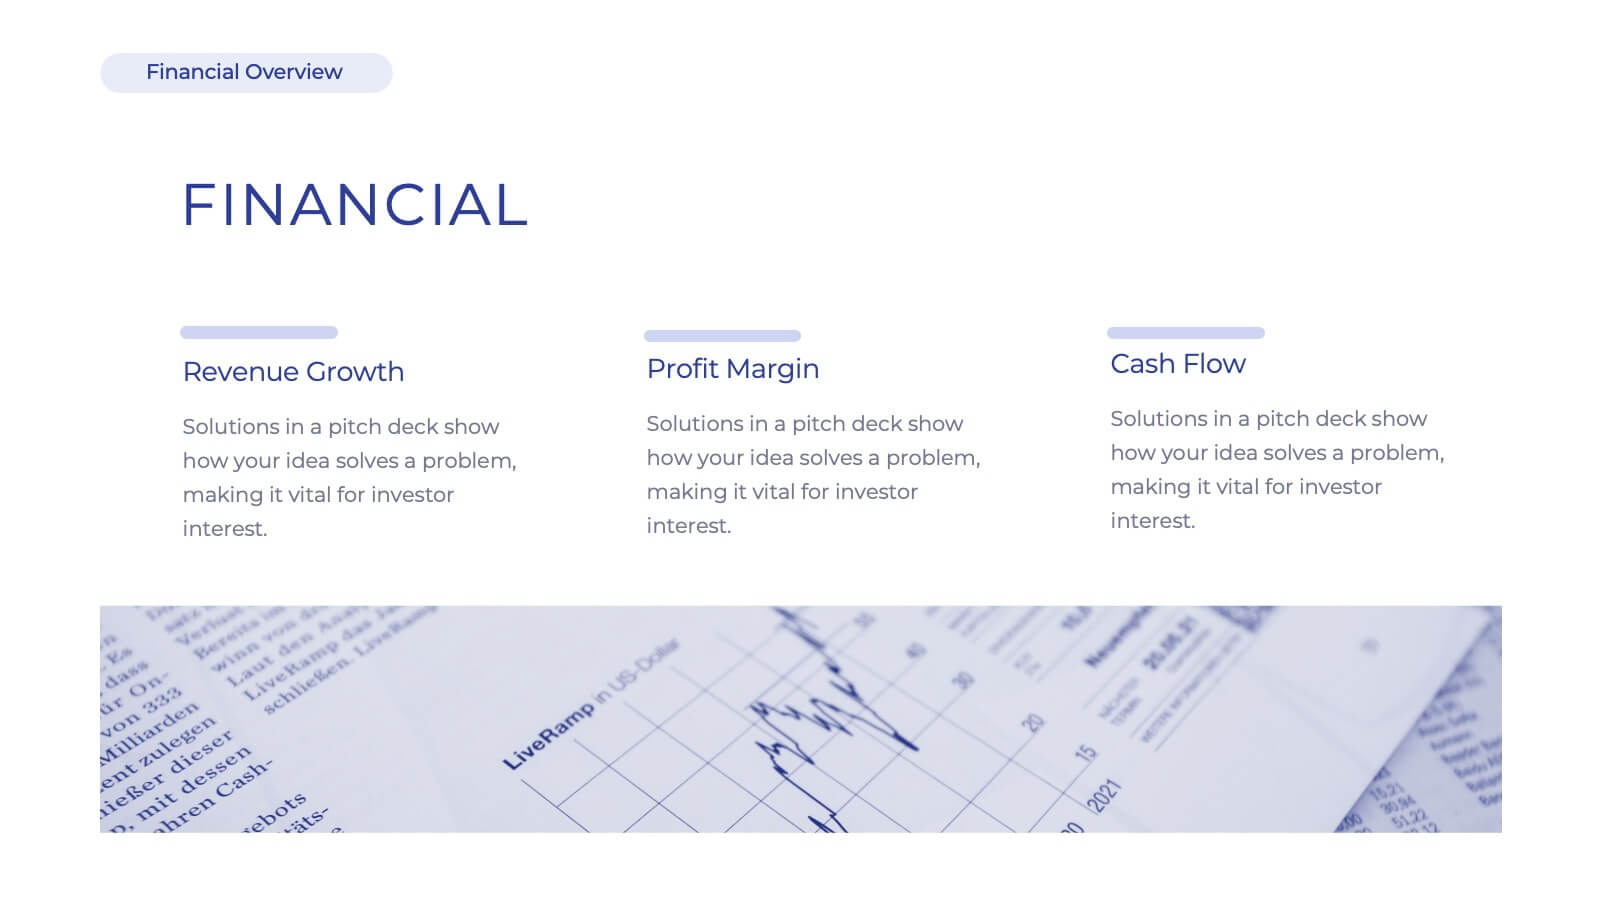
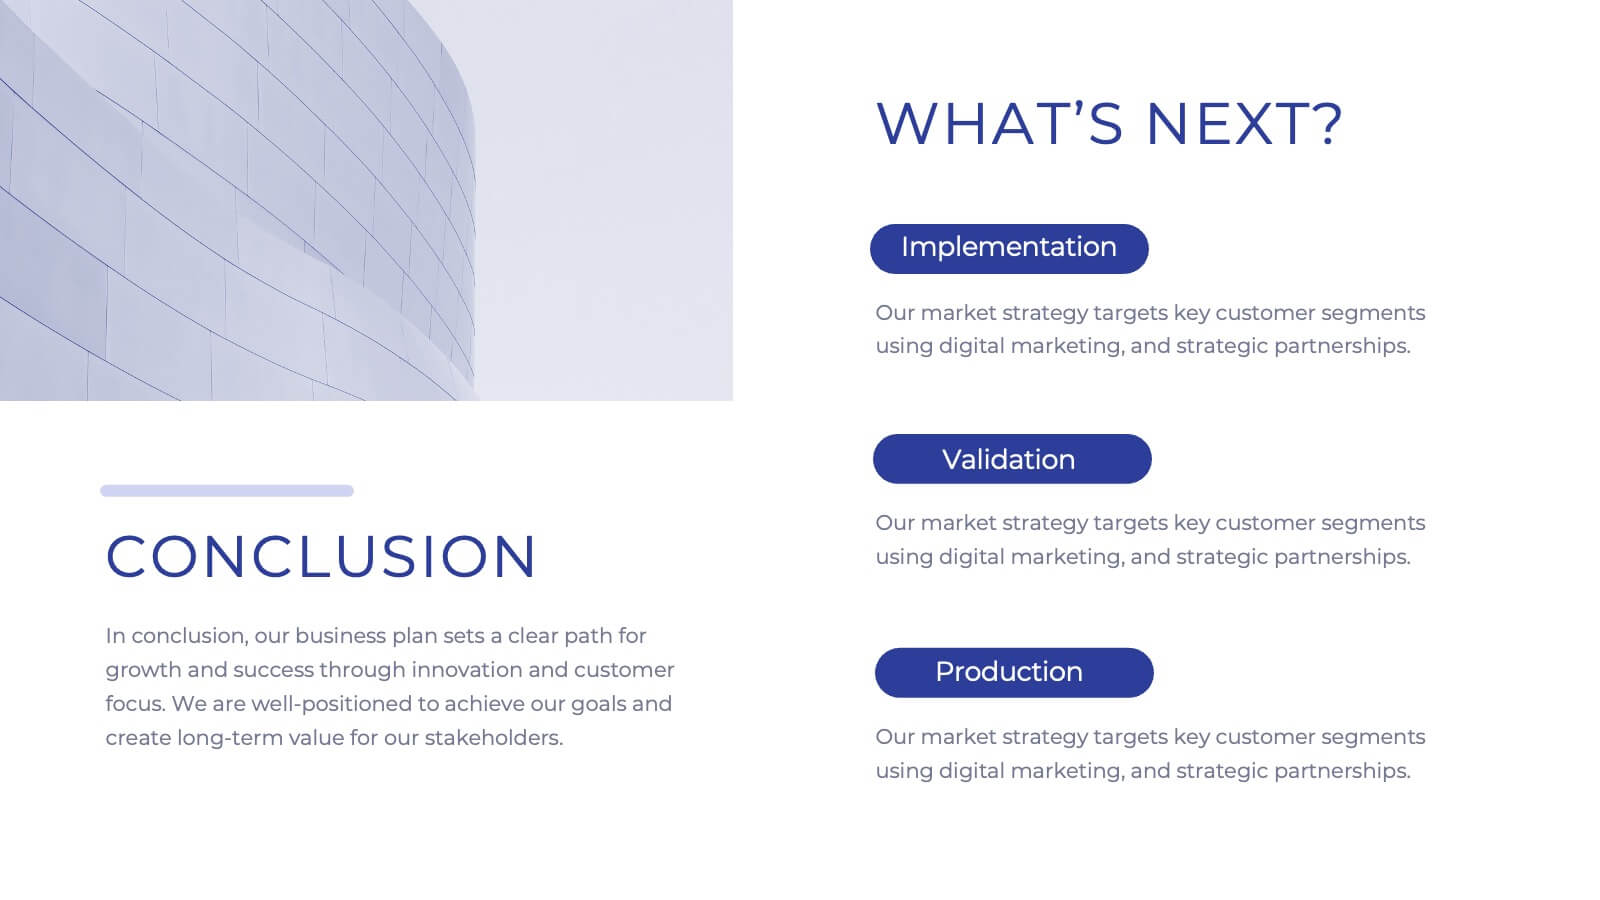
Iconic Startup Business Plan Presentation
Introducing our comprehensive corporate business plan template! Perfect for showcasing your company’s mission, vision, and services. Highlight your market strategy, competitive landscape, and growth plan in a professional design. Ideal for executives and entrepreneurs. Compatible with PowerPoint, Keynote, and Google Slides.