


Features
- 5 Unique slides
- Fully editable and easy to edit in Microsoft Powerpoint, Keynote and Google Slides
- 16:9 widescreen layout
- Clean and professional designs
- Export to JPG, PDF or send by email


Do you have any questions?
Recommend


5 slides
Breast Cancer Prevention Infographics
Breast Cancer is a serious disease that affects millions of people worldwide. These infographics are visual representations of information that provide tips and strategies to help prevent breast cancer. These infographics include statistics about breast cancer, risk factors, and preventative measures that can be taken to reduce the risk of developing the disease. You can also use these to provide information on screening and early detection, such as mammograms and self-exams. The visuals in these infographics may include icons, images, graphs, and charts to make the information easy to understand.


4 slides
Modern Transportation and Logistics Strategy Presentation
Move your audience through a fast-paced world of movement and delivery with a clean, visual slide that maps out each step of your logistics process. This layout helps explain workflows, supply chain stages, and transportation planning with clarity and ease. Fully compatible with PowerPoint, Keynote, and Google Slides.


23 slides
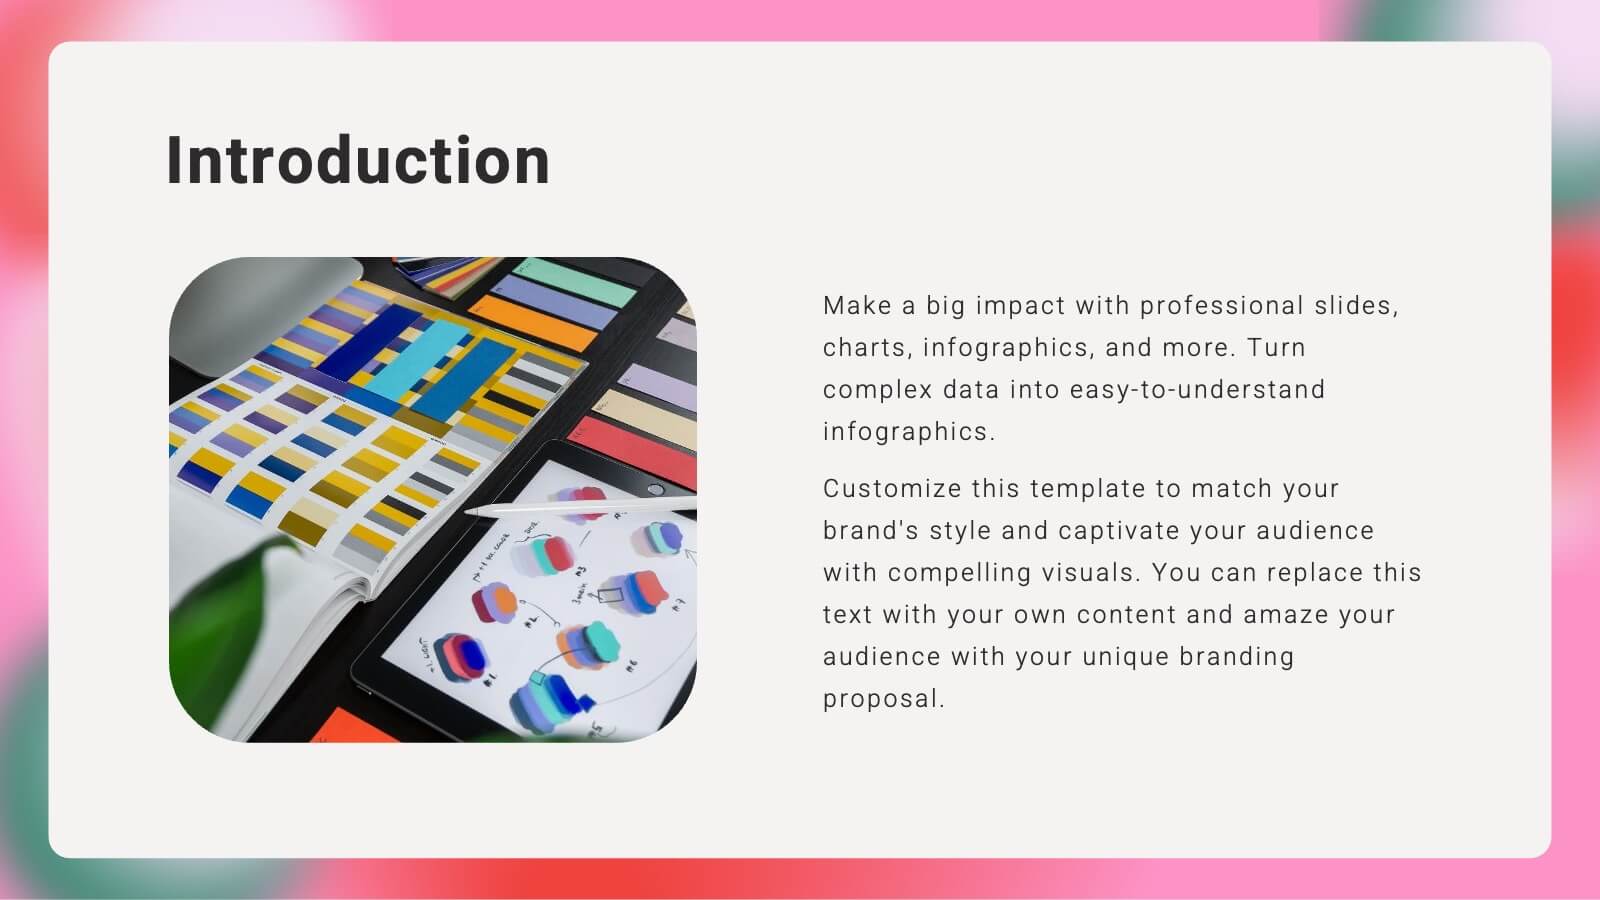
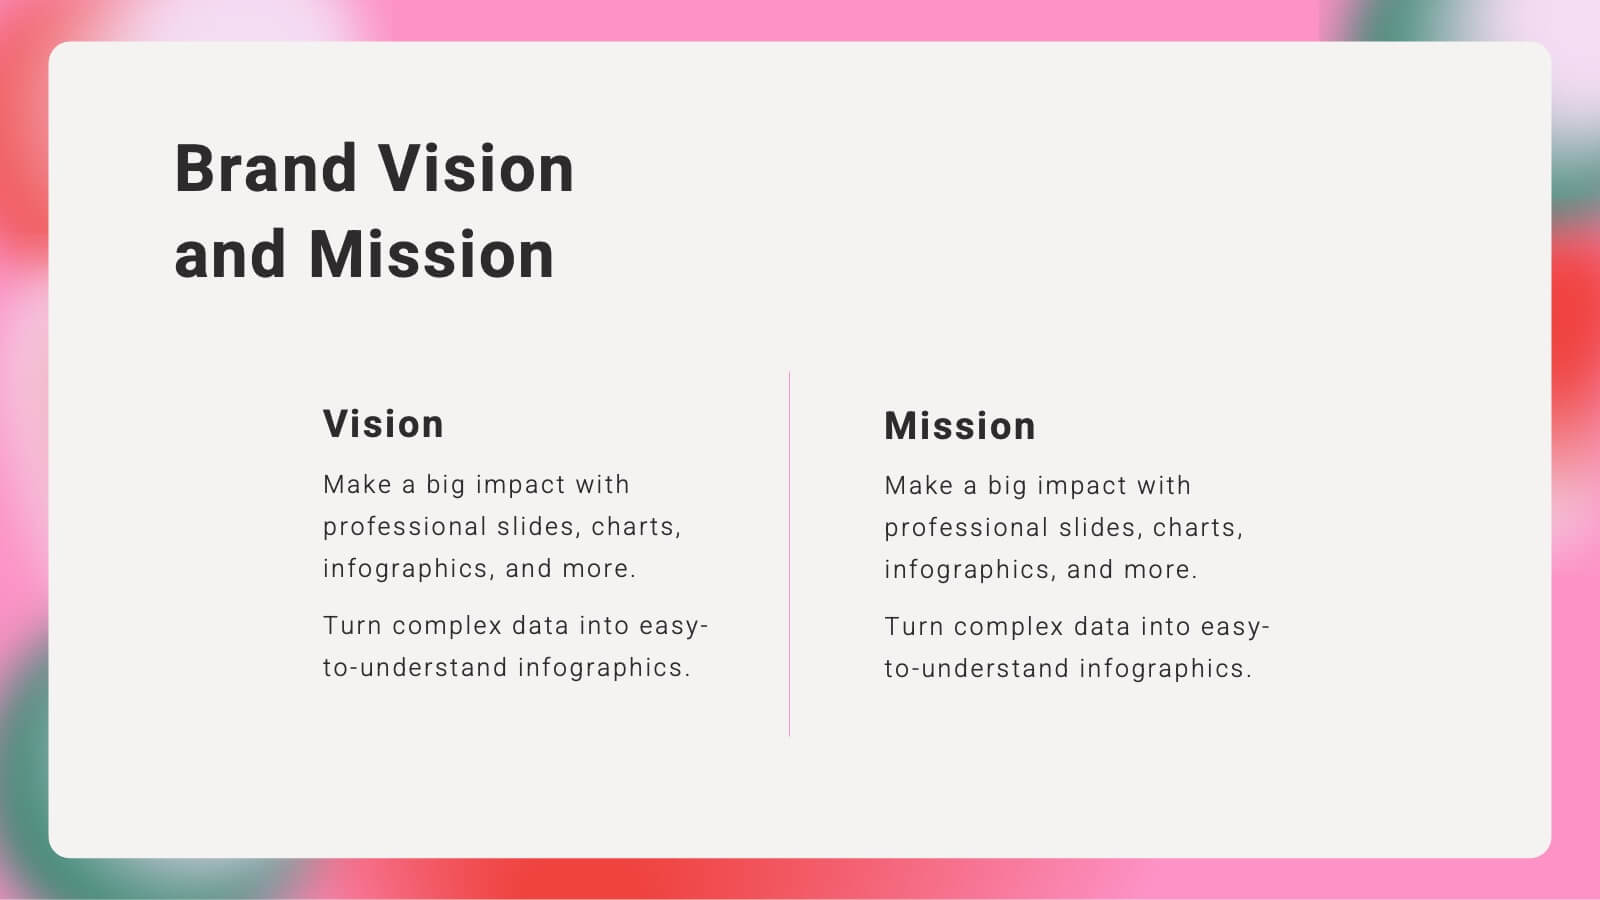
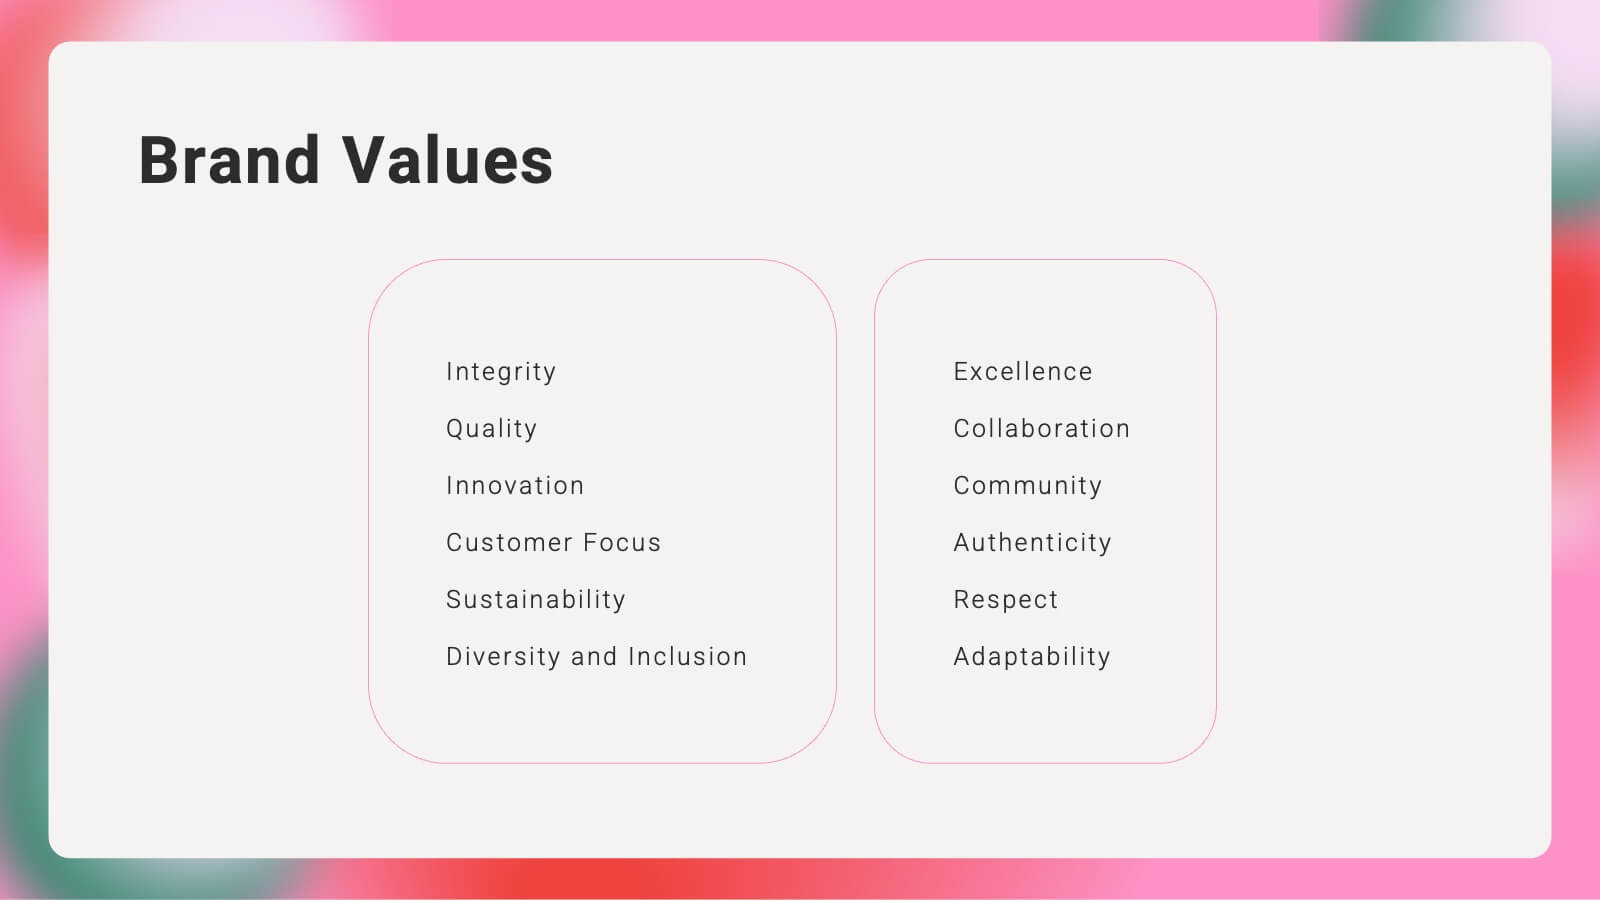
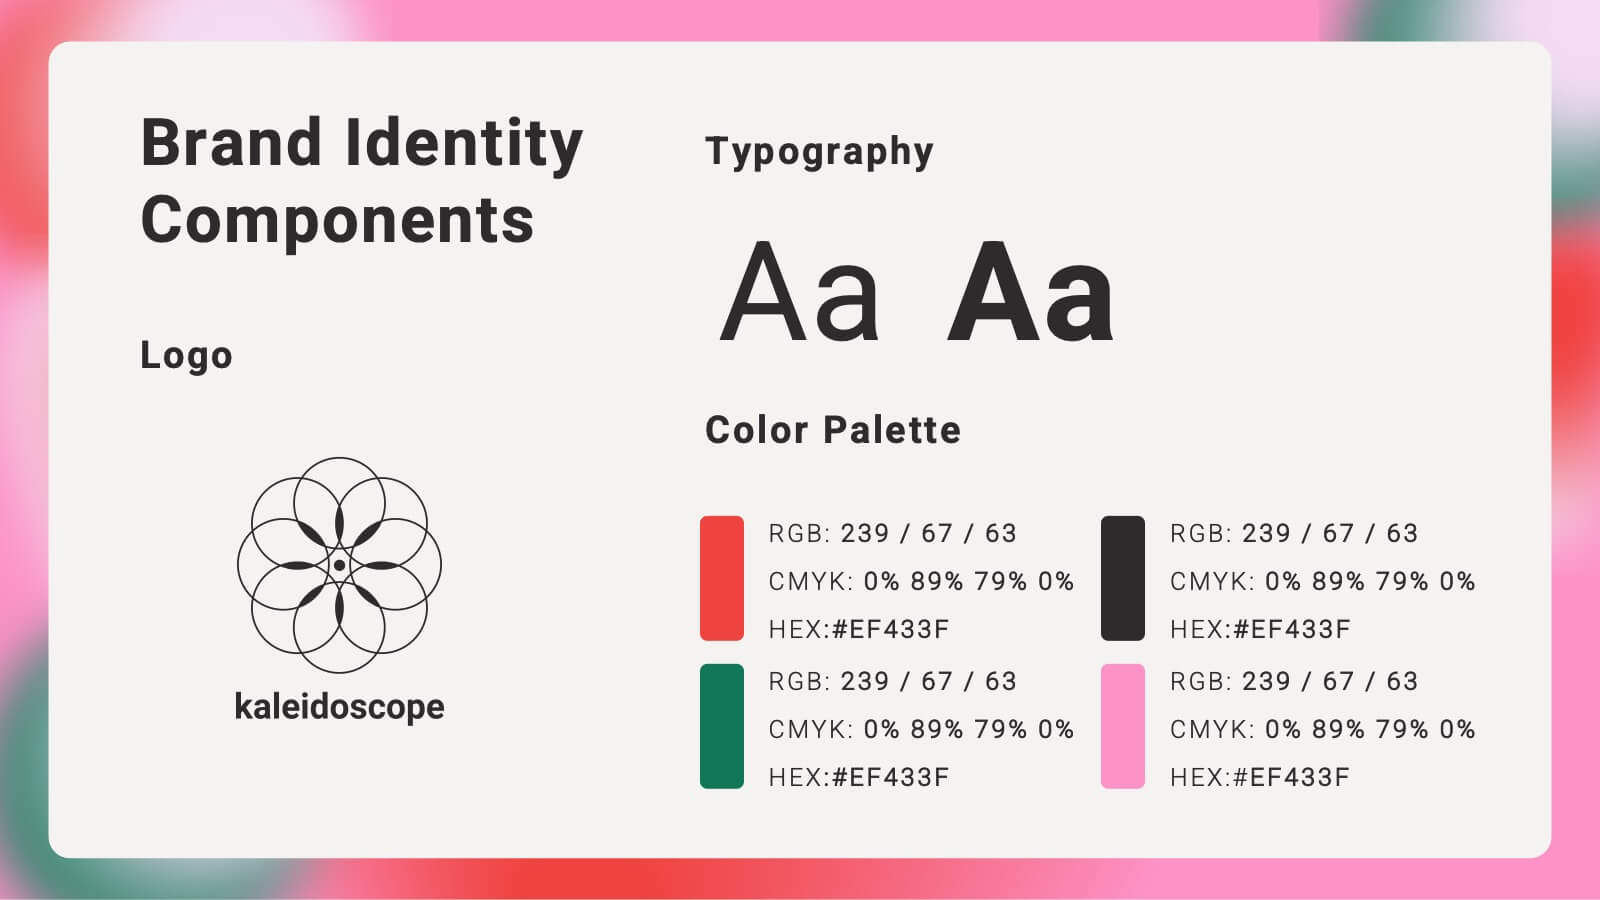
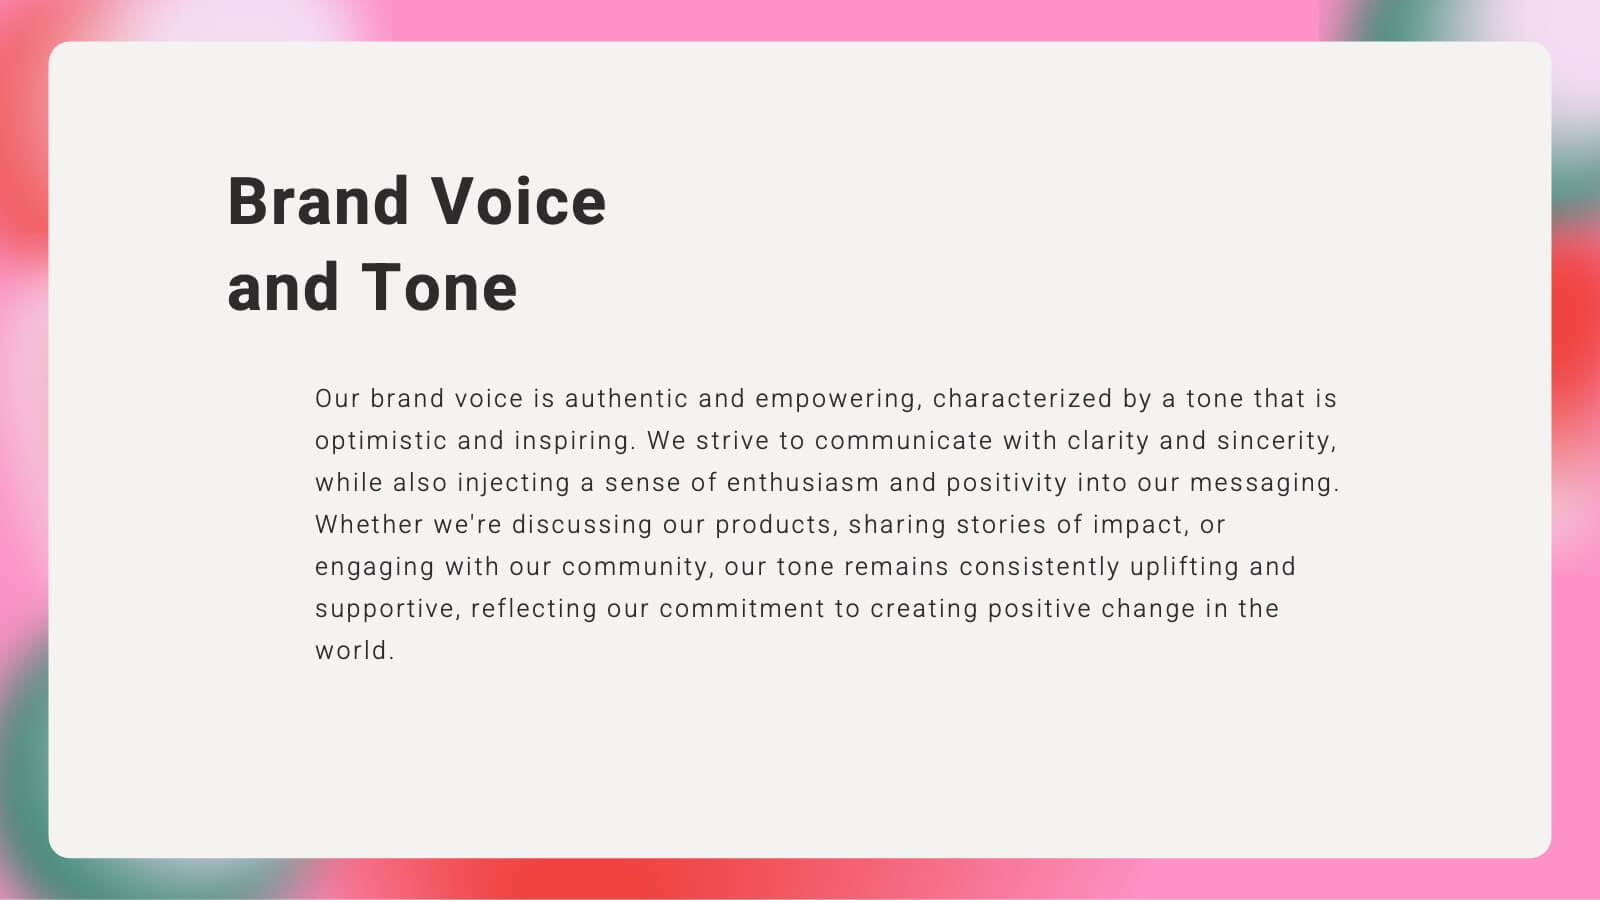
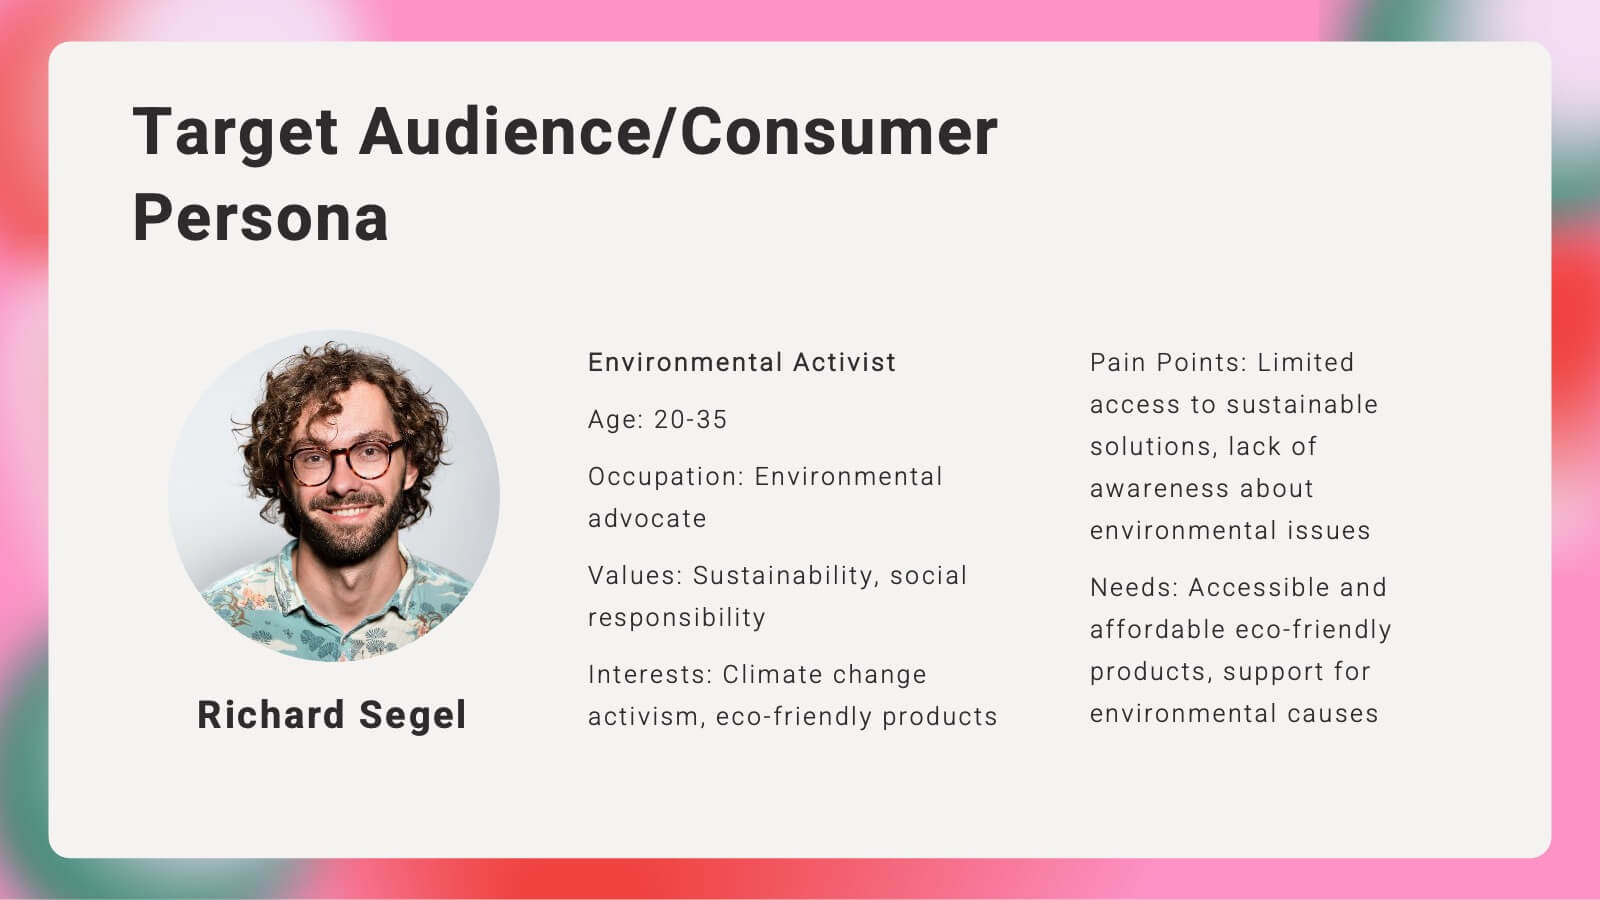
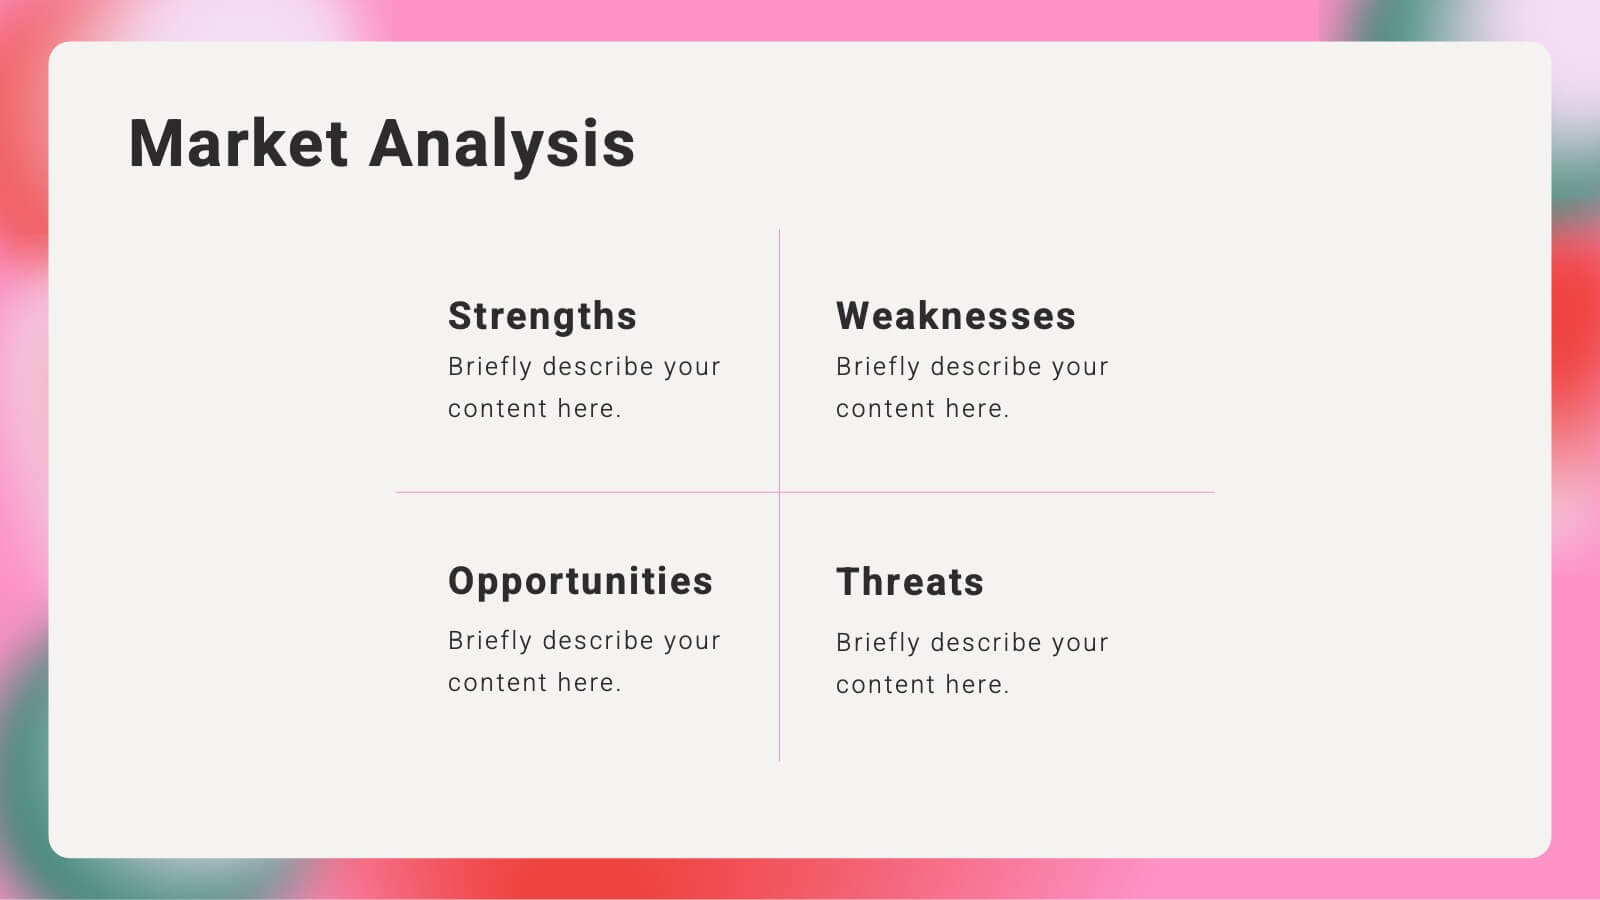
Kaleidoscope Brand Strategy Report Presentation
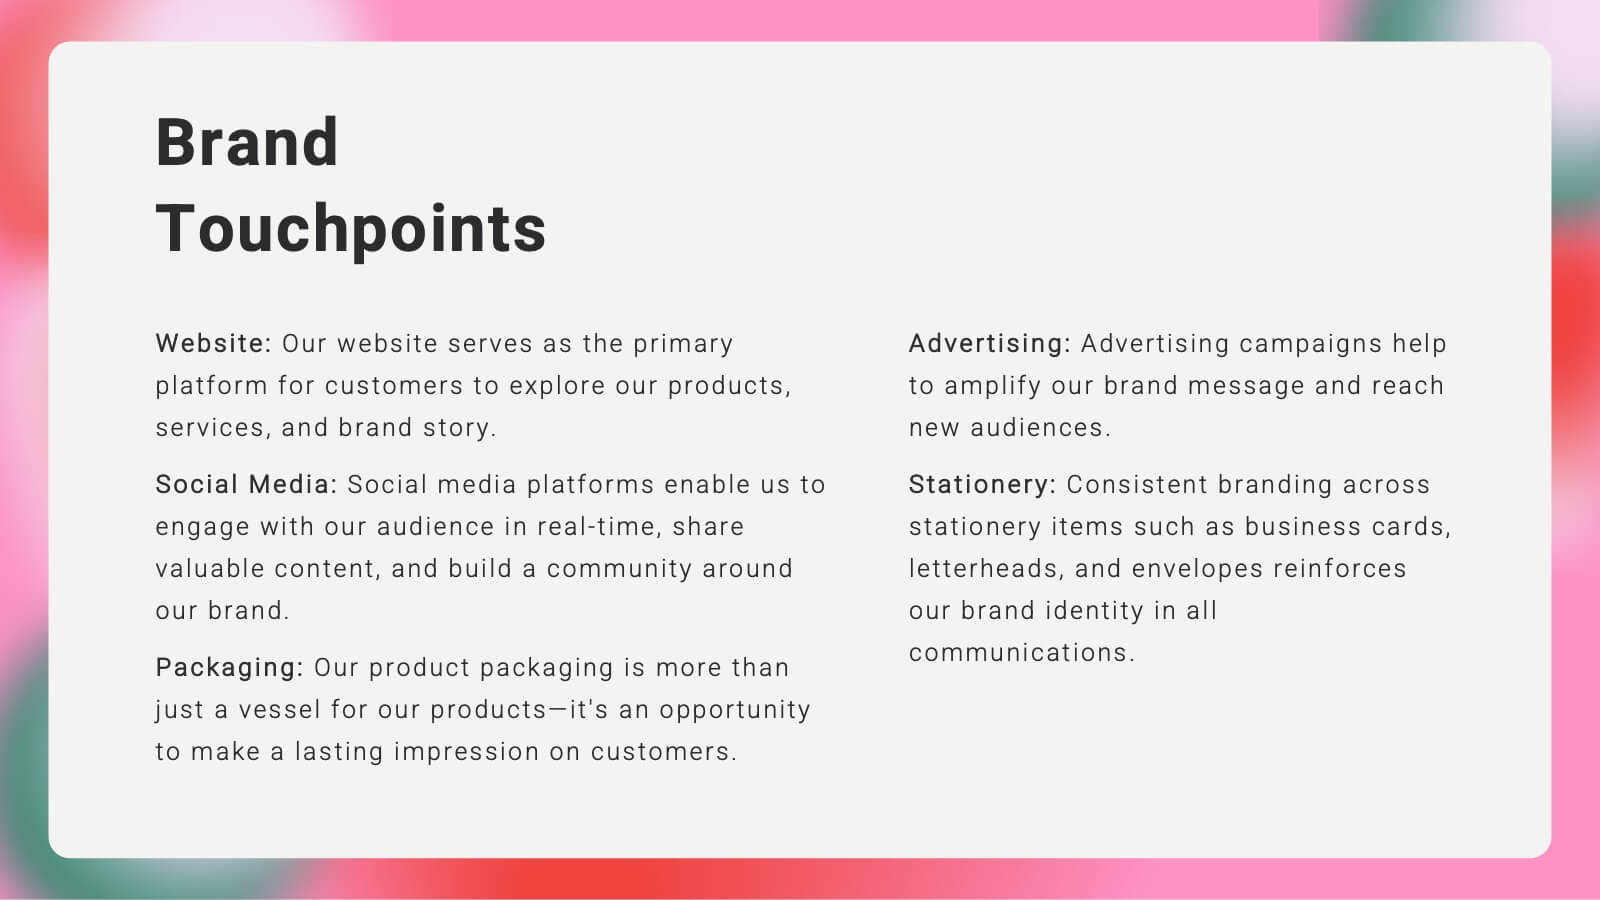
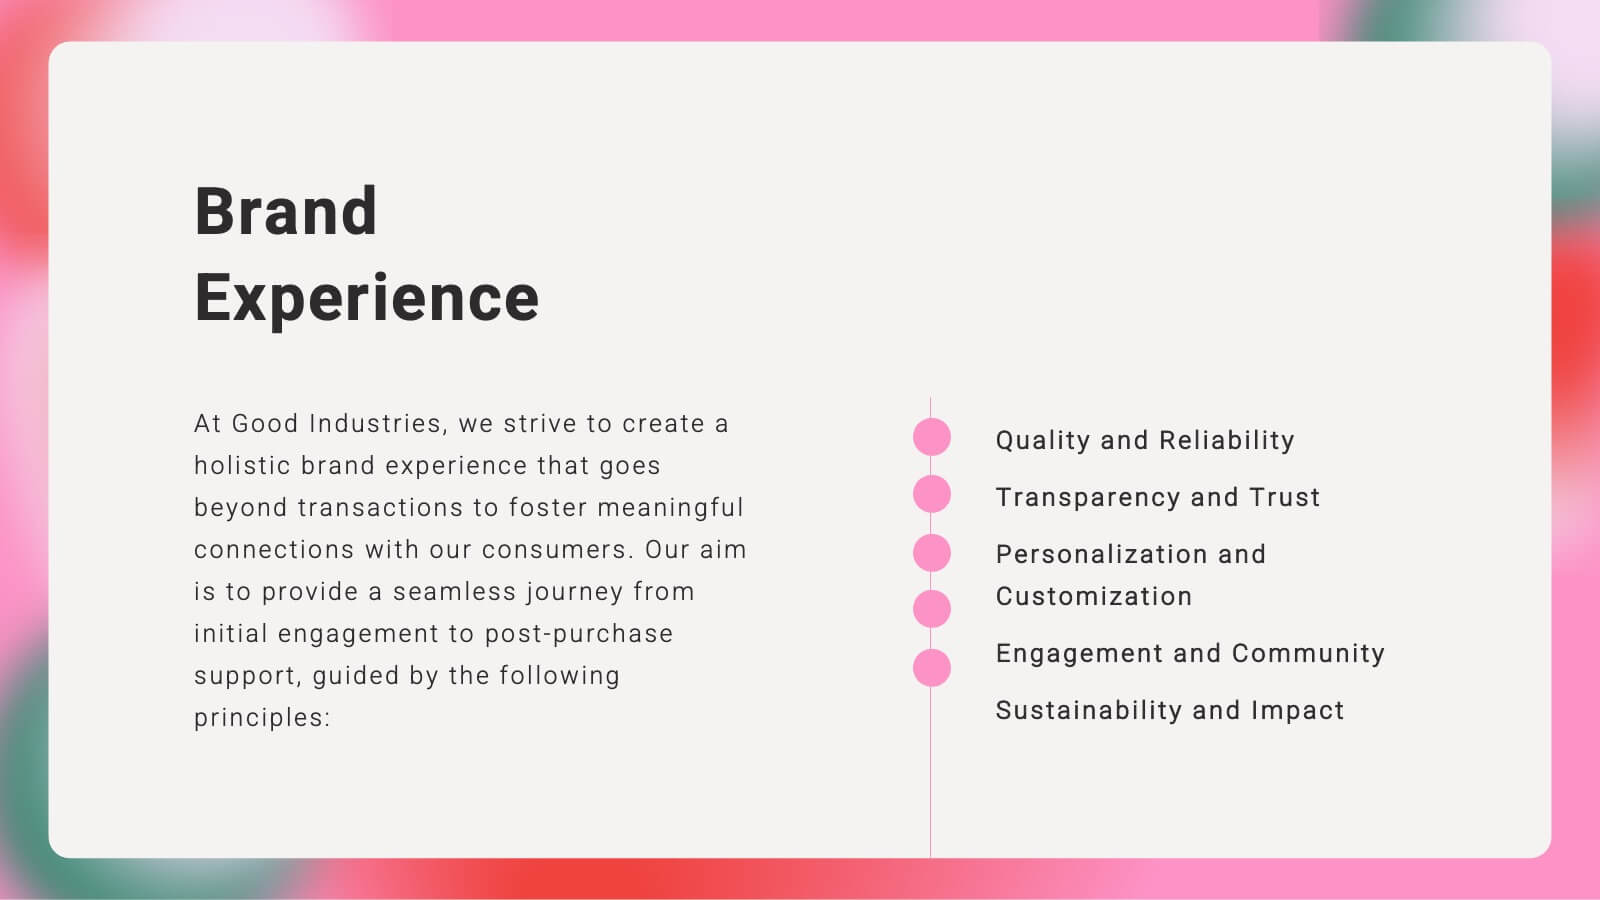
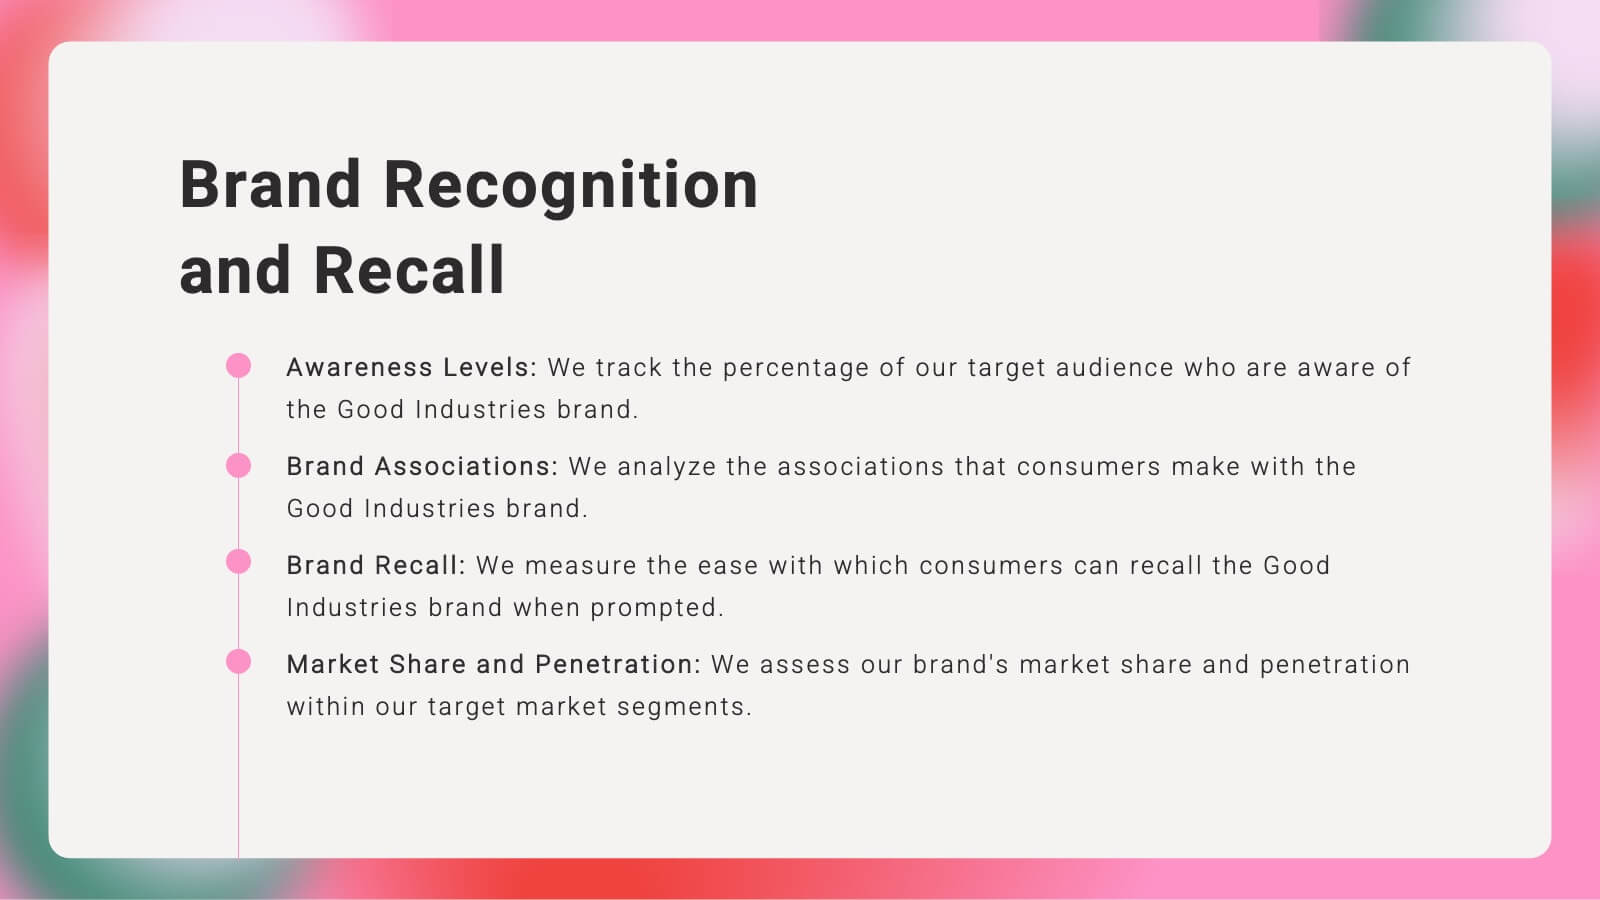
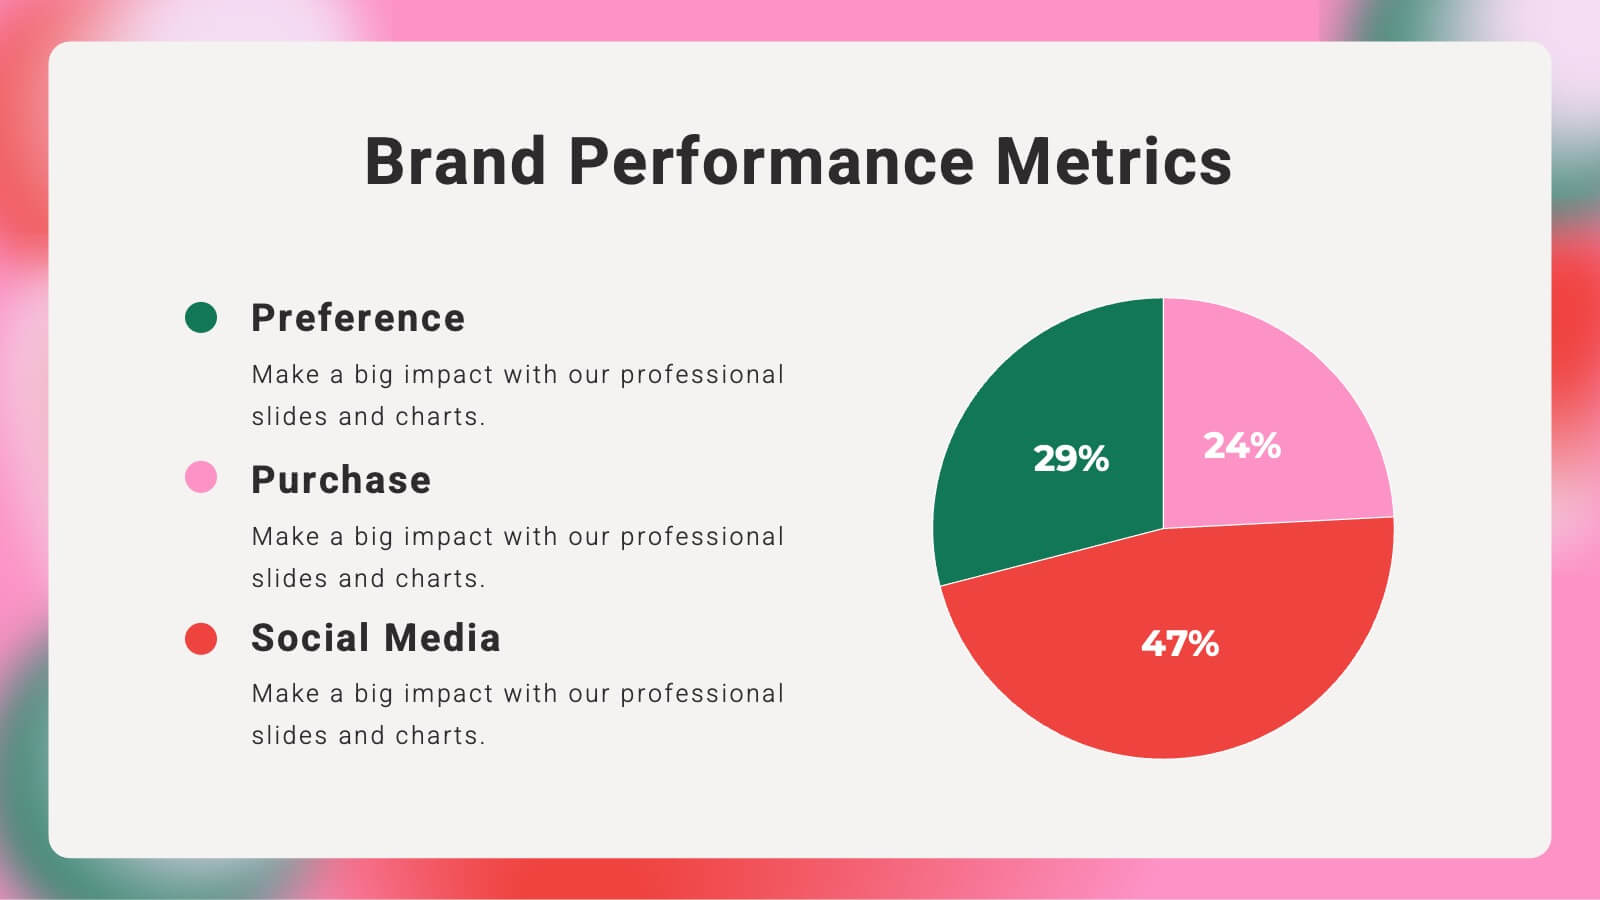
Craft a compelling narrative for your brand with this vibrant brand strategy presentation template. Designed to cover every facet of brand development, from vision and mission to market analysis and consumer personas, this template is an essential tool for businesses looking to establish a strong brand identity. It incorporates visually engaging slides that outline brand voice, values, and touchpoints, facilitating a thorough understanding of strategic branding. Compatible with platforms like PowerPoint, Google Slides, and Keynote, it is accessible across various devices, making it perfect for collaborative planning and presentations.


21 slides
Shadowrise Product Roadmap Presentation
Plan and present your product journey effectively with this detailed roadmap presentation! It covers key areas like market analysis, product features, use cases, pricing strategies, and distribution channels, ensuring a clear path to success. Perfect for product teams, stakeholders, or investor meetings, this template is fully compatible with PowerPoint, Keynote, and Google Slides.


4 slides
Lead Funnel and Engagement Model Presentation
Visualize your marketing journey from awareness to action with the Lead Funnel and Engagement Model Presentation. This clean and modern funnel layout uses bold, color-coded segments to represent each stage—perfect for illustrating how leads progress from discovery to conversion. Ideal for marketing strategists, sales teams, or campaign reporting, the template offers editable titles, icons, and text boxes to match your process. Compatible with PowerPoint, Keynote, and Google Slides, it’s designed for easy customization and polished delivery.


21 slides
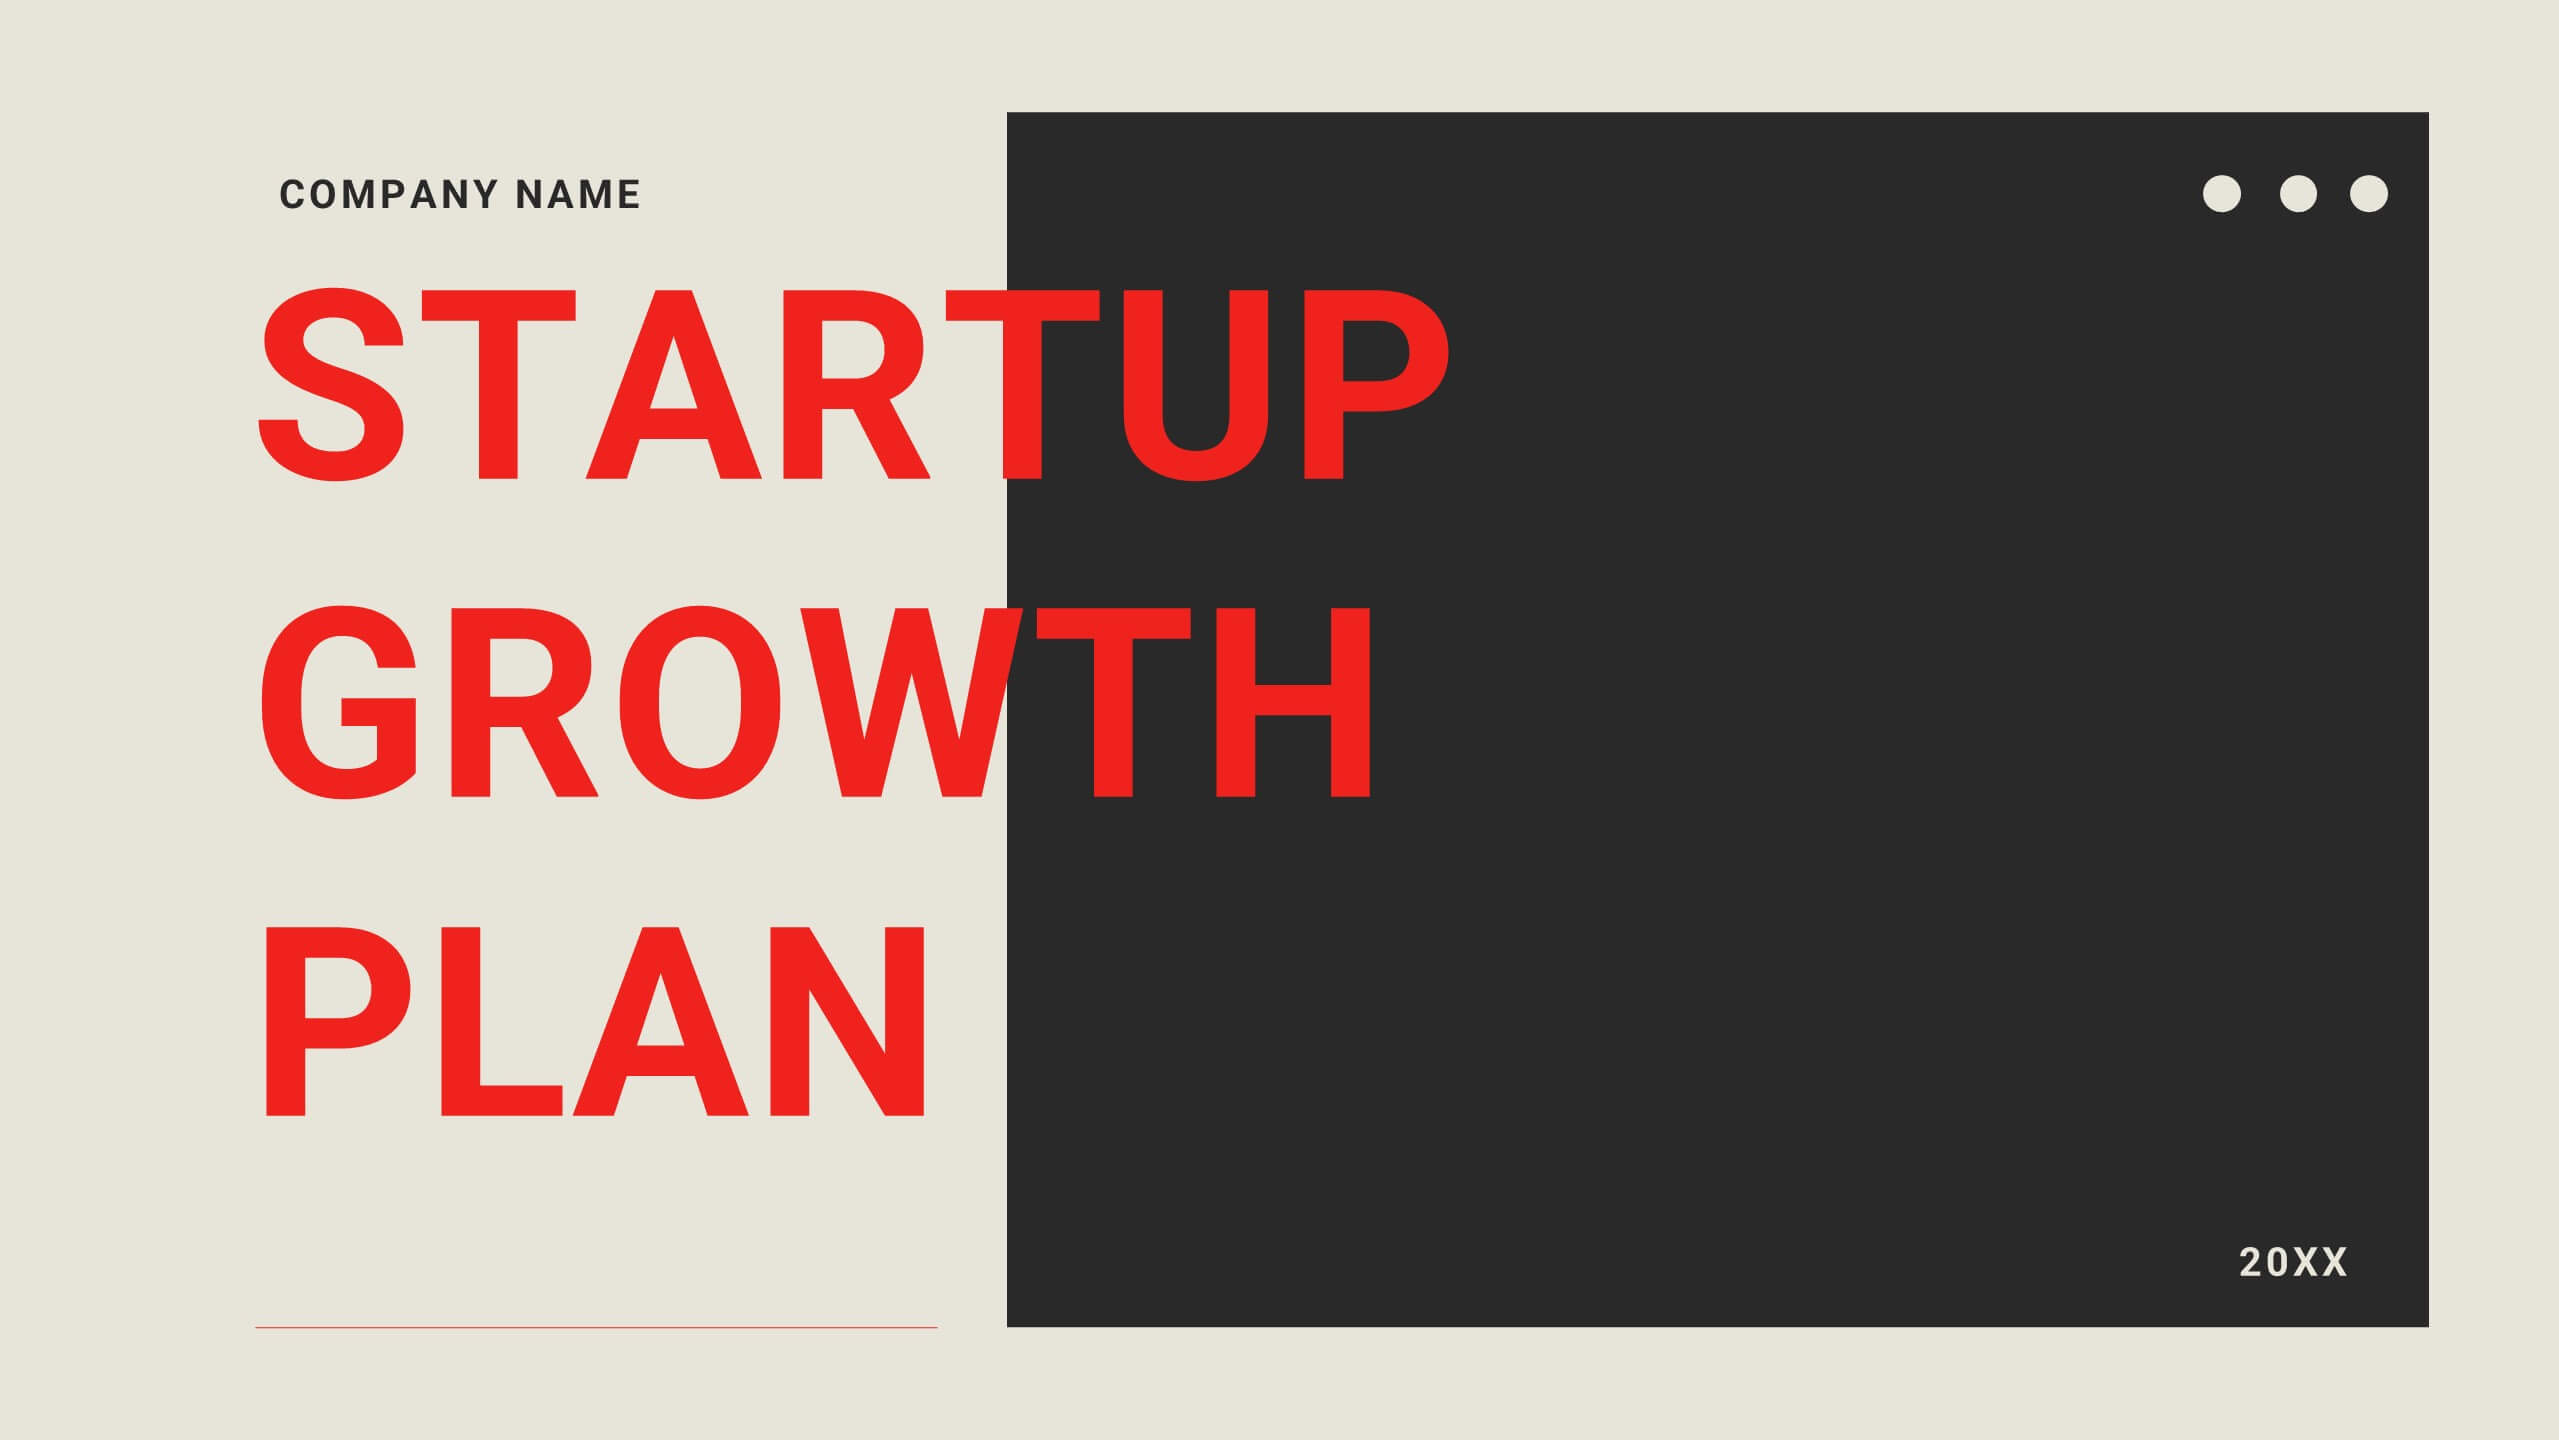
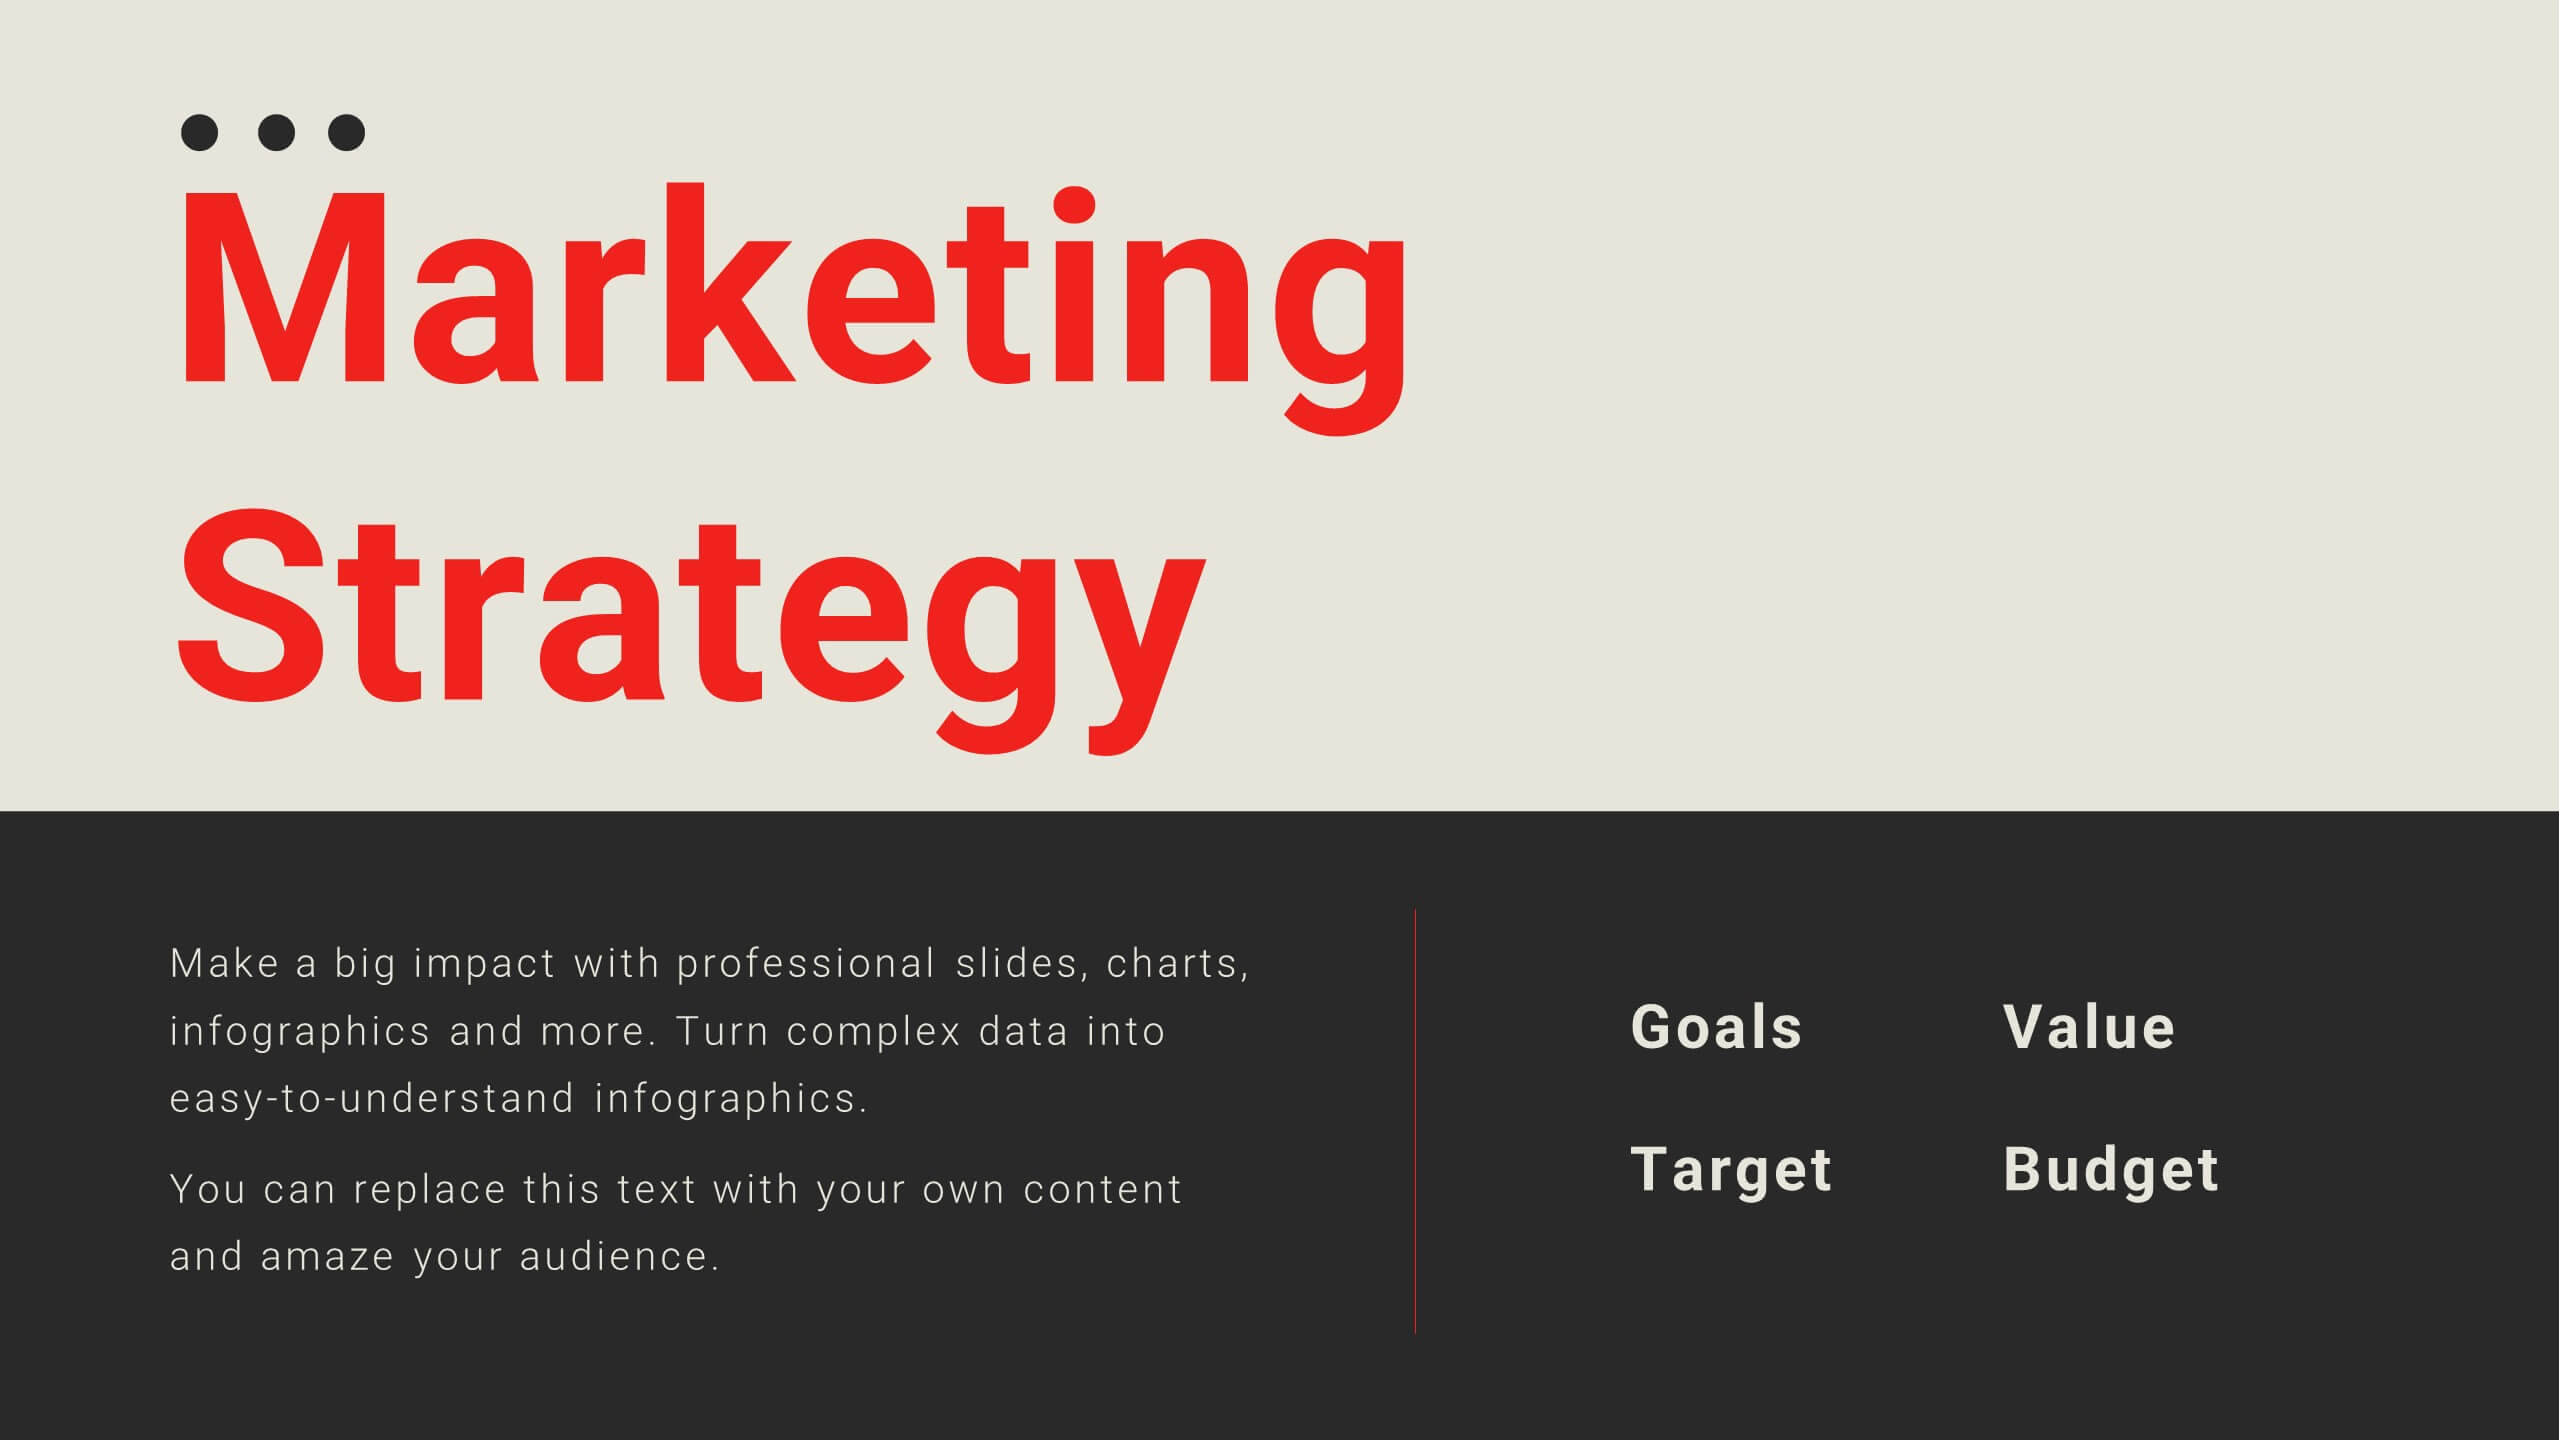
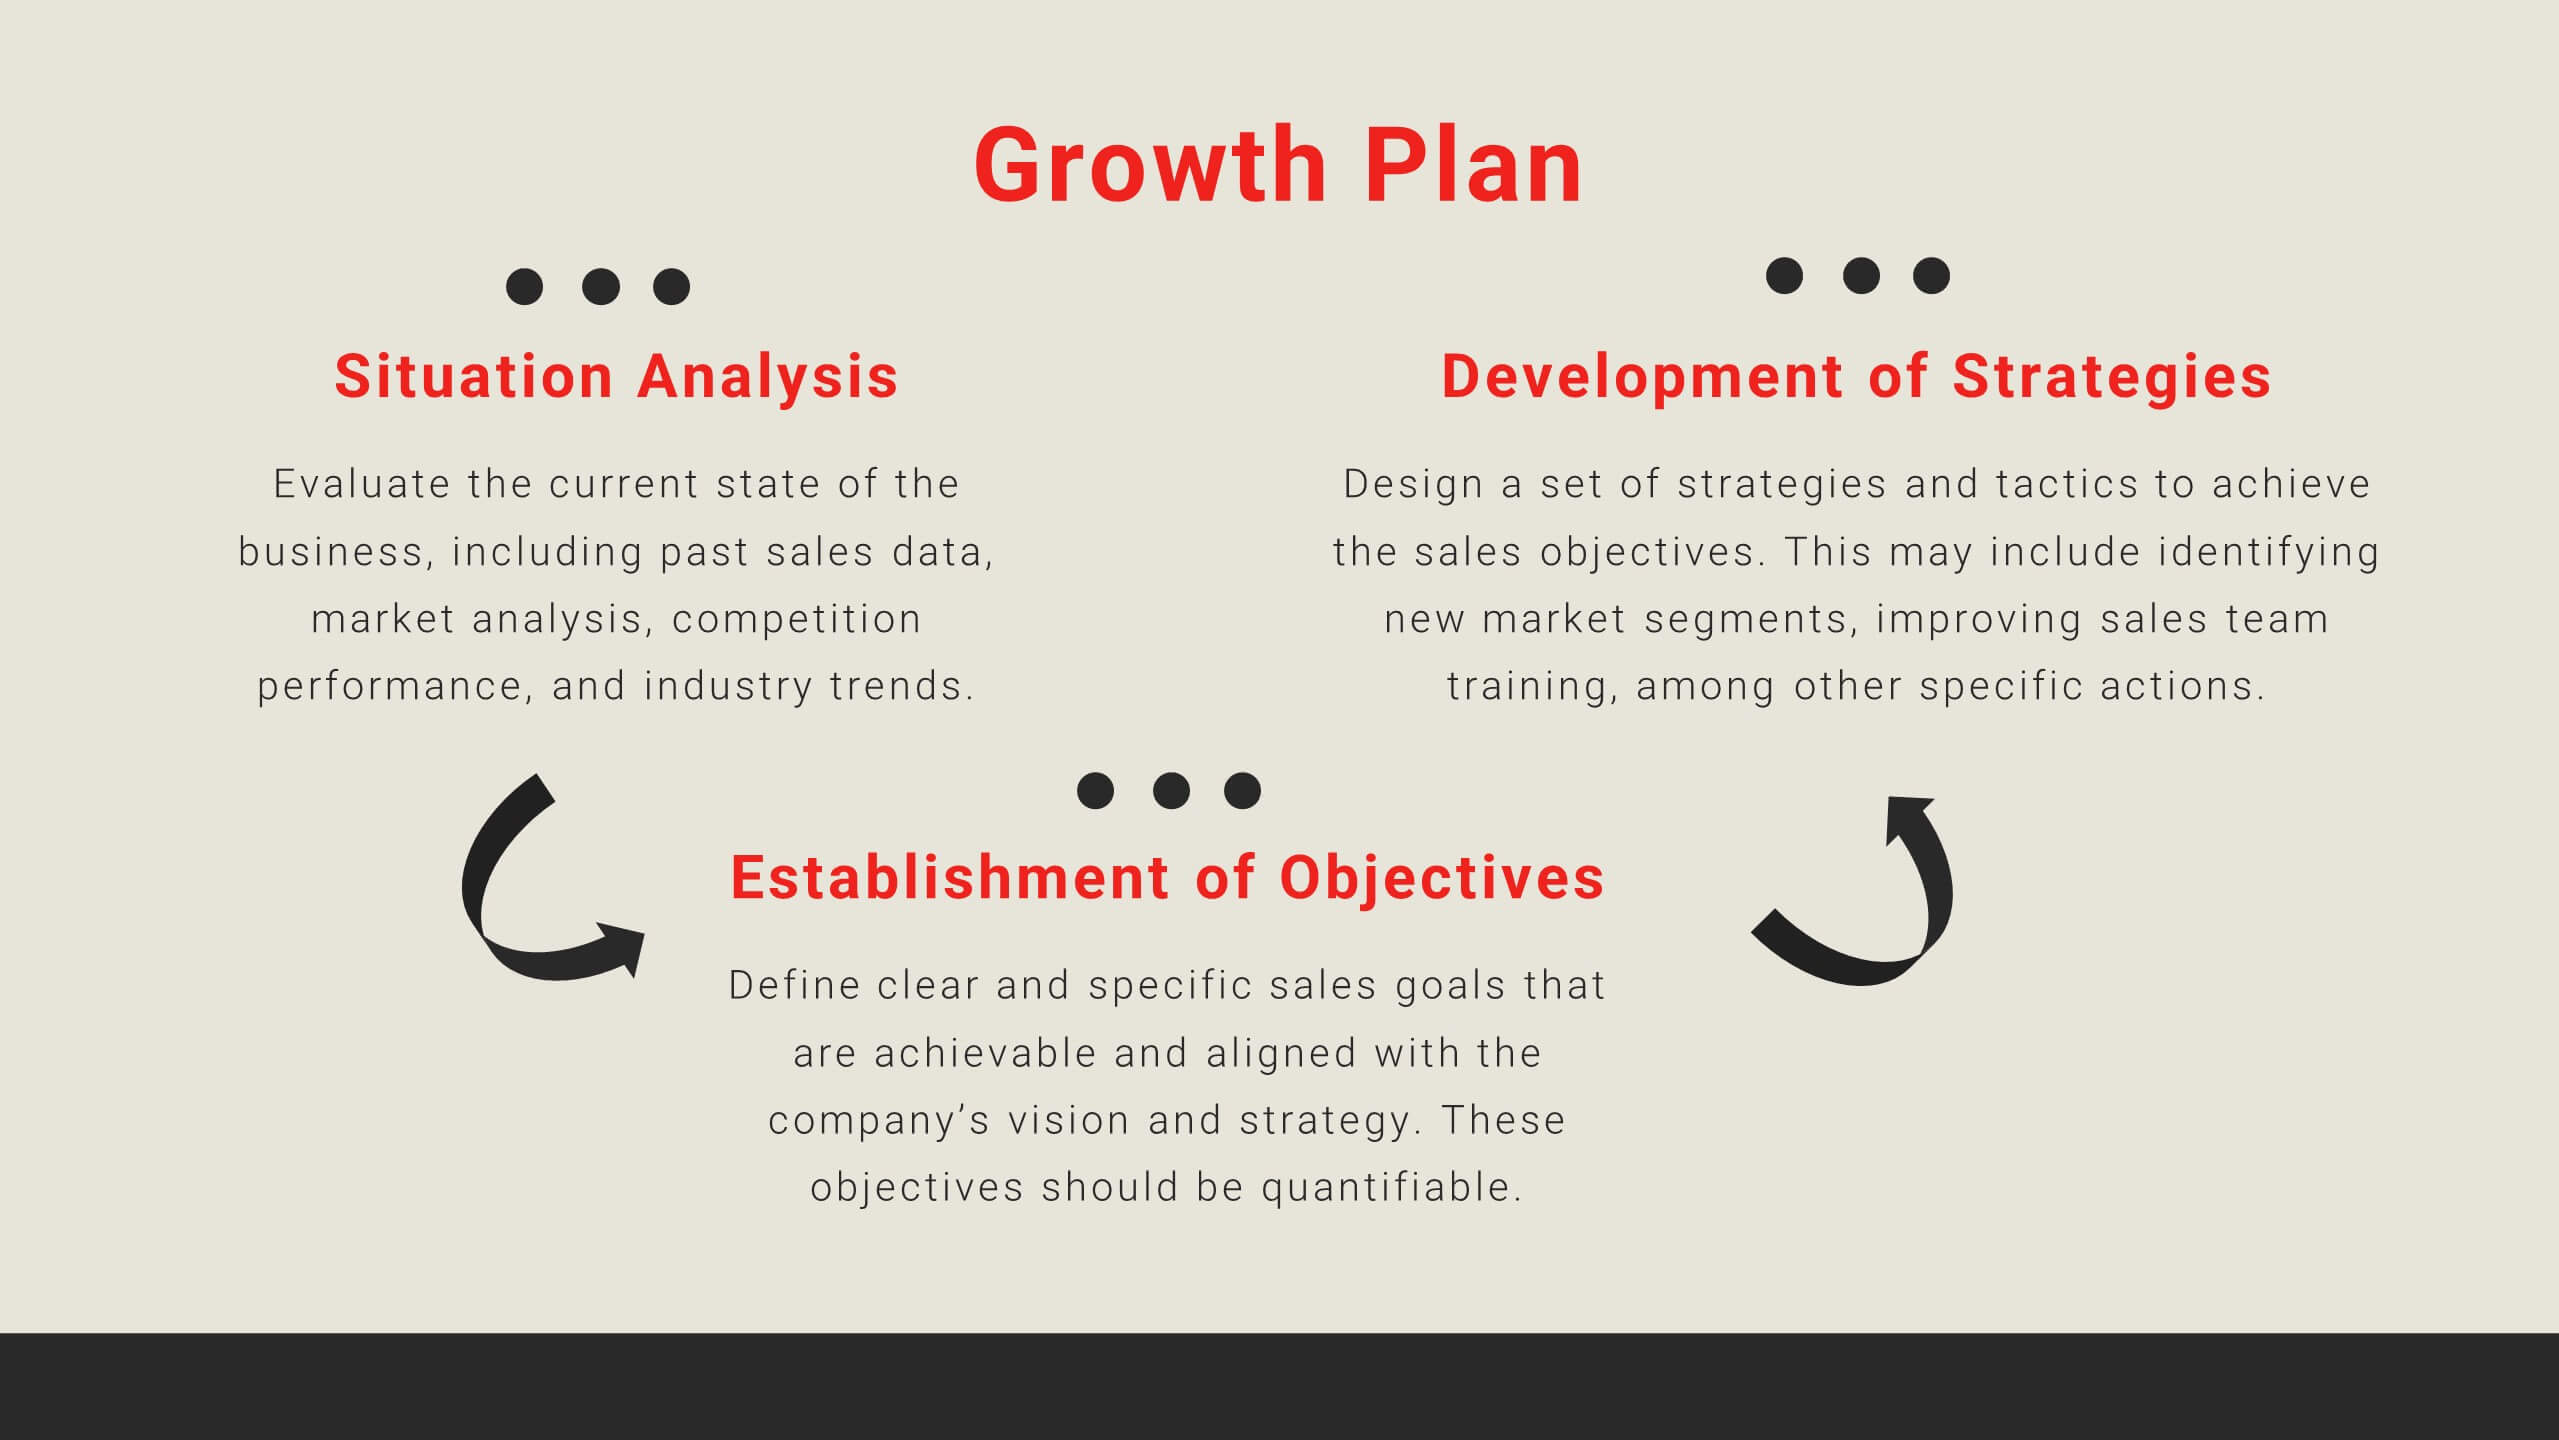
Velocity Startup Growth Plan Presentation
Accelerate your startup's growth with this dynamic plan template! Perfect for outlining your mission, vision, business model, and marketing strategy. Ideal for entrepreneurs aiming to secure funding and drive success. Compatible with PowerPoint, Keynote, and Google Slides, this template ensures your growth plan is clear, professional, and compelling. Achieve your startup goals today!


26 slides
Navigating Freelance and Flexible Work Presentation
Take control of your career with this insightful presentation on navigating freelance and flexible work. Covering key topics like client management, productivity strategies, income stability, and remote work tools, this template helps you present a clear roadmap to success. Fully customizable and compatible with PowerPoint, Keynote, and Google Slides for a seamless experience.


26 slides
Blockchain for Businesses Presentation
Navigate the world of decentralized technology with our Blockchain for Businesses presentation template, compatible with PowerPoint, Keynote, and Google Slides. Tailored for business leaders, tech entrepreneurs, and financial experts, this template is a gateway to understanding blockchain's impact on the corporate landscape. Our template demystifies blockchain, presenting its core concepts and applications in business, from enhancing security to streamlining transactions. It provides a visual narrative to explain how blockchain can be a game-changer in various industries by fostering transparency, efficiency, and trust. With customizable diagrams, charts, and case studies, you can illustrate the practical benefits of blockchain integration in business operations. This template is SEO-optimized to reach audiences interested in leveraging blockchain technology for competitive advantage. Use our template to educate your audience about the strategic implementation of blockchain and position your business at the forefront of technological innovation.


6 slides
Sales Summary Infographic
Enhance your business presentations with our Infographic Templates! Designed specifically for professionals aiming to deliver impactful data insights, this collection provides an array of slides tailored to articulate complex information effortlessly. Crafted to showcase performance metrics, analyze market trends, and outline strategic directions, these templates turn data into narratives. Featuring unique designs ranging from sophisticated circular diagrams to innovative hexagonal lists and visually engaging photo integrations, each slide ensures your data is both comprehensive and compelling. You can customize colors and text to seamlessly align these designs with your corporate identity, enhancing brand consistency across all communications. Ideal for use in PowerPoint, Google Slides, and Keynote, these templates serve as essential tools for marketers, team leaders, and analysts. They facilitate clearer understanding, promote informed decision-making, and boost presentation impact, making them invaluable in any professional setting.


6 slides
Visual Business Concept Triangle
Communicate processes, concepts, or growth stages with this dynamic triangle layout. Perfect for highlighting five key ideas or steps in a sleek, professional way. Fully customizable in PowerPoint, Keynote, and Google Slides for easy personalization.


5 slides
Strategic Objectives and Goals Presentation
Bring your strategy to life with a clear, forward-moving layout that makes every milestone feel achievable. This presentation guides audiences through key objectives, breakthrough goals, and measurable progress, helping teams stay aligned and inspired. Fully editable and easy to adapt, it works seamlessly with PowerPoint, Keynote, and Google Slides.


6 slides
Europe Education Map Infographics
Explore our versatile Europe Education Map infographic template, a valuable resource for visualizing the educational landscape across the continent of Europe. This template is fully compatible with popular presentation software such as PowerPoint, Keynote, and Google Slides, allowing you to effortlessly customize it to meet your specific needs. The Europe Education Map infographic template provides a solid foundation for illustrating data related to educational institutions, literacy rates, and academic trends throughout Europe. Whether you're an educator, researcher, or interested in European education, this template offers a user-friendly platform to create informative presentations and educational materials. Impress your audience with this SEO-optimized Europe Education Map infographic template, designed for clarity and ease of use. Customize it to showcase educational opportunities, achievements, and regional insights, making it a valuable asset for your projects and presentations. Begin crafting your personalized infographic today!


6 slides
Credit Card Benefits Infographic
Credit cards offer various benefits to cardholders, making them a popular financial tool for everyday transactions and managing personal finances. This infographic template highlights the various benefits and advantages of using credit cards. Perfect for banks, financial institutions, and credit card companies, this template presents a comprehensive overview of the perks and rewards that credit cards offer to their users. Compatible with Powerpoint, Keynote, and Google Slide. This template offers the flexibility to customize colors, fonts, and icons to align with the brand identity of the credit card issuer.


7 slides
Veterinary Infographic Presentation Template
Veterinarians are the doctors of the animal world. Veterinary medicine is the branch of science and profession concerned with the prevention, diagnosis and treatment of disease, disorder, dysfunction and injury in animals. This template includes a comprehensive list of veterinary medicine infographics. They have appealing illustrations completely customizable for you. Use this template to create your veterinary medicine study notes for each chapter. It is a great way to remember what you learned. You can use this template to organize your notes, review labs and as a study guide for tests.


3 slides
Risk Assessment Spider Chart
Evaluate risks across key criteria with the Risk Assessment Spider Chart Presentation. This template showcases a multi-dimensional radar chart, ideal for comparing variables like probability, impact, and preparedness. Use this to present security assessments, project vulnerabilities, or business exposure insights. Fully editable in PowerPoint, Keynote, and Google Slides.


6 slides
Credit Card Comparison and Features Presentation
Make your decision-making effortless with this bright and visual template that helps you break down features, perks, and details of different cards in one glance. Perfect for financial presentations or product comparisons, it clearly illustrates credit card benefits side by side. Fully compatible with PowerPoint, Keynote, and Google Slides.


4 slides
Workplace Safety Guidelines Presentation
Create a safer, smarter workspace with this clean and visual presentation design. Ideal for communicating safety standards, compliance rules, and hazard prevention tips, it helps teams stay informed and engaged. Fully customizable and compatible with PowerPoint, Keynote, and Google Slides for easy editing and professional delivery.