


Features
- 6 Unique slides
- Fully editable and easy to edit in Microsoft Powerpoint, Keynote and Google Slides
- 16:9 widescreen layout
- Clean and professional designs
- Export to JPG, PDF or send by email


Do you have any questions?
Recommend


10 slides
Healthcare Services Overview Presentation
Make your healthcare data shine with a presentation that communicates trust, precision, and clarity. Perfect for showcasing services, medical results, or research insights, this clean layout highlights each section with visual balance and professionalism. Fully customizable and compatible with PowerPoint, Keynote, and Google Slides for seamless editing.


20 slides
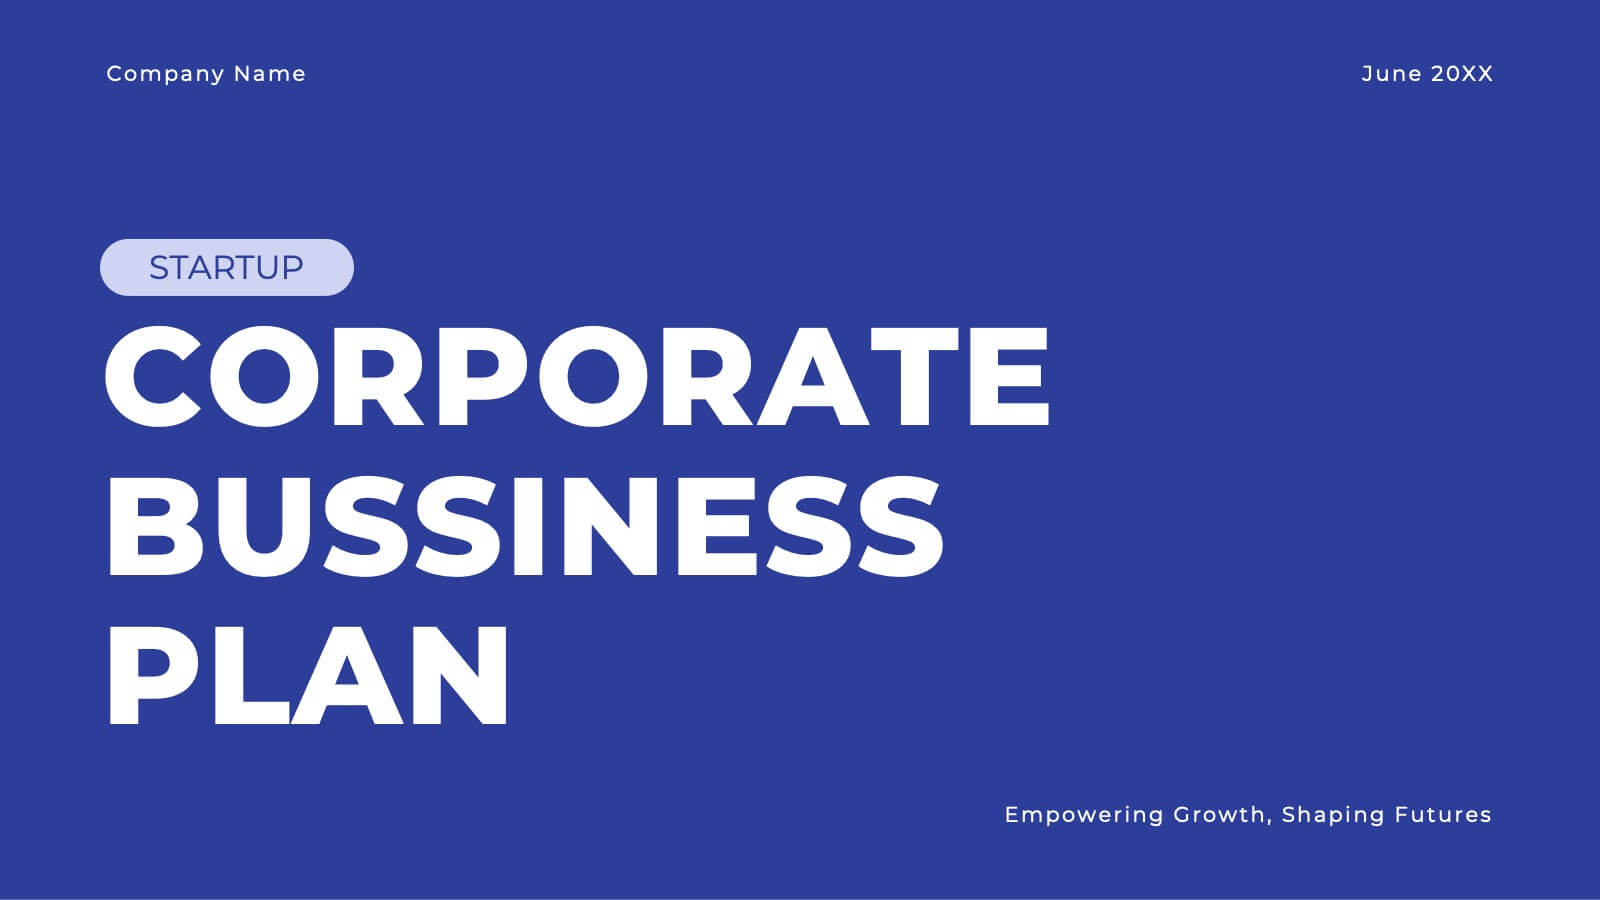
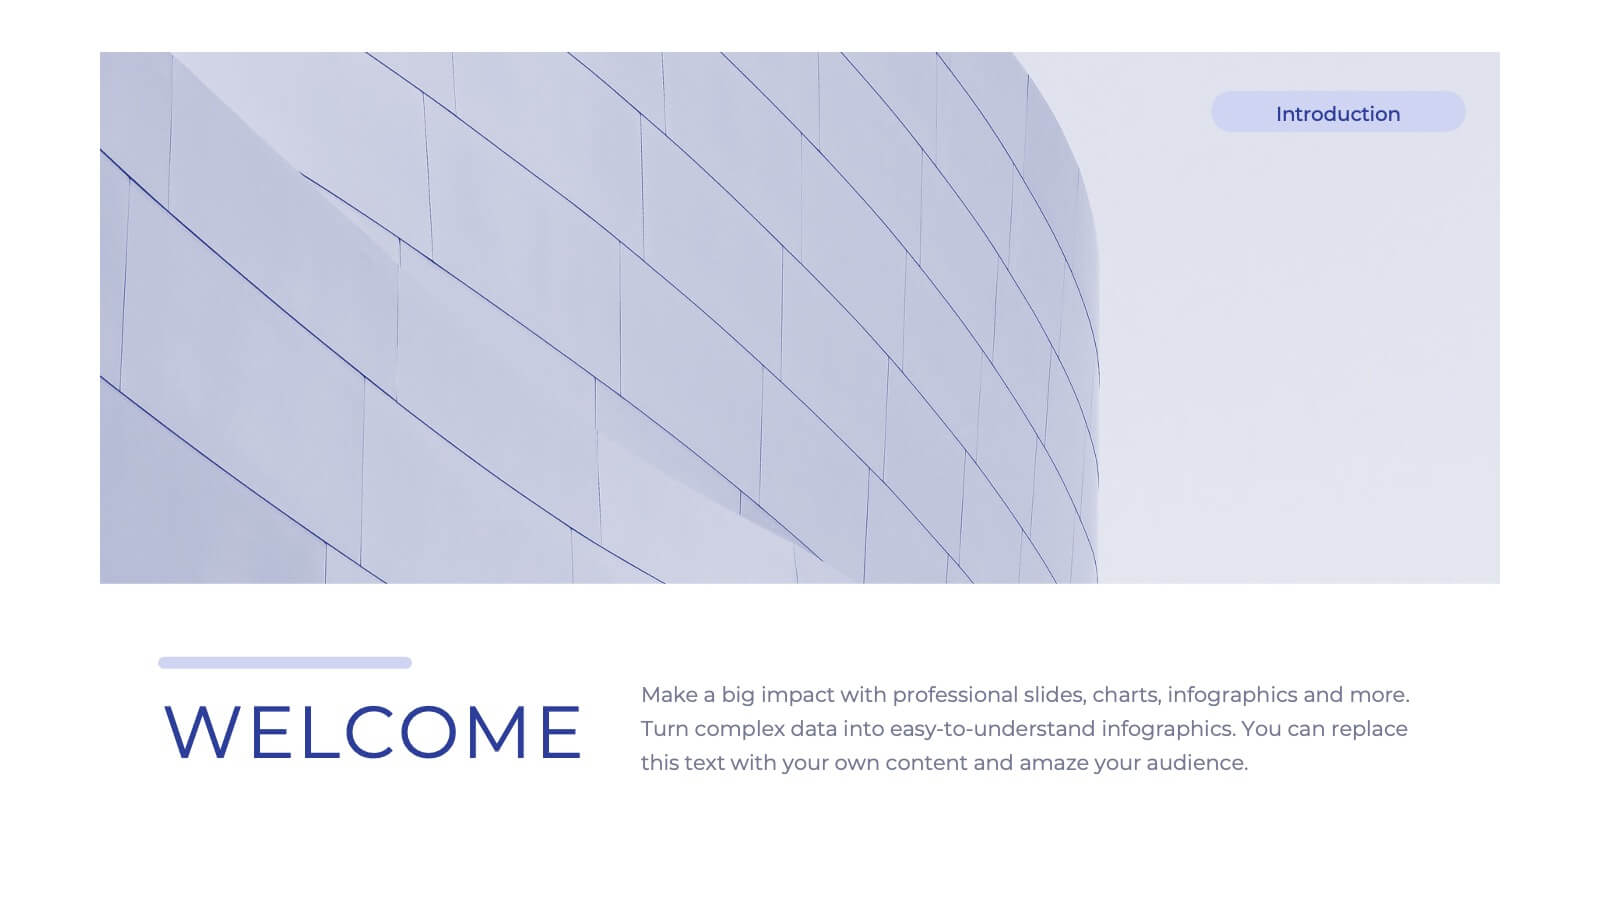
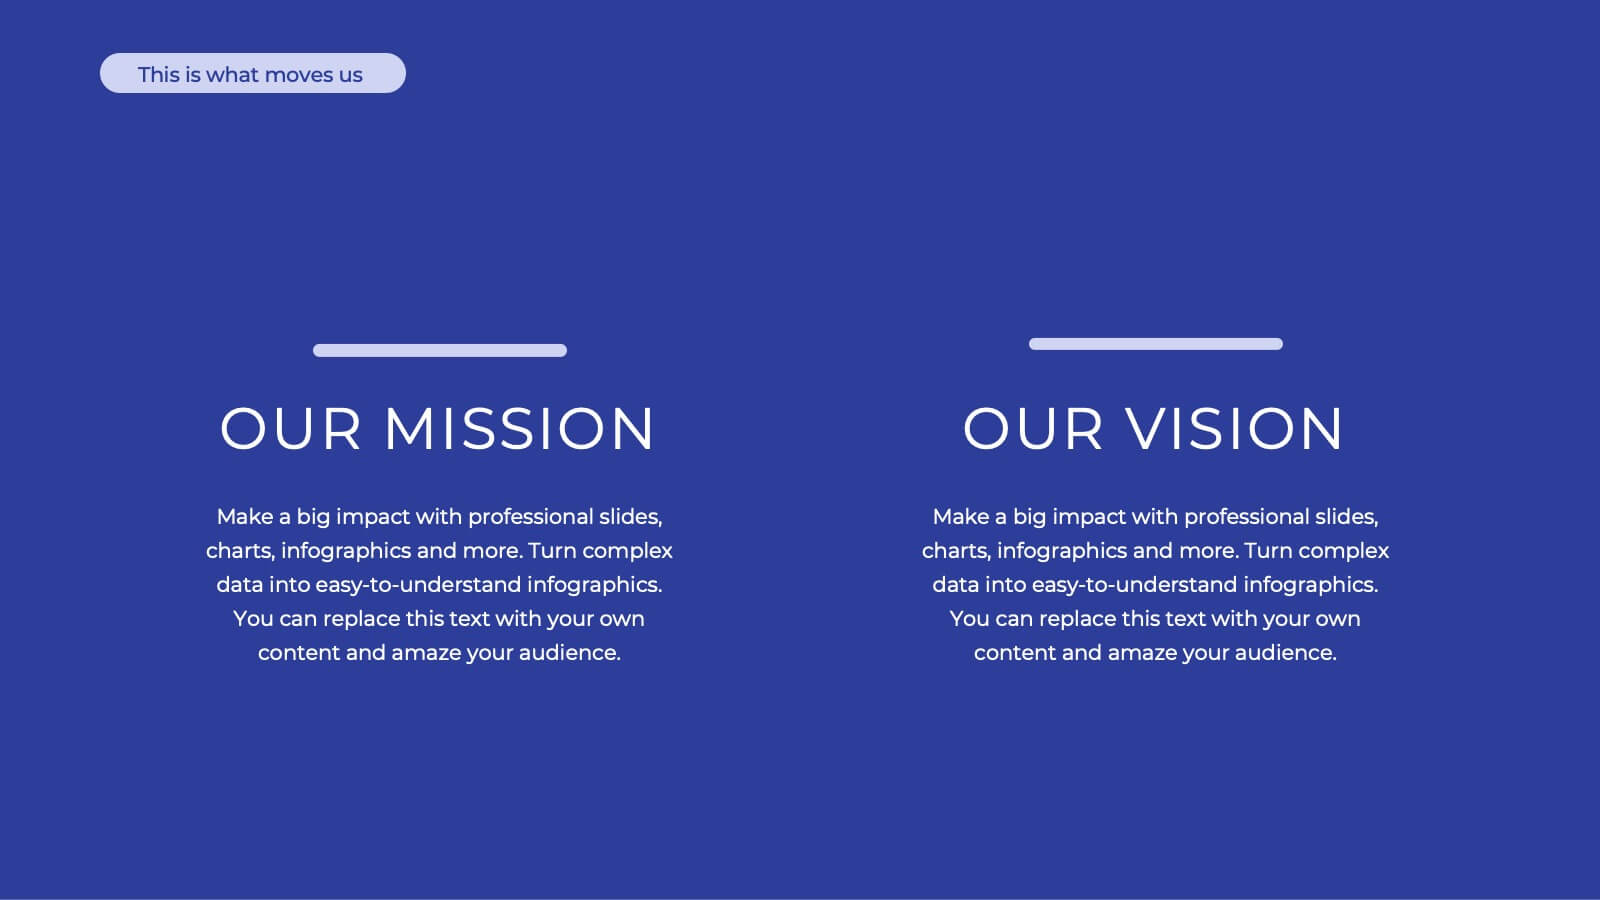
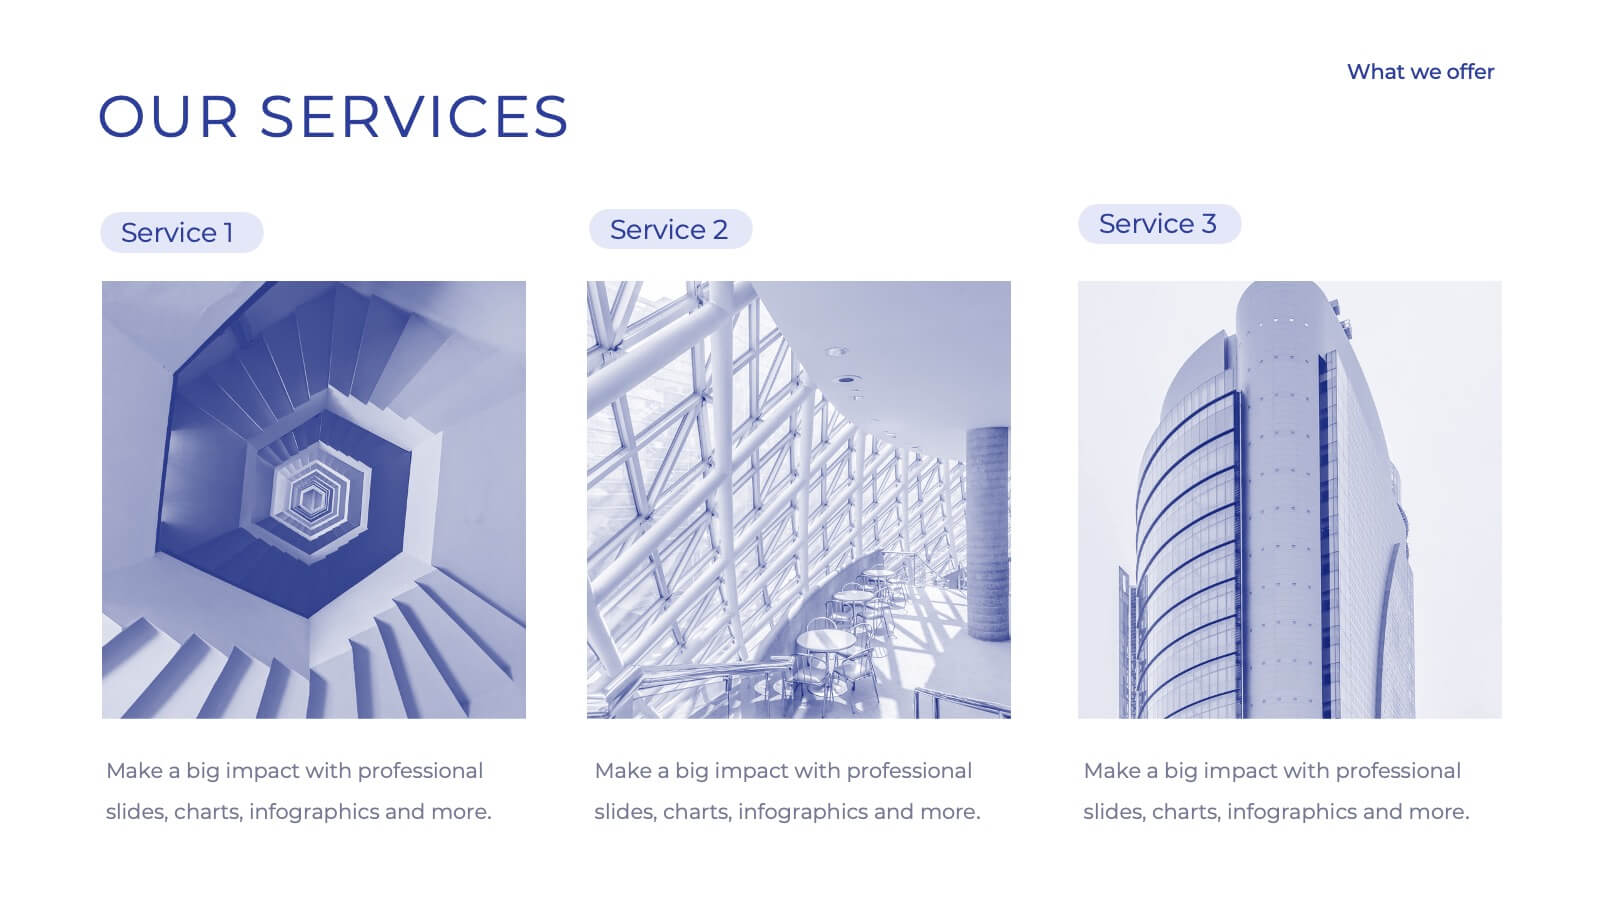
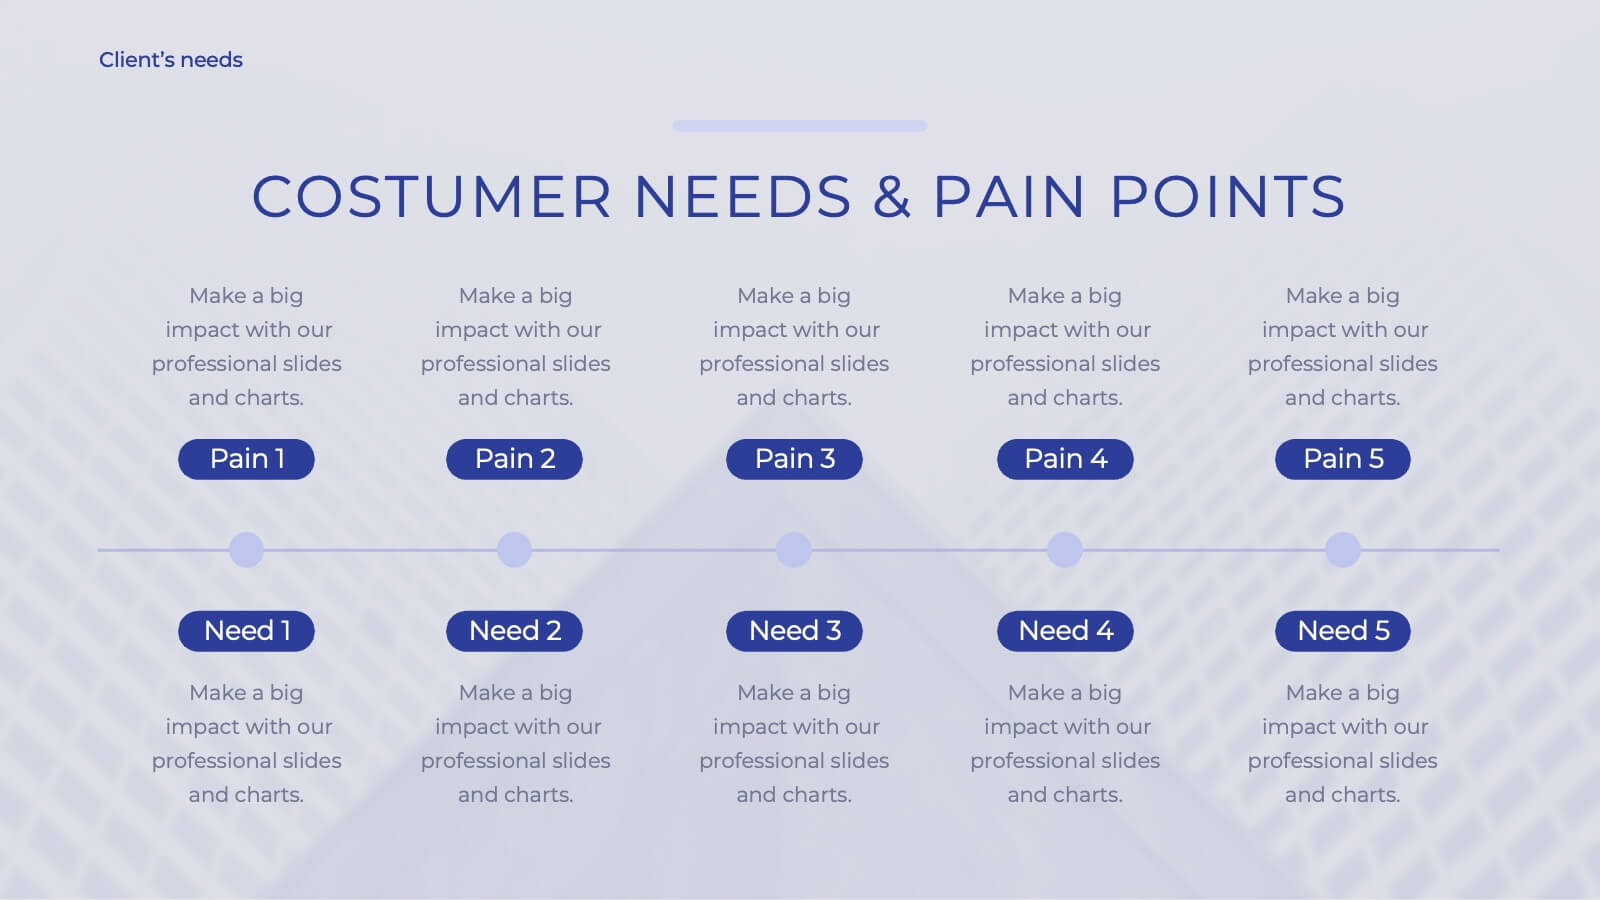
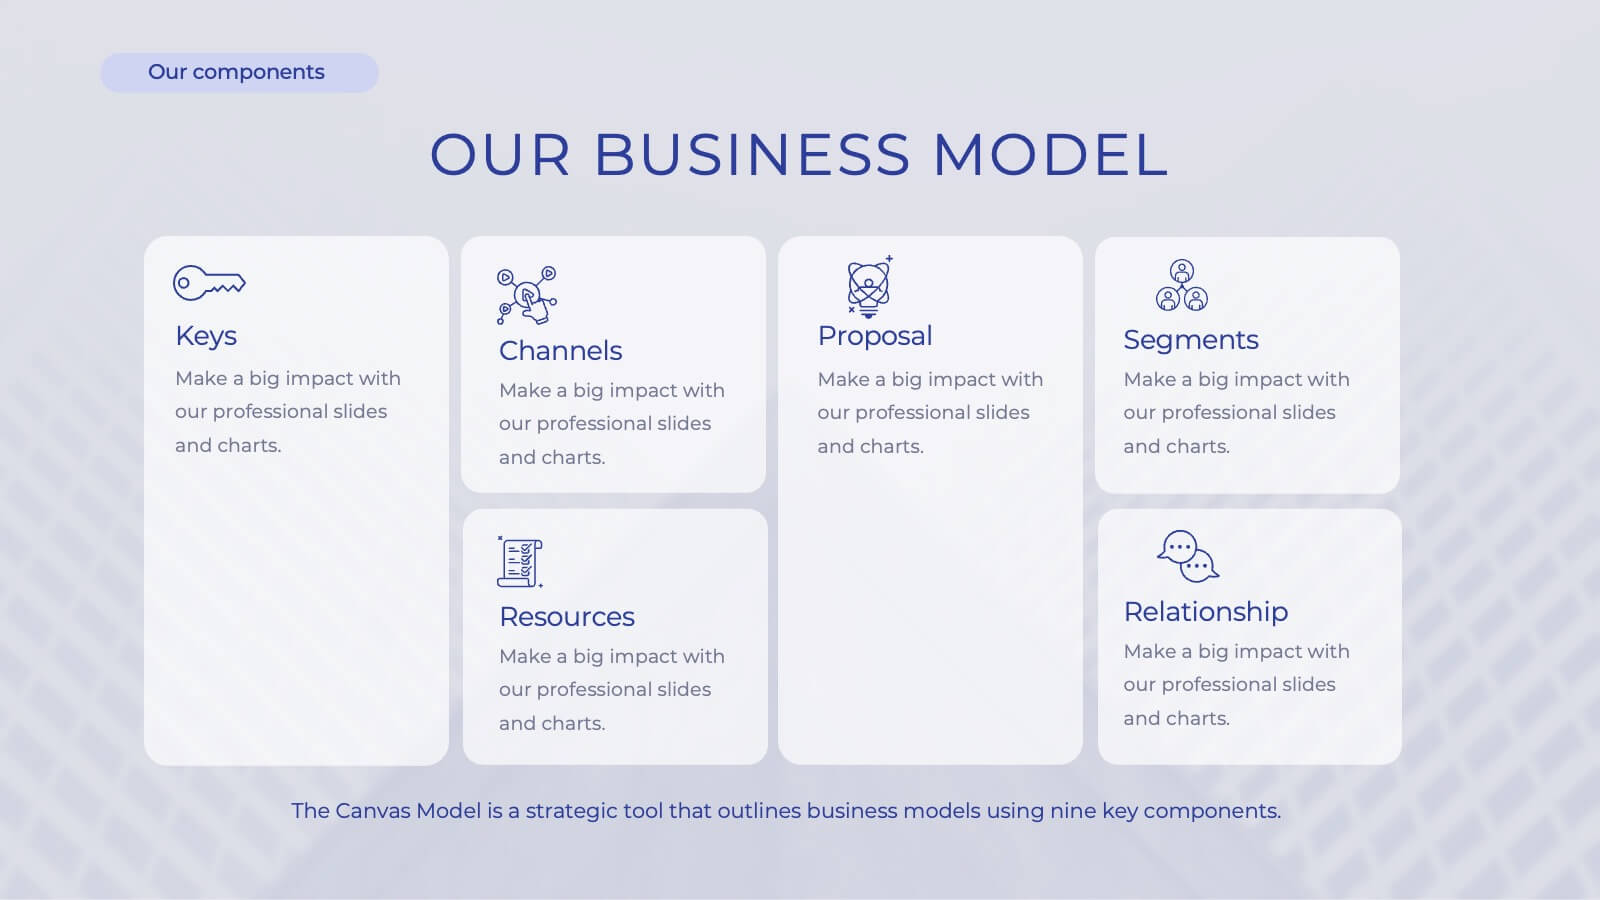
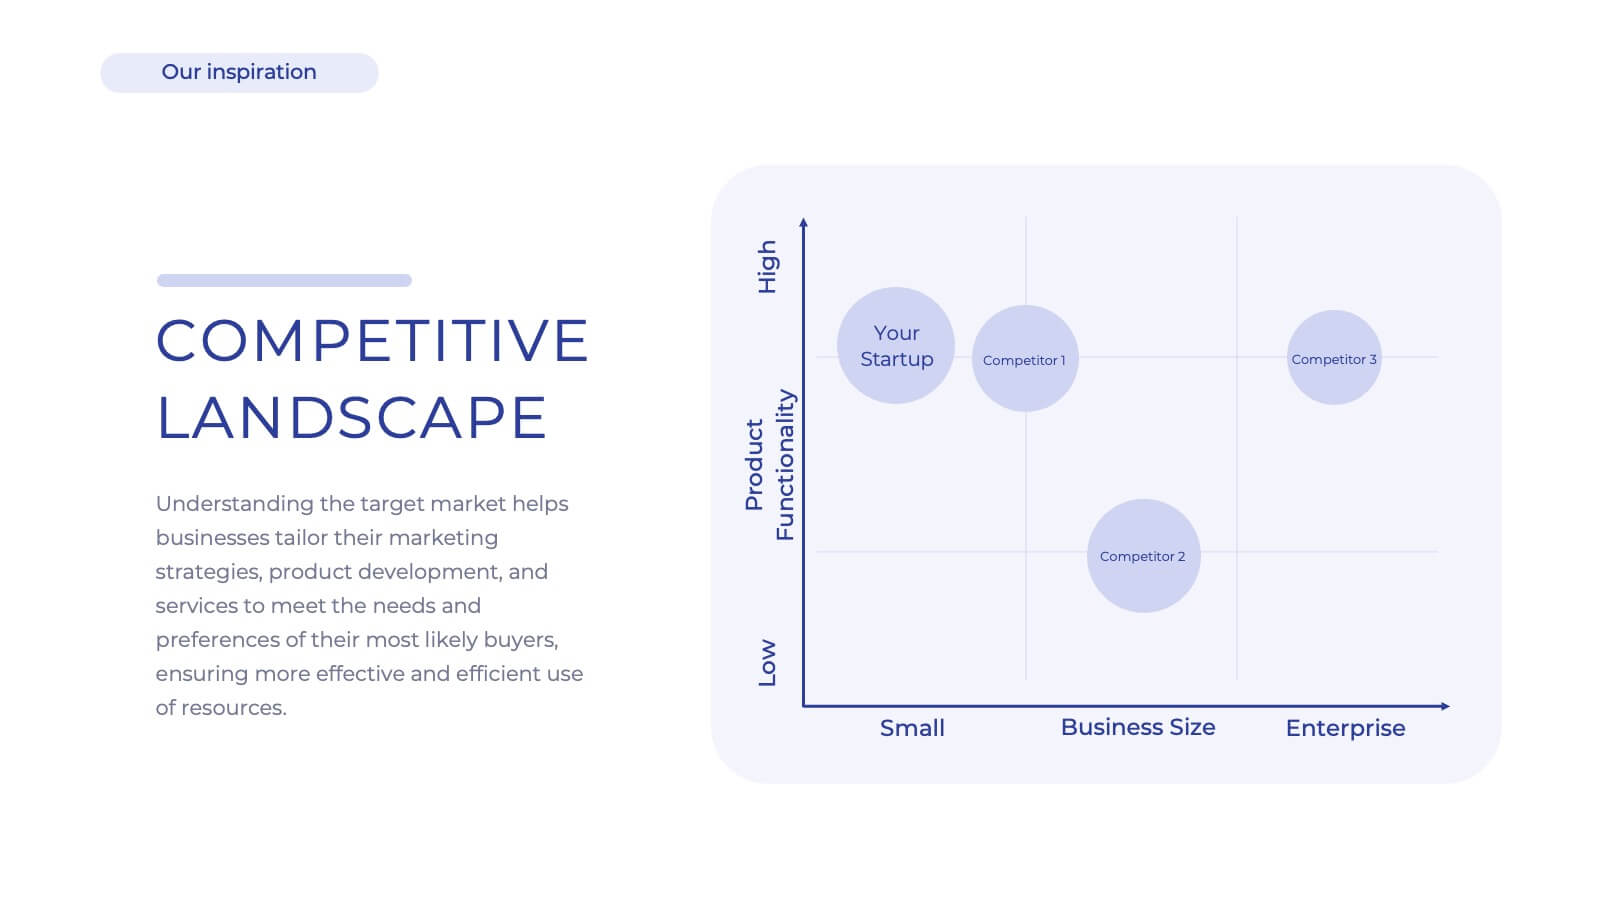
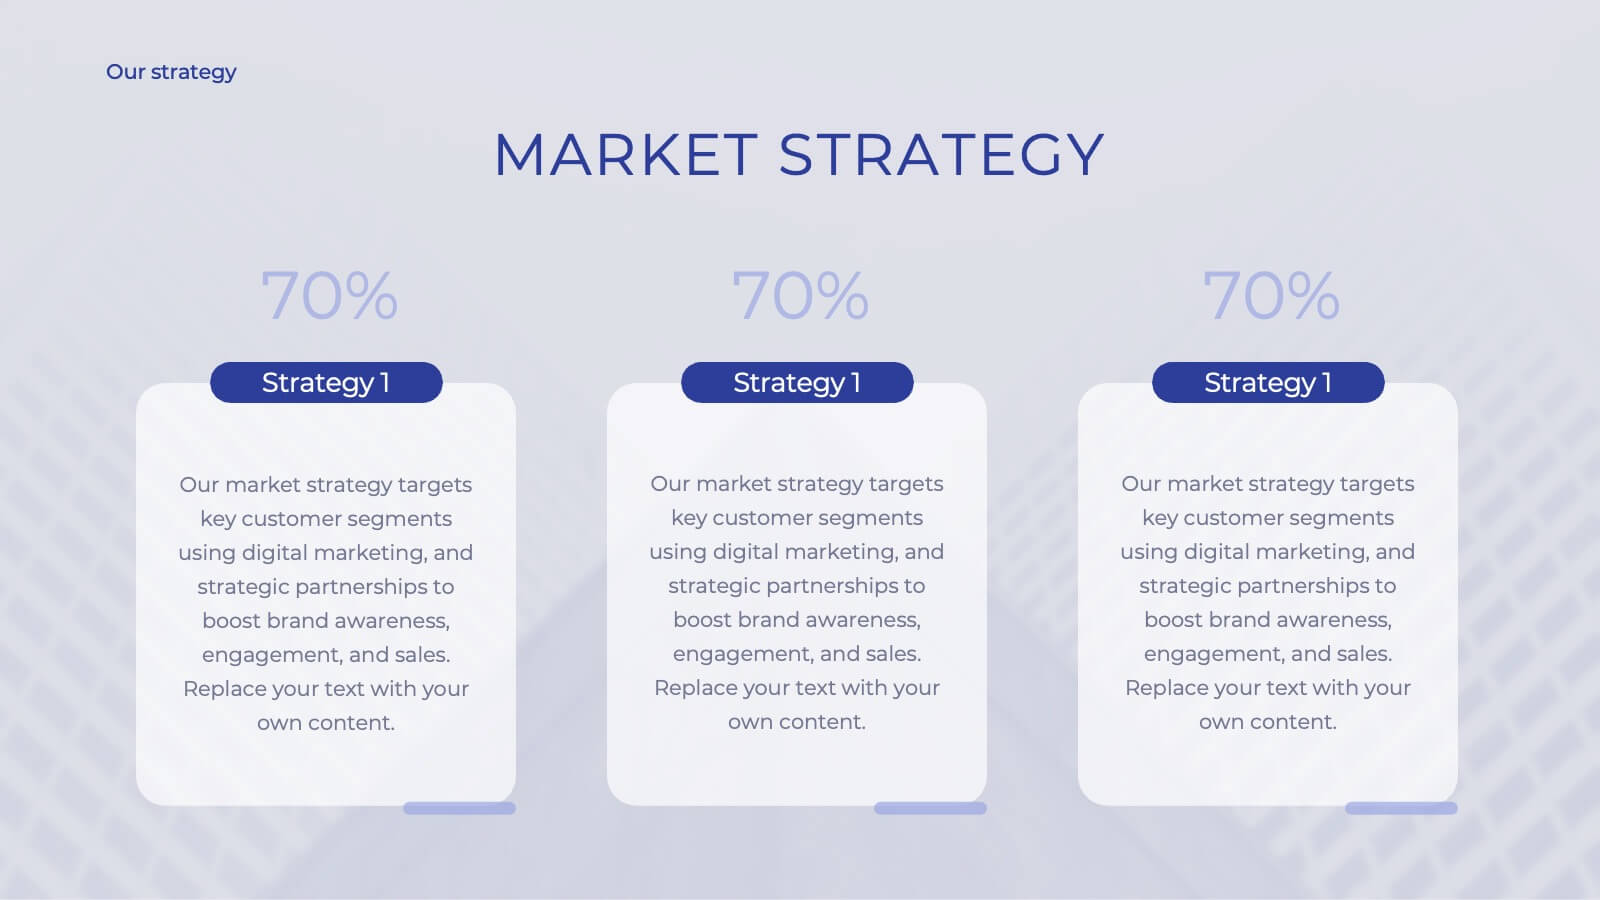
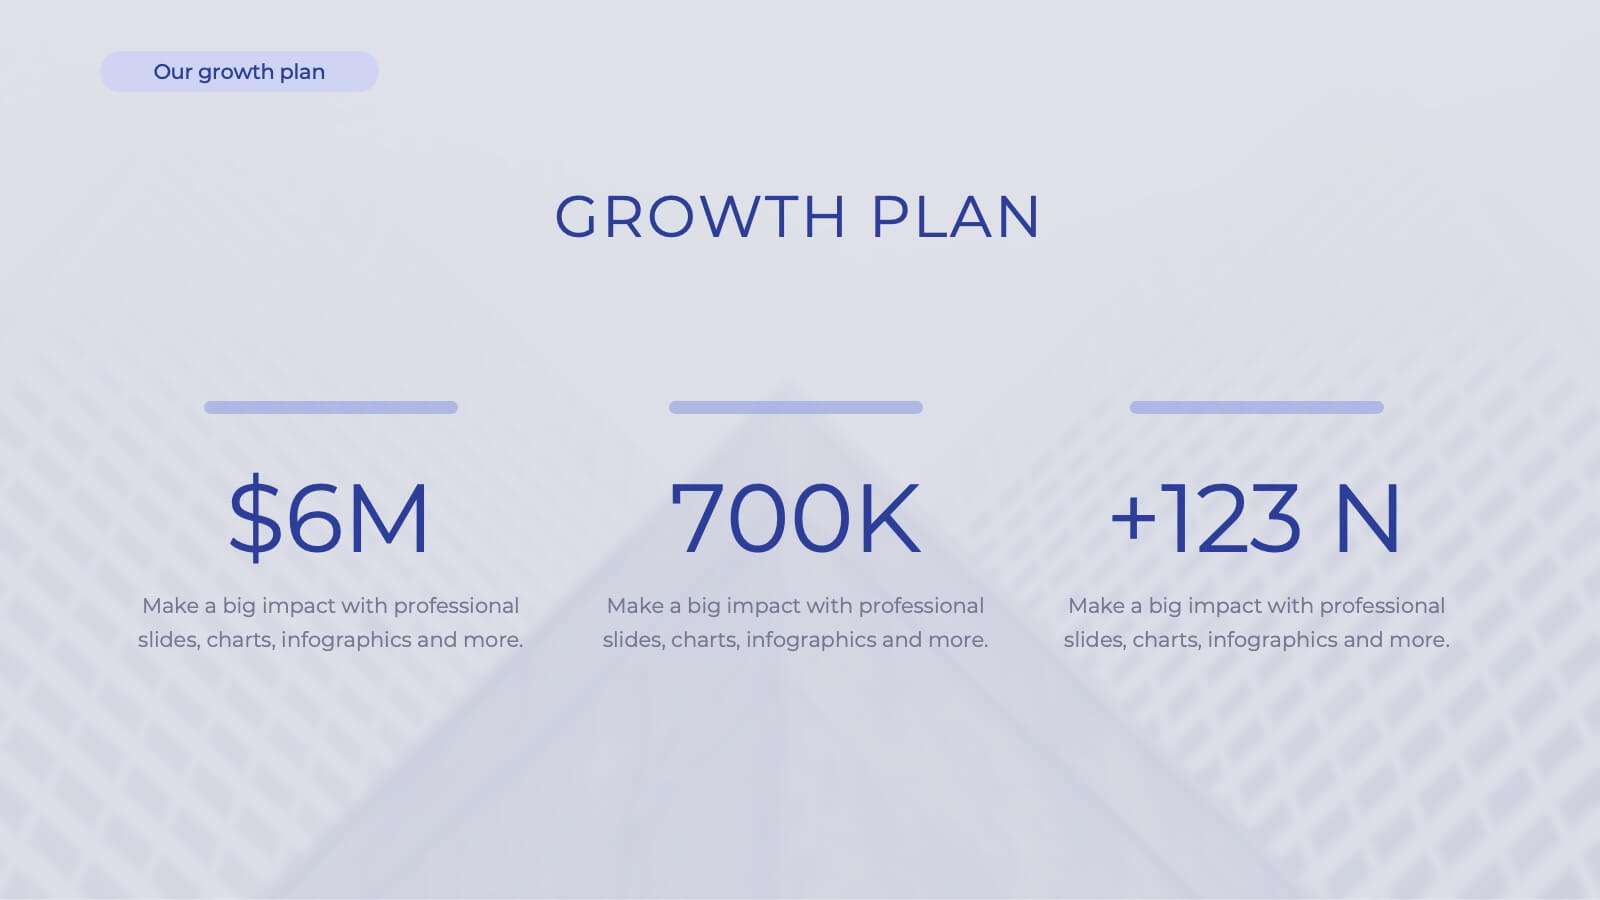
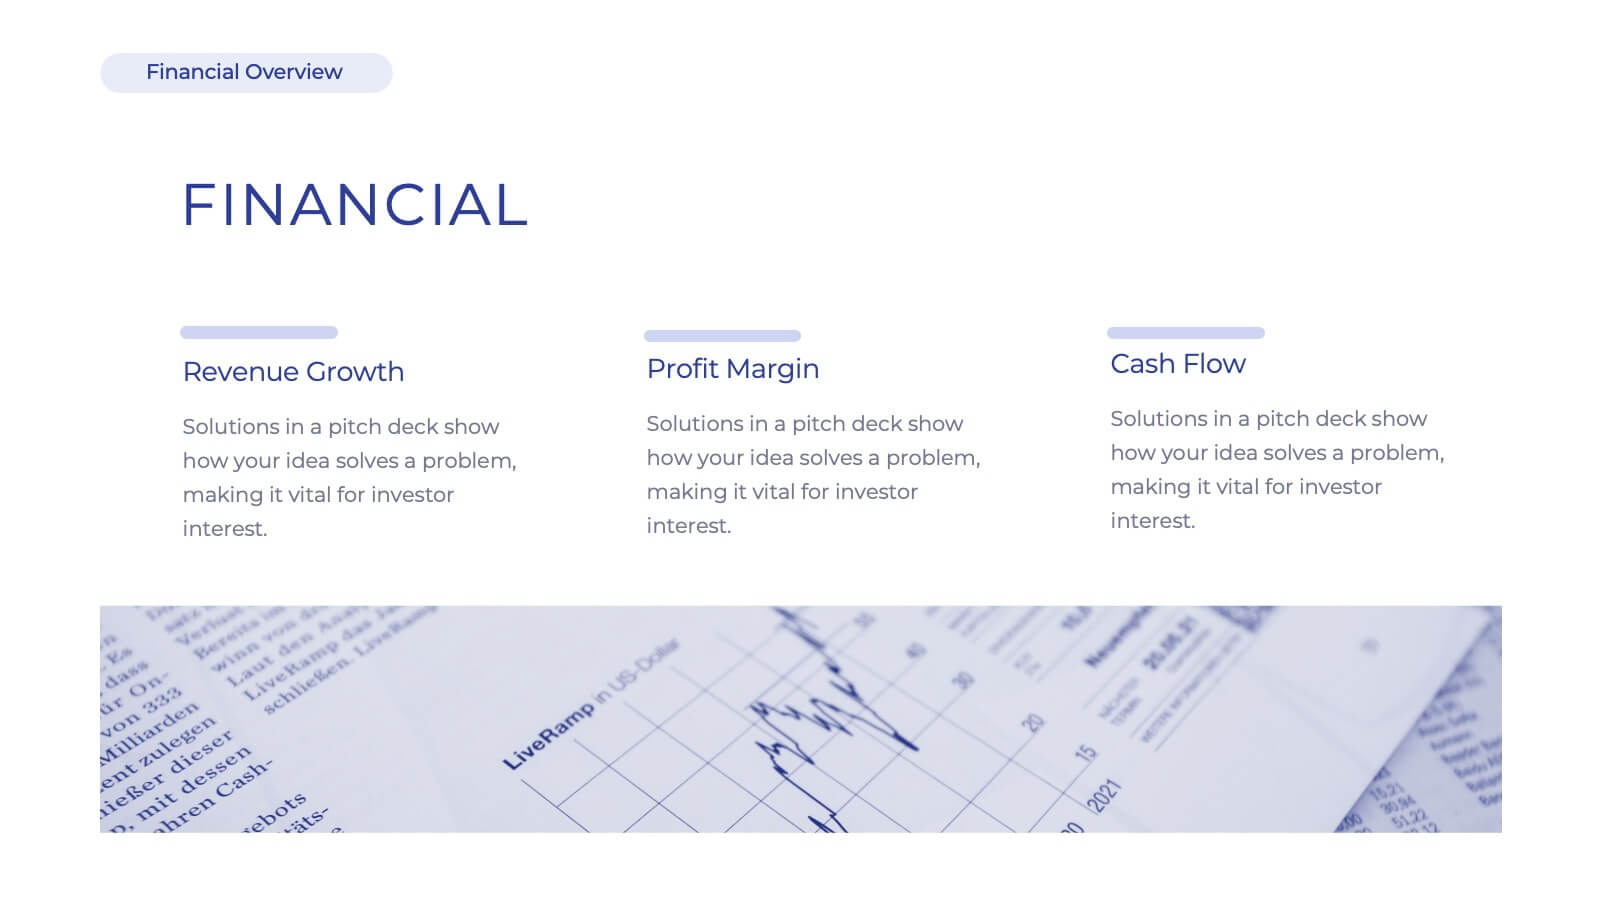
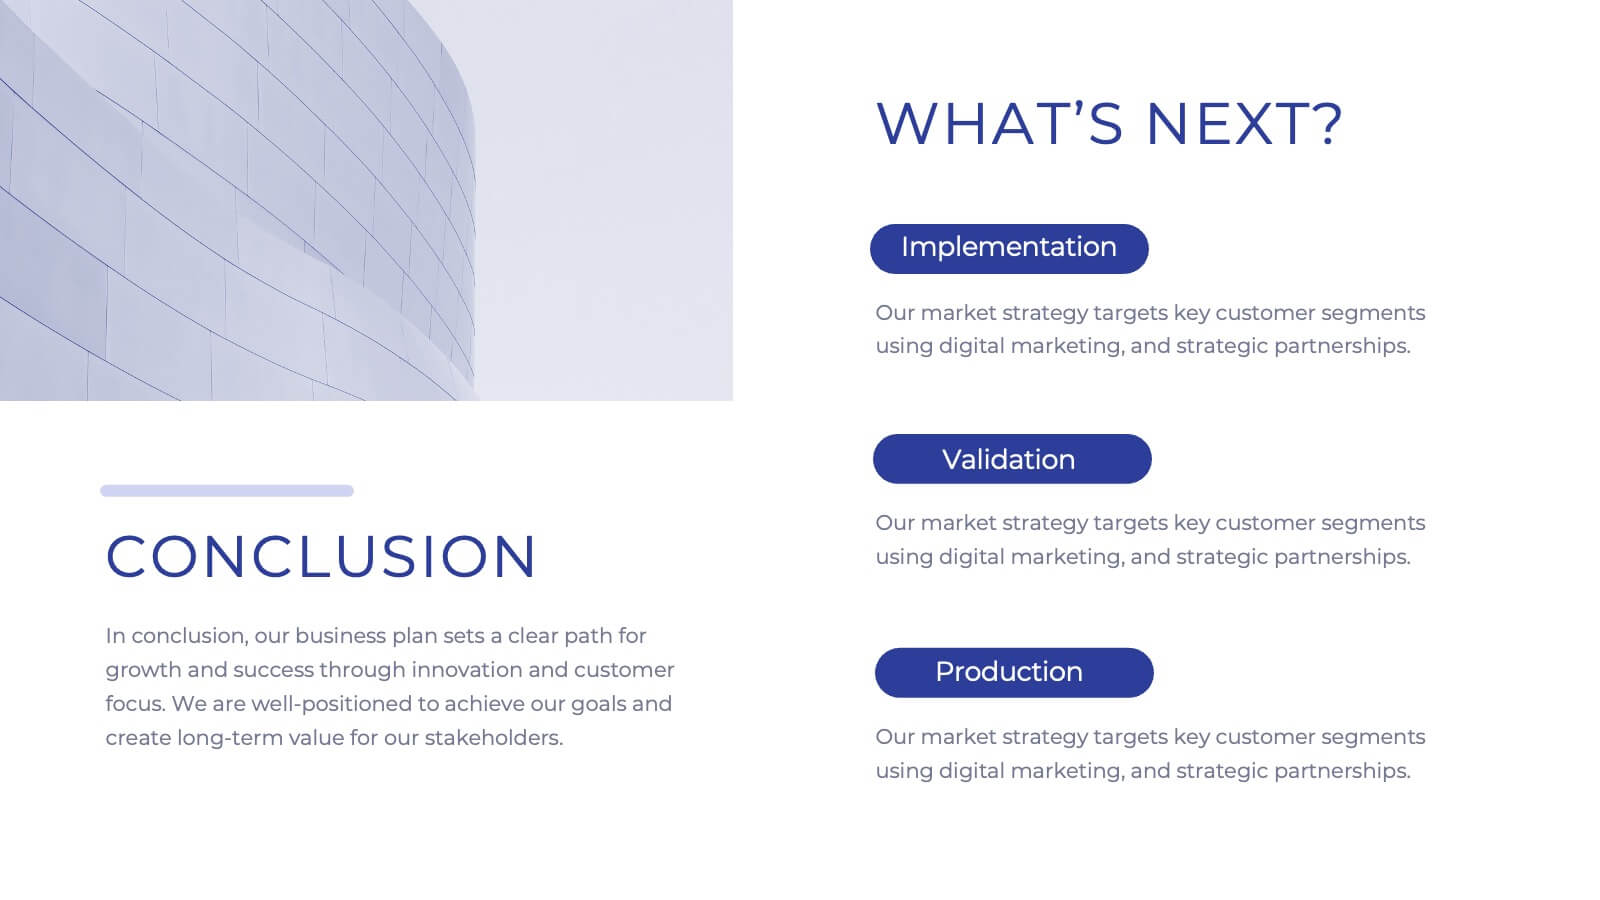
Iconic Startup Business Plan Presentation
Introducing our comprehensive corporate business plan template! Perfect for showcasing your company’s mission, vision, and services. Highlight your market strategy, competitive landscape, and growth plan in a professional design. Ideal for executives and entrepreneurs. Compatible with PowerPoint, Keynote, and Google Slides.


8 slides
Business Strategy Alternatives
Present multiple strategic paths with this creative 4-way arrow infographic. Designed to clearly display four different options or directions, it’s ideal for scenario analysis, strategic planning, or decision-making meetings. Each path is paired with an icon and description for easy interpretation. Fully editable in PowerPoint, Keynote, and Google Slides.


21 slides
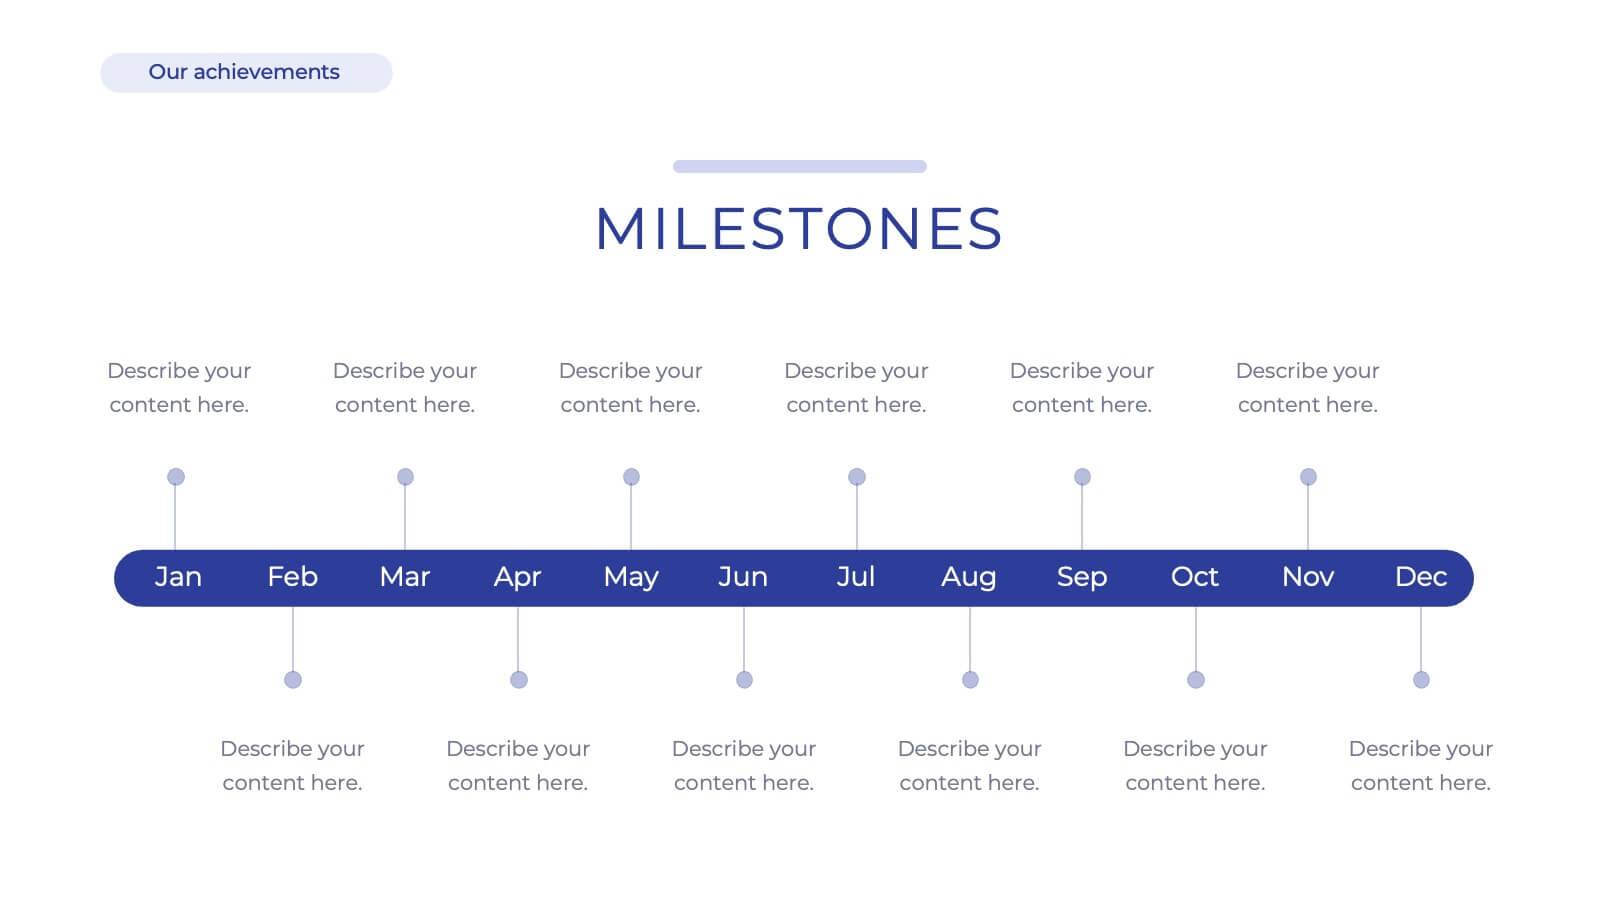
Minoan Project Timeline Presentation
Step back in time with this beautifully crafted Minoan-inspired presentation, perfect for outlining your project timeline! With an elegant design and clear structure, this template helps you showcase key milestones, deadlines, and deliverables in a visually stunning way. Keep your project on track. Compatible with PowerPoint, Keynote, and Google Slides.


7 slides
Science Research Infographic
Science research, is a systematic and organized inquiry that aims to generate new knowledge, validate existing knowledge, or solve specific problems using scientific methods and principles. This infographic template aims to present your science research initiatives, achievements, and vision to the audience in an engaging and informative way. This is essential to convey complex scientific data and discoveries in a visually appealing manner. Fully customizable and compatible with Powerpoint, Keynote, and Google Slides. Adapt and personalize the content to align with your specific research center's focus and mission.


5 slides
Business Matrix Model Presentation
Clearly define your strategy with this Business Matrix Model Presentation. This slide visualizes four key segments in a grid layout, perfect for mapping business priorities, comparing performance, or identifying growth opportunities. Each quadrant is color-coded and labeled, making it easy to explain complex concepts. Ideal for business planning, SWOT analysis, or strategy workshops. Fully editable in PowerPoint, Keynote, and Google Slides.


6 slides
IT Architecture Enterprise Infographics
Gain insights into Enterprise IT Architecture with our customizable infographic template. This template is fully compatible with popular presentation software like PowerPoint, Keynote, and Google Slides, allowing you to easily customize it to illustrate and communicate various aspects of enterprise IT architecture. The Enterprise IT Architecture infographic template offers a visually engaging platform to explore and explain the architectural components, frameworks, and strategies used in large organizations. Whether you're an IT professional, business leader, or simply interested in enterprise technology, this template provides a user-friendly canvas to create informative presentations and educational materials. Enhance your knowledge of Enterprise IT Architecture with this SEO-optimized infographic template, thoughtfully designed for clarity and ease of use. Customize it to highlight key principles, architectural layers, integration strategies, and best practices, ensuring that your audience gains a comprehensive understanding of this critical field. Start crafting your personalized infographic today to delve into the world of Enterprise IT Architecture.


7 slides
Population United States Map Infographic Presentation
The United States is located in North America and is comprised of 50 states and the District of Columbia. This template is a stylish and attractive way to showcase your data on a map. It is compatible with Powerpoint, Keynote and Google Slides, making it easily customized and adjusted according to your needs, and for different presentations or reports. This United States Map is the perfect visual for presentations on geography, history, and political science! There are various icons where you can input your data, and statistics. This template can be used for your next map project!


6 slides
SCRUM Framework Infographics
The "SCRUM Framework" infographic template is a dynamic and insightful tool, meticulously crafted for PowerPoint, Keynote, and Google Slides. This template is essential for project managers, agile coaches, and development teams striving to elucidate the intricacies and benefits of the SCRUM methodology in their projects. This template adeptly breaks down the SCRUM framework into its core components: roles, events, and artifacts. It showcases the iterative process of product development, sprint planning, daily stand-ups, sprint reviews, and retrospectives. The visual representation of SCRUM roles – Product Owner, SCRUM Master, and Development Team – along with the flow of activities, makes it an indispensable resource for SCRUM training, agile transformation initiatives, and team workshops. The design is as agile as the methodology it represents, with a color scheme that encourages clarity, focus, and energy. This not only makes the presentation visually compelling but also reinforces the principles of transparency, inspection, and adaptation that are central to SCRUM. Whether used in corporate training, team onboarding, or educational settings, this template ensures that the "SCRUM Framework" is communicated with precision, clarity, and visual flair.


6 slides
Core Focus Areas in Strategic Wheel Model Presentation
Showcase your business's key focus areas using this five-part strategic wheel layout. Each segment is paired with corresponding labels and editable text fields for streamlined messaging. Ideal for strategy, operations, or team planning. Fully customizable and compatible with PowerPoint, Keynote, and Google Slides to suit any brand style.


7 slides
McKinsey 7S Management Infographic Presentation
The McKinsey 7S model is designed to help organizations understand the various components that need to be aligned for effective performance. This Infographic is a visually engaging way to describe the 7S framework. Use it to deliver an informative message and get your ideas across clearly using the well designed graphics. This template is fully customizable to portray your company's key points and challenges in your specific business domain. It has all the elements to make a powerful business presentation and can create engaging templates with Powerpoint, Keynote, Google Slides and more.


6 slides
Simple Step-by-Step Strategy Slide
Present your ideas with clarity and focus using this clean, minimal step-by-step template. Designed with a modern, easy-to-follow layout, it’s ideal for business strategies, timelines, or process explanations. Fully editable in PowerPoint, Keynote, and Google Slides for effortless customization.


7 slides
RAPID Matrix Infographic Presentation Template
RAPID stands for Recommend, Agree, Perform, Input and Decide. The RAPID Matrix is a popular tool used to determine project planning and decision-making responsibilities. It helps ensure that the right people are involved at the right time, with the right knowledge and skills. This template makes it easy for anyone to efficiently take notes. Use it to share information on your company, business plan or vision, or for a brainstorming session with your team. Take your presentation to the next level with this easy-to-personalize template and eye catching infographic with tips for using it.


7 slides
Agile Responsibility Assignment Infographic
Navigate the complexities of project responsibilities with the agile responsibility assignment infographic. Articulately designed using a palette of blue, yellow, brown, and white, this template brings clarity to task assignments in an agile environment. Ideal for project managers, scrum masters, or agile coaches, it provides a comprehensive view of roles and responsibilities. The matrix style not only adds visual appeal but also makes information absorption effortless. This infographic is an essential tool for ensuring team alignment and is seamlessly compatible with PowerPoint, Keynote, and Google Slides.


4 slides
Creative Brush Stroke Theme Design Presentation
Bring a bold, artistic flair to your presentation with this Creative Brush Stroke Theme Design. Featuring layered paint-like strokes in vibrant tones, this layout blends creativity with clarity—perfect for design pitches, brainstorming sessions, or visual storytelling. Fully customizable in PowerPoint, Google Slides, and Canva for seamless editing.


4 slides
Cyber Threat Prevention Strategies Presentation
Clearly communicate your cybersecurity roadmap using this sleek timeline-style slide design. Each step is represented by a distinct icon and color-coded milestone, ideal for outlining protocols such as threat detection, employee training, or system hardening. Designed for IT teams, security analysts, and corporate risk departments. Fully editable and compatible with PowerPoint, Keynote, and Google Slides.


6 slides
Side-by-Side Comparison Slide Presentation
Bring your ideas to life with a bold, flowing layout that makes comparing two options feel effortless and visually engaging. This presentation helps you break down differences, highlight strengths, and guide viewers toward clear conclusions using a clean, modern design. Fully compatible with PowerPoint, Keynote, and Google Slides.