


Features
- 5 Unique slides
- Fully editable and easy to edit in Microsoft Powerpoint, Keynote and Google Slides
- 16:9 widescreen layout
- Clean and professional designs
- Export to JPG, PDF or send by email


Do you have any questions?
Recommend


21 slides
Wyrm Marketing Strategy Plan Presentation
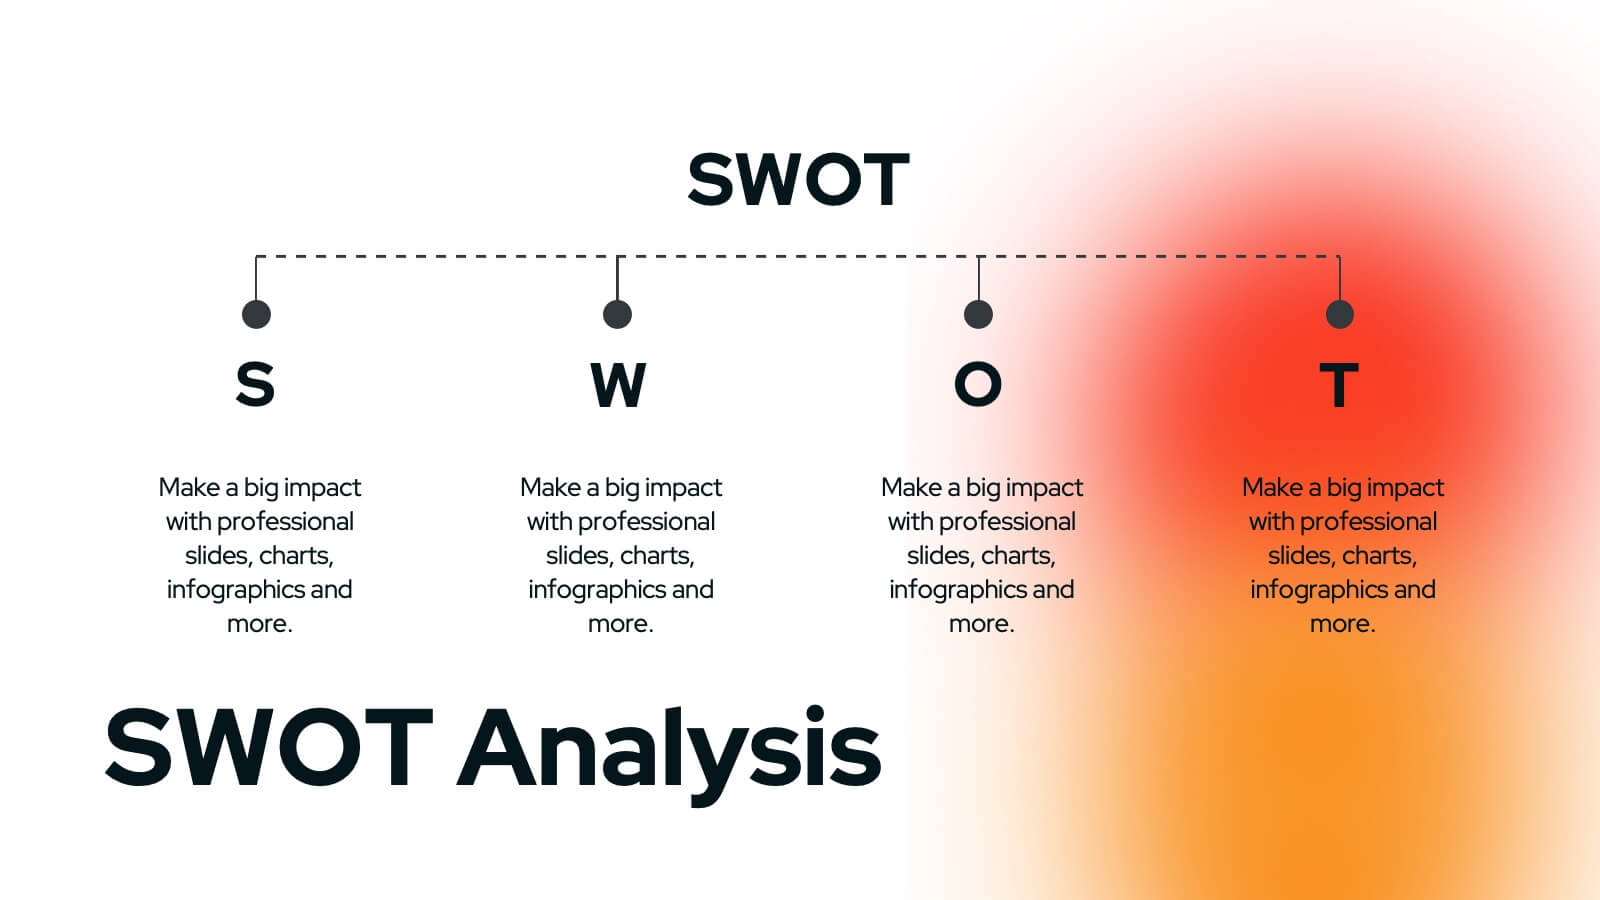
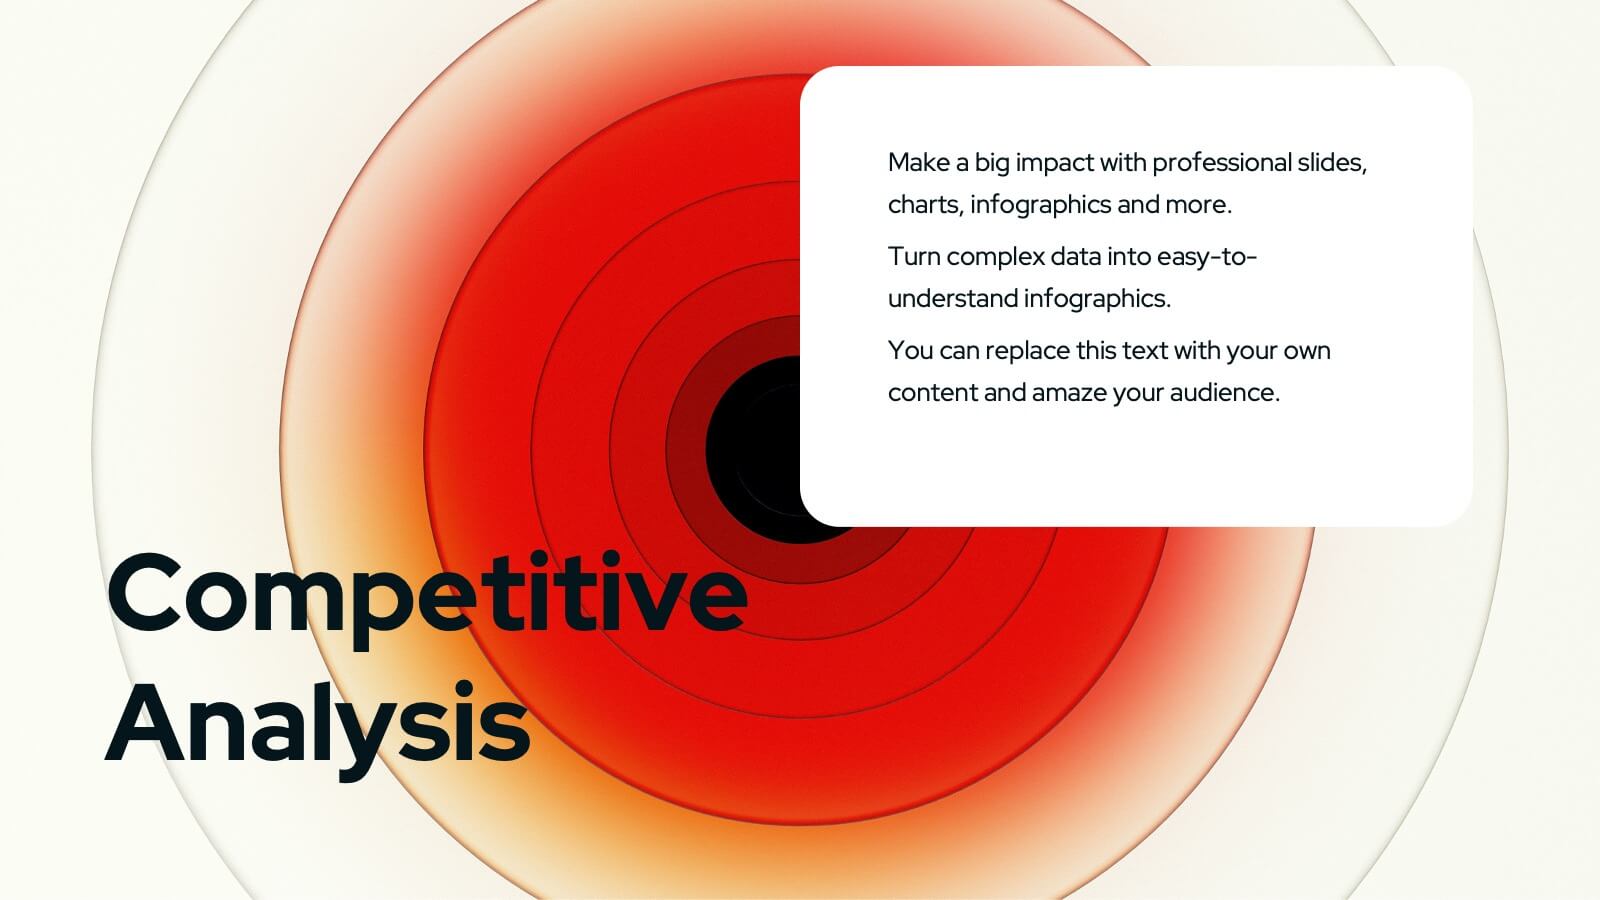
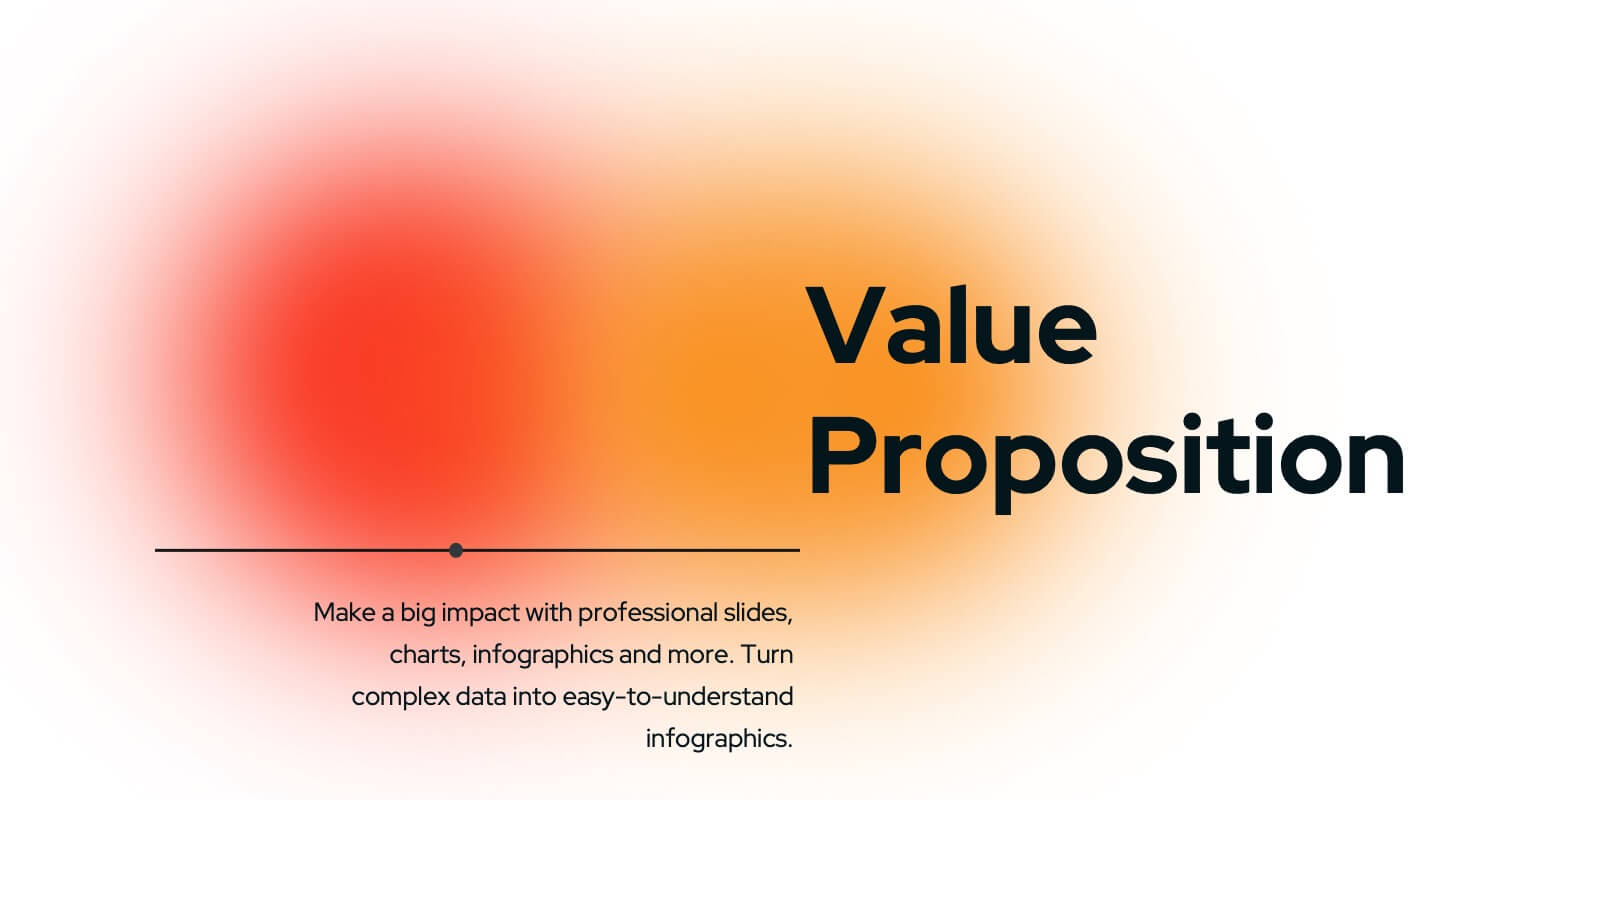
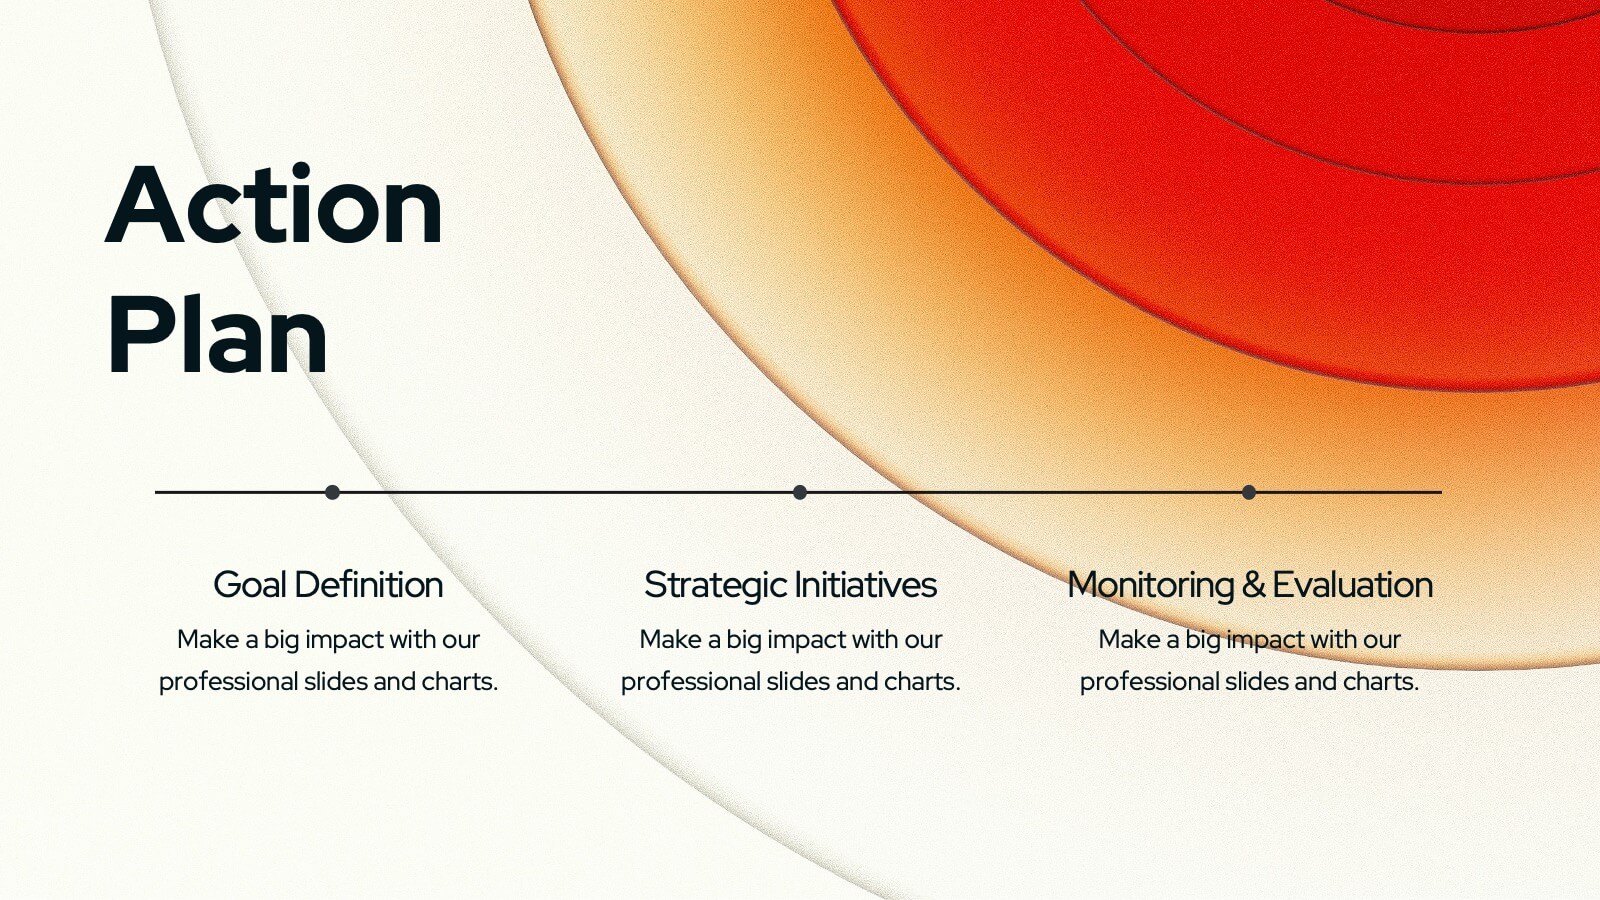
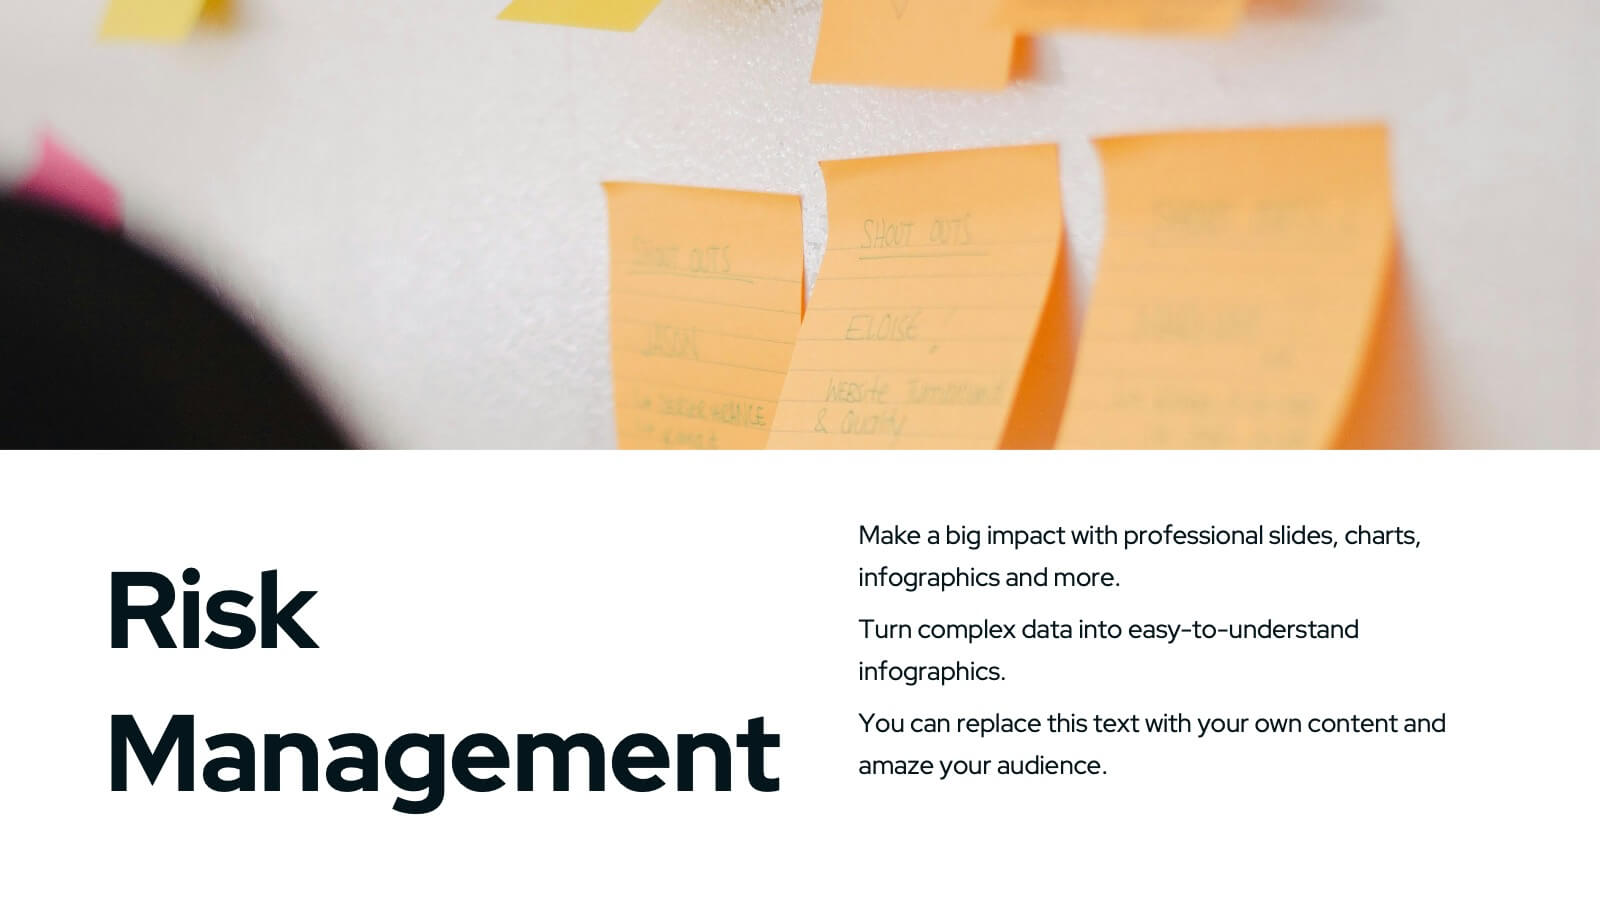
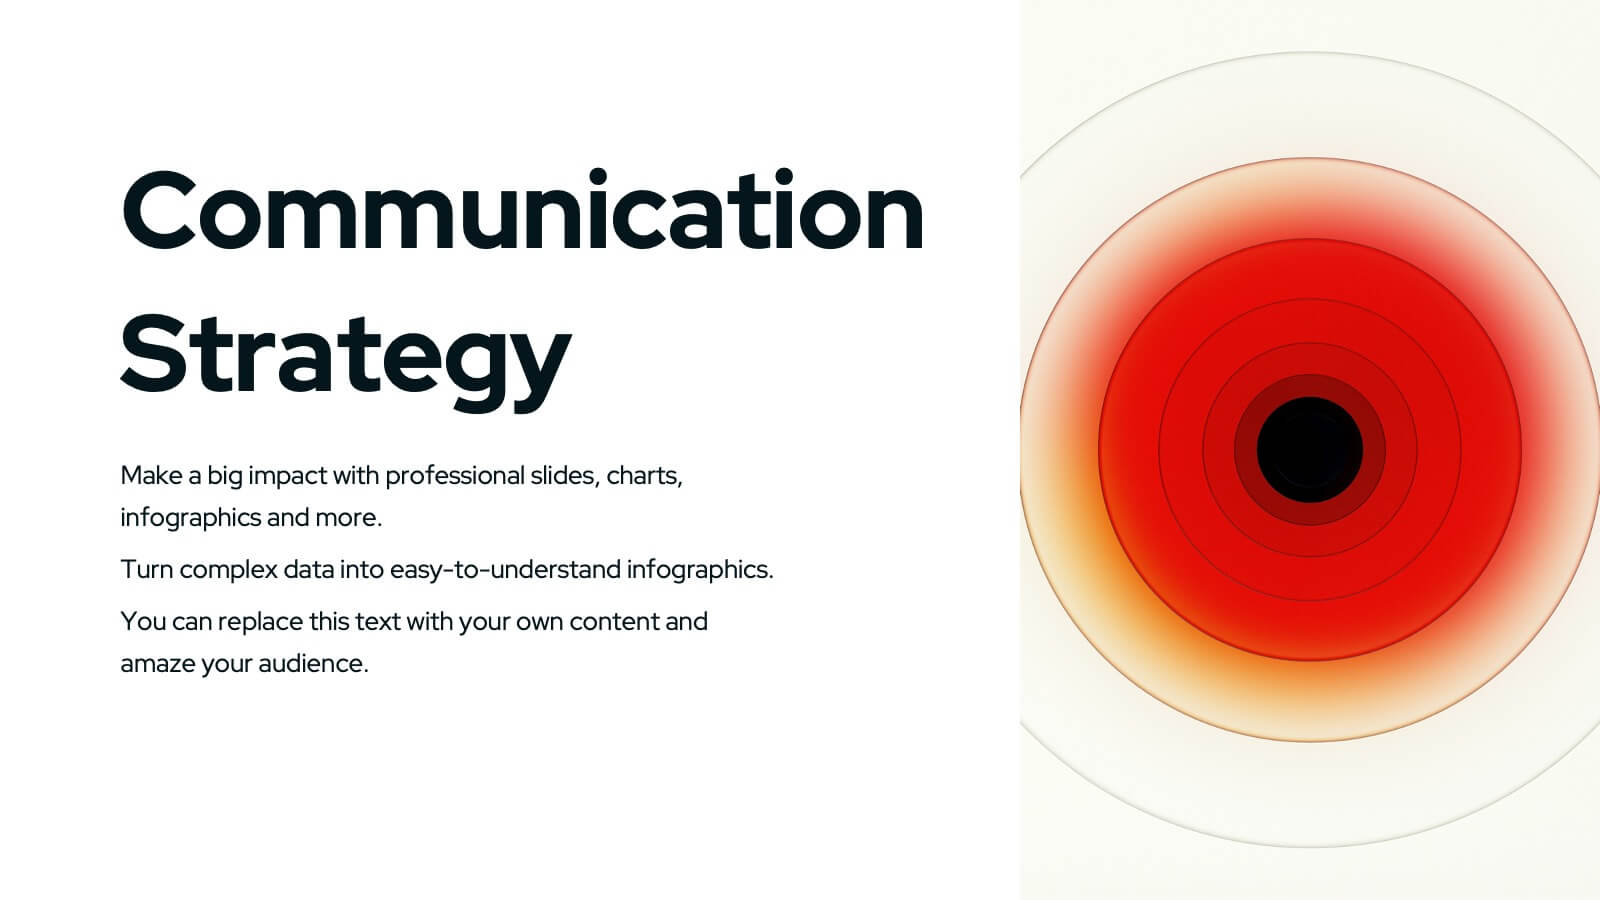
Unleash the power of your marketing strategy with this bold and dynamic presentation template! Perfect for covering everything from landscape analysis and target audience identification to performance metrics and risk management. This template helps guide your audience through key challenges, SWOT analysis, and strategic initiatives with clarity and impact. Compatible with PowerPoint, Keynote, and Google Slides for effortless and engaging presentations.


5 slides
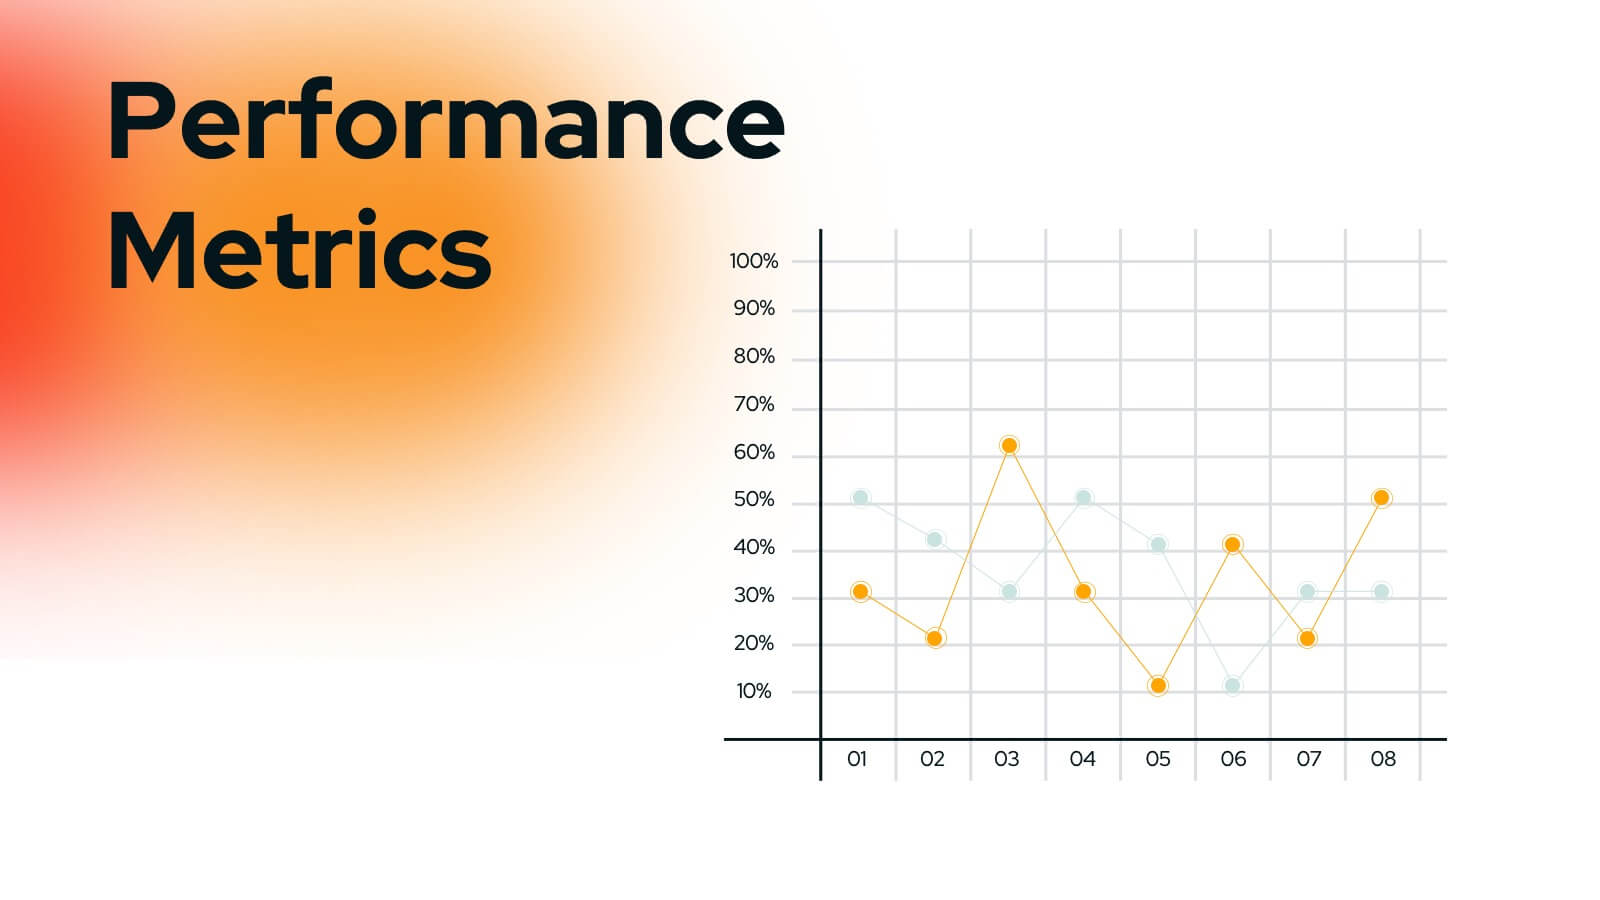
Performance Metrics and KPI Review Presentation
Visualize performance at a glance with the Performance Metrics and KPI Review presentation template. Featuring sleek gauge charts in various color schemes, this layout makes it easy to display progress, thresholds, and KPIs across categories. Customize each dial and label to reflect your own business metrics. Compatible with PowerPoint, Keynote, and Google Slides.


5 slides
Data Distribution with Pie Chart Visuals Presentation
Visualize complex metrics with ease using the Data Distribution with Pie Chart Visuals Presentation. This slide design integrates a clean side-by-side layout of a colorful pie chart and a five-point legend, making it ideal for showcasing proportions, segments, or performance breakdowns. Each item features an icon and customizable text to clearly label your data points. Perfect for business analysts, marketers, and financial teams, the slide is editable in PowerPoint, Keynote, and Google Slides. It’s a great choice for delivering data-driven insights in a simple, visual format.


5 slides
New Product Innovation Plan Presentation
Bring your ideas to market with confidence using this clear and engaging presentation. Designed to showcase every stage of product development, it helps visualize innovation steps, research insights, and launch strategies with impact. Fully editable and compatible with PowerPoint, Keynote, and Google Slides for effortless customization and professional results.


5 slides
Multi-Step Procedure and Execution Flow Presentation
Visualize complex processes with clarity using the Multi-Step Procedure and Execution Flow Presentation. Ideal for SOPs, task breakdowns, or team workflows, this layout helps you present sequential actions, decision points, and outcomes with a clean, structured flow. Fully editable in PowerPoint, Canva, and Google Slides.


7 slides
Secondary Education Infographic
Secondary education, also known as high school education, plays a crucial role in a person's academic and personal development. This template is a useful tool for demonstrating the power of secondary education, as well as educational marketing strategies that offer students a range of tools to help them achieve success. This is ideal for infographics about career goals, student professional development, digital learning and more. Compatible with Powerpoint, keynote and google slides, you can create a powerful and engaging learning experience by presenting your data in a visually appealing way.


6 slides
Decision Flow Diagram Presentation
Make complex decisions easier to follow with the Decision Flow Diagram Presentation. This clean and logical layout breaks down two main options and guides viewers through possible outcomes using a visual tree structure. Featuring checkmark and X icons to clearly denote decisions, this template is ideal for strategic planning, operations, or troubleshooting. Includes light and dark modes, editable in PowerPoint, Keynote, and Google Slides.


5 slides
Dynamic Pricing Strategies
Make pricing strategy look smart and data-driven with this bold, modern infographic template. Designed to explain how pricing evolves with demand, value, and profit margins, this slide visually guides viewers through key steps in your dynamic pricing model. Fully editable and compatible with PowerPoint, Keynote, and Google Slides for seamless use.


7 slides
Continuing Education Infographic
Enhance your educational presentations with our continuing education infographic template. This captivating and informative template allows you to present complex educational data in a visually appealing and easily understandable manner. Fully customizable and compatible with Powerpoint, Keynote, and Google Slides. Showcase different educational paths with icons or visuals to illustrate the journey of a student. This infographic will transform educational data into an engaging and informative visual story, providing valuable insights into the world of learning and education.


21 slides
Inventra Creative Portfolio Presentation
Make a lasting impression with this sleek and modern creative portfolio presentation template. Perfect for showcasing your artistic journey, featured projects, unique style, and client testimonials. Highlight your creative process, pricing, and services with a bold and professional layout. Fully customizable in PowerPoint, Keynote, and Google Slides.


22 slides
Bona Advertising Agency Proposal Presentation
Present your agency’s vision with confidence using this sleek advertising proposal template. It covers everything from market analysis and strategy development to campaign execution and client testimonials. Ideal for securing new partnerships, it’s compatible with PowerPoint, Keynote, and Google Slides for a polished, professional presentation.


10 slides
Project Budget Breakdown Presentation
The "Project Budget Breakdown Presentation" template offers a clear and efficient way to visualize budget allocations within a project. It uses a visually appealing color scheme that highlights four different budget segments, each represented by a different color to ensure quick readability and easy understanding. The template allows you to illustrate percentages and corresponding financial values, making it straightforward for stakeholders to grasp budget allocations at a glance. This template is highly beneficial for project managers, financial analysts, and business executives who need to present and discuss budgetary details clearly and concisely in project meetings or budget reviews. It is adaptable for use in various industries, including construction, IT, marketing, and research development, supporting effective budget management and transparency.


6 slides
Construction Project Management Infographic
Construction project management is the process of planning, organizing, and overseeing construction projects from inception to completion. This infographic template is designed to showcase the essential elements and processes involved in managing a construction project. It is a concise and easy-to-understand visual representation of key aspects that play a vital role in successful project execution. This provides an overview of the project's key elements, progress, and success factors. This visually appealing infographic helps in effective communication, decision-making, and project monitoring throughout the construction process.


5 slides
Causes of Poaching Infographics
Poaching refers to the illegal hunting, capturing, or killing of wildlife, typically for commercial or personal gain. These infographic templates are designed to raise awareness about the underlying drivers of poaching activities and the need for concerted efforts to combat this illegal and harmful practice. The text boxes and illustrations included can be used to highlight the causes and factors contributing to the issue of poaching. Present the complex factors driving this issue, and empower your audience to support conservation efforts, advocate for stricter regulations, and contribute to the protection of wildlife.


10 slides
Market Trends and Expansion in Oceania Map Presentation
Unlock new opportunities with the Market Trends and Expansion in Oceania Map template, which visualizes economic growth across the region while highlighting key market trends and expansion potentials.This essential business tool is designed for clarity and impact, compatible with PowerPoint, Keynote, and Google Slides, making it versatile for diverse presentation needs.


7 slides
Performance Infographics Presentation Template
This Performance Infographic template was created with the intention of highlighting business and organizational performance in a visually appealing manner. You can create a stunning and captivating infographic that conveys your message effectively. This template was designed for professionals in organizations needing to share essential information about their organizations, goals and progress. This template is a high quality infographic presentation design made in 7 slides. This template can be used in any kind of business, school, or service and is compatible with powerpoint.


5 slides
K–12 School Planning and Curriculum Map Presentation
Visualize your school year with the K–12 School Planning and Curriculum Map Presentation. Designed for academic teams and administrators, this circular diagram helps outline yearly goals, subject milestones, or grade-level plans in five clear segments. Fully editable in PowerPoint, Keynote, Google Slides, and Canva for total customization.