


Features
- 10 Unique slides
- Fully editable and easy to edit in Microsoft Powerpoint, Keynote and Google Slides
- 16:9 widescreen layout
- Clean and professional designs
- Export to JPG, PDF or send by email


Do you have any questions?
Recommend


6 slides
Closing Summary and Key Takeaway Presentation
End your presentation with clarity using this Closing Summary and Key Takeaways Presentation. The segmented half-circle design helps you highlight up to 5 final messages or calls to action. Each section is color-coded for visual emphasis and easy understanding. Ideal for wrap-up slides, final reflections, or summary overviews. Fully editable in PowerPoint, Keynote, Google Slides, and Canva.


7 slides
Project Introduction Infographic
Effortlessly introduce your projects with our collection of project introduction slide templates, tailored for clear and effective communication. These templates are ideal for providing an overview of project goals, scopes, and deliverables, ensuring all key points are conveyed to stakeholders efficiently. Each template features a modern design, incorporating sleek graphics and bold text to highlight critical information, making them perfect for kickoff meetings, client presentations, or internal reviews. The layouts are carefully structured to guide the audience through the introduction process, including the presentation of team members, project timelines, and expected outcomes. Fully customizable to fit your specific project needs, these templates allow you to modify colors, fonts, and imagery to align with your brand identity and project requirements. Utilize these professionally designed slides to make a compelling case for your project, engaging your audience right from the start.


7 slides
Project Status Infographic Presentation Template
Project status reports are a great way for project managers to track the progress of their projects and identify risks, challenges and opportunities. They can also help stakeholders better understand what’s going on in the project. They are a critical part of the project documentation system. They allow you to monitor the state of your project’s progress, efficiently share information with upper management and help everyone involved understand where things stand. You can use project status reports to guarantee that you have a constant information flow and higher productivity.


21 slides
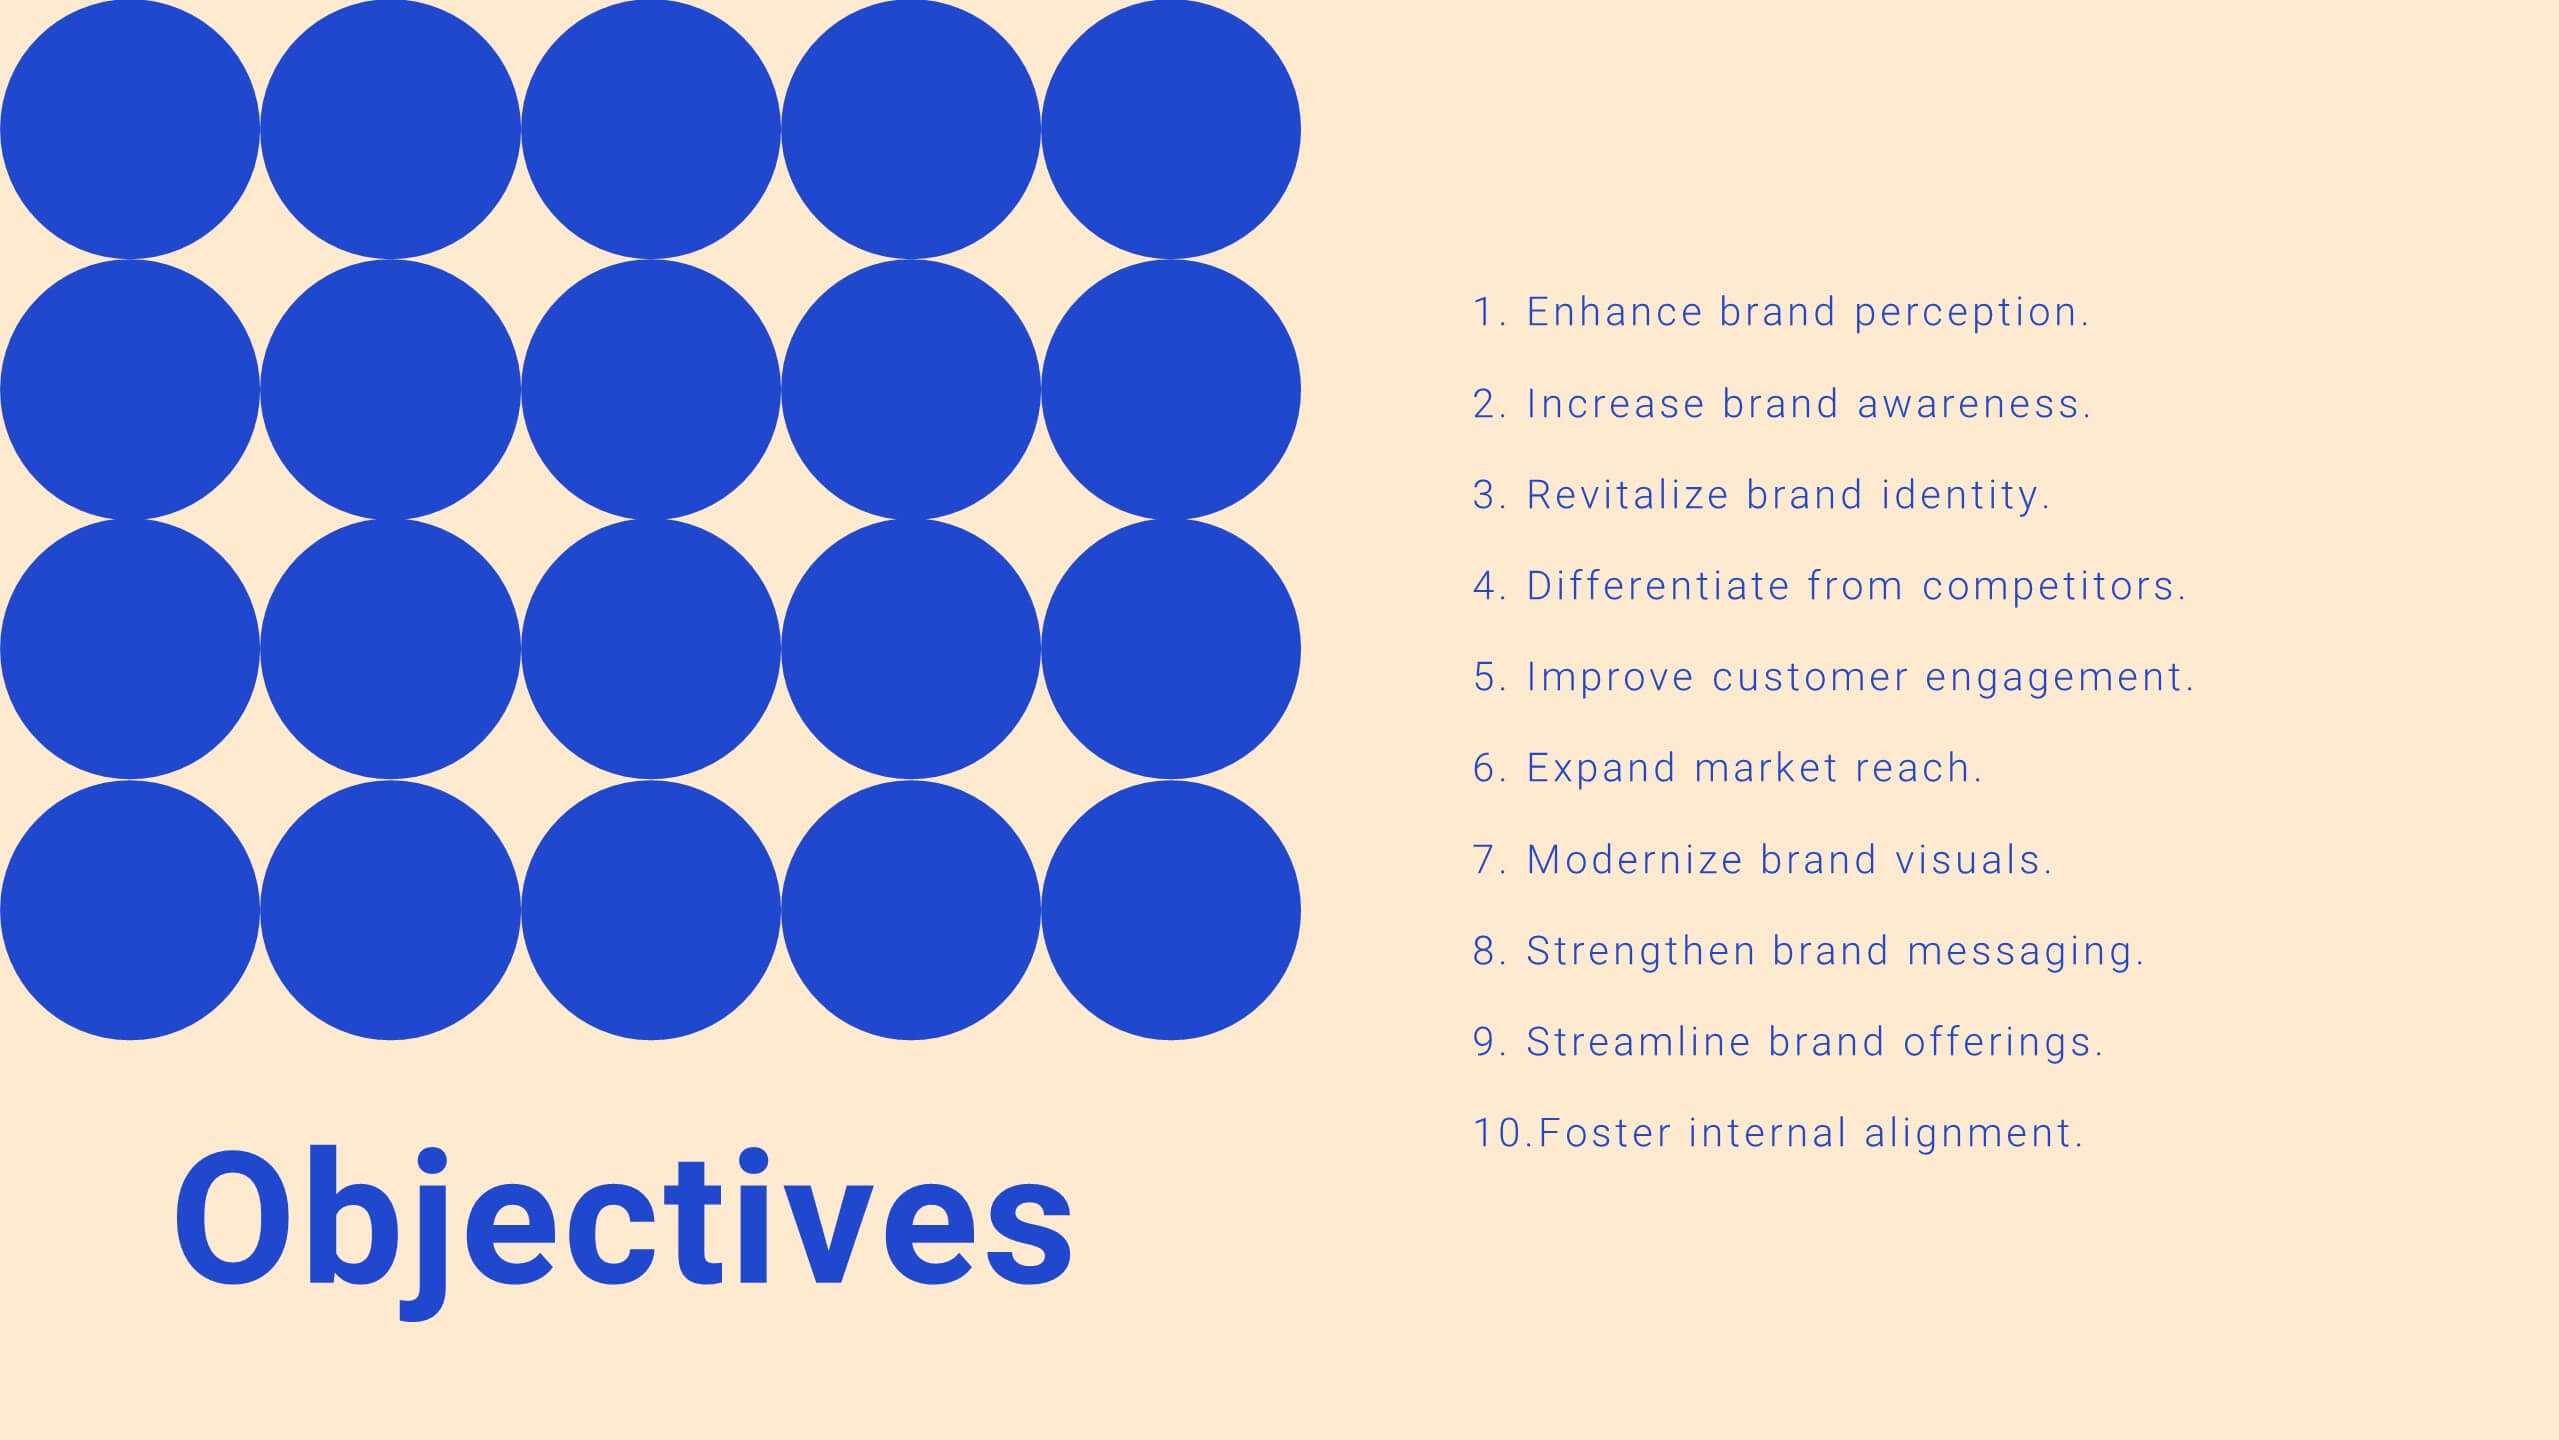
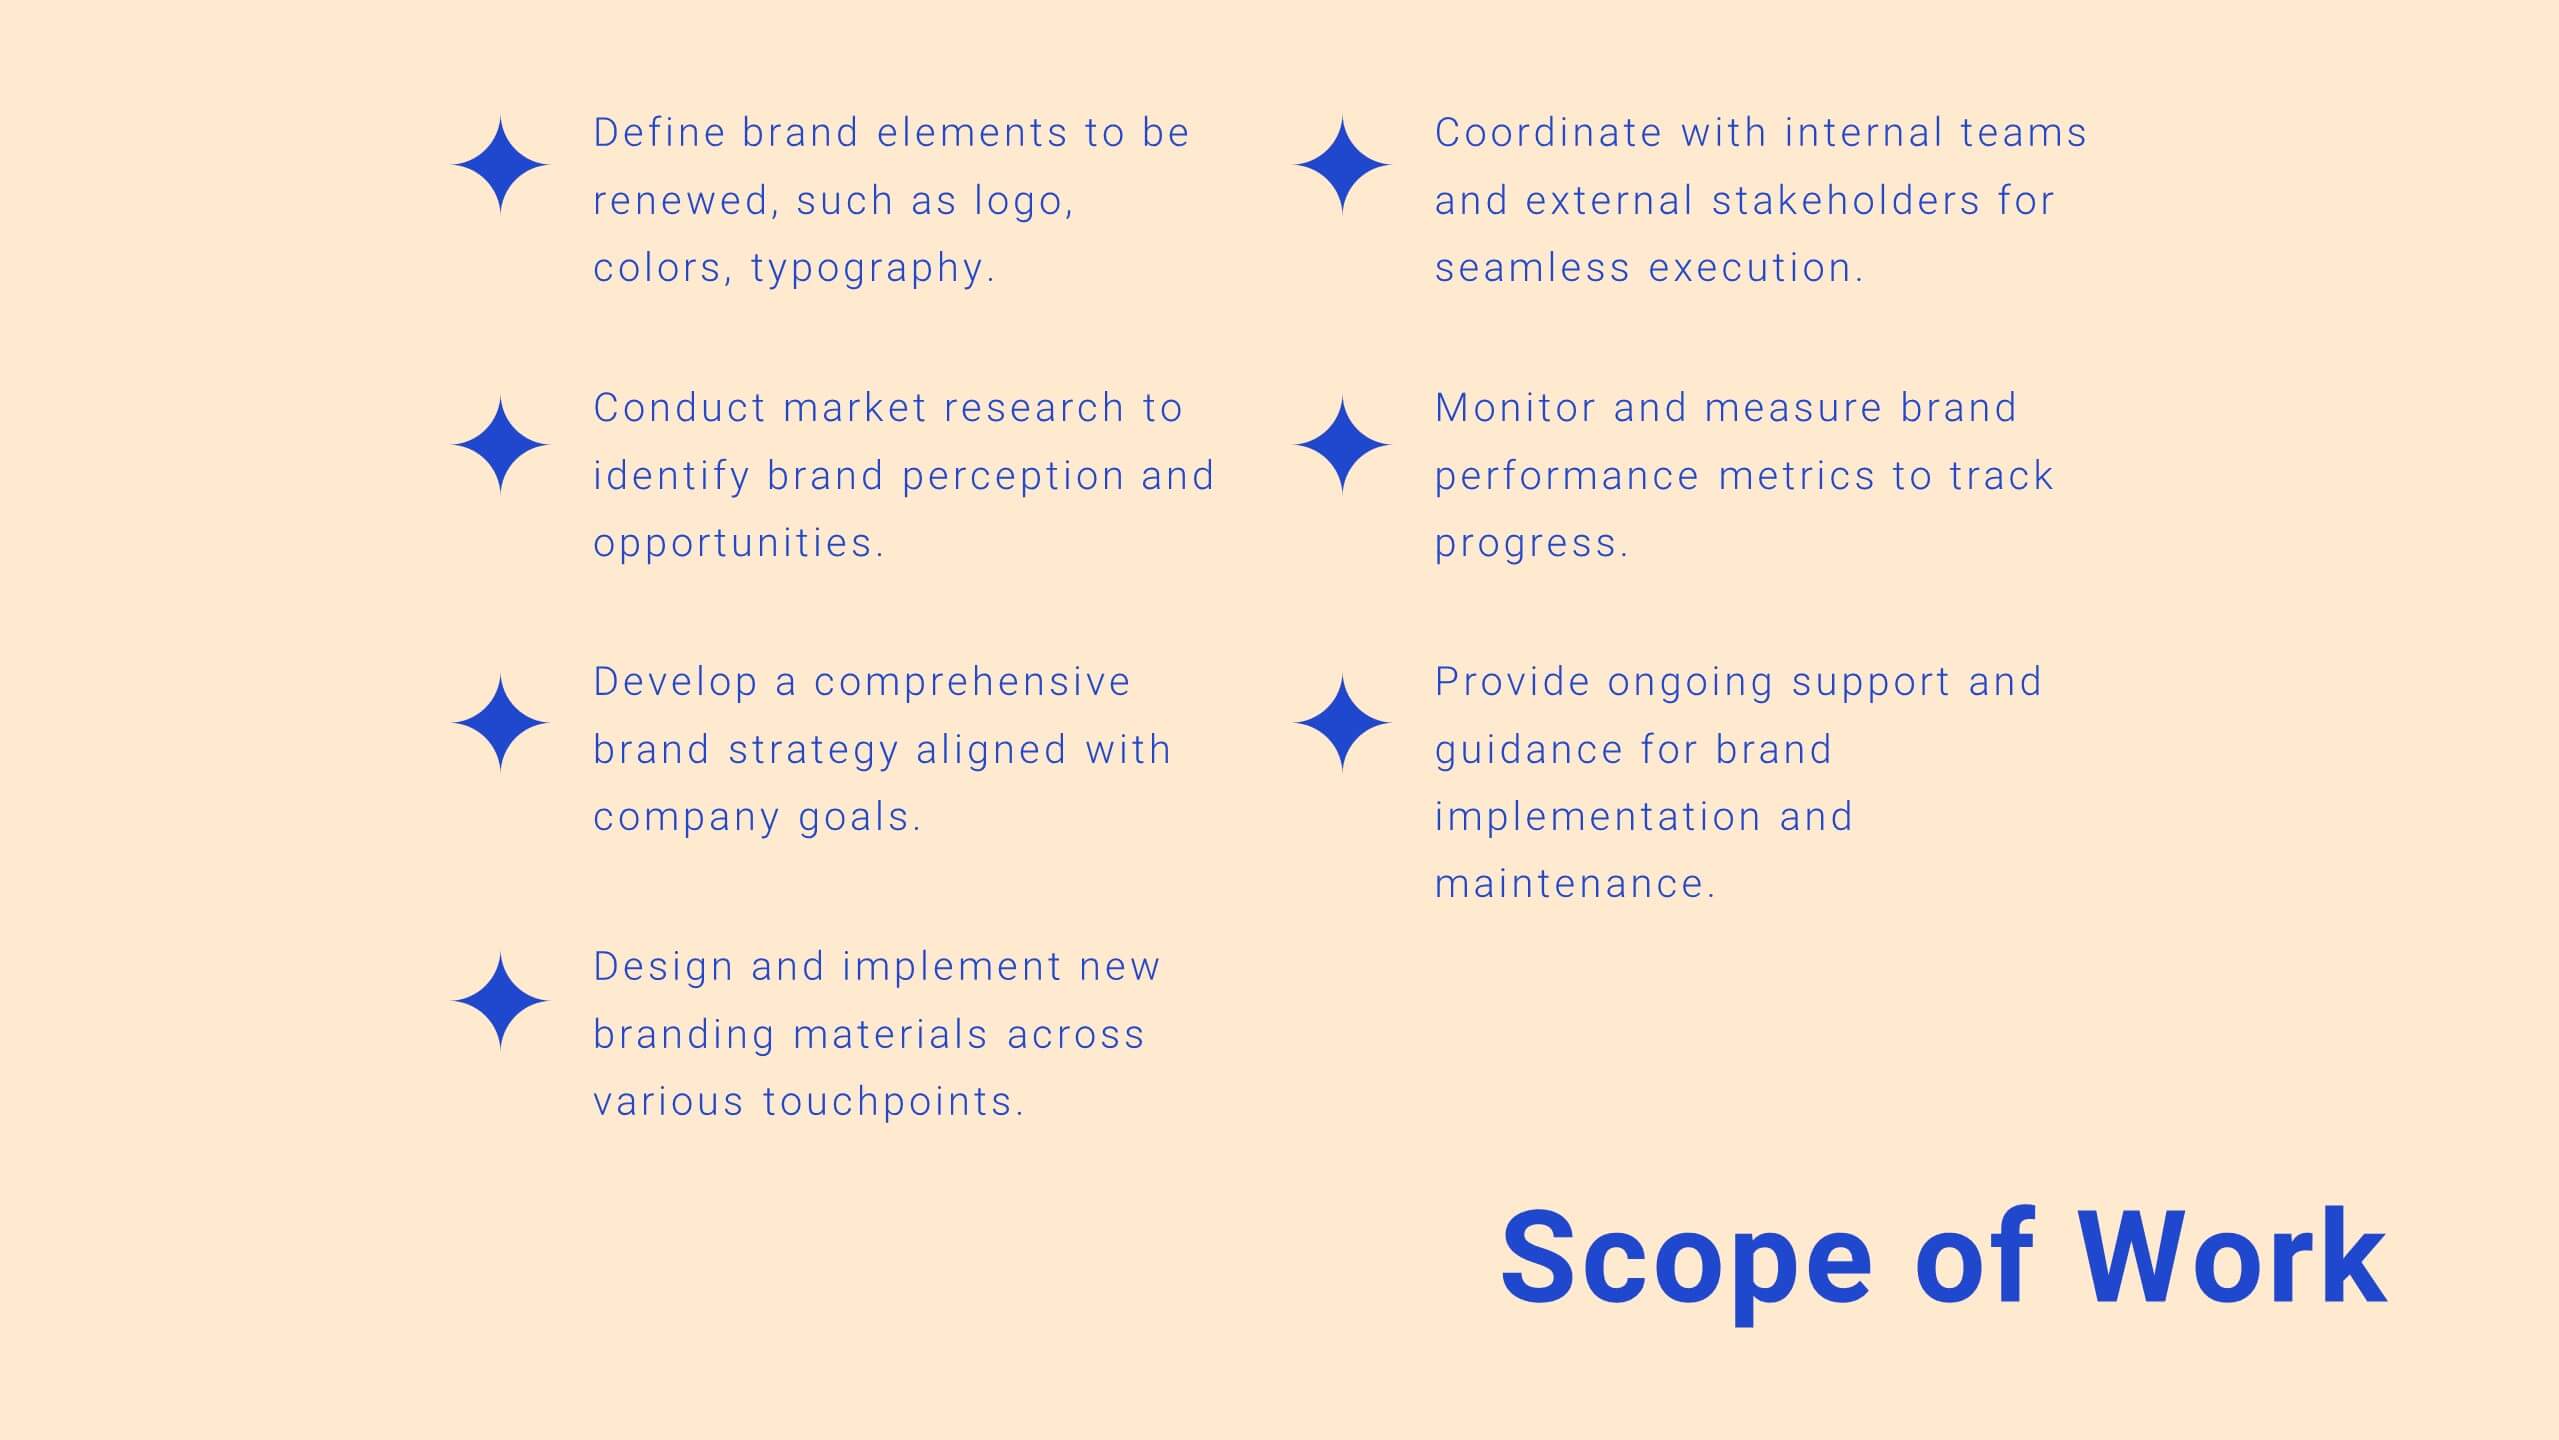
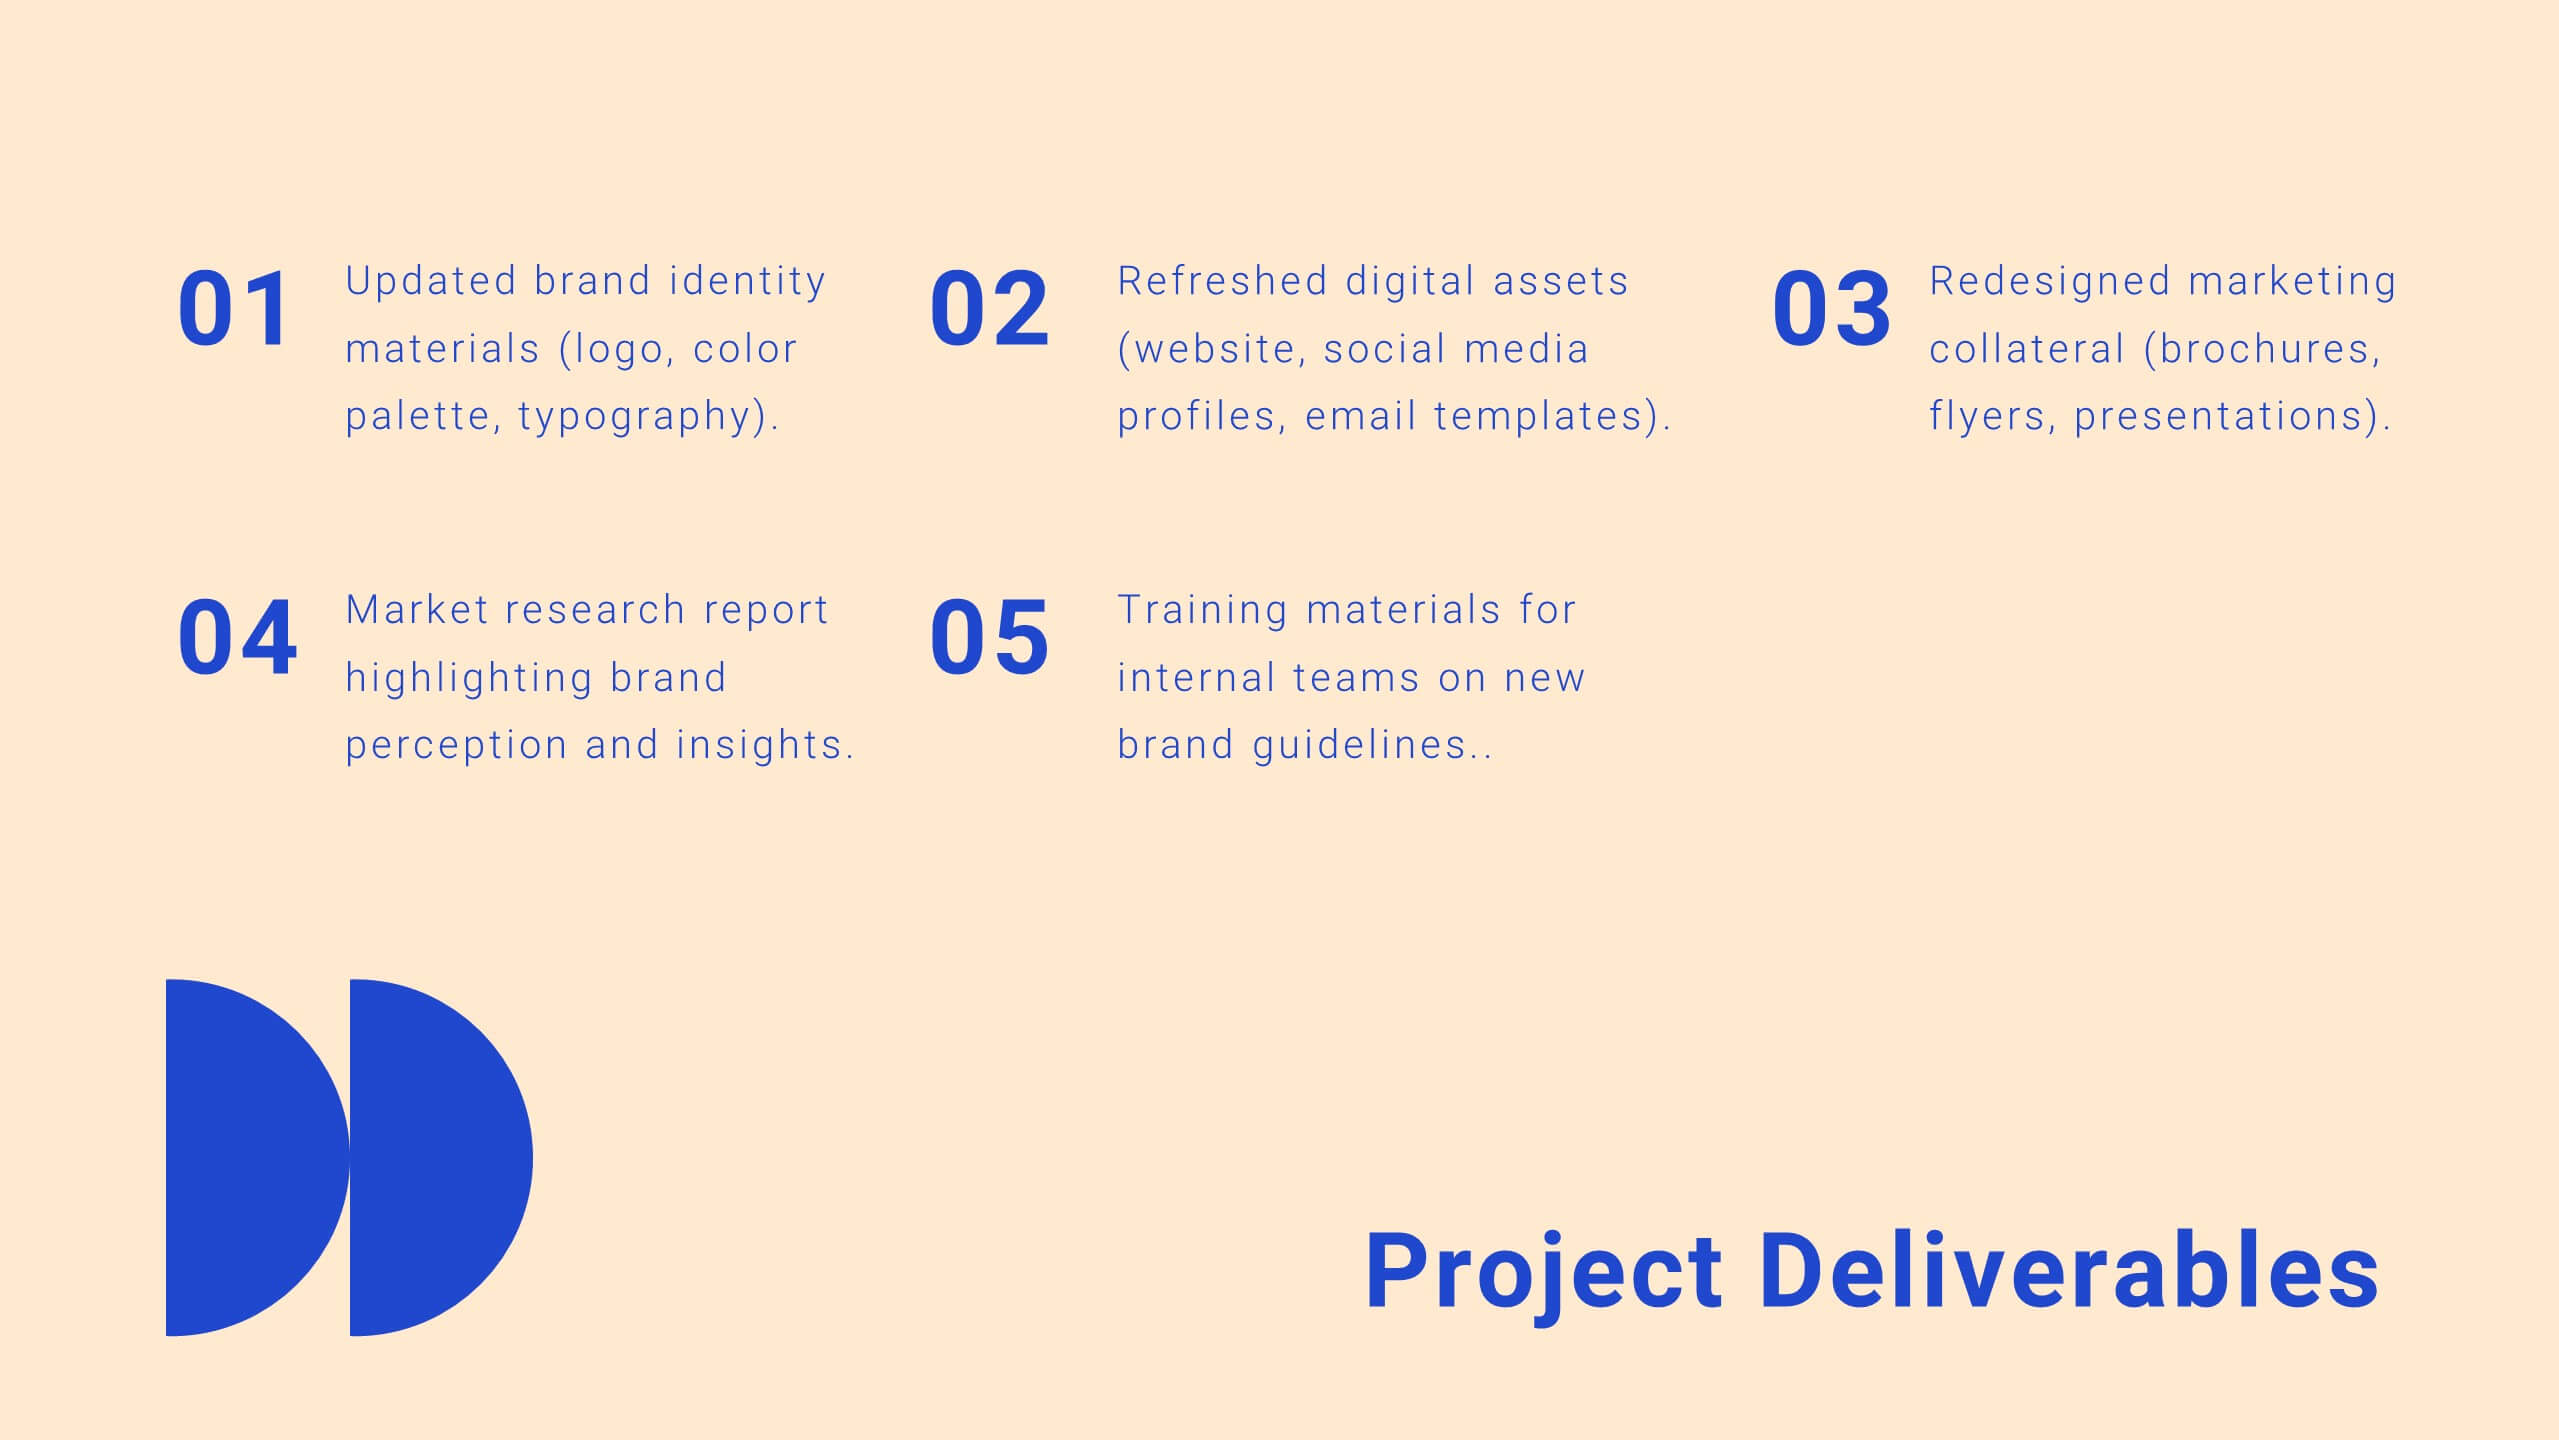
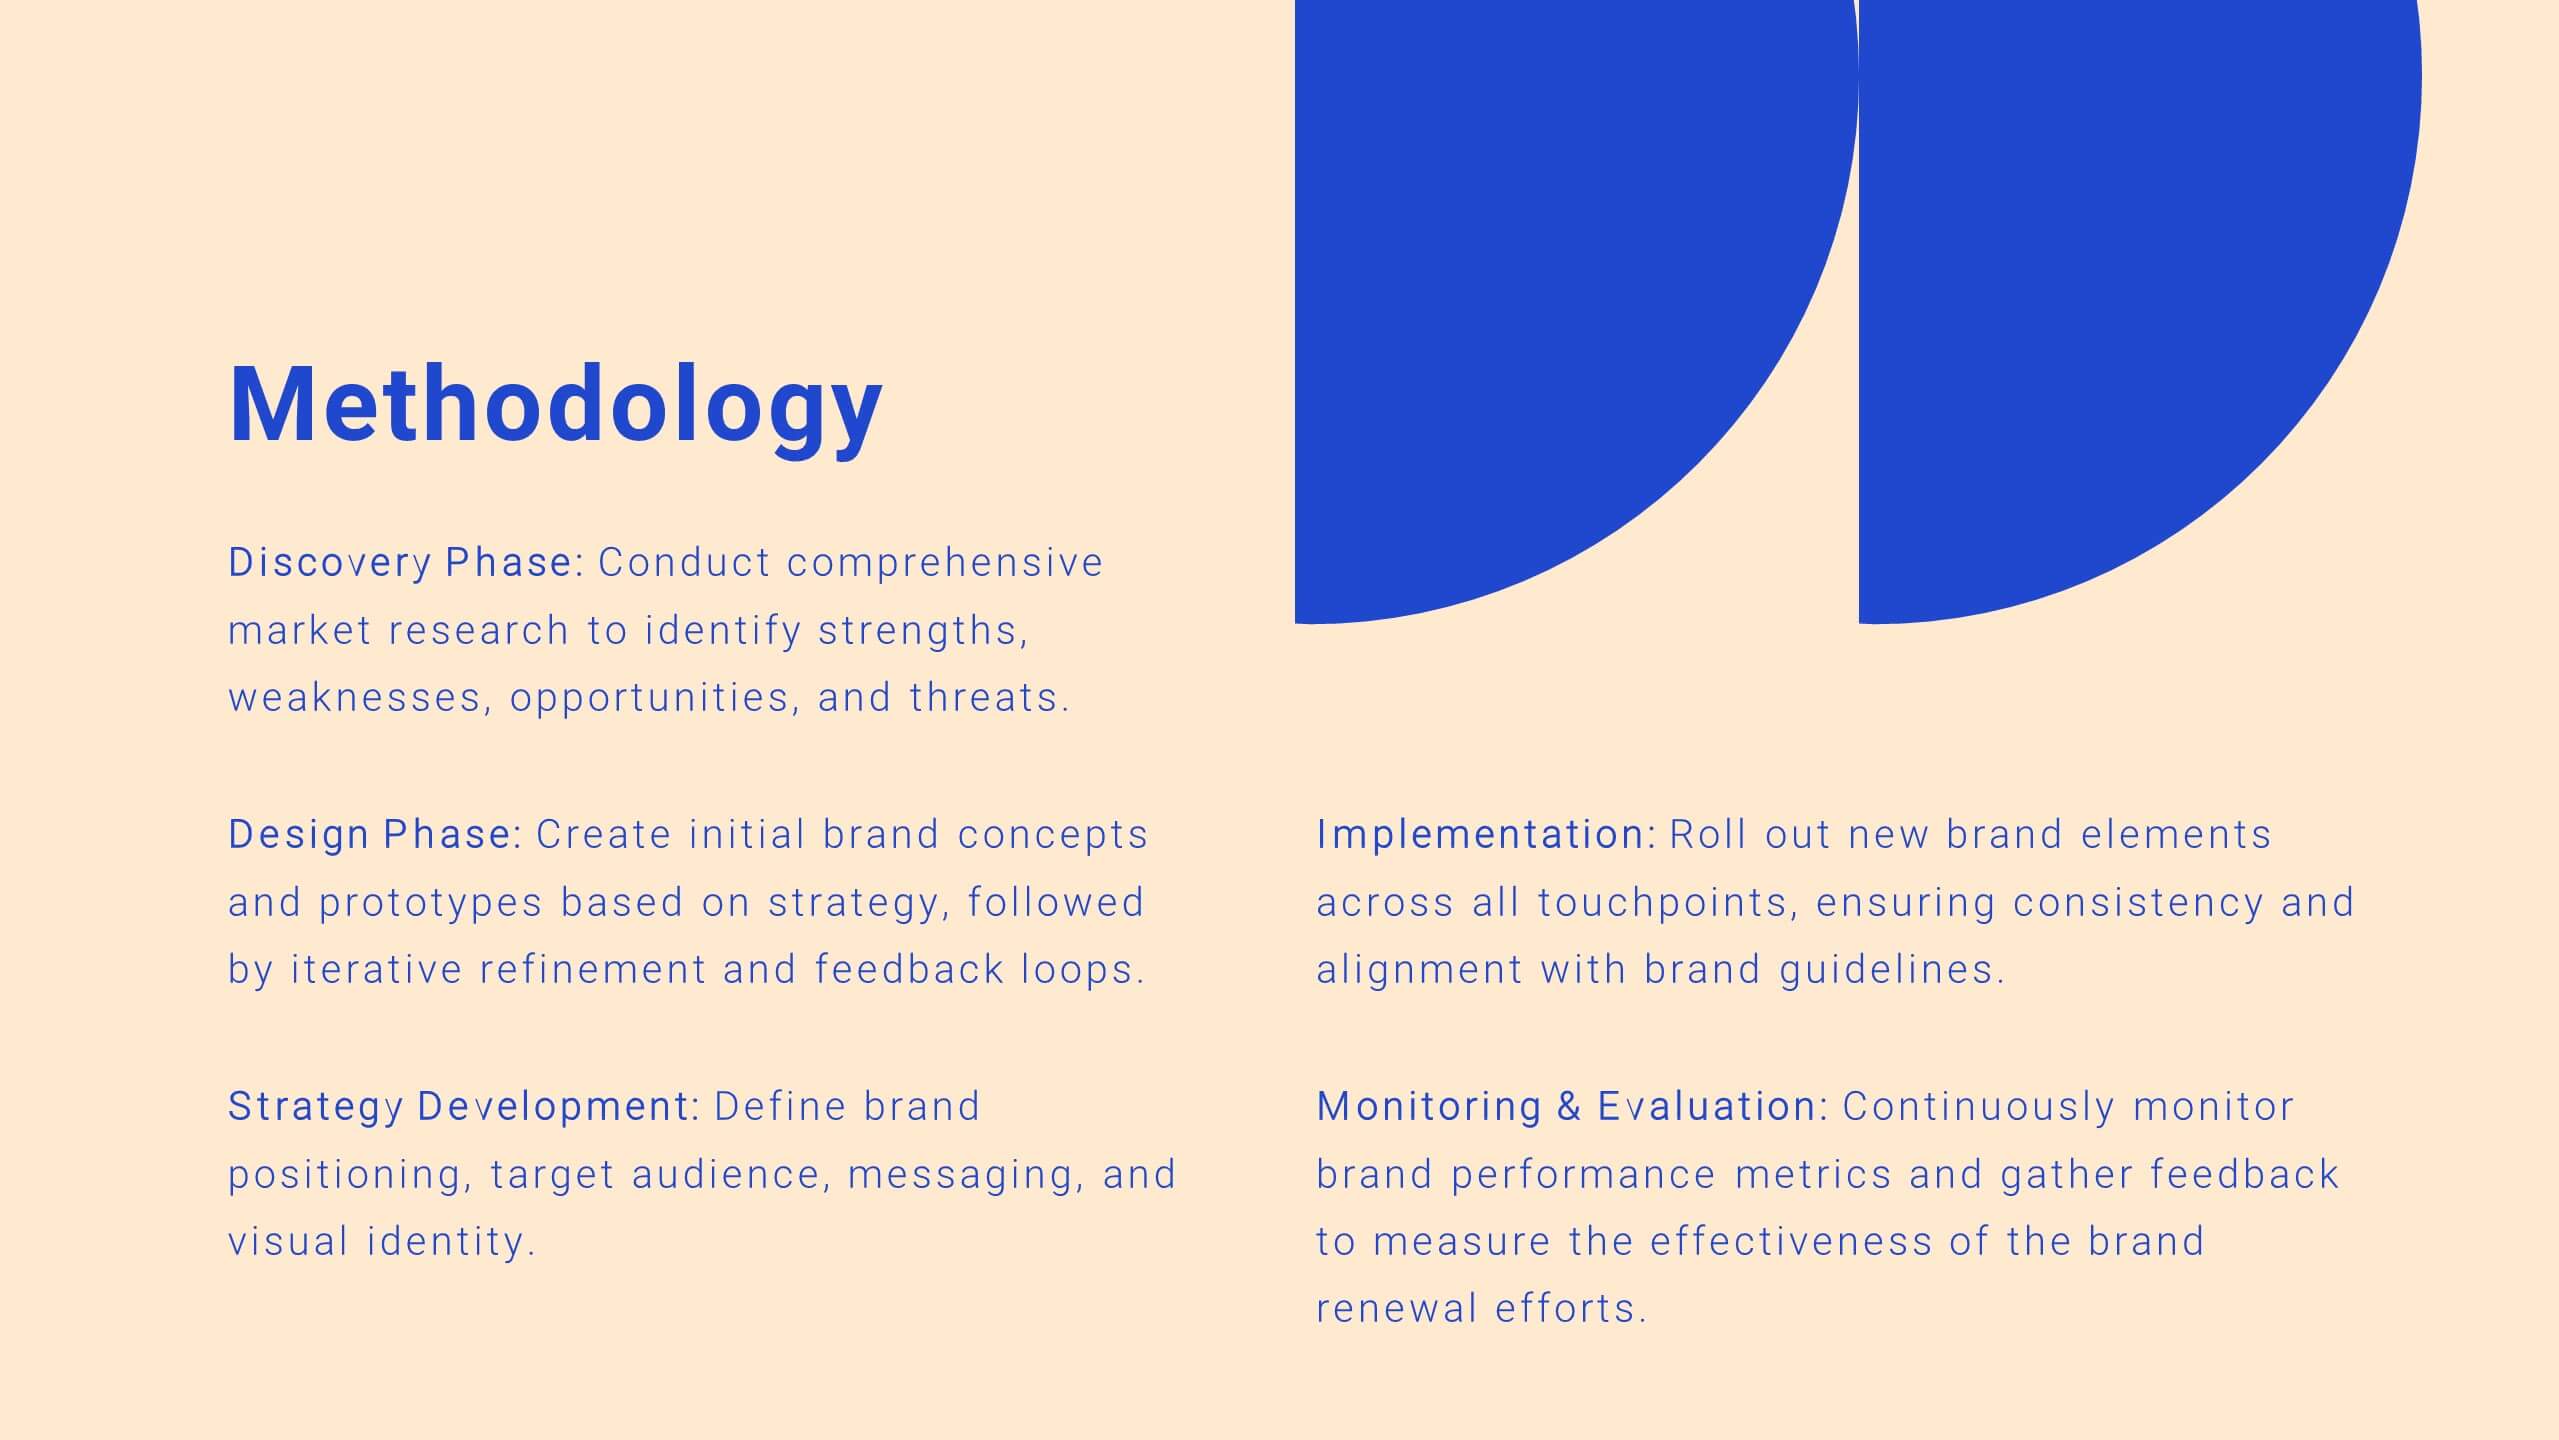
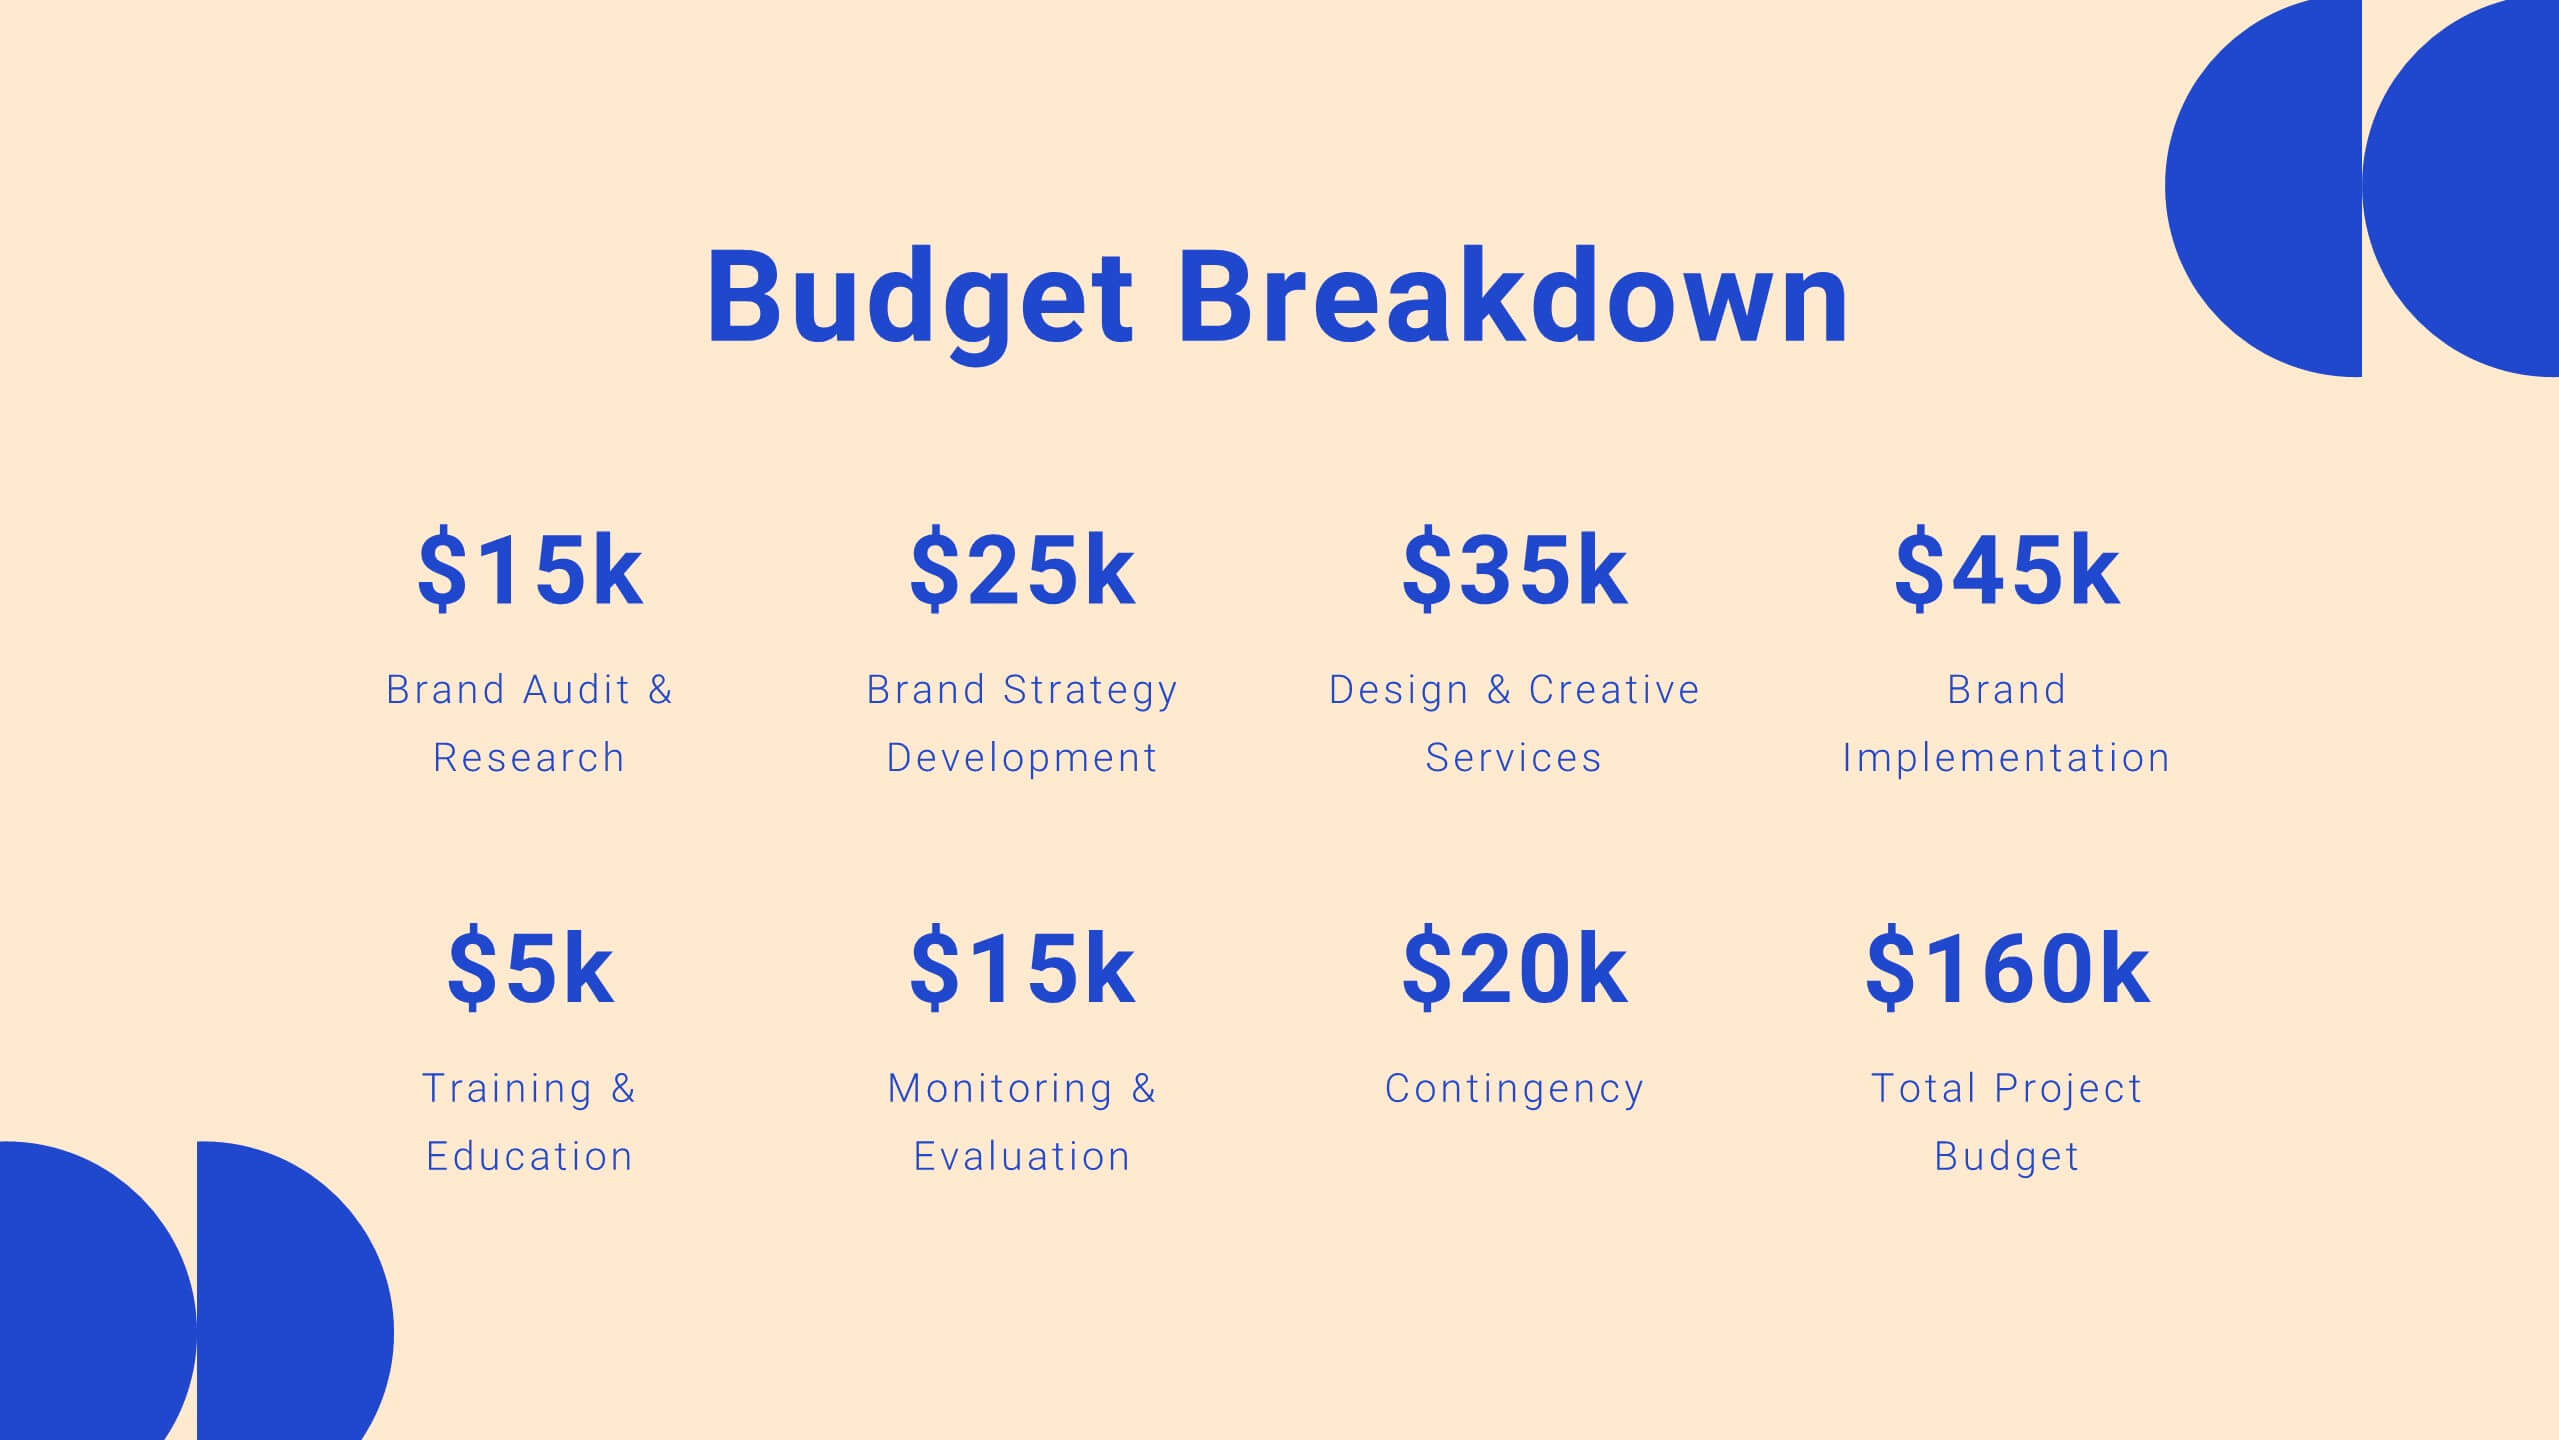
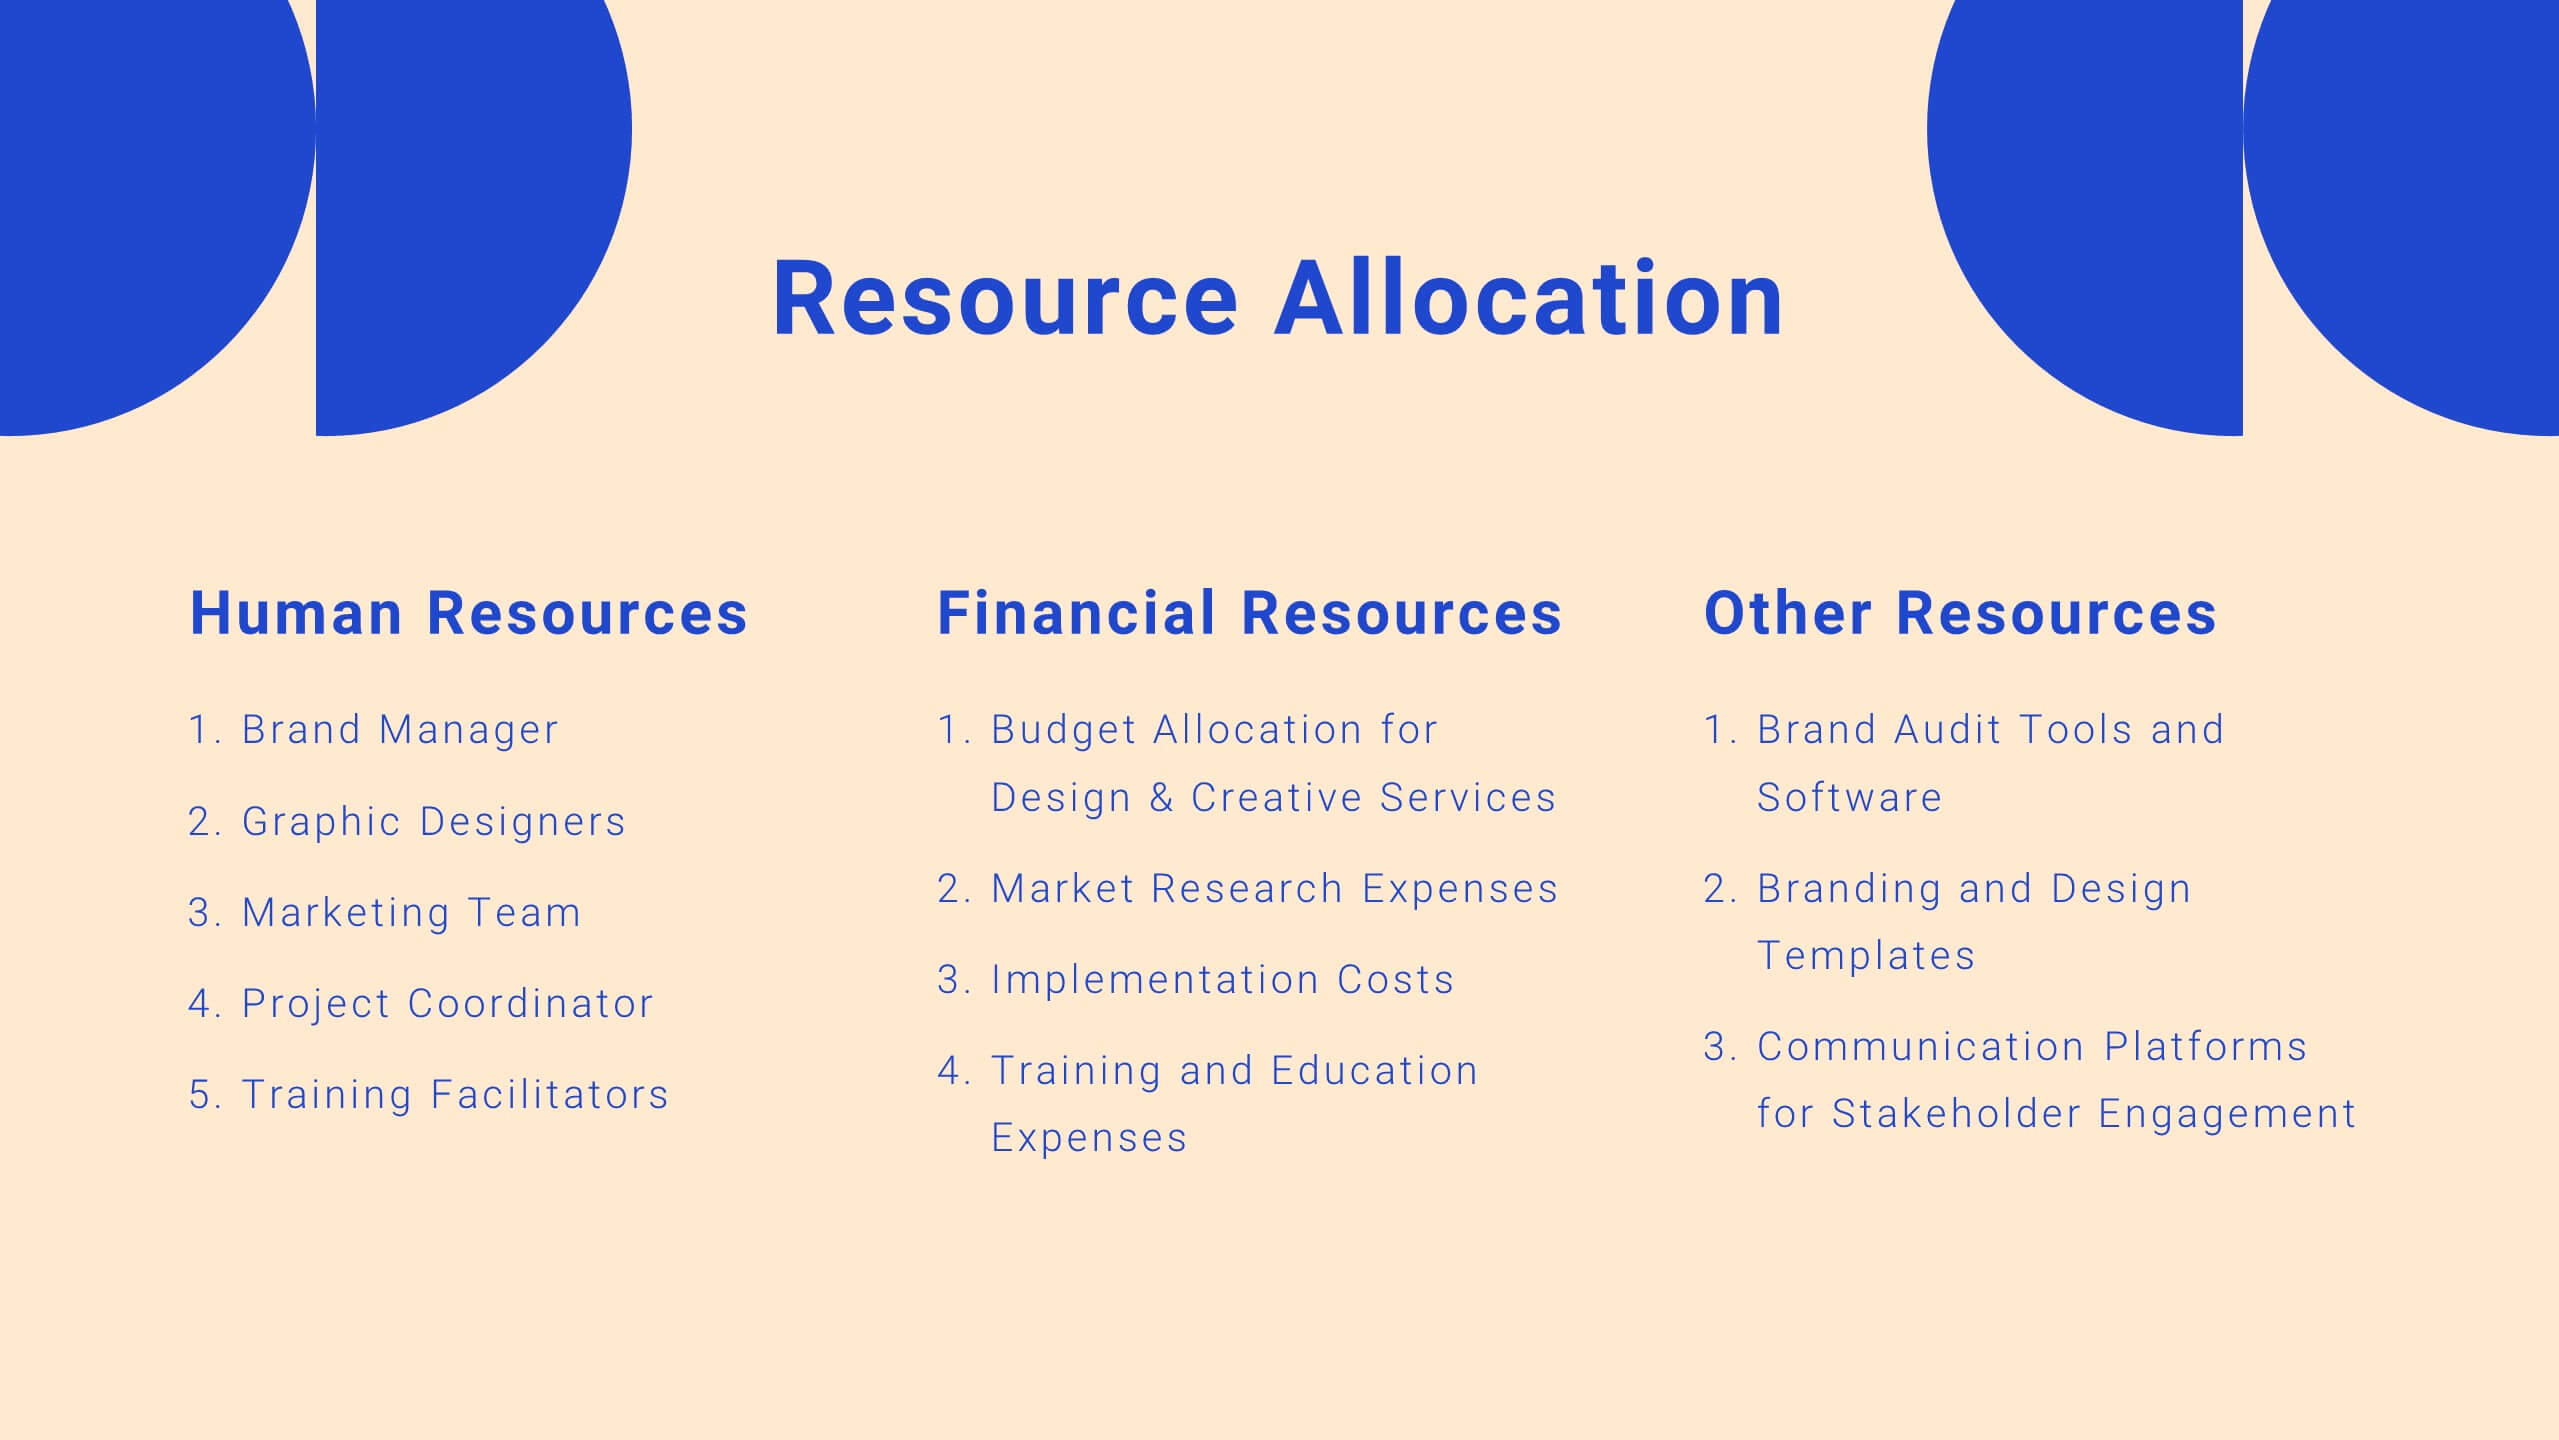
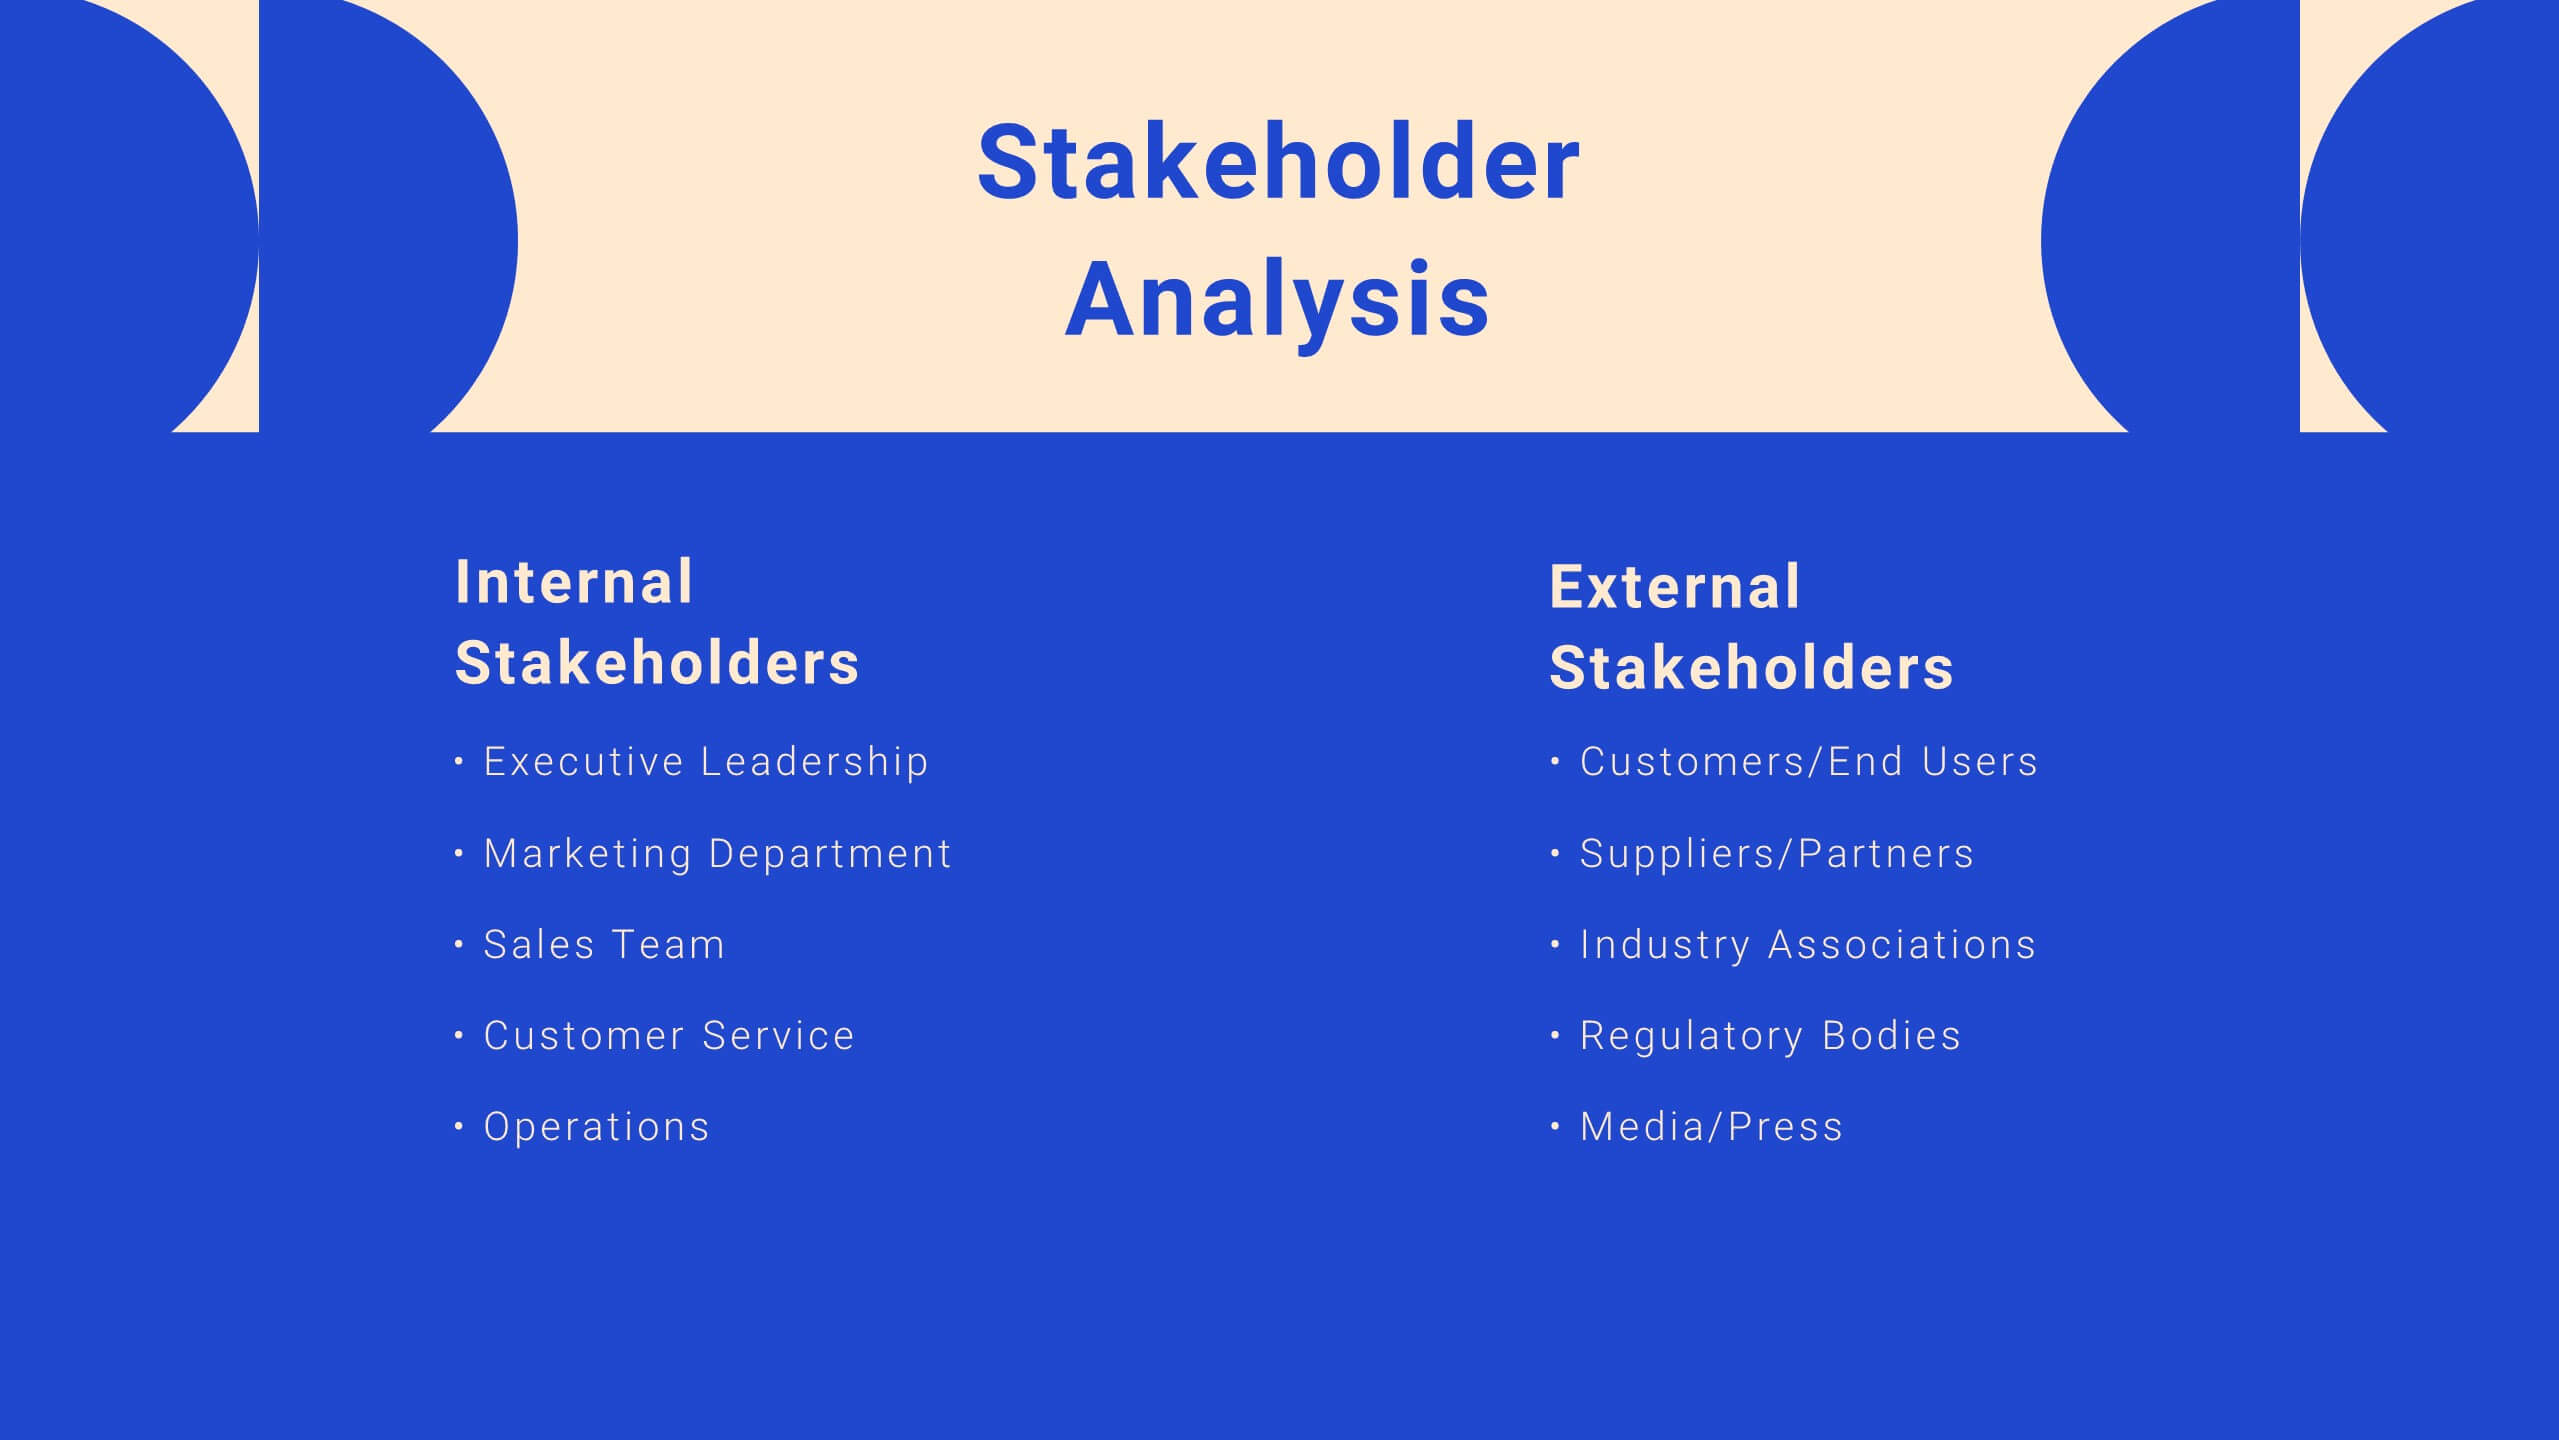
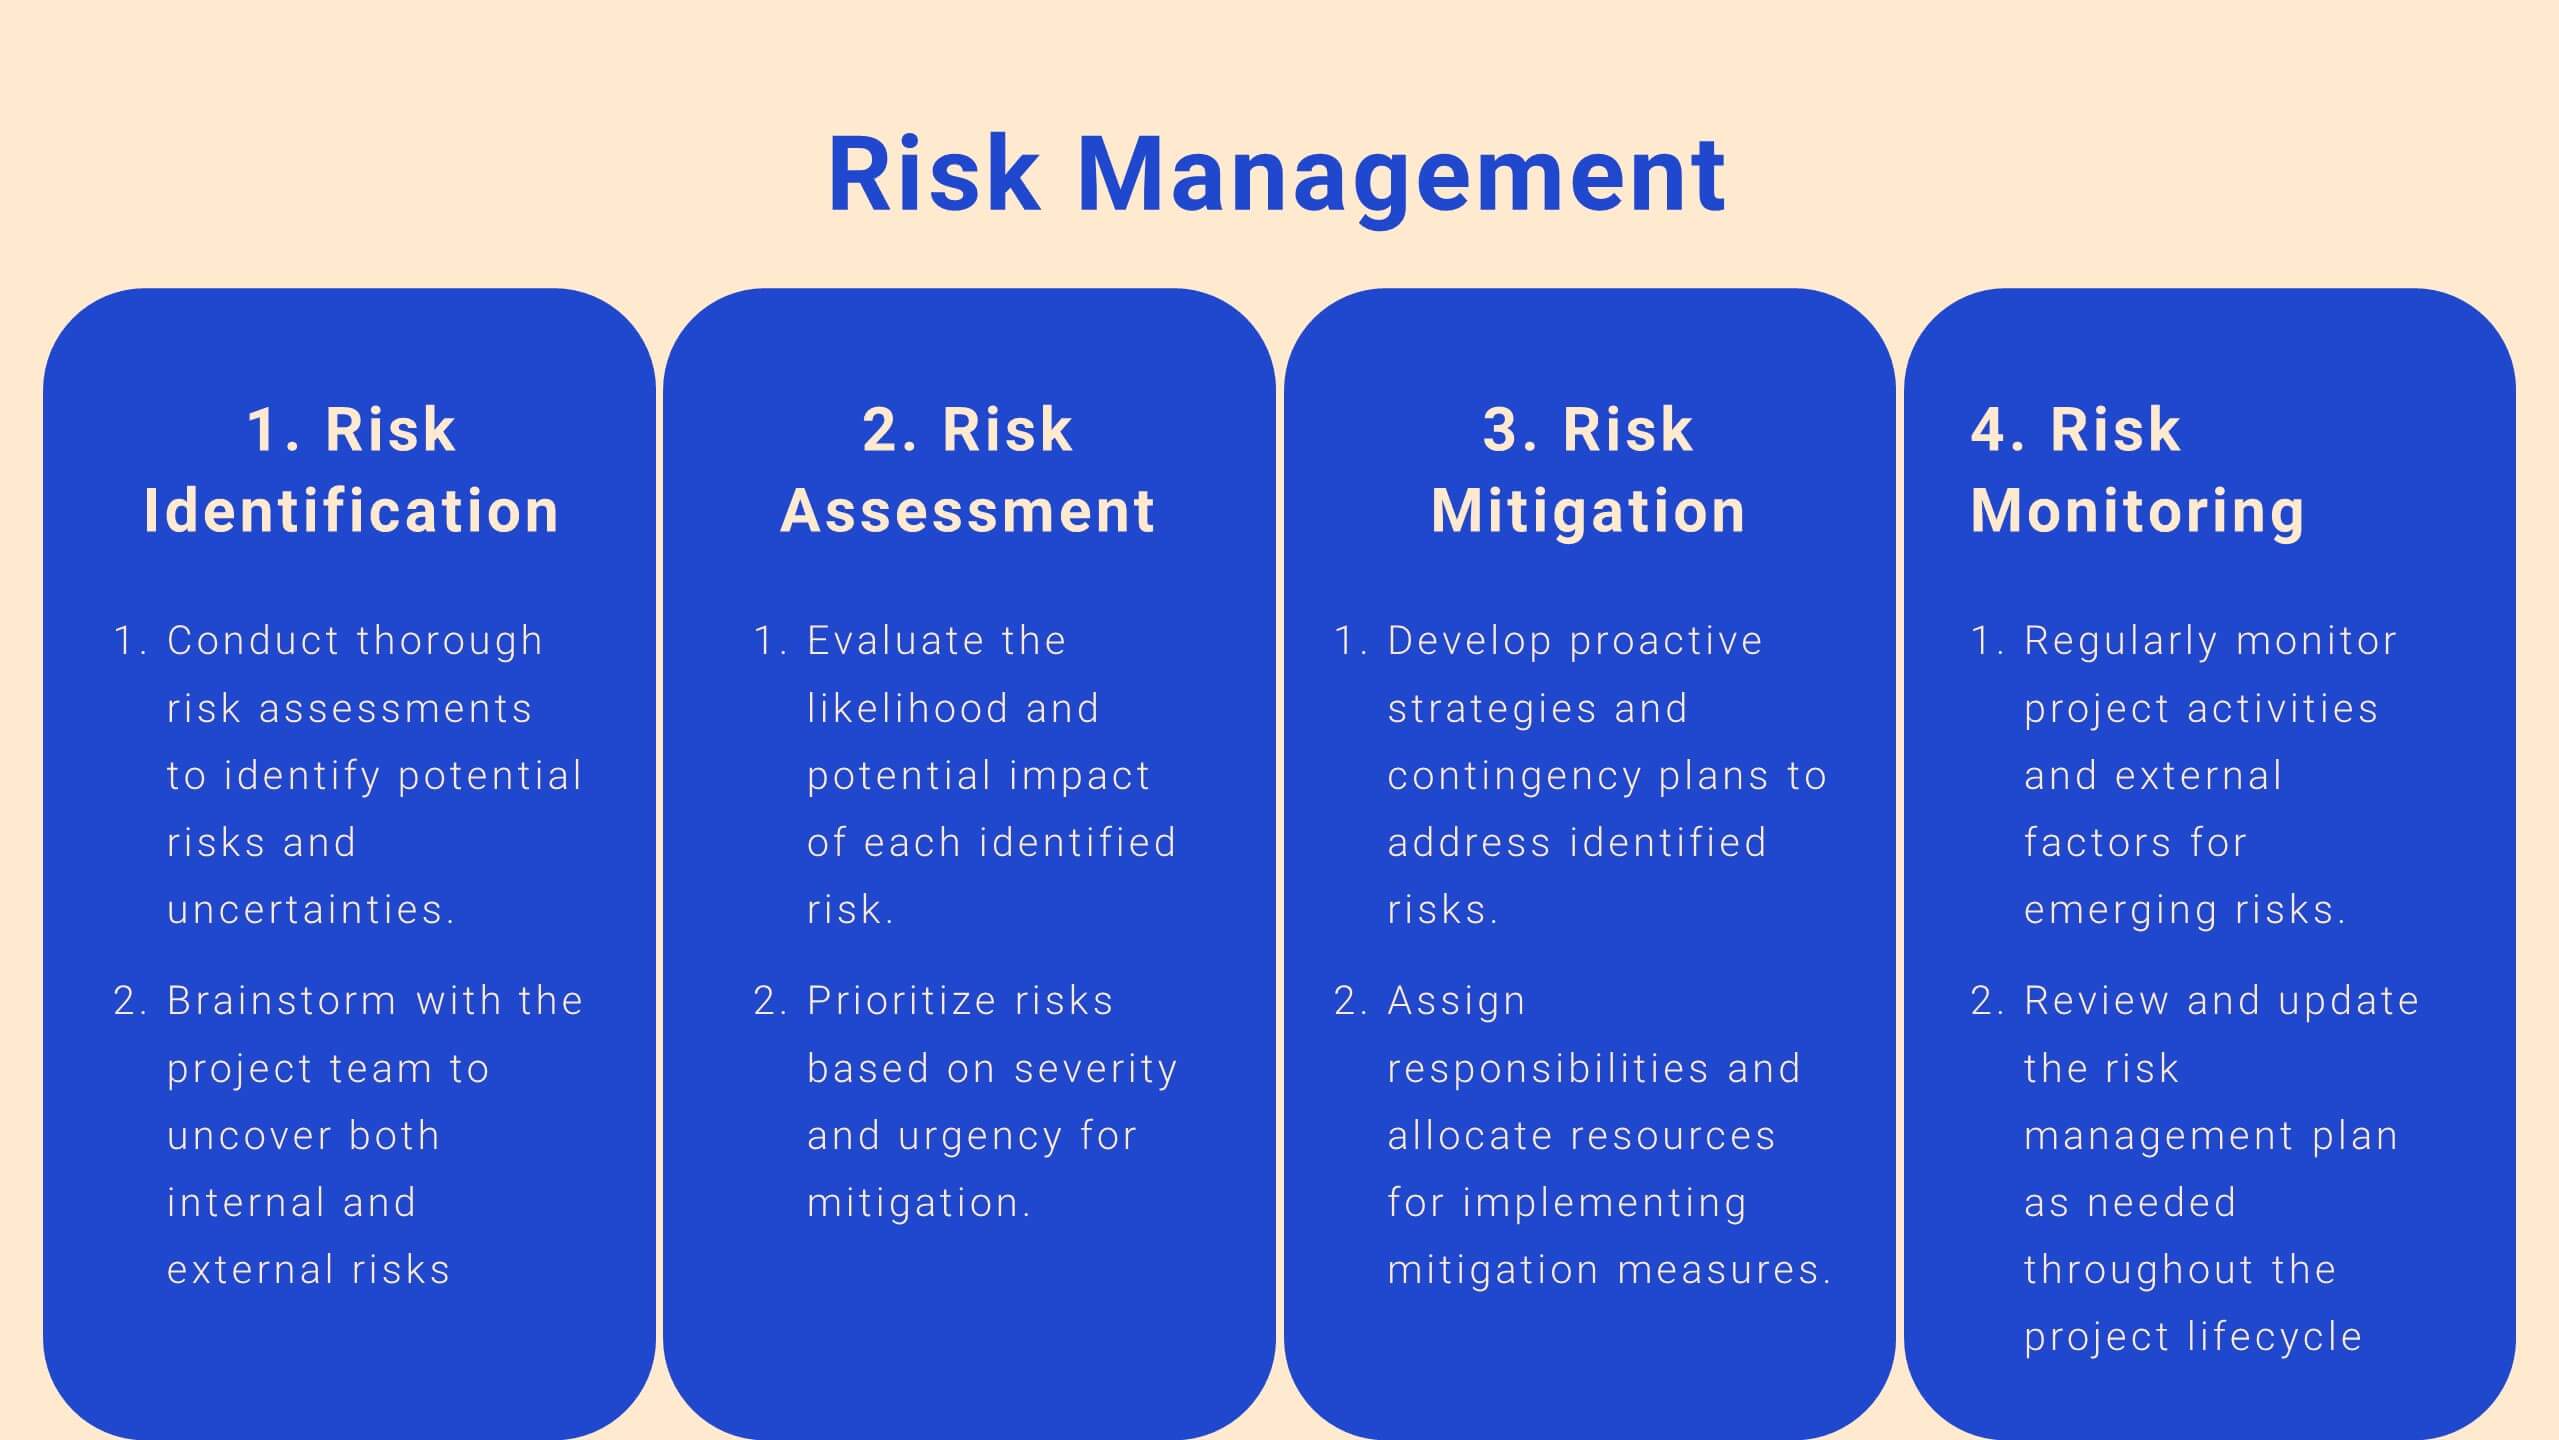
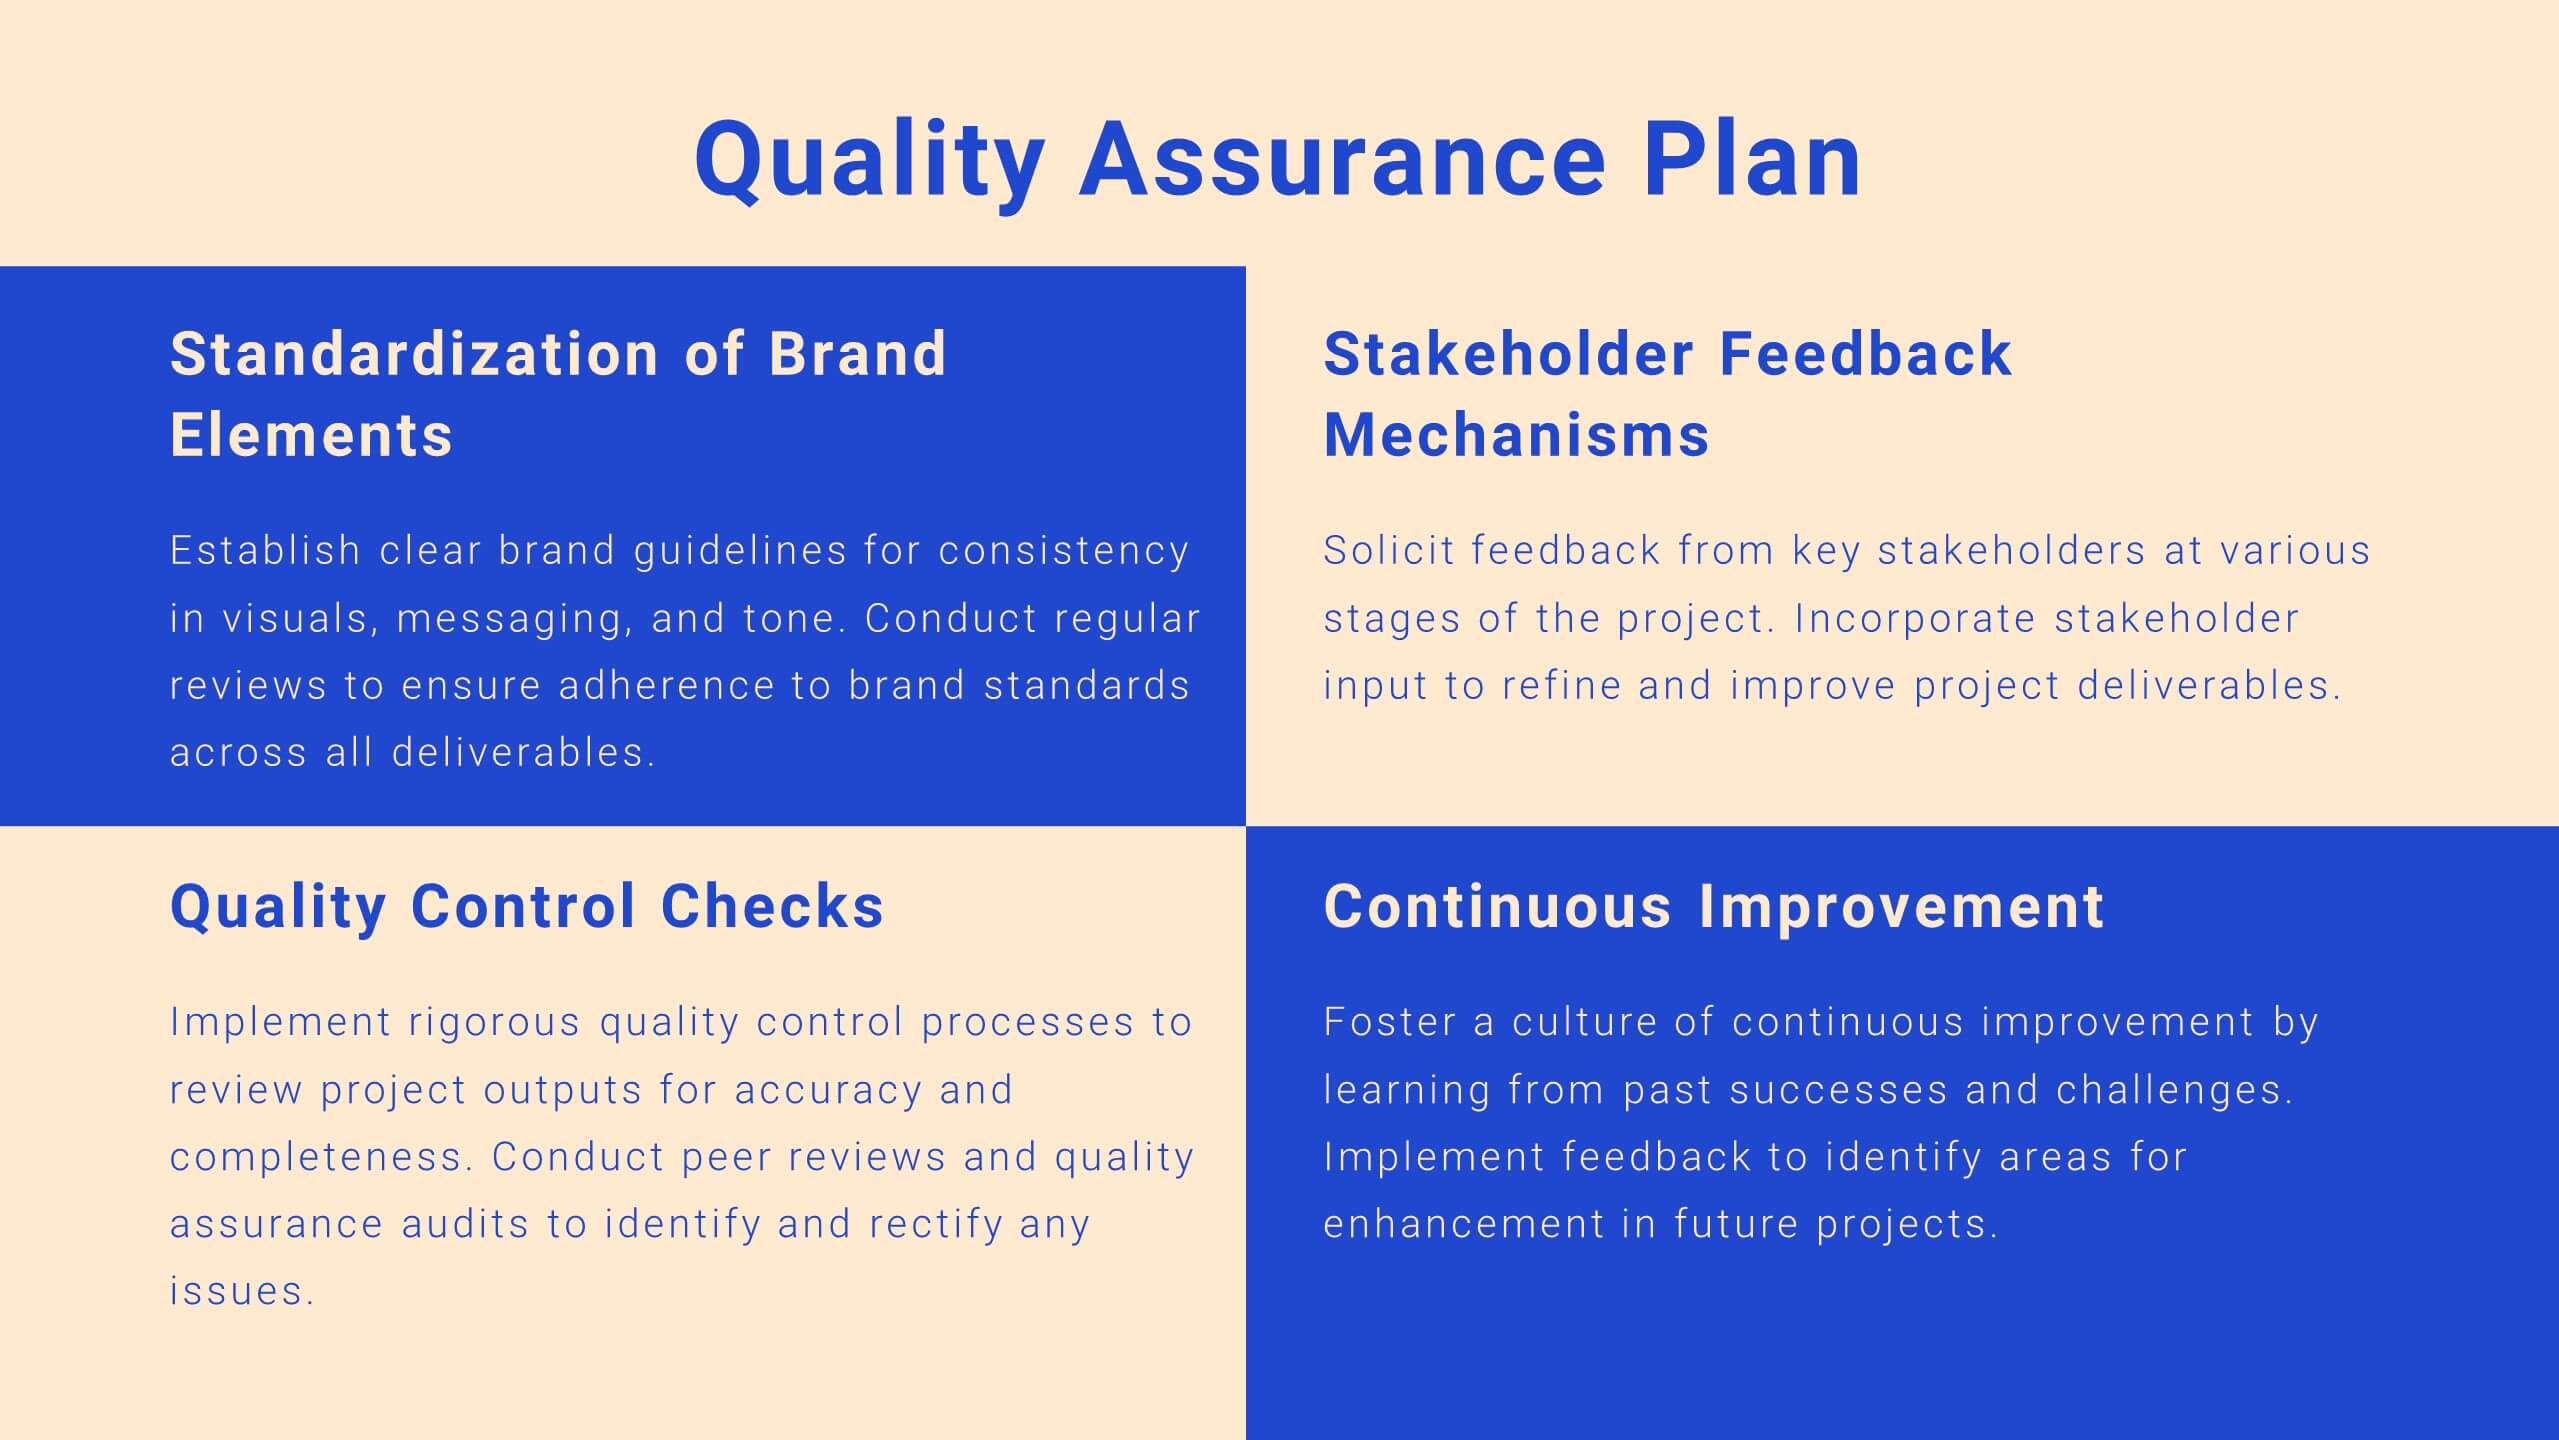
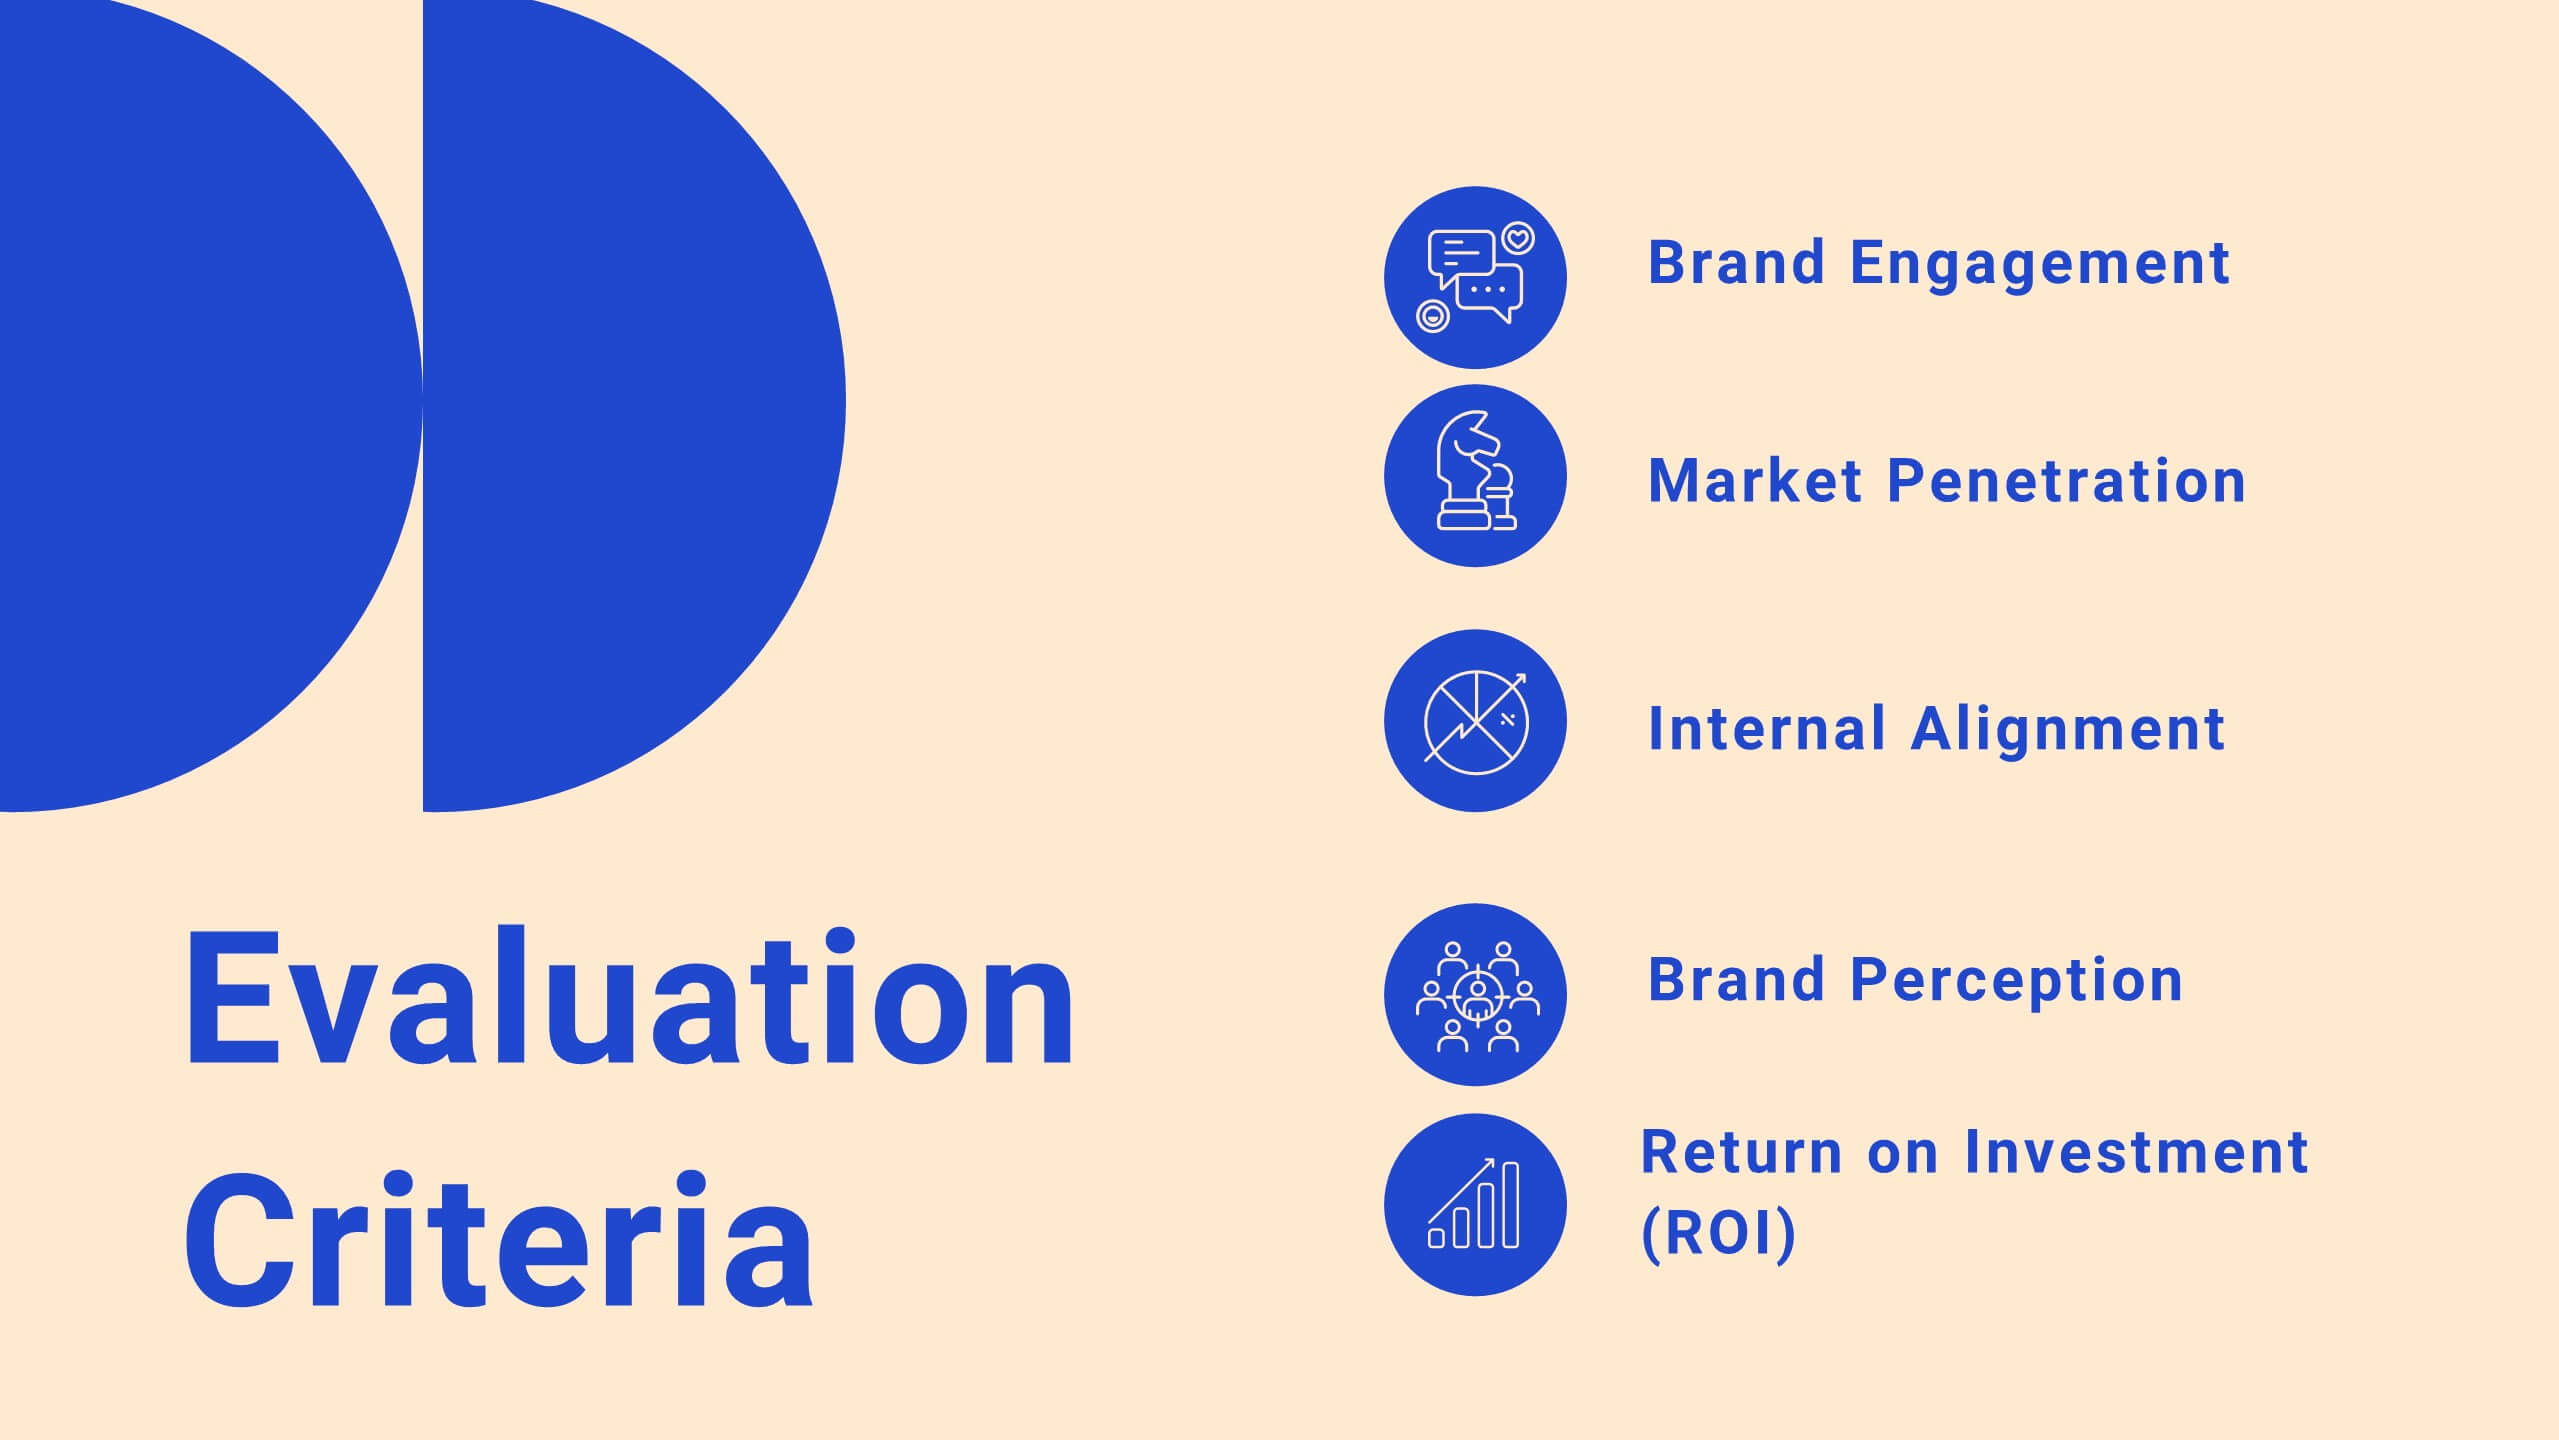
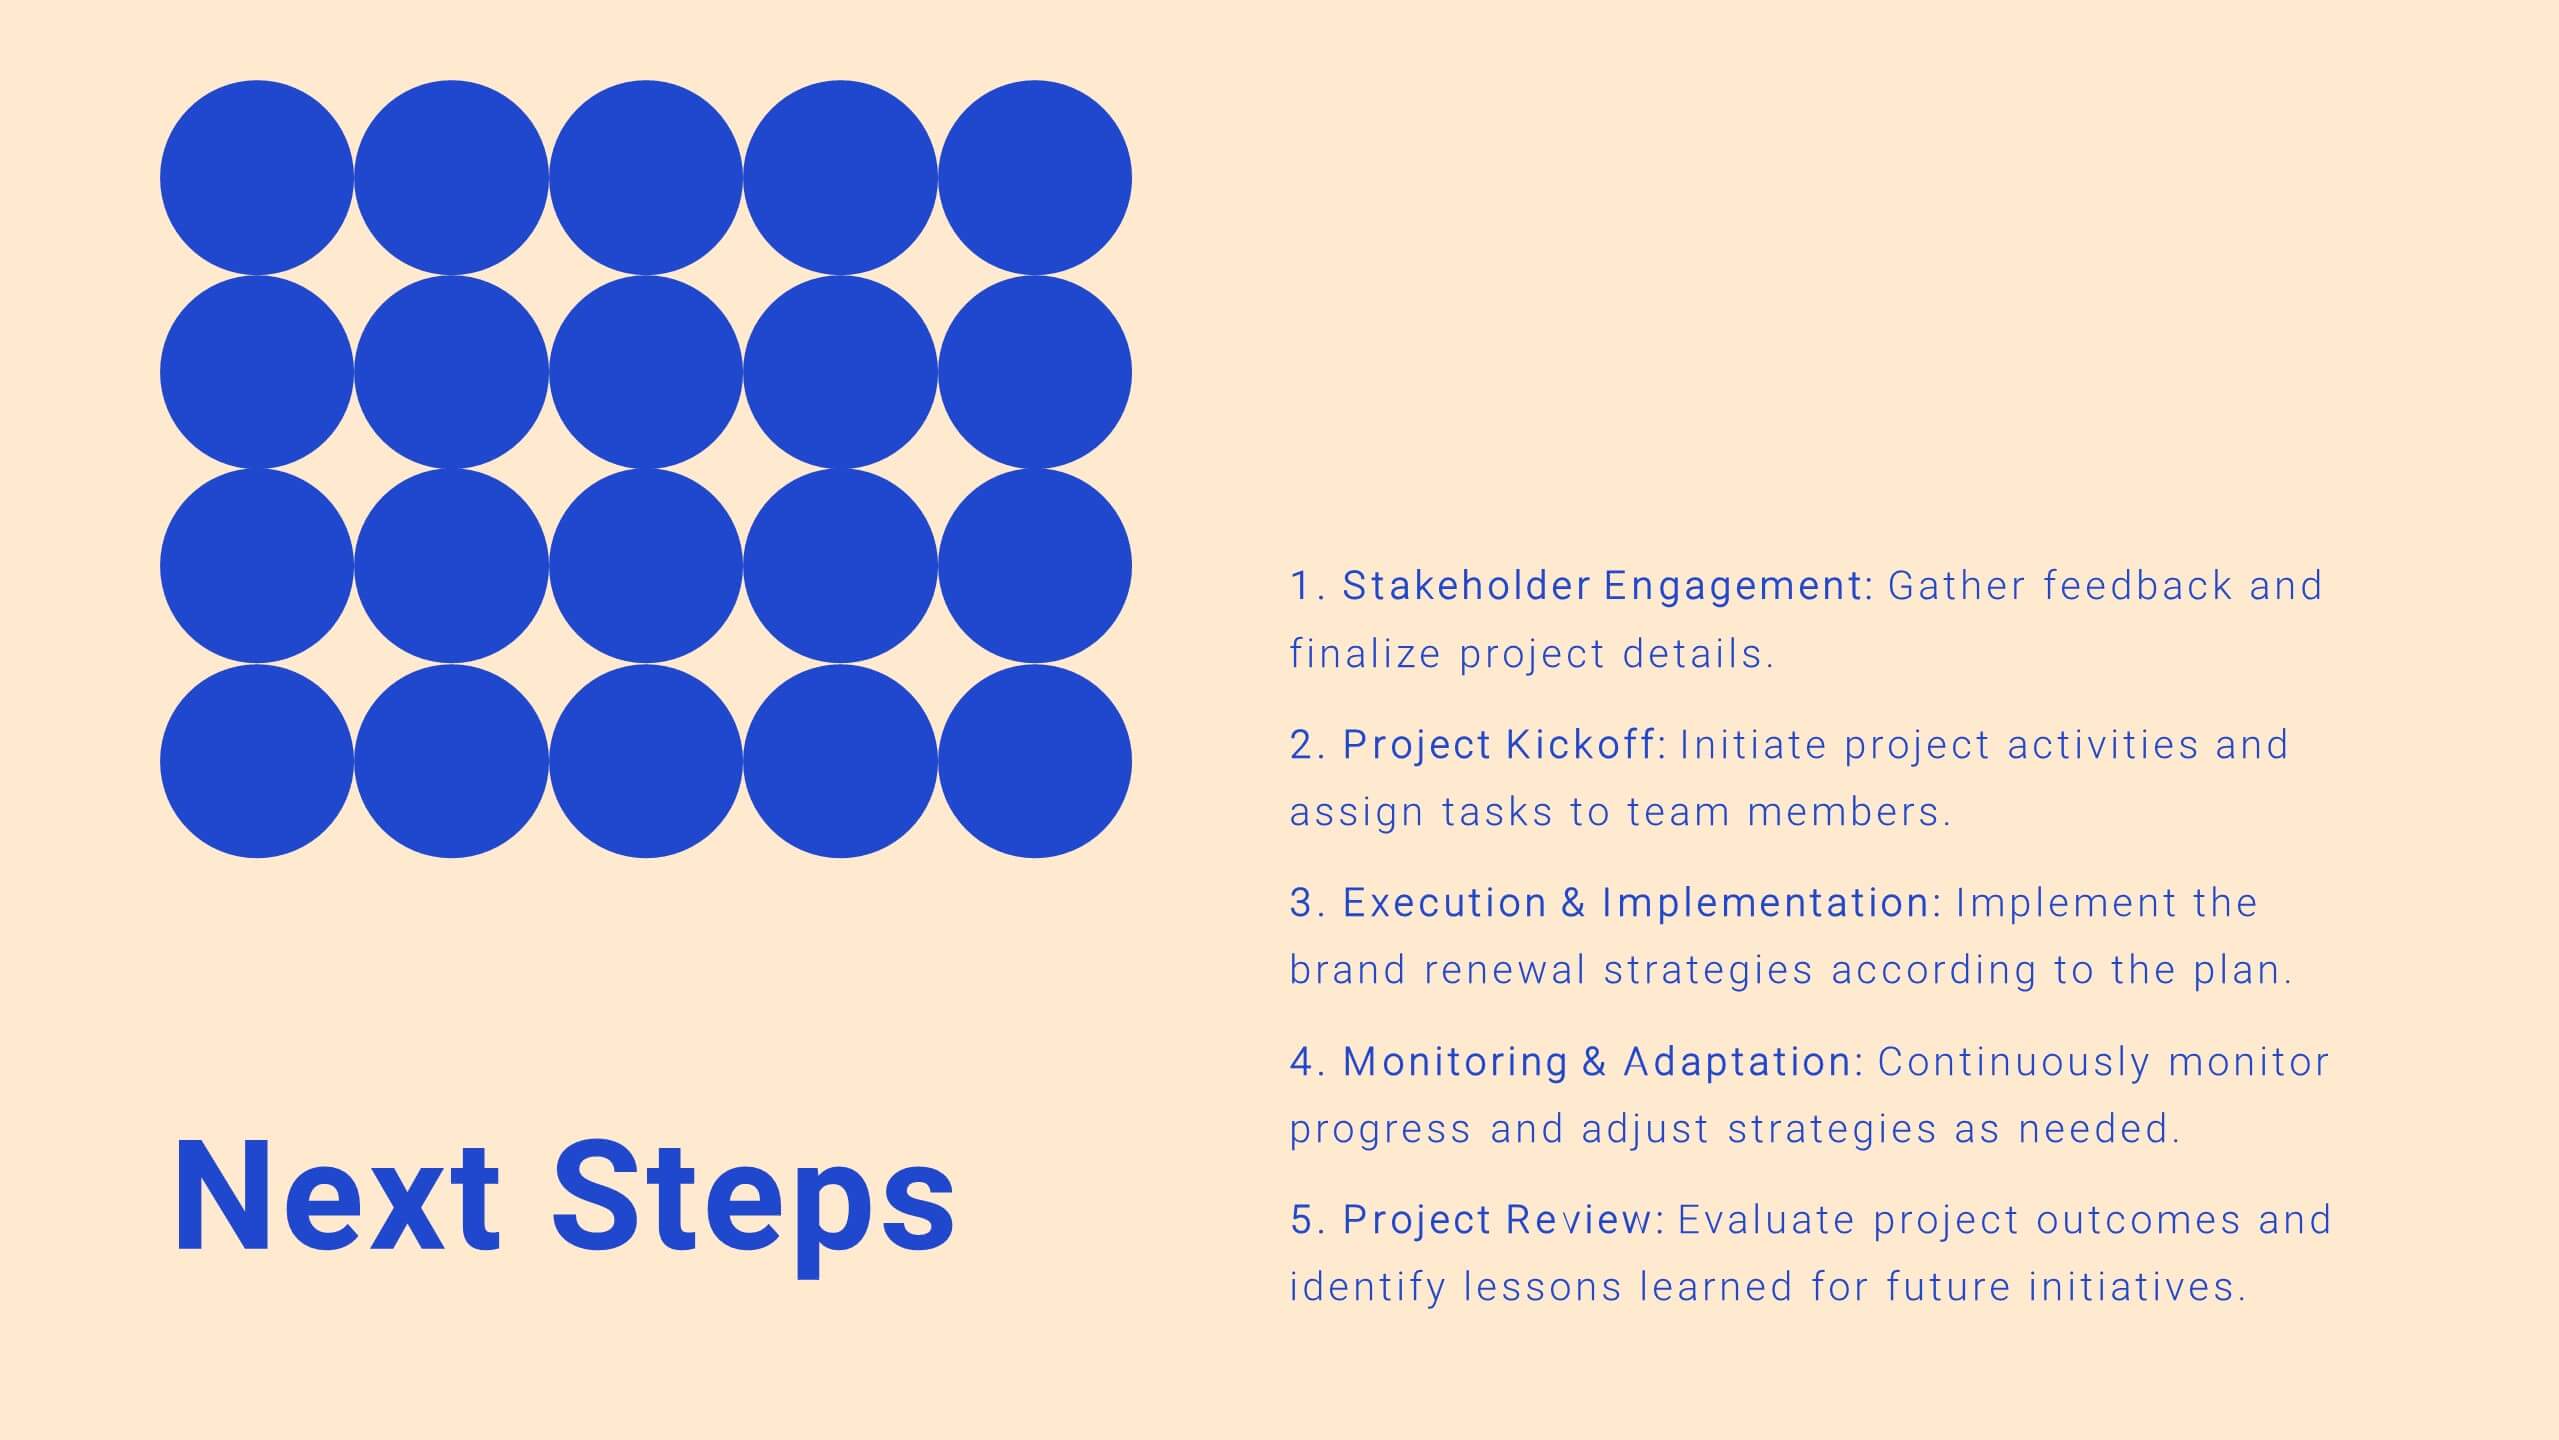
Drift Agile Project Plan Presentation
Take control of your projects with this comprehensive project plan template! From introductions to detailed objectives, this template covers scope of work, methodology, timelines, budget breakdowns, and risk management. Ideal for ensuring your project stays on track, it also includes stakeholder analysis and quality assurance plans. Compatible with PowerPoint, Keynote, and Google Slides.


4 slides
HR Workflow and Policy Overview Presentation
Streamline organizational processes with the HR Workflow and Policy Overview template. Featuring a clear flowchart design, this layout is ideal for mapping HR procedures, compliance steps, and policy implementation. Fully customizable in Canva, PowerPoint, and Google Slides to align with your company’s branding and human resources management needs.


4 slides
Asia Market Distribution Map Presentation
Highlight your business reach with the Asia Market Distribution Map Presentation. This dynamic layout features a regional color-coded map paired with labeled icons for clear segmentation by country or territory. Ideal for marketing teams, sales updates, and geographic performance reviews. Fully customizable in PowerPoint, Keynote, Google Slides, and Canva.


4 slides
Sales Performance Dashboard Report Presentation
Track progress and showcase trends with the Sales Performance Dashboard Report Presentation. This template features a clean monthly line chart to visualize product growth, alongside three metric boxes for highlighting KPIs or category performance. Ideal for quarterly recaps, revenue reporting, or product analysis. Fully editable in Canva, PowerPoint, and Google Slides.


4 slides
Data Visualization Pie Chart
Make your insights pop with this engaging Pie Chart slide. Perfect for reporting KPIs or comparing segmented data, the radial design blends clear visuals with editable text sections. Ideal for marketing, analytics, or strategy meetings. Fully customizable in PowerPoint, Keynote, and Google Slides.


22 slides
Arachne Digital Marketing Strategy Plan Presentation
Weave a powerful digital marketing strategy with this sleek, Arachne-inspired presentation! Perfect for outlining your digital marketing plans, this template helps you highlight key strategies, analytics, and campaign goals in a structured and visually engaging way. Its modern design keeps your audience focused. Compatible with PowerPoint, Keynote, and Google Slides.


7 slides
KPI Dashboard Infographic Presentation Template
A KPI (Key Performance Indicator) dashboard is a visual tool that displays important metrics and data related to a specific business or organizational goal. It allows users to track and monitor key performance indicators (KPIs) over time, making it easier to identify trends, track progress, and make data-driven decisions. This template is perfect for keeping track of important information about your business or organization. This template include a variety of charts, graphs, and tables that present information in an easy-to-understand format. Customized to track different types of data.


21 slides
Frost Design Proposal Presentation
Present your design proposal with sophistication and clarity using this elegant template! Perfect for outlining your project summary, objectives, and proposed solutions, this template covers everything from scope of work and budget breakdowns to deliverables and team expertise. Fully compatible with PowerPoint, Keynote, and Google Slides, it's designed for seamless, professional presentations.


7 slides
Business Strategy Infographic Presentation Template
A business strategy is a detailed plan that lays your goals, accomplishments and direction for the whole organization. A strategic plan will bring stability to your business and make it more profitable. This template can be used to inform your business on how essential a business strategy is. With this template, your business will learn that creating a strategy will help gain a better understanding of their organization's current strengths and weaknesses. This template is easy to use, includes helpful illustrations and allows you to add tips for managing your business more effectively.


6 slides
Career Objective Infographic
Objective slides help communicate goals, aims, and purpose of the presentation to the audience. This infographic template is a visual representation that communicates your career goals, aspirations, and the value you bring to potential employers. This template serves as a roadmap for your presentation, helping both you and your audience understand the purpose and direction of your objective. Compatible with Powerpoint, Keynote, and Google Slides. This showcases your career objectives and key qualifications. Use a design that reflects your industry and personal brand while conveying your career objectives effectively.


7 slides
Data Analysis Infographics Presentation Template
Data Analysis is a process used to turn raw data into information useful for decision making by users. Data that has been collected, is analyzed to answer questions, or disprove theories. Analyses include tasks such as statistical modeling and hypothesis testing. This template can be used to collect data via surveys or experiments. It is a great tool for those conducting research and analyzing data. This template allows you to create an efficient and organized data collection process using multiple methods of data collection. Graphs and statistics are available to help visualize your data.


21 slides
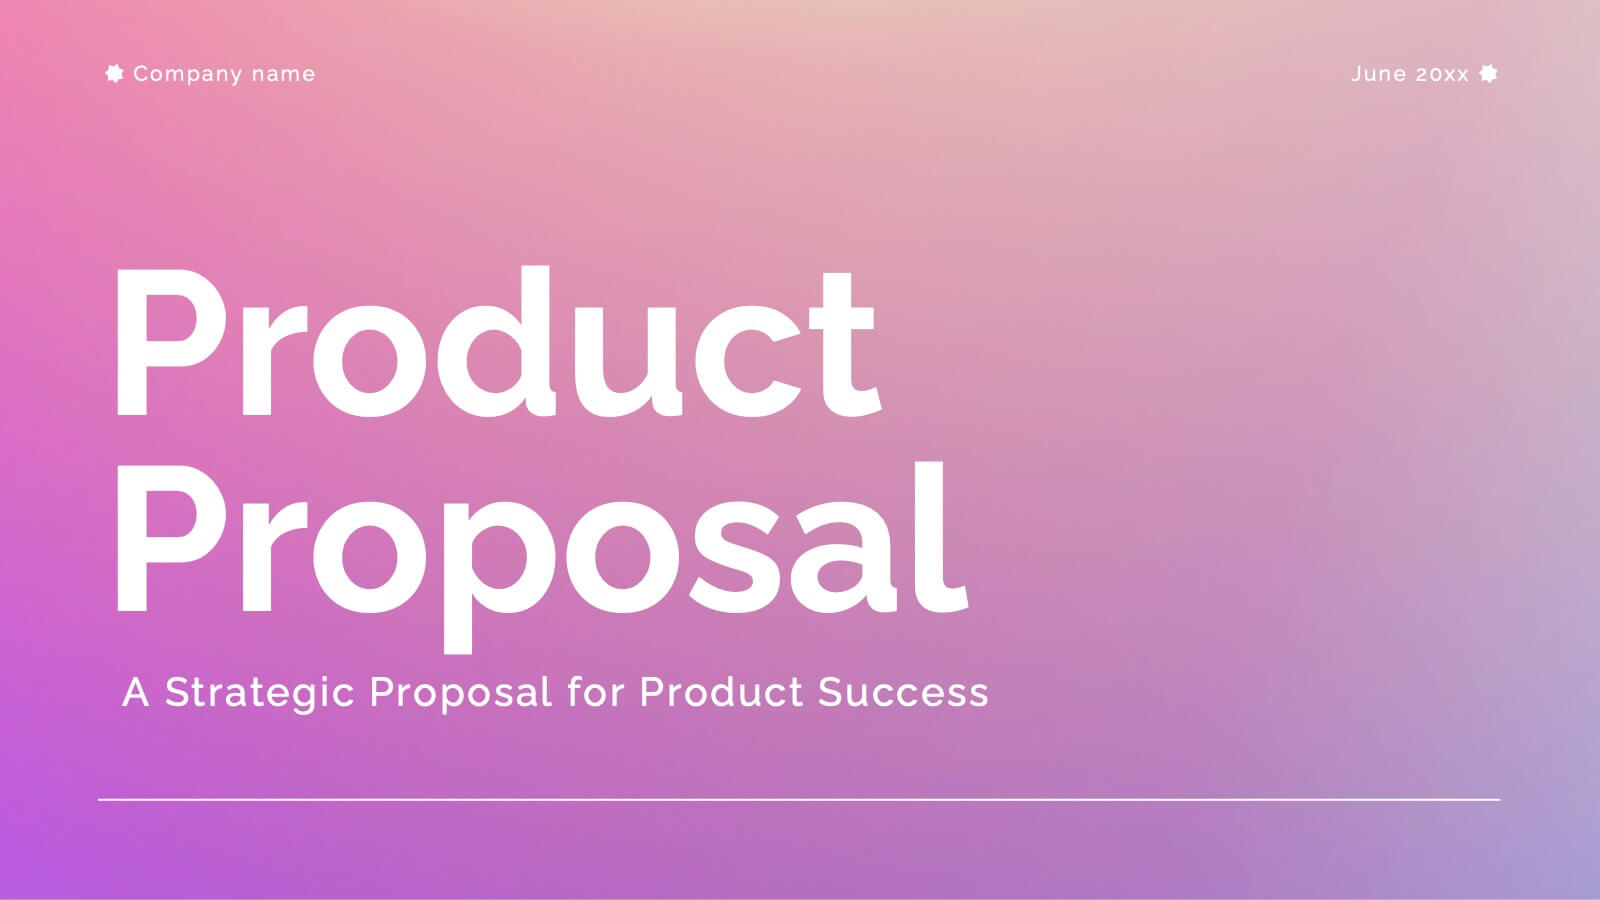
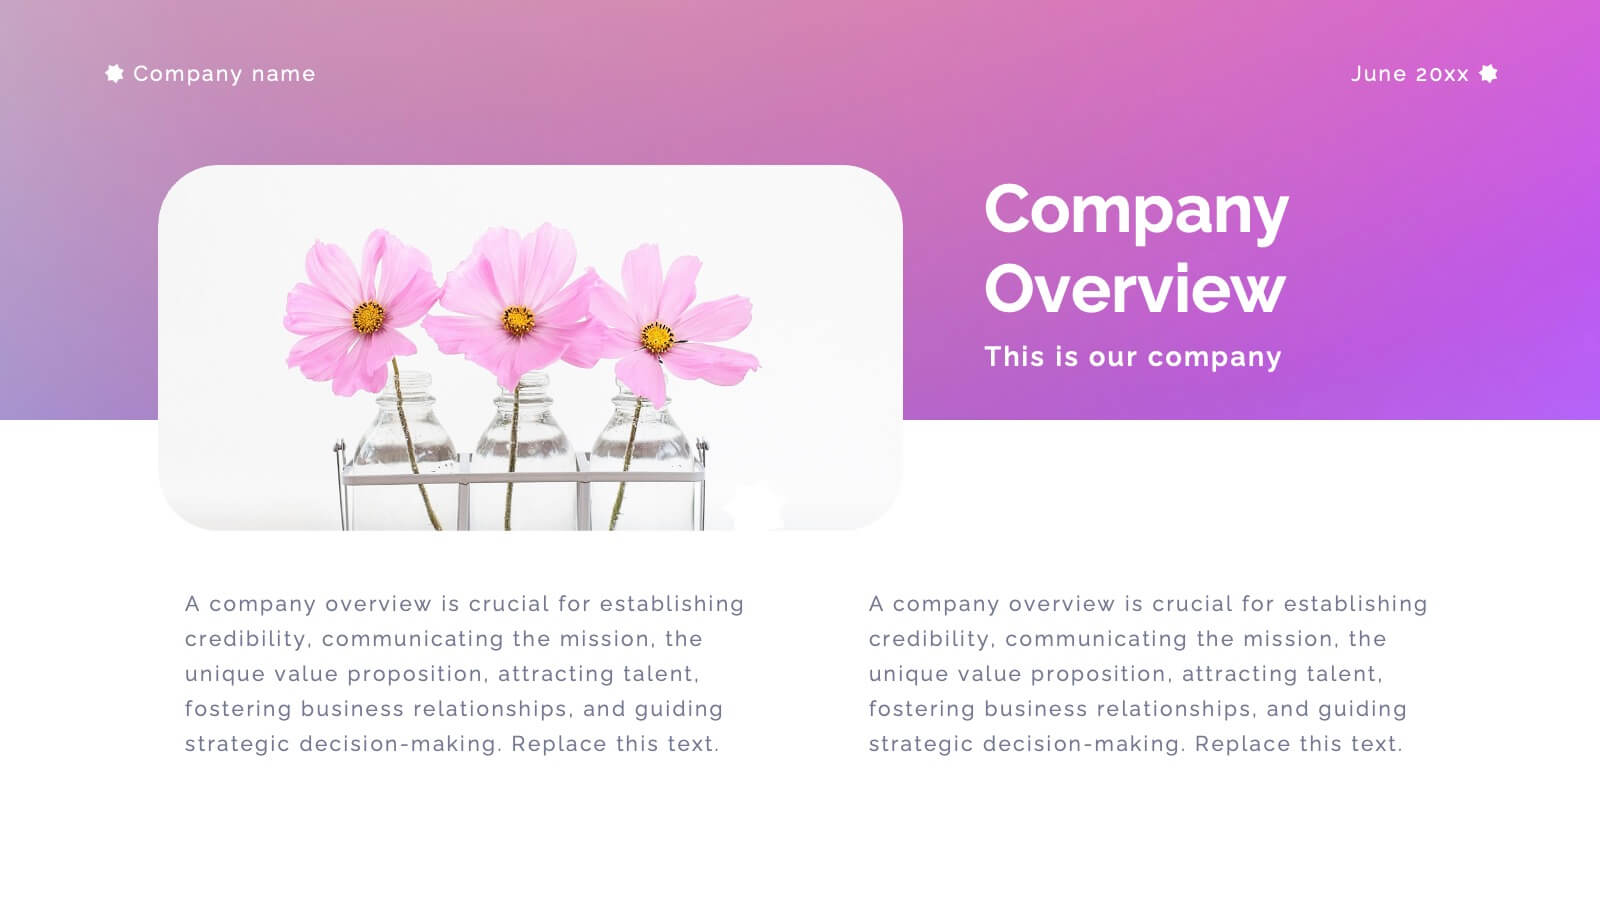
Aventurine New Product Proposal Presentation
Showcase your product in style with this vibrant and modern product proposal template! It covers everything from product features to target market, pricing strategy, and marketing plans. Designed for clarity and impact, it's perfect for pitching your product. Fully customizable, and compatible with PowerPoint, Keynote, and Google Slides for seamless presentations.


4 slides
Business Strategy Alternatives Presentation
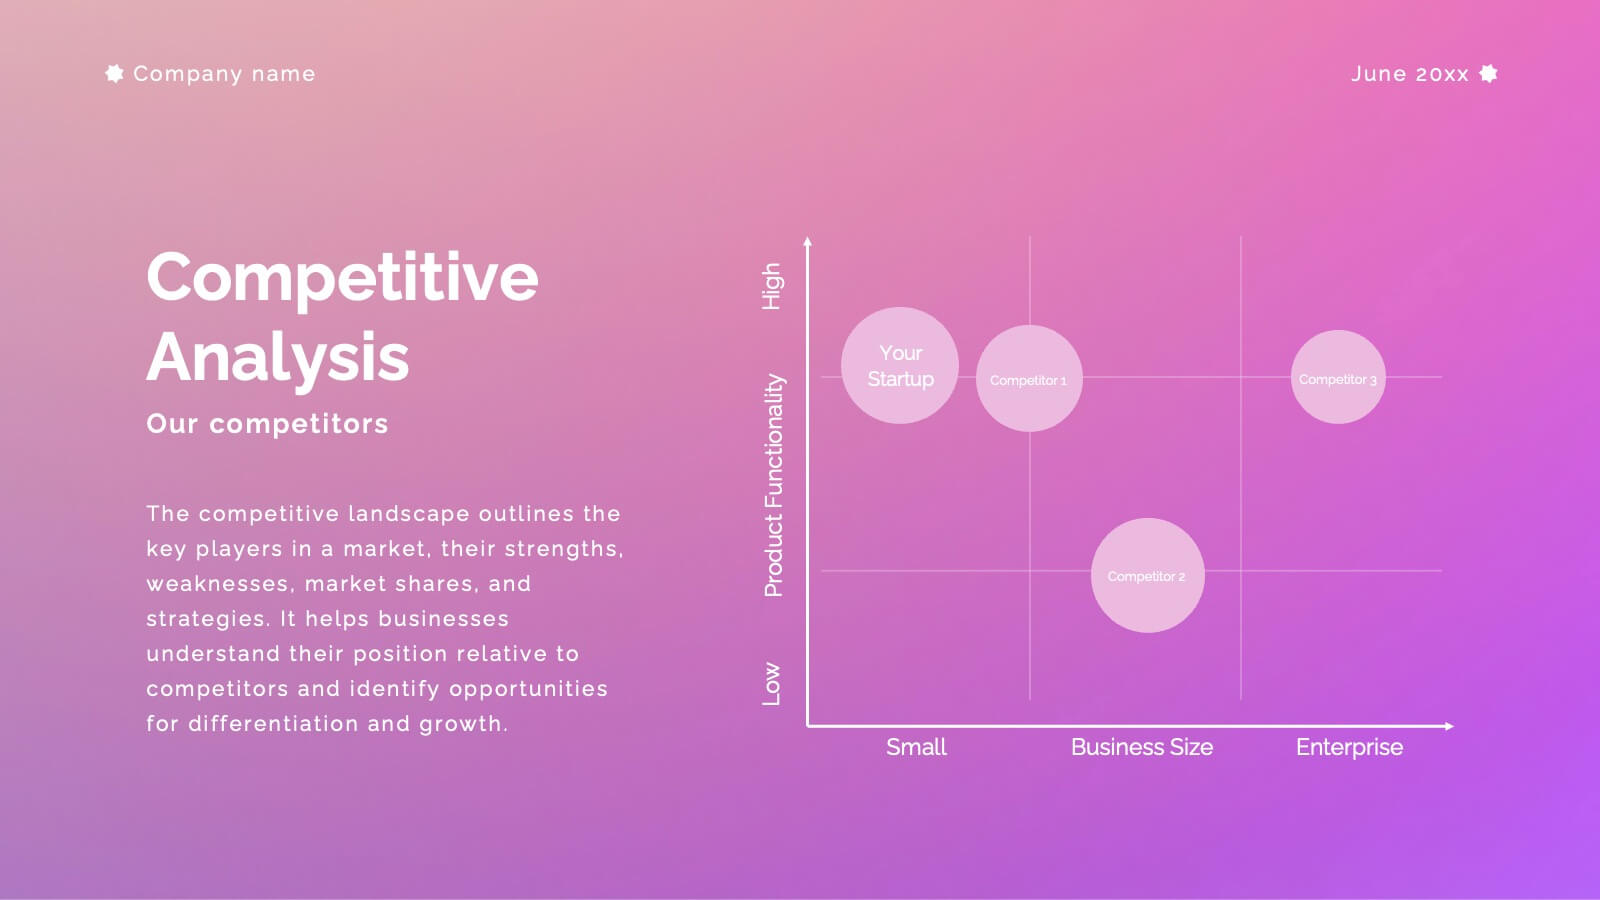
Present and compare strategic choices effectively with the Business Strategy Alternatives Presentation template. Designed to highlight key decision points, competitive advantages, and alternative approaches, this slide is ideal for business strategy discussions, market positioning, and executive planning. Fully customizable for PowerPoint, Keynote, and Google Slides to fit your presentation needs.


21 slides
Frostwind Financial Report Presentation
Deliver a comprehensive financial report with the Frostwind Financial Report Presentation. This sleek and modern template is designed to captivate your audience while showcasing essential business metrics and insights. With dedicated sections for key highlights, financial summaries, performance metrics, and operational updates, this presentation ensures clarity and professionalism. Dive deeper into customer feedback, market trends analysis, and competitive insights to provide a well-rounded view of your organization's performance. Showcase strategic initiatives, goals review, and next week's priorities with visually engaging charts and graphics. The inclusion of a Q&A and recommendations for improvement slide allows for seamless interaction with your audience. Perfect for corporate meetings, annual reviews, and financial updates, this template is fully customizable to suit your branding. Compatible with PowerPoint, Google Slides, and Keynote, it offers versatility and ease of use, ensuring you leave a lasting impression. Take your financial reporting to the next level!