


Features
- 7 Unique slides
- Fully editable and easy to edit in Microsoft Powerpoint, Keynote and Google Slides
- 16:9 widescreen layout
- Clean and professional designs
- Export to JPG, PDF or send by email


Do you have any questions?
Recommend


10 slides
Key Business Insights Executive Summary Presentation
Showcase your strategic insights effectively with the 'Key Business Insights Executive Summary' template. This visually appealing tool highlights critical data points and metrics, enabling a clear presentation of business achievements and forecasts. Perfectly tailored for use in PowerPoint, Keynote, and Google Slides, it ensures your executive summaries are both comprehensive and compelling.


6 slides
Business Case Studies Analysis Presentation
Turn insights into impact with this clean and professional layout designed to showcase real-world business challenges and results. Perfect for summarizing objectives, methods, and key outcomes, it helps you tell a clear and compelling story. Fully compatible with PowerPoint, Keynote, and Google Slides for easy customization and presentation.


4 slides
AI Trends and Use Cases Presentation
Step into the future with a clean, modern layout that makes complex technology easy to grasp and exciting to explore. This presentation helps you break down emerging innovations, real-world applications, and industry opportunities using clear visuals and structured sections. Fully customizable and compatible with PowerPoint, Keynote, and Google Slides.


7 slides
Project Introduction Infographic
Effortlessly introduce your projects with our collection of project introduction slide templates, tailored for clear and effective communication. These templates are ideal for providing an overview of project goals, scopes, and deliverables, ensuring all key points are conveyed to stakeholders efficiently. Each template features a modern design, incorporating sleek graphics and bold text to highlight critical information, making them perfect for kickoff meetings, client presentations, or internal reviews. The layouts are carefully structured to guide the audience through the introduction process, including the presentation of team members, project timelines, and expected outcomes. Fully customizable to fit your specific project needs, these templates allow you to modify colors, fonts, and imagery to align with your brand identity and project requirements. Utilize these professionally designed slides to make a compelling case for your project, engaging your audience right from the start.


10 slides
4-Quadrant Responsibility Chart Presentation
Bring your message to life with a slide that feels bold, modern, and instantly engaging. This presentation helps you outline four key responsibilities or categories in a clean quadrant layout, making complex information easy to follow and visually compelling. It’s perfect for strategy, workflow, or team-based insights. Fully compatible with PowerPoint, Keynote, and Google Slides.


9 slides
Sales Pitch Proposal Presentation
Win over your prospects with our Sales Pitch Proposal presentation template, crafted to highlight the strengths of your product or service compellingly and convincingly. The template opens with a bold title slide, immediately capturing attention, followed by a well-organized agenda that outlines the flow of your pitch. Dive into the 'Problem' slide to articulate the challenges your target audience faces, followed by the 'Solution - Steps' slide where you can break down how your offering addresses these challenges in phases. Showcase the 'Key Features' of your product, highlighting the unique benefits that set you apart from the competition. The 'Target Audience' slide allows you to visually represent the demographics of your ideal customer, making your proposal more relatable. The 'Pricing' slide is neatly designed for a clear display of your pricing tiers, ensuring transparency. Conclude with a 'Thank You' slide that leaves a lasting impression and a 'Credits' slide for due diligence. This template is adaptable for PowerPoint, Keynote, and Google Slides, ensuring a seamless presentation experience.


5 slides
Brief Overview of Key Insights Presentation
Present essential information at a glance with this Brief Overview of Key Insights slide. Designed around a bold key graphic, this layout highlights up to four major takeaways with icons and concise descriptions. Ideal for summaries, analysis highlights, or recommendations. Fully editable in Canva, PowerPoint, or Google Slides.


6 slides
Company Profile Growth Infographic
The collection of templates presented offers a valuable resource for businesses aiming to articulate their growth and current market standing comprehensively. These templates are designed to deliver essential information through a well-structured and visually appealing format, ideal for engaging stakeholders effectively. Each design is tailored to showcase various aspects of company progress, including detailed financial growth, strategic direction, and key achievements. Features such as timelines, growth charts, and key performance indicators are seamlessly integrated, providing a clear snapshot of the company's journey and ambitions. The templates are adaptable to various corporate needs, making them suitable for annual reports, investor presentations, and internal reviews across different industries. The chosen color schemes and layouts ensure that information is presented clearly and attractively, enhancing readability and projecting a professional corporate image. By facilitating customization to reflect the unique characteristics of any business, these templates serve as indispensable tools for companies eager to communicate their success stories and future prospects in a compelling manner.


4 slides
Environmental Sustainability Best Practices Presentation
Promote eco-friendly initiatives with the Environmental Sustainability Best Practices Presentation template. This clean and modern slide deck is designed to highlight sustainable business strategies, green initiatives, and environmental impact assessments. Featuring an intuitive layout with clearly defined sections, this fully editable design is ideal for corporate sustainability leaders, educators, and environmental advocates. Compatible with PowerPoint, Keynote, and Google Slides for seamless customization and presentation.


10 slides
Conceptual Mind Map for Projects
Illuminate your strategy with the Conceptual Mind Map for Projects Presentation. Designed in the shape of a lightbulb, this diagram visually connects five key project concepts to a central idea, perfect for presenting innovation, team workflows, or business planning. Easily editable in PowerPoint, Keynote, or Google Slides to suit any industry or audience.


4 slides
Professional Team Member Slides Presentation
Meet your team in a fresh, dynamic way with a layout that highlights personalities, roles, and key contributions at a glance. This presentation helps introduce members clearly, supporting stronger collaboration and professional communication across any project. Fully customizable and compatible with PowerPoint, Keynote, and Google Slides.


7 slides
Executive Summary Format Infographic
Concisely communicate your organization's high-level insights with our Executive Summary Infographic, perfect for business reports and strategic presentations. This infographic is a vital tool for executives, managers, and business analysts to encapsulate key information. Our Executive Summary Infographic offers a visually engaging layout that summarizes complex data into digestible segments. It includes sections for financial highlights, performance metrics, strategic goals, and key achievements. With its customizable features, you can tailor the infographic to represent organizational successes, growth percentages, target completions, and forecasted trends. This SEO-optimized infographic ensures that your executive insights capture the attention of stakeholders and team members alike. Incorporate our infographic into your business documentation to provide a snapshot of your company's performance and strategic direction efficiently.


20 slides
Dreamspire Academic Research Report Presentation
Present your research findings with impact using this bold and dynamic report template! It includes essential sections such as objectives, methodology, key findings, and future research directions, ensuring a comprehensive overview. Perfect for academic, business, or industry research presentations, this template is fully compatible with PowerPoint, Keynote, and Google Slides.


24 slides
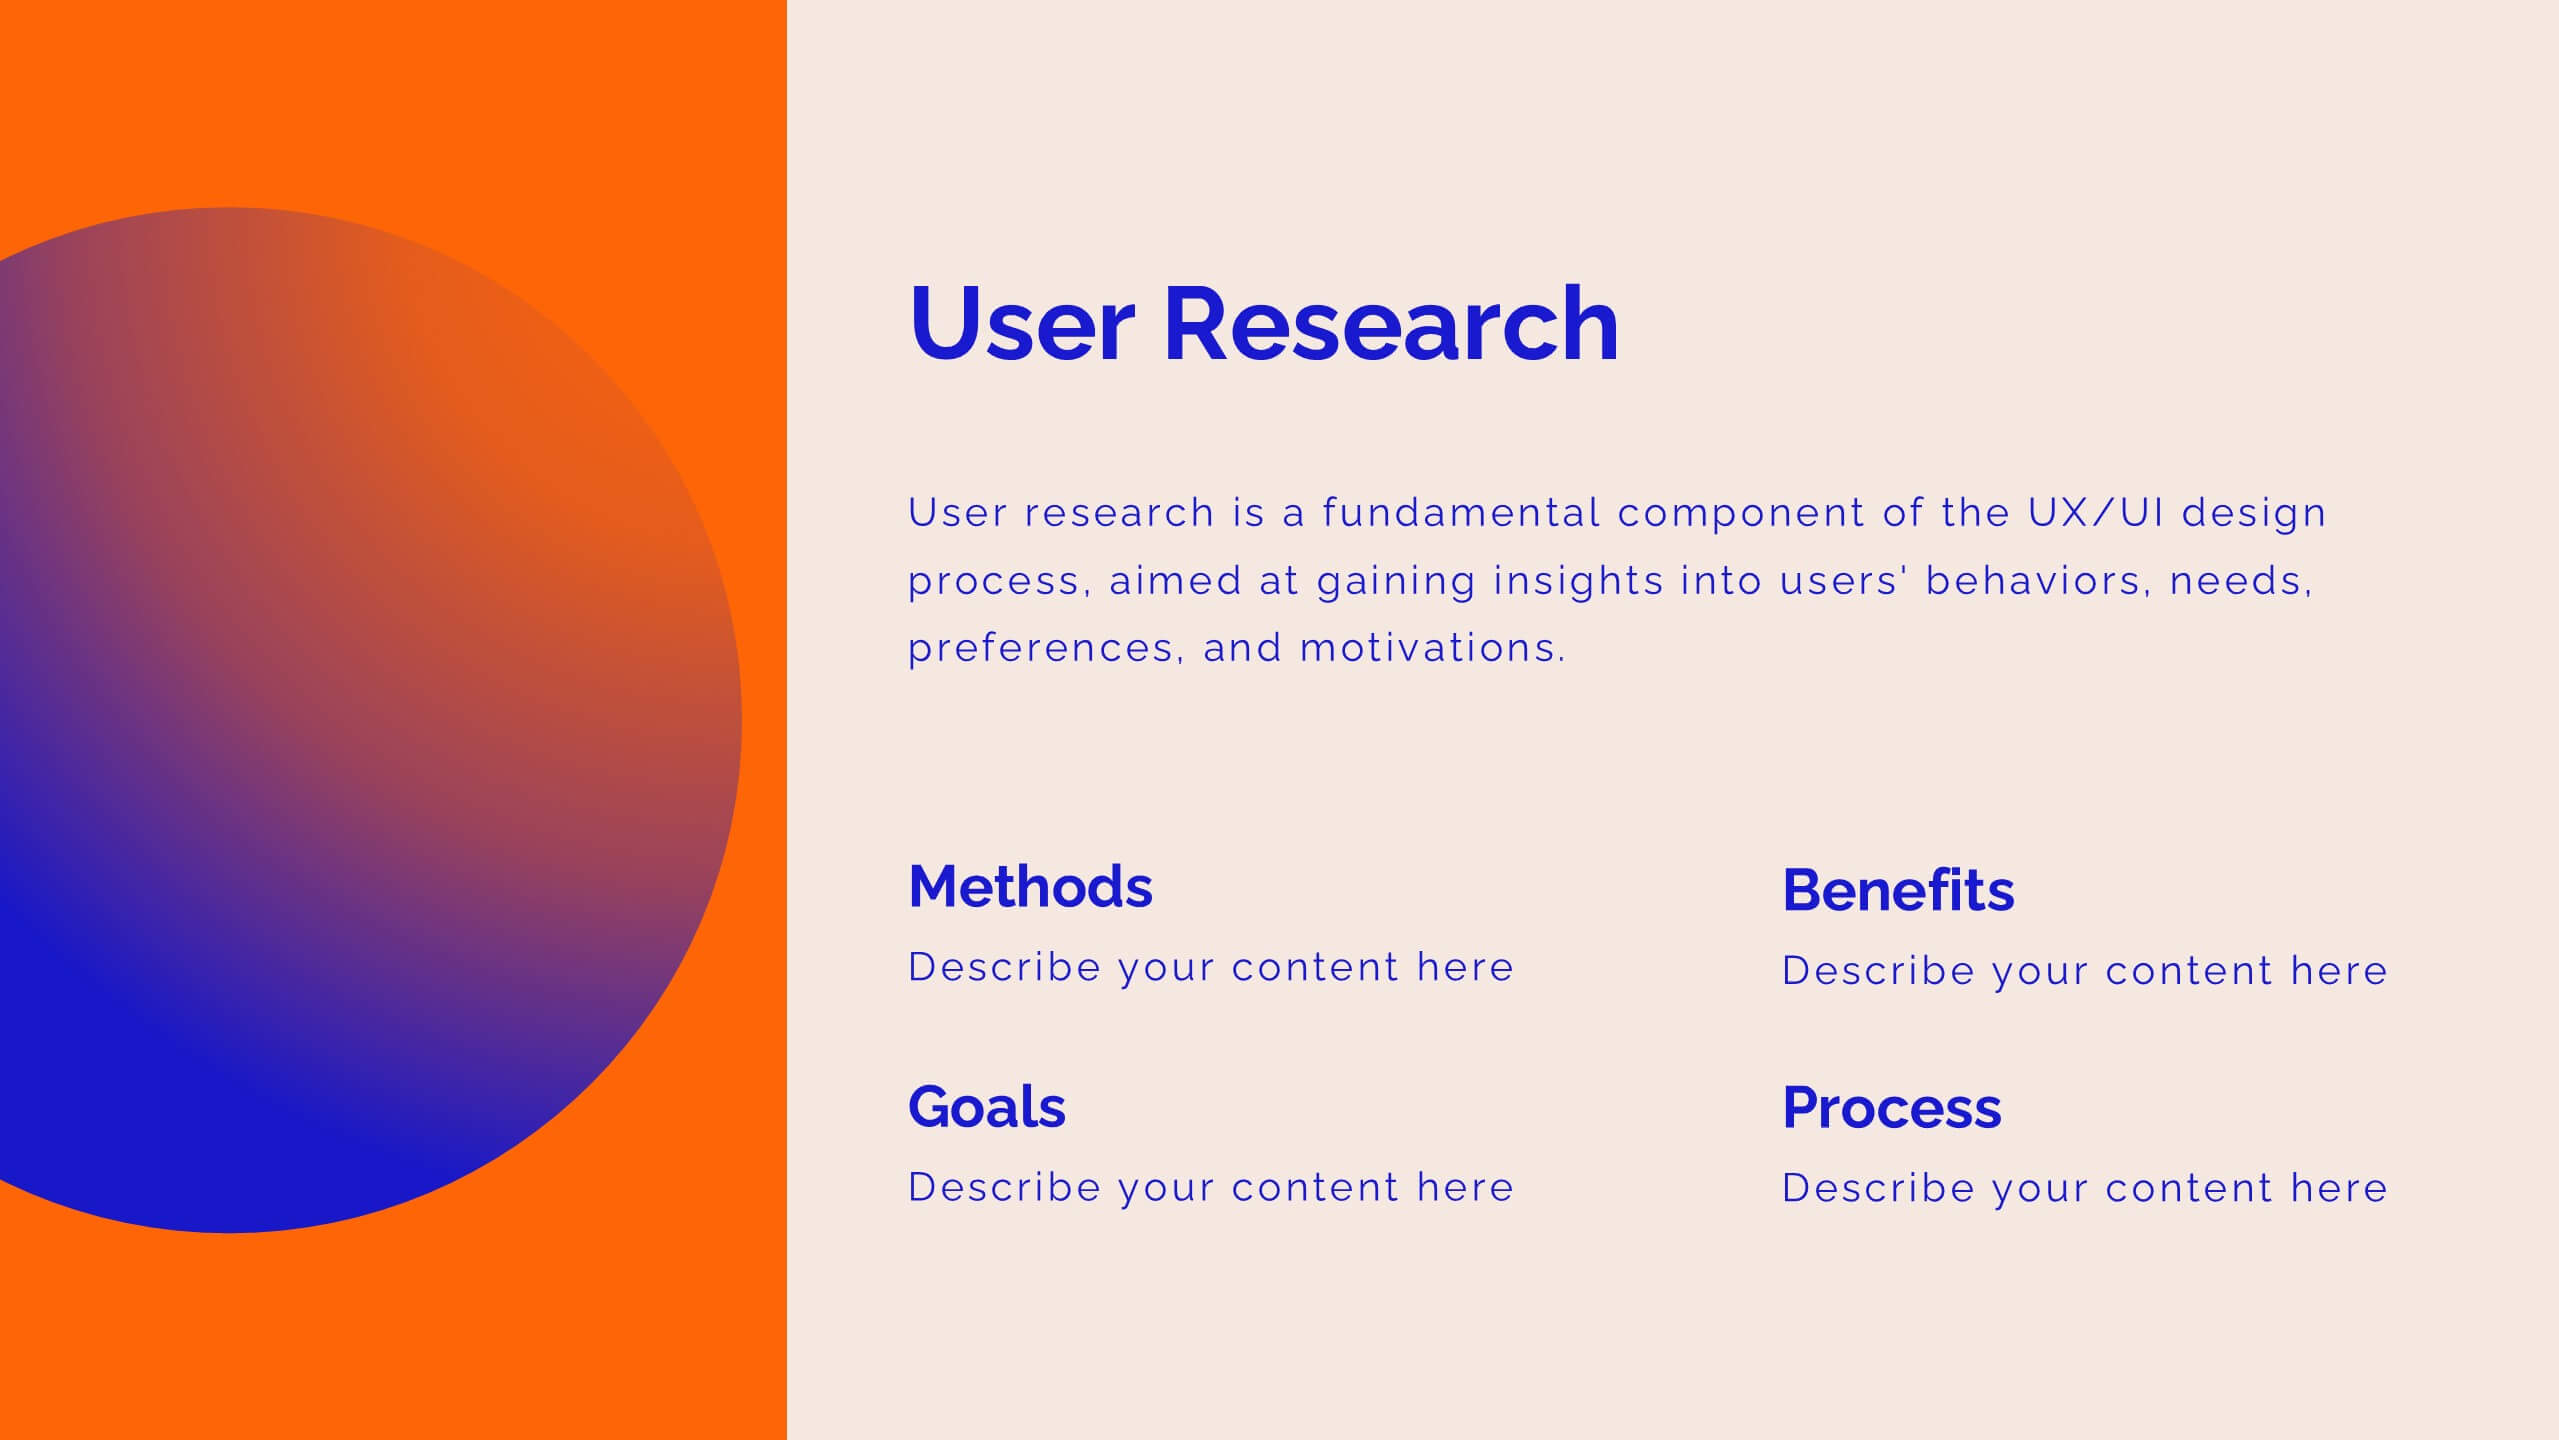
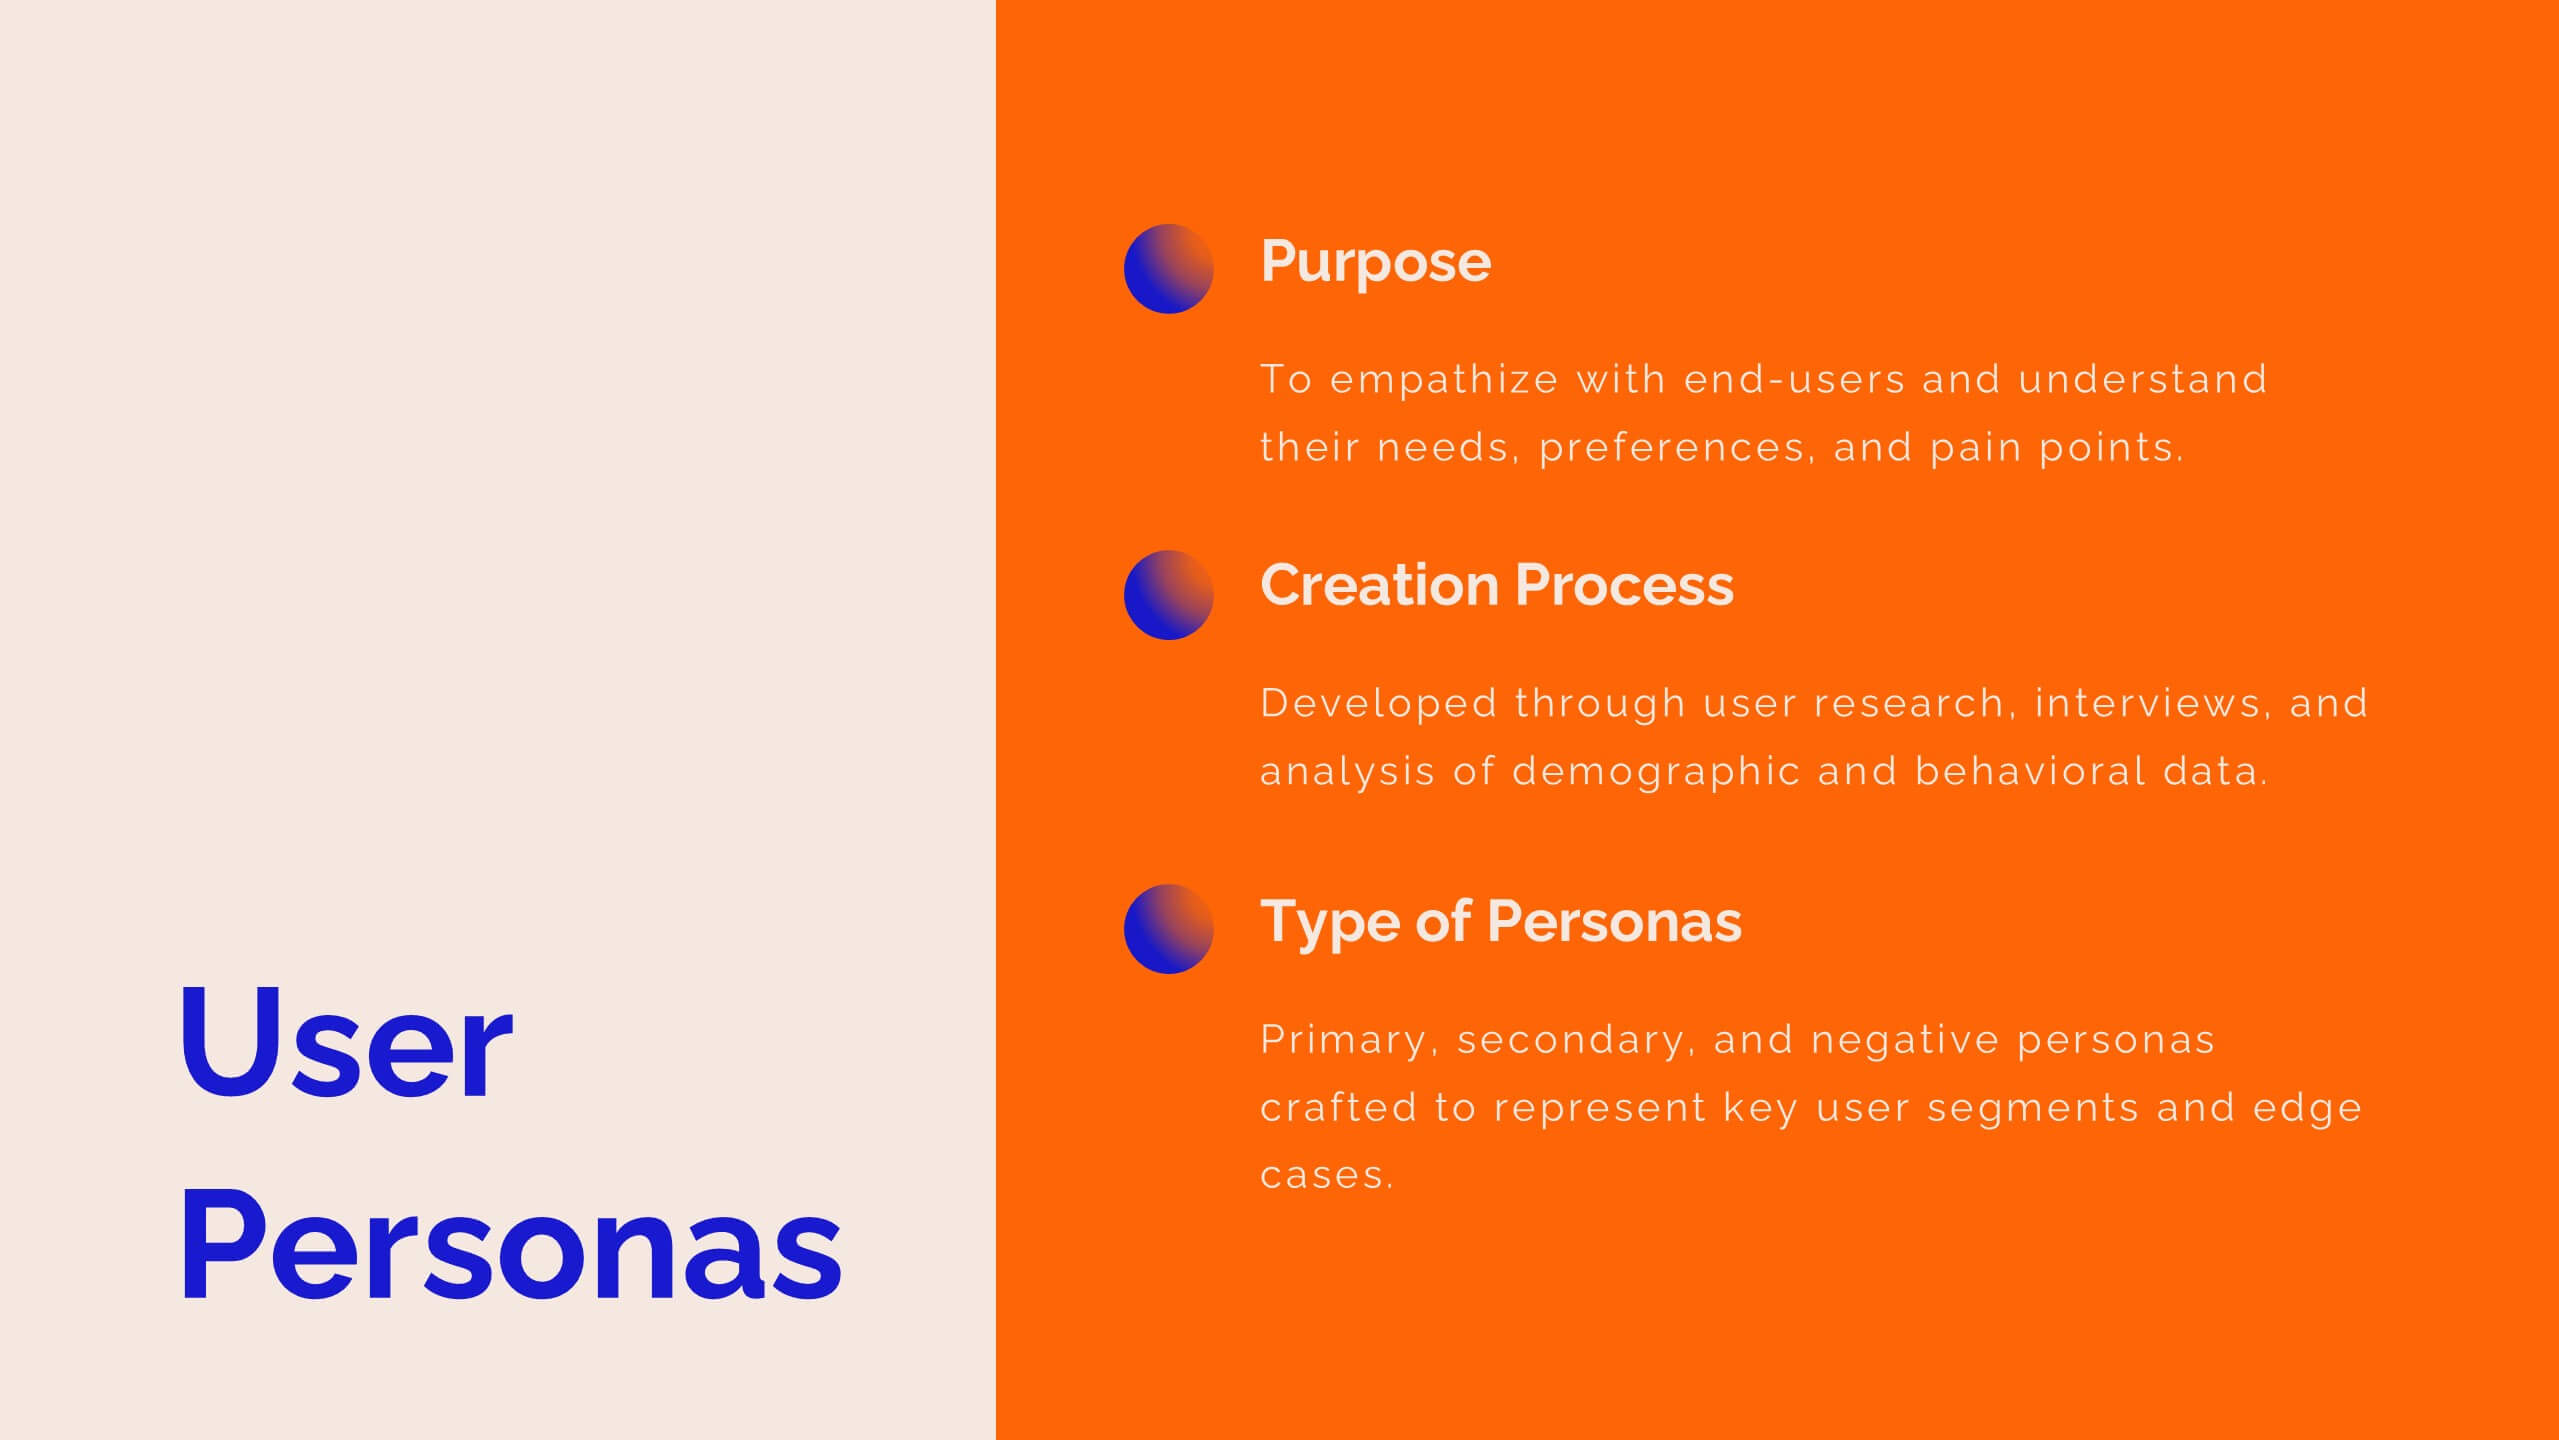
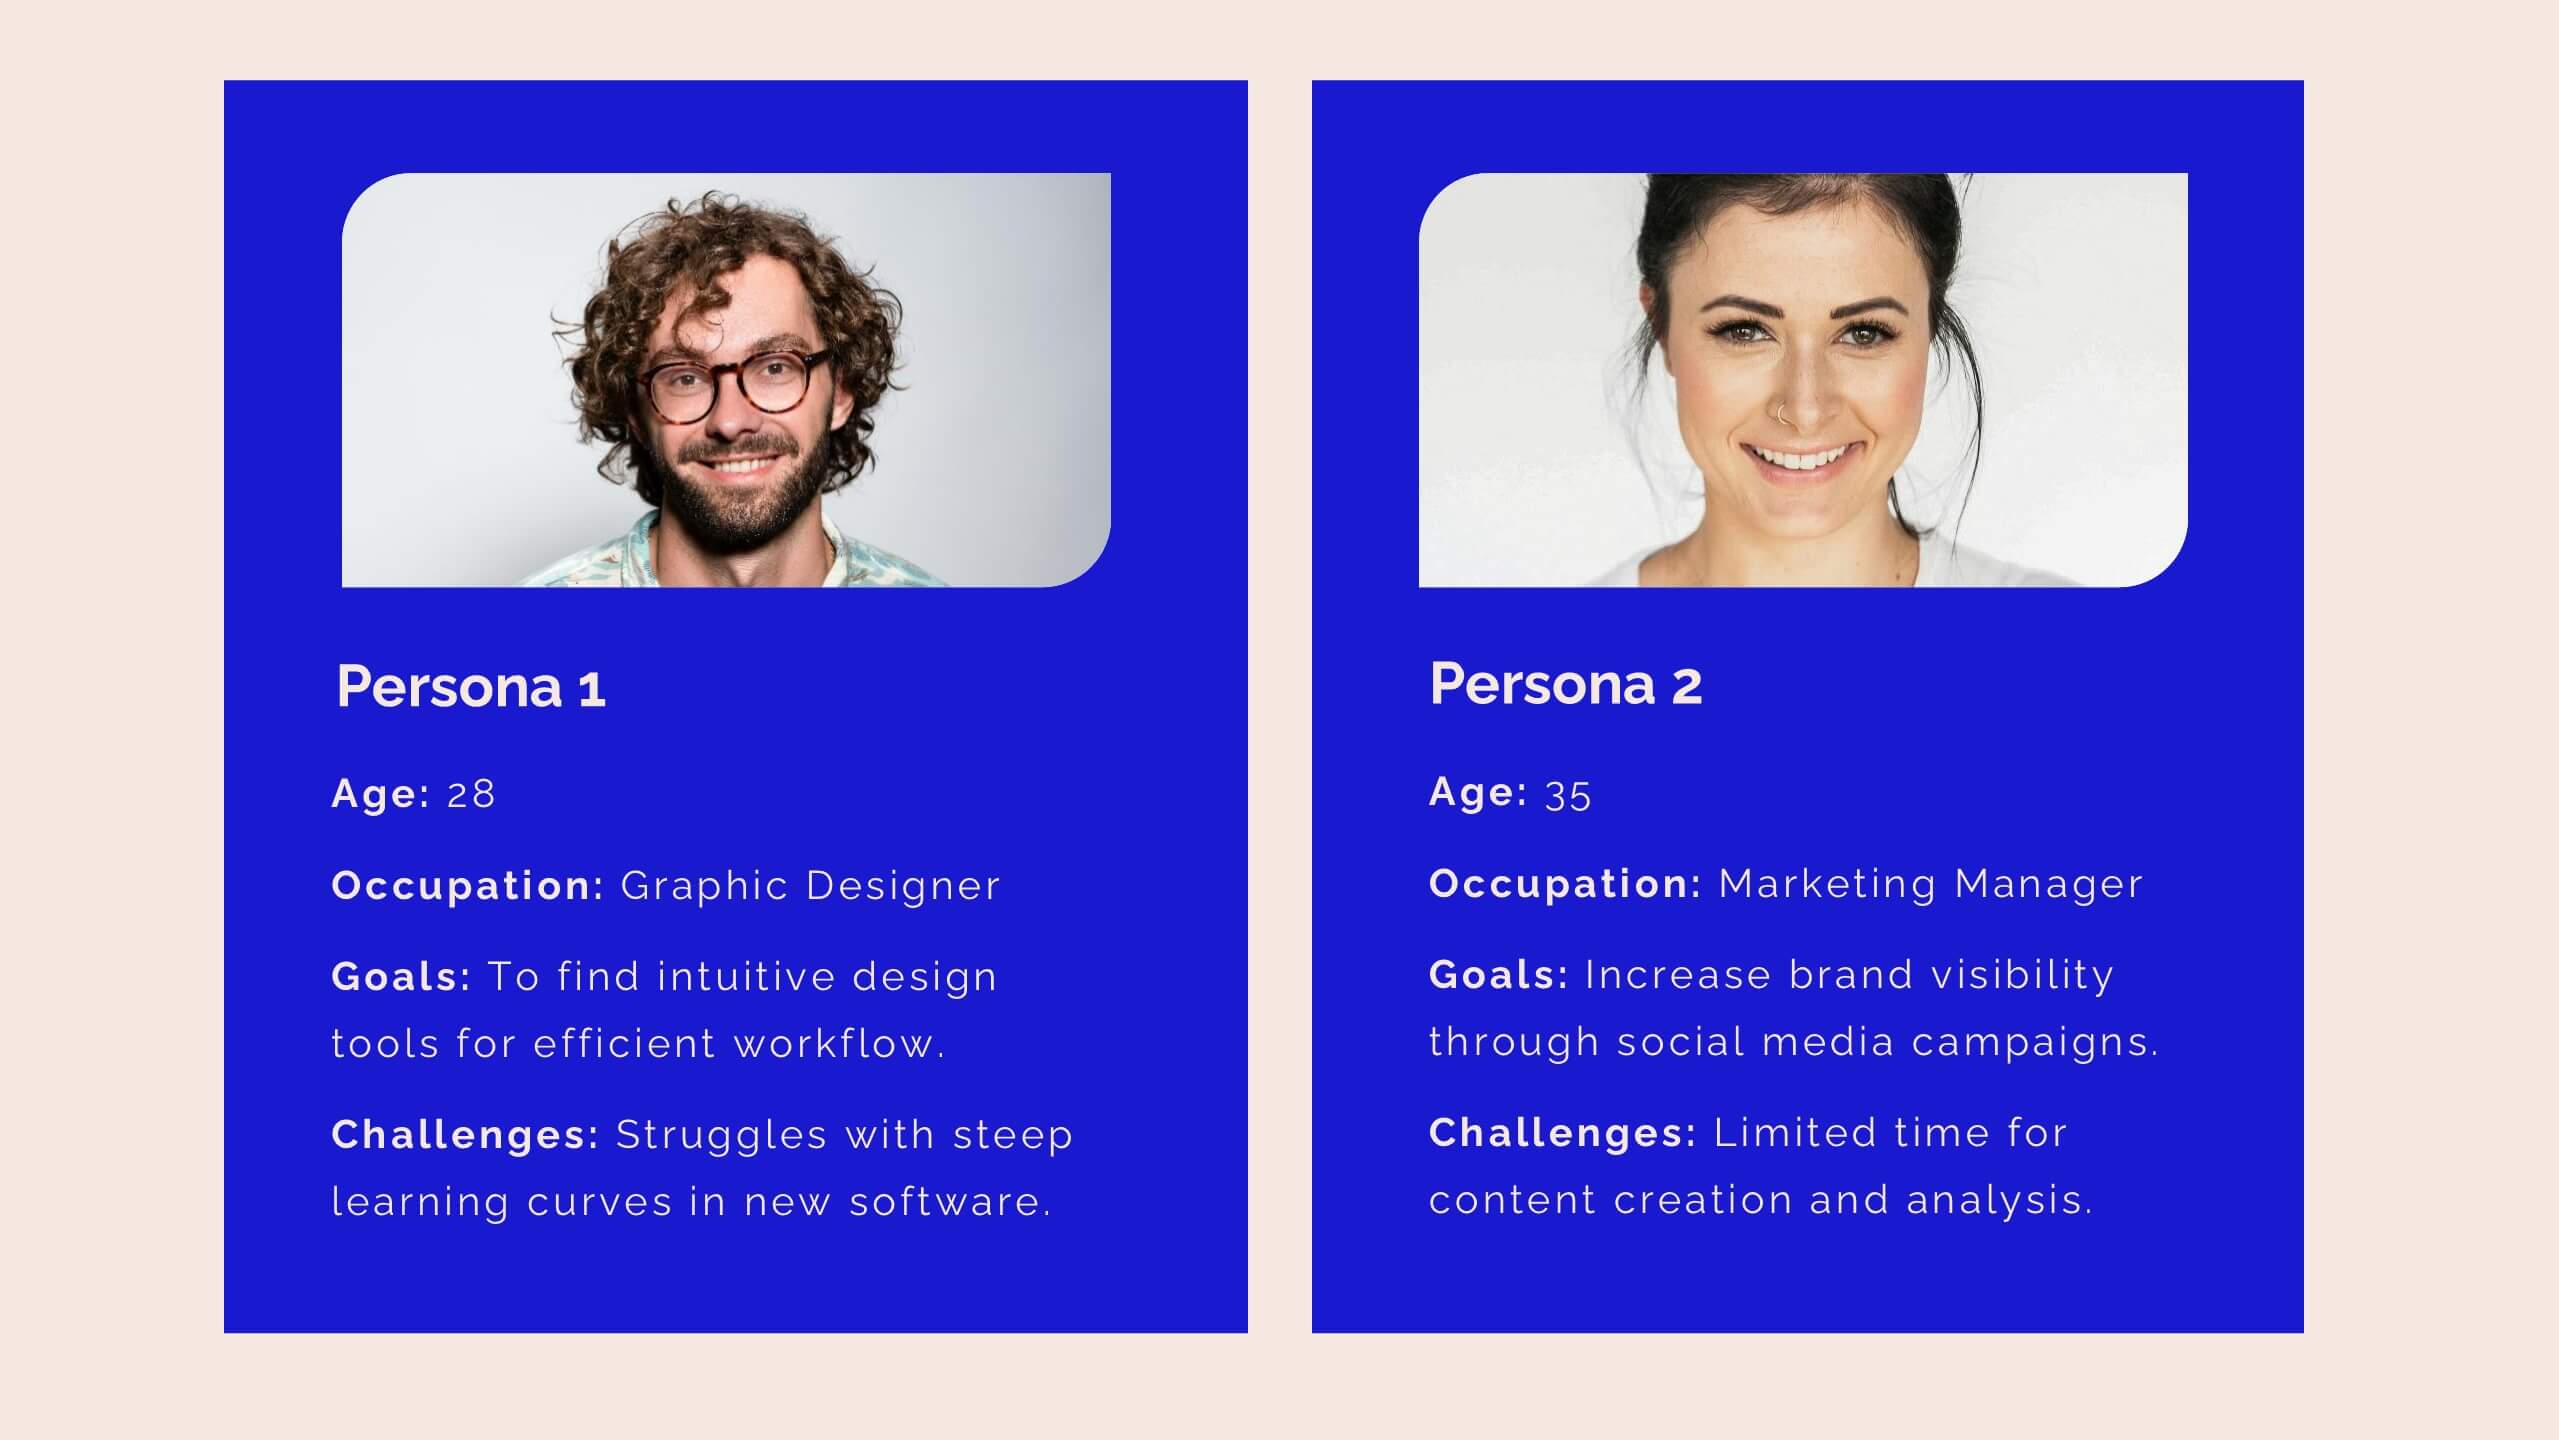
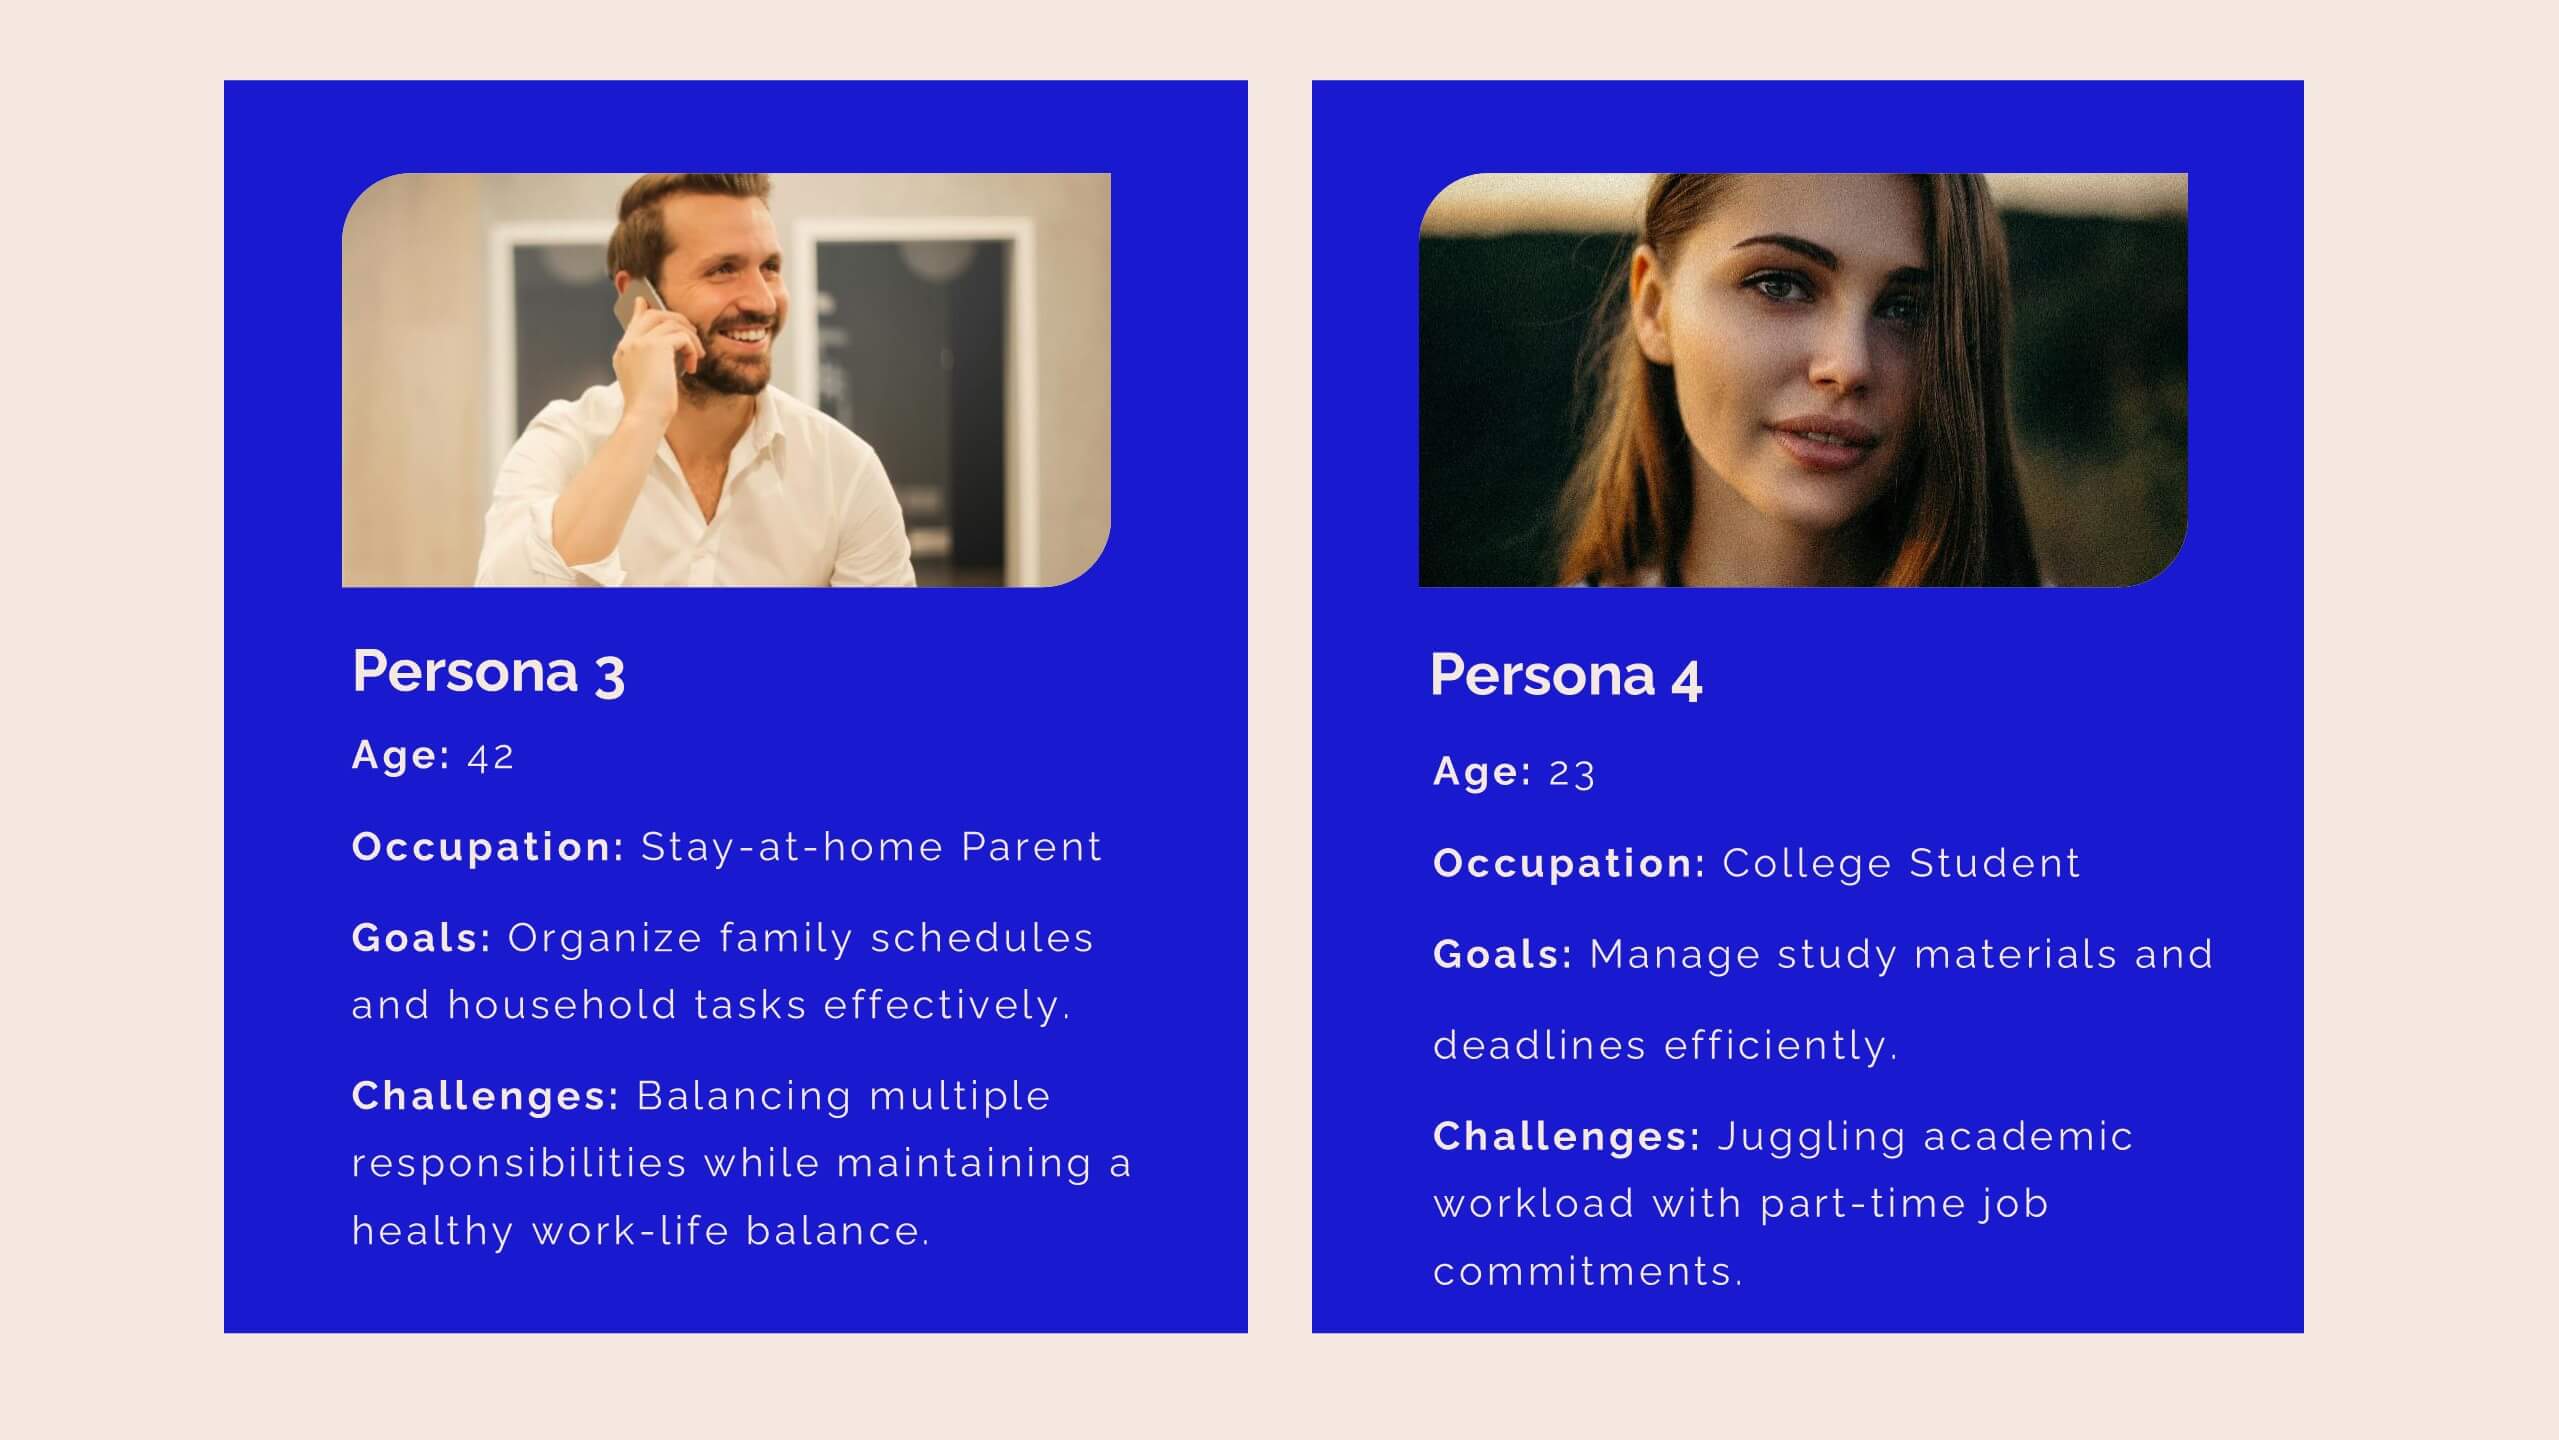
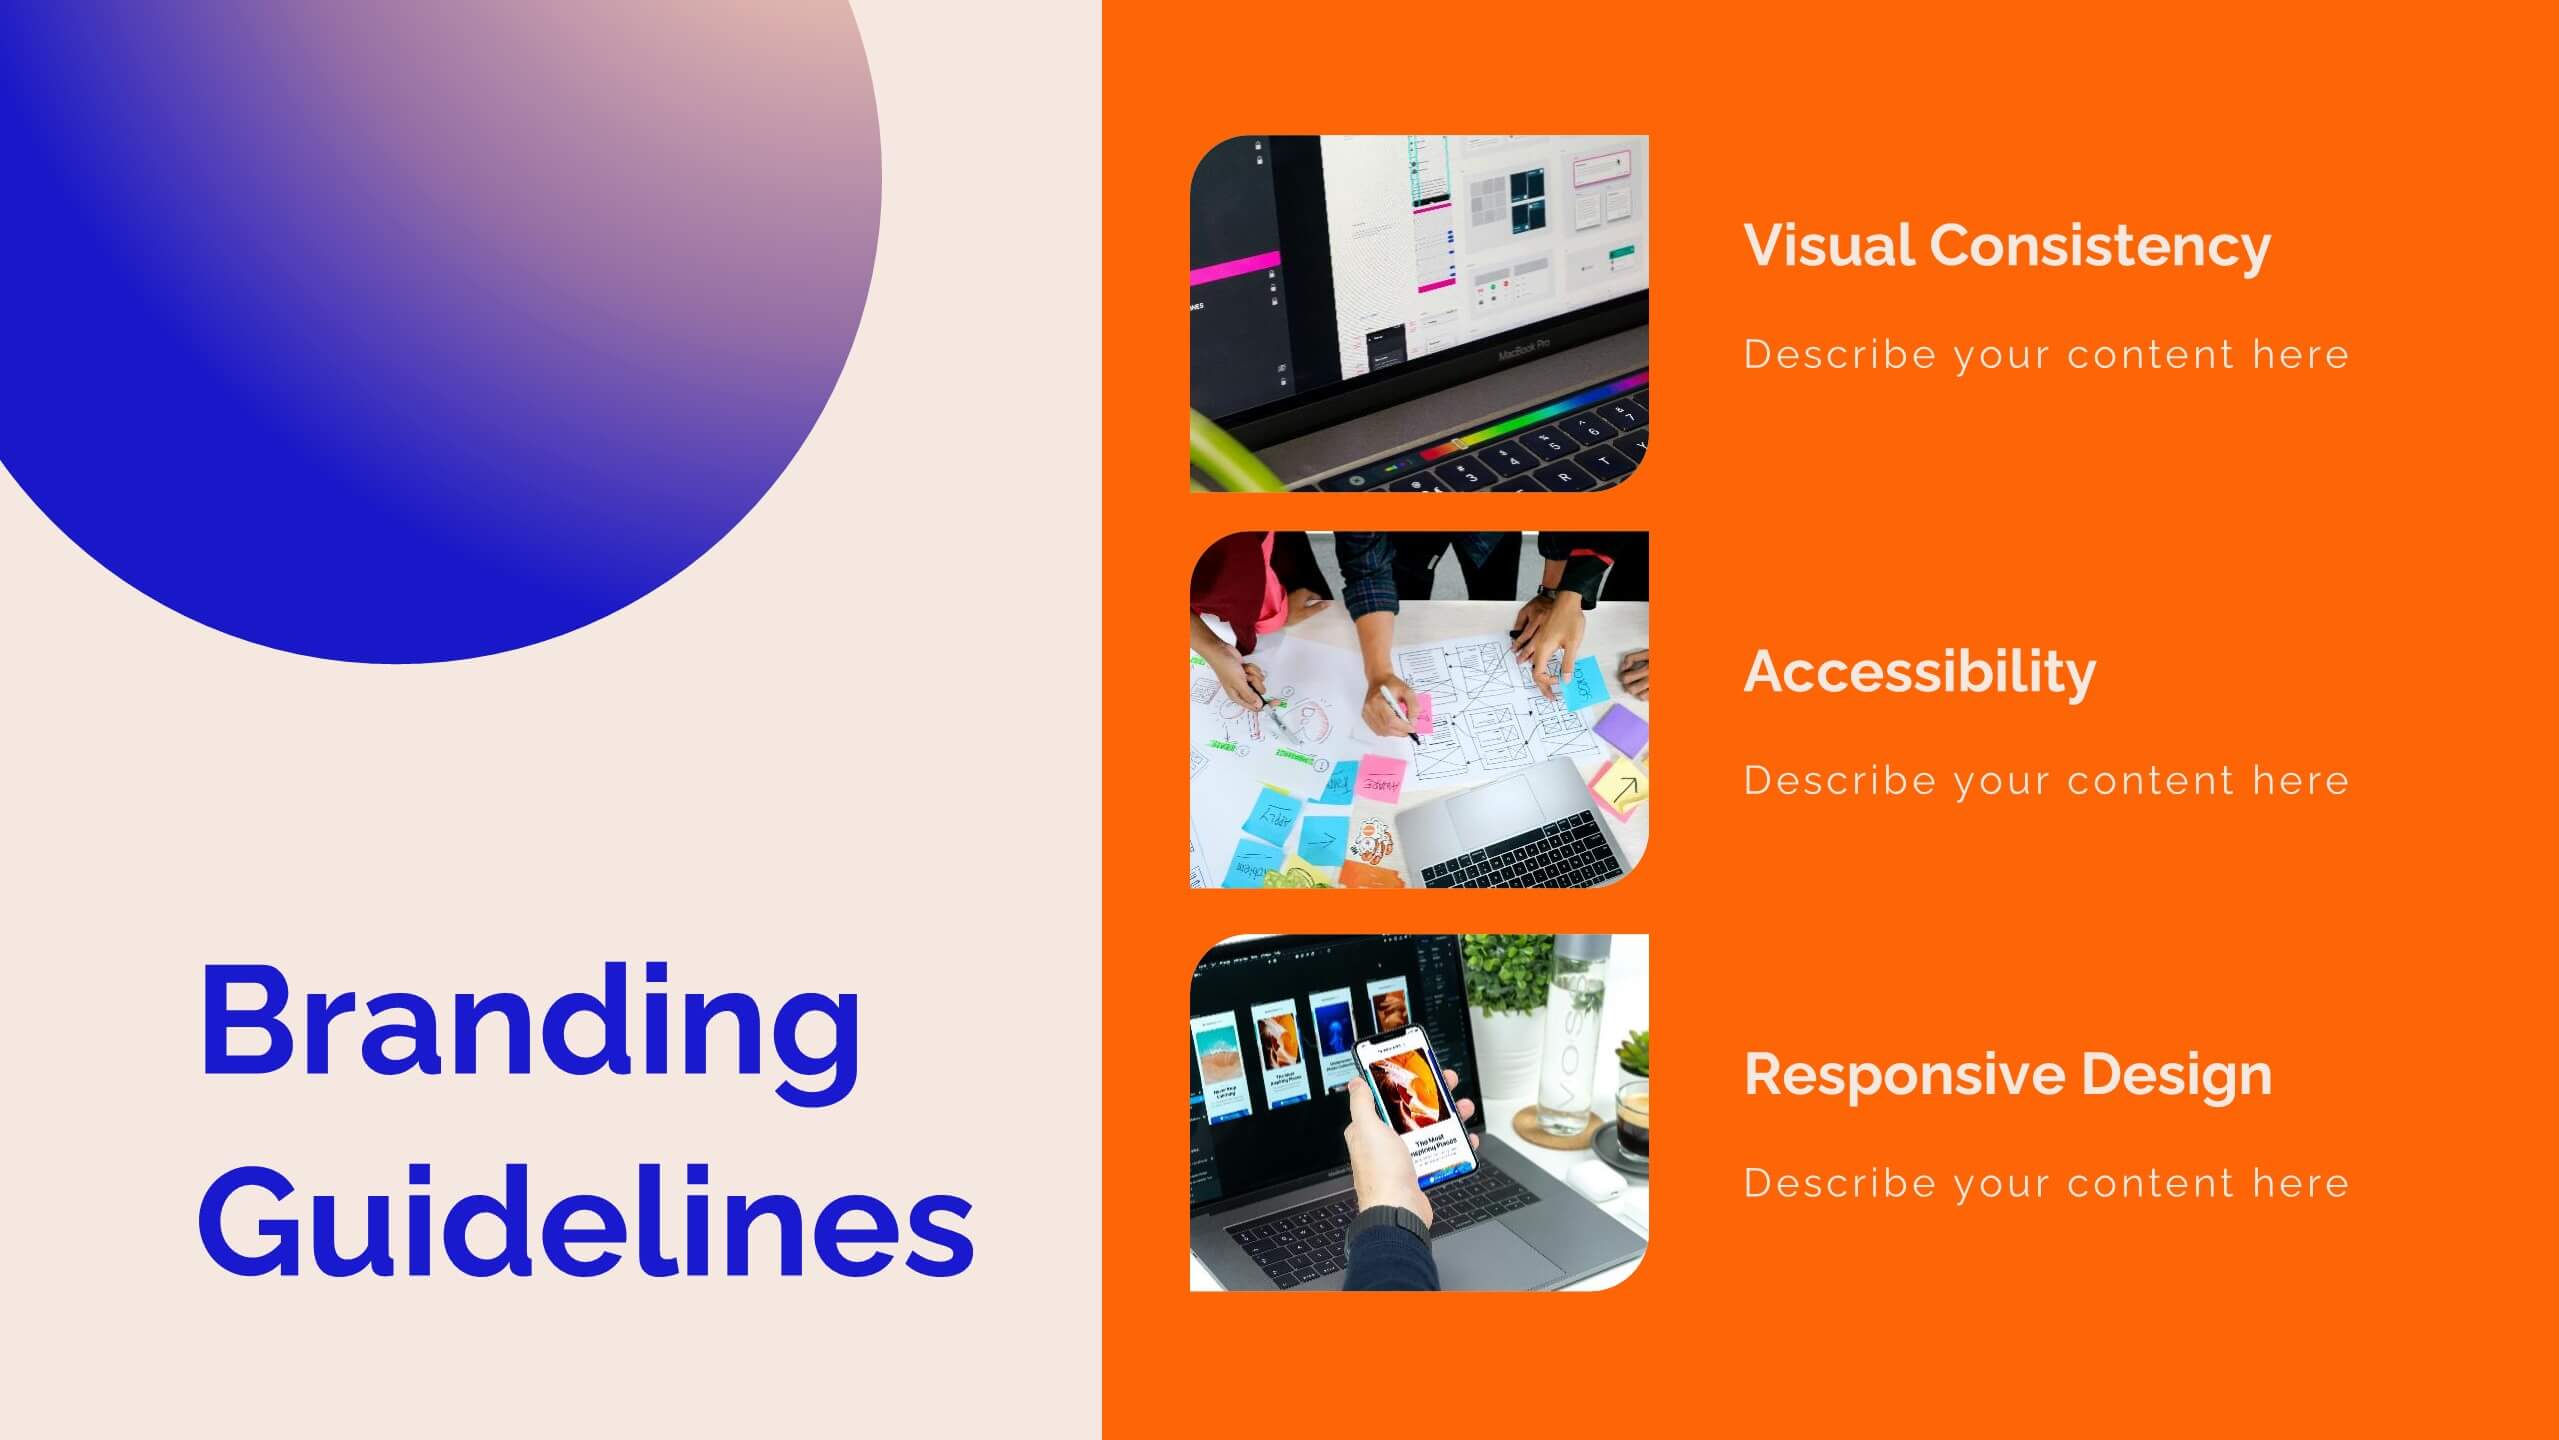
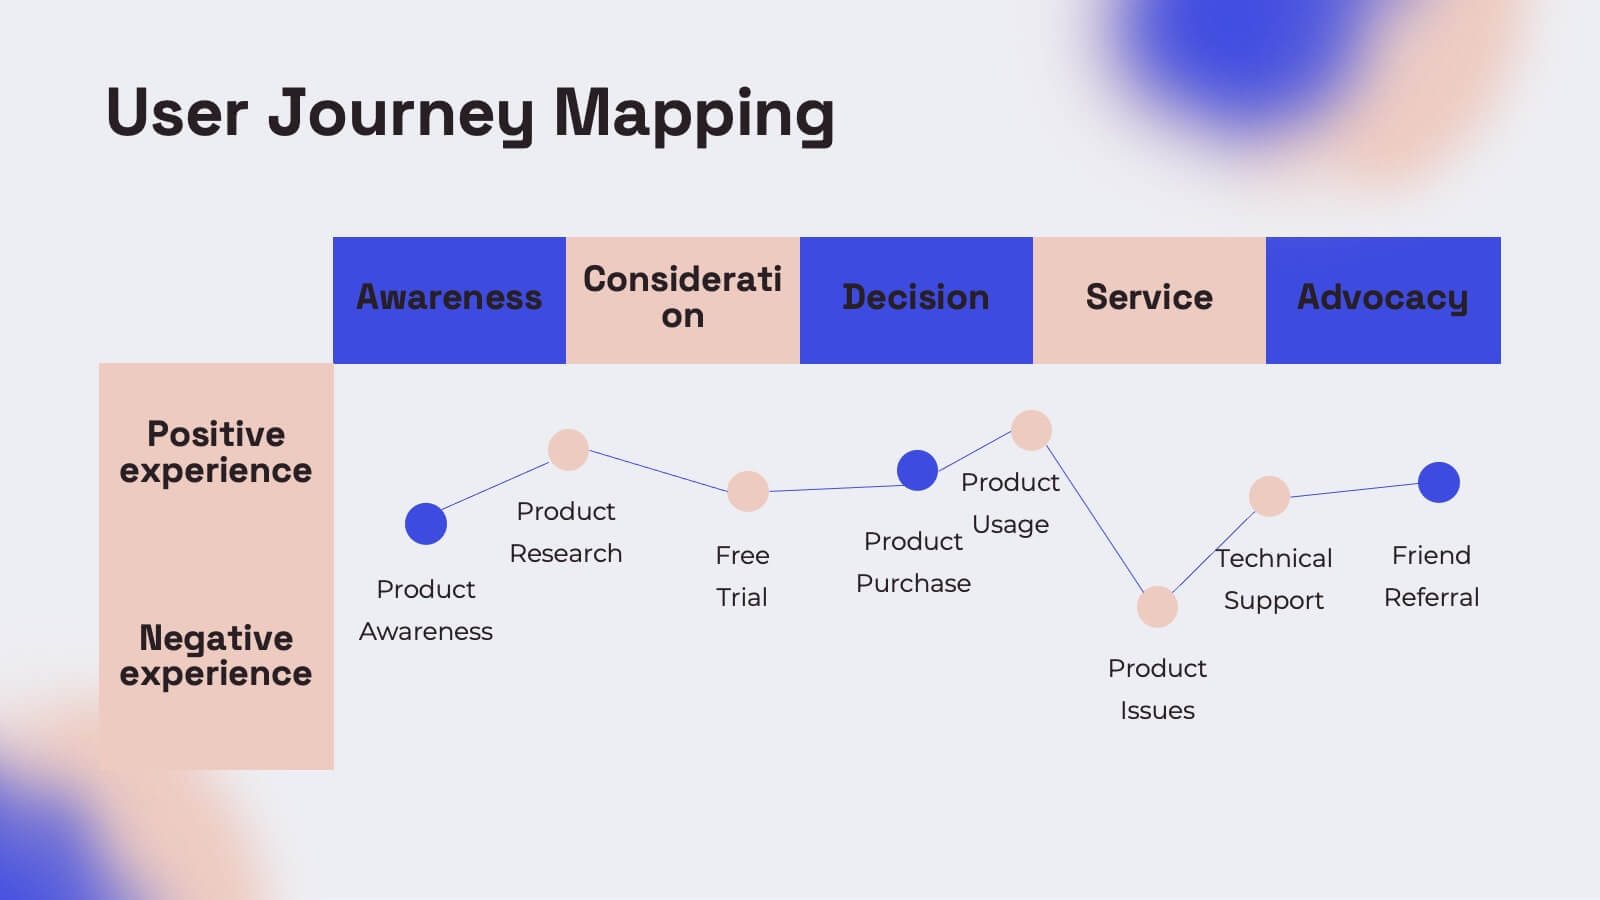
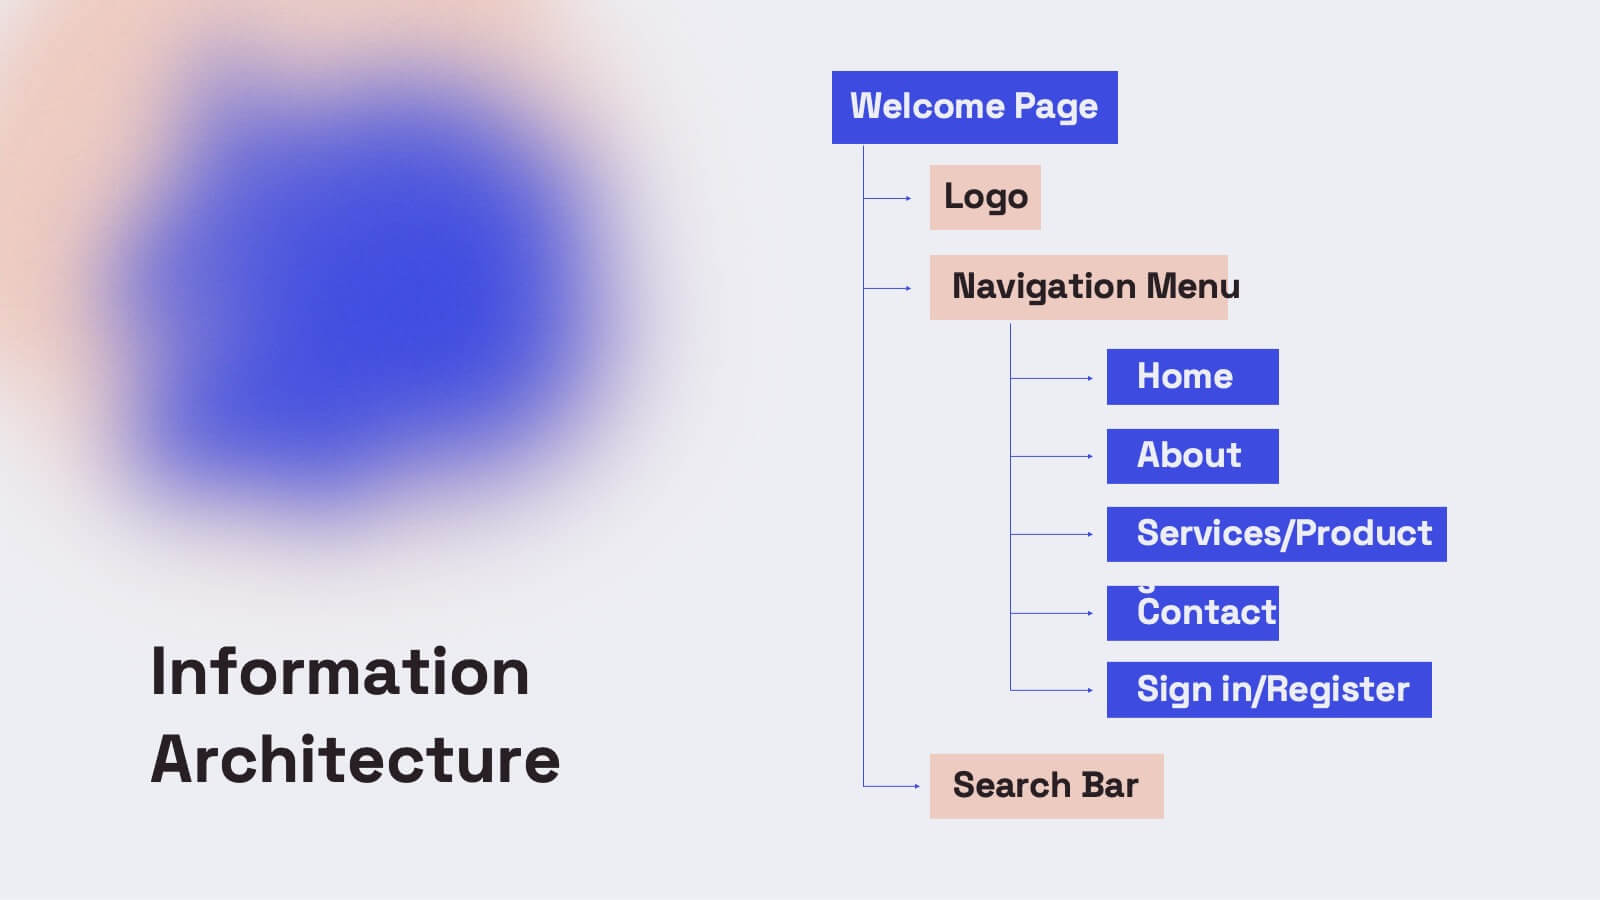
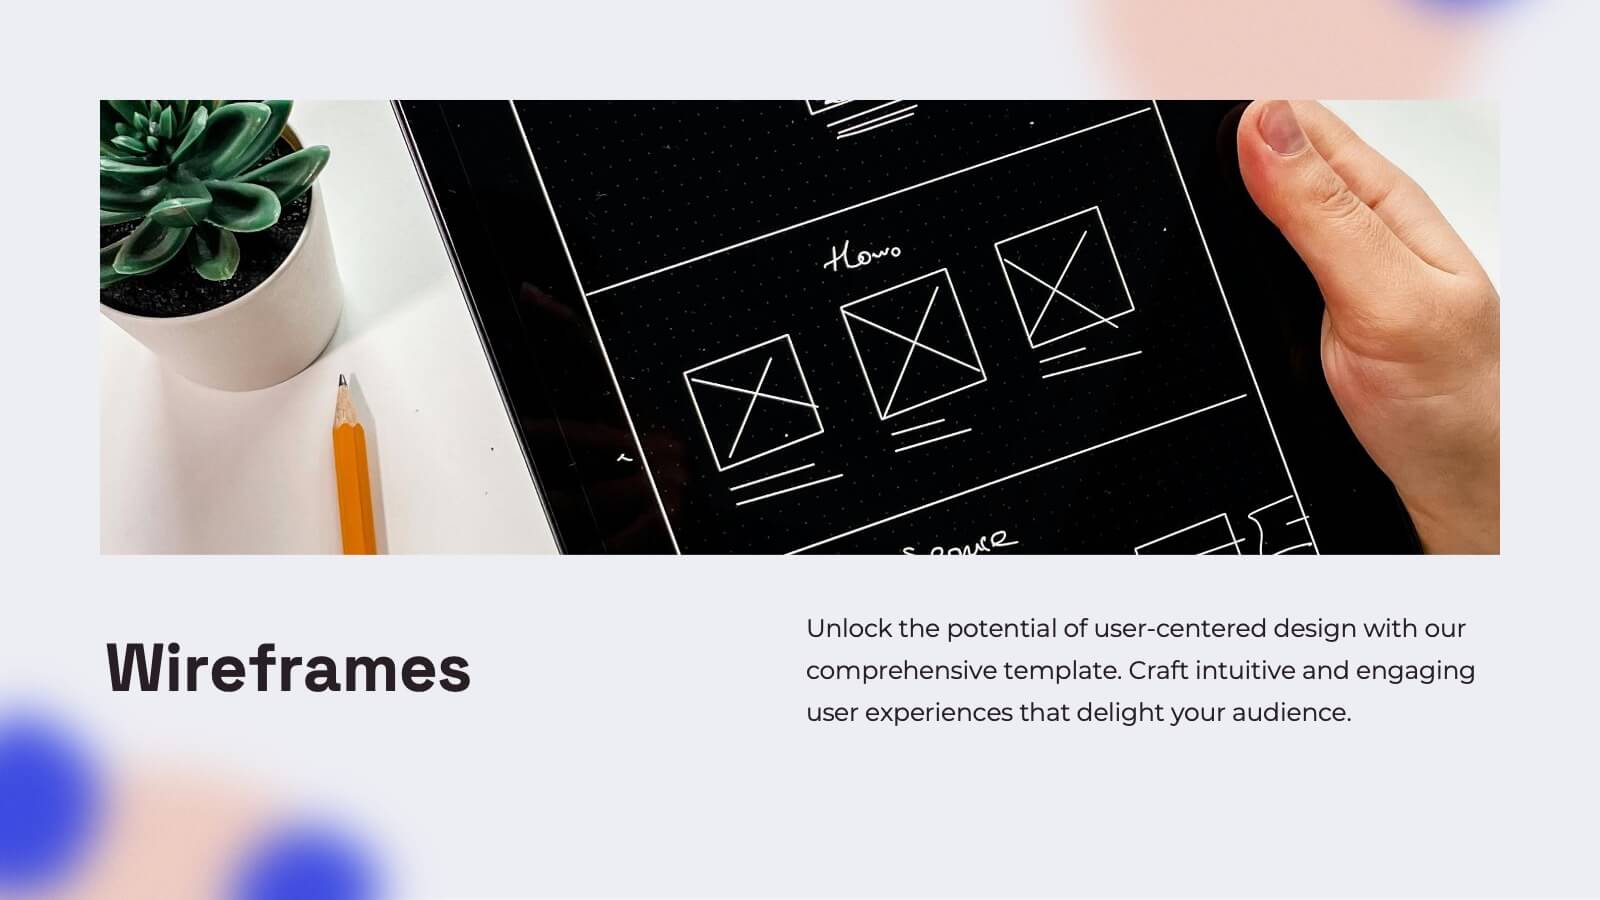
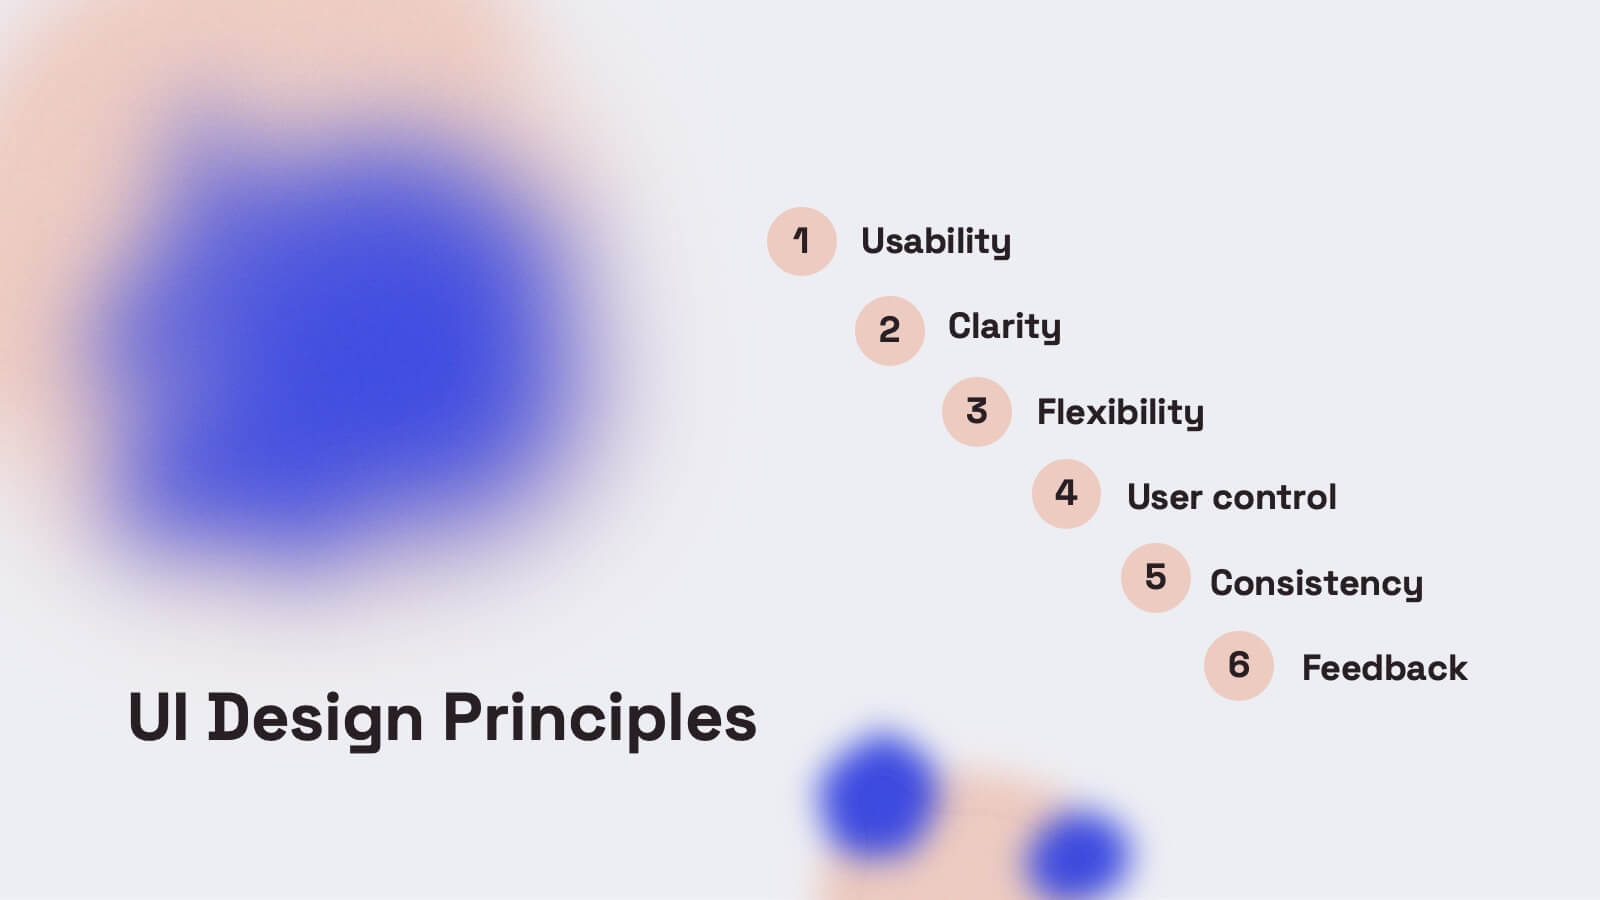
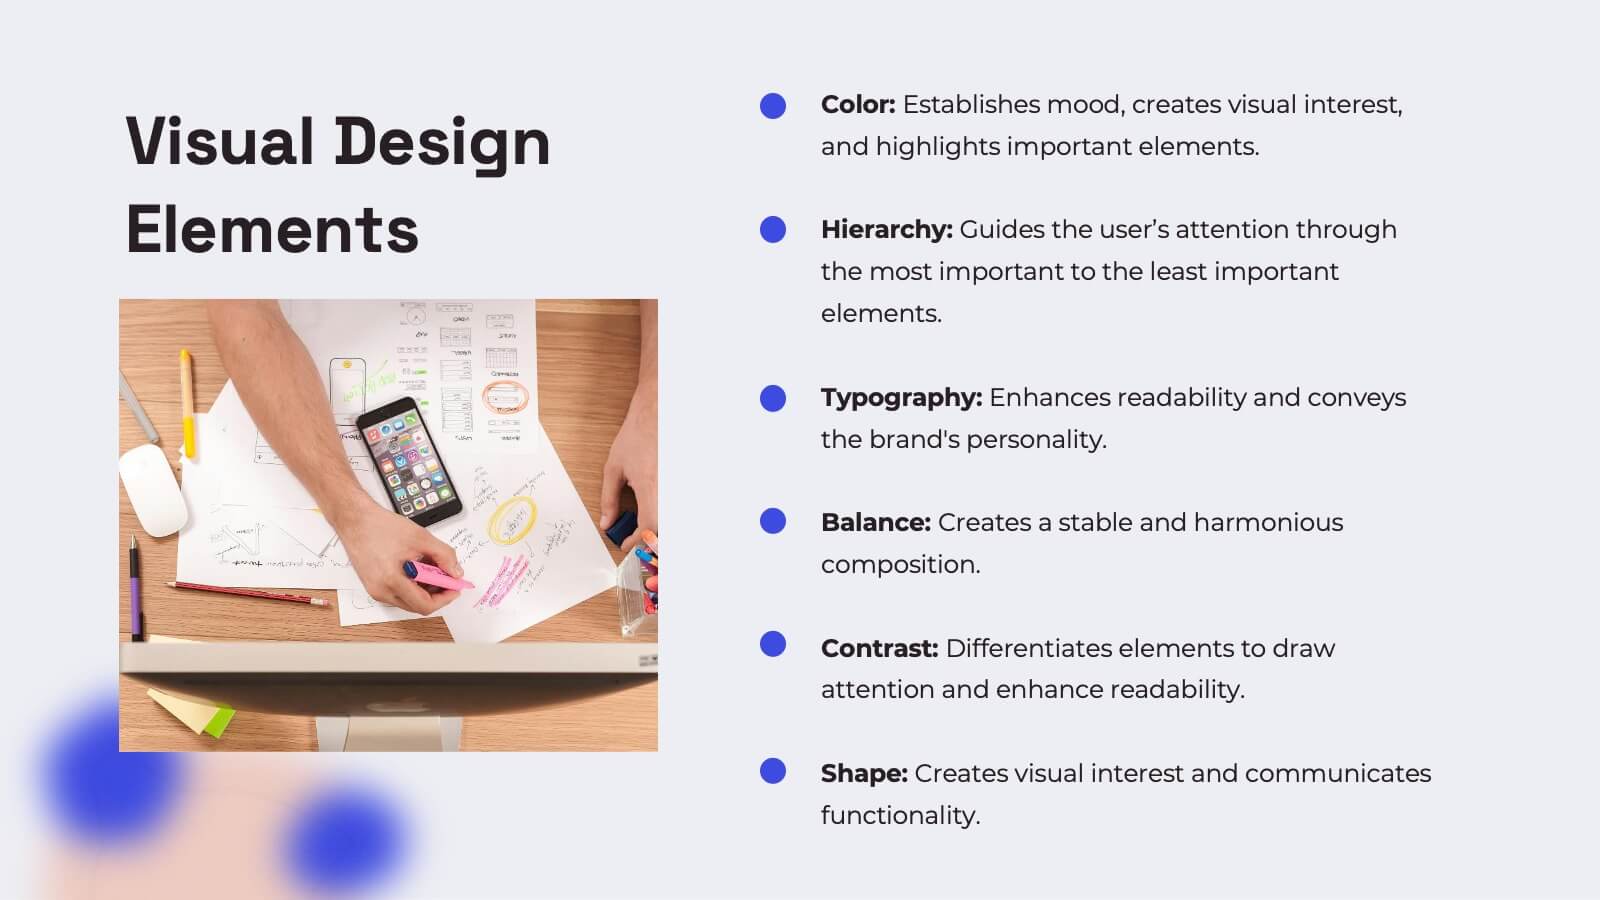
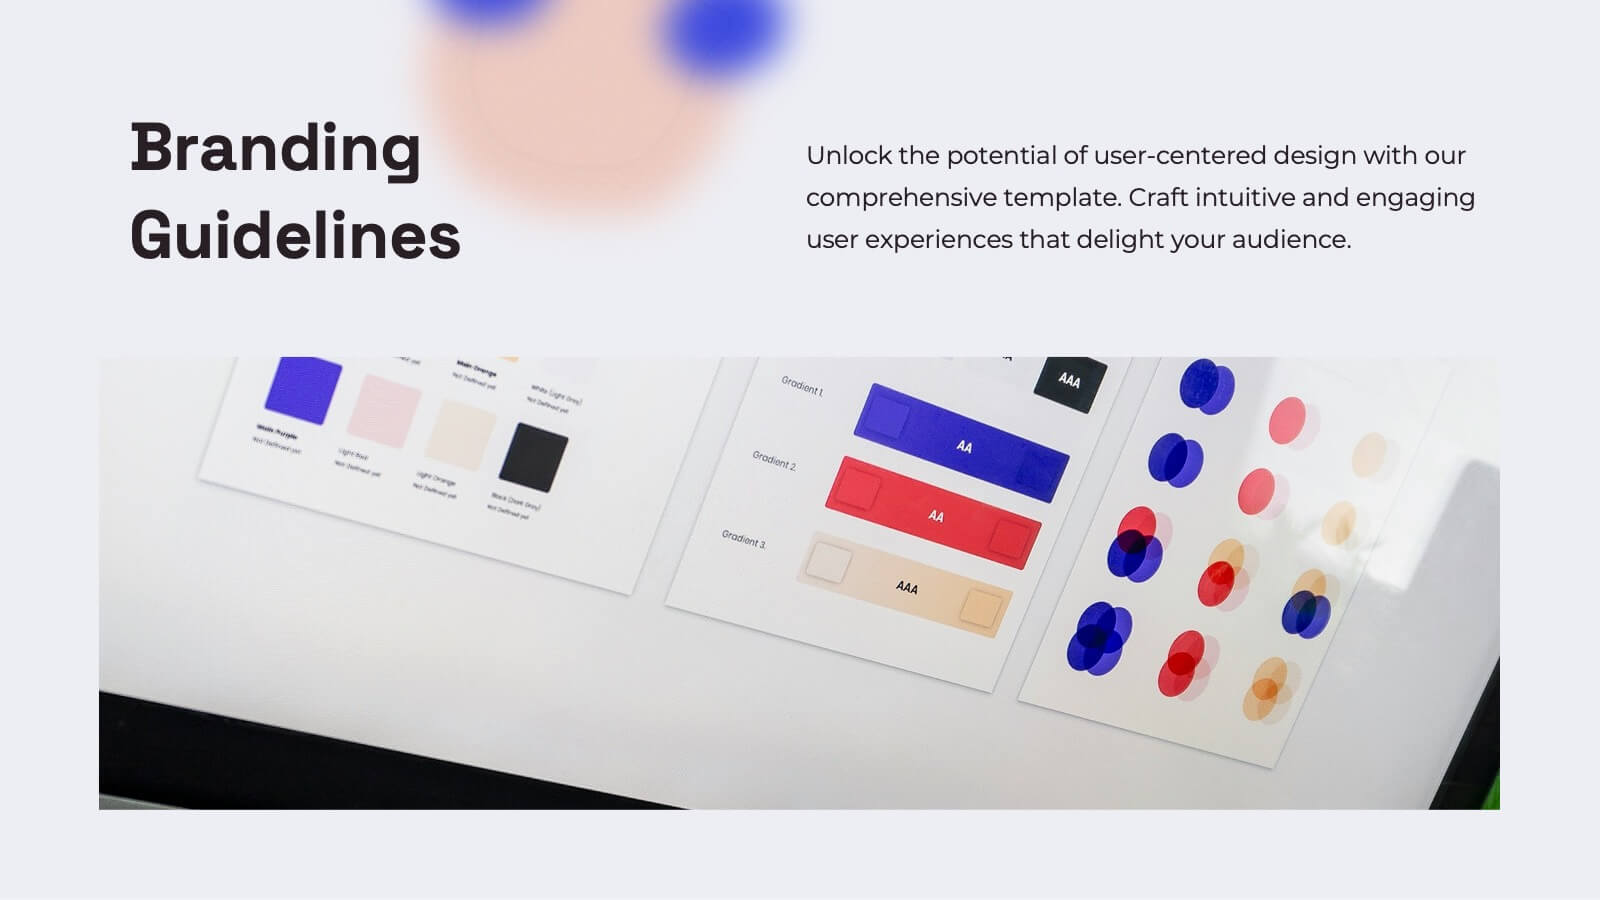
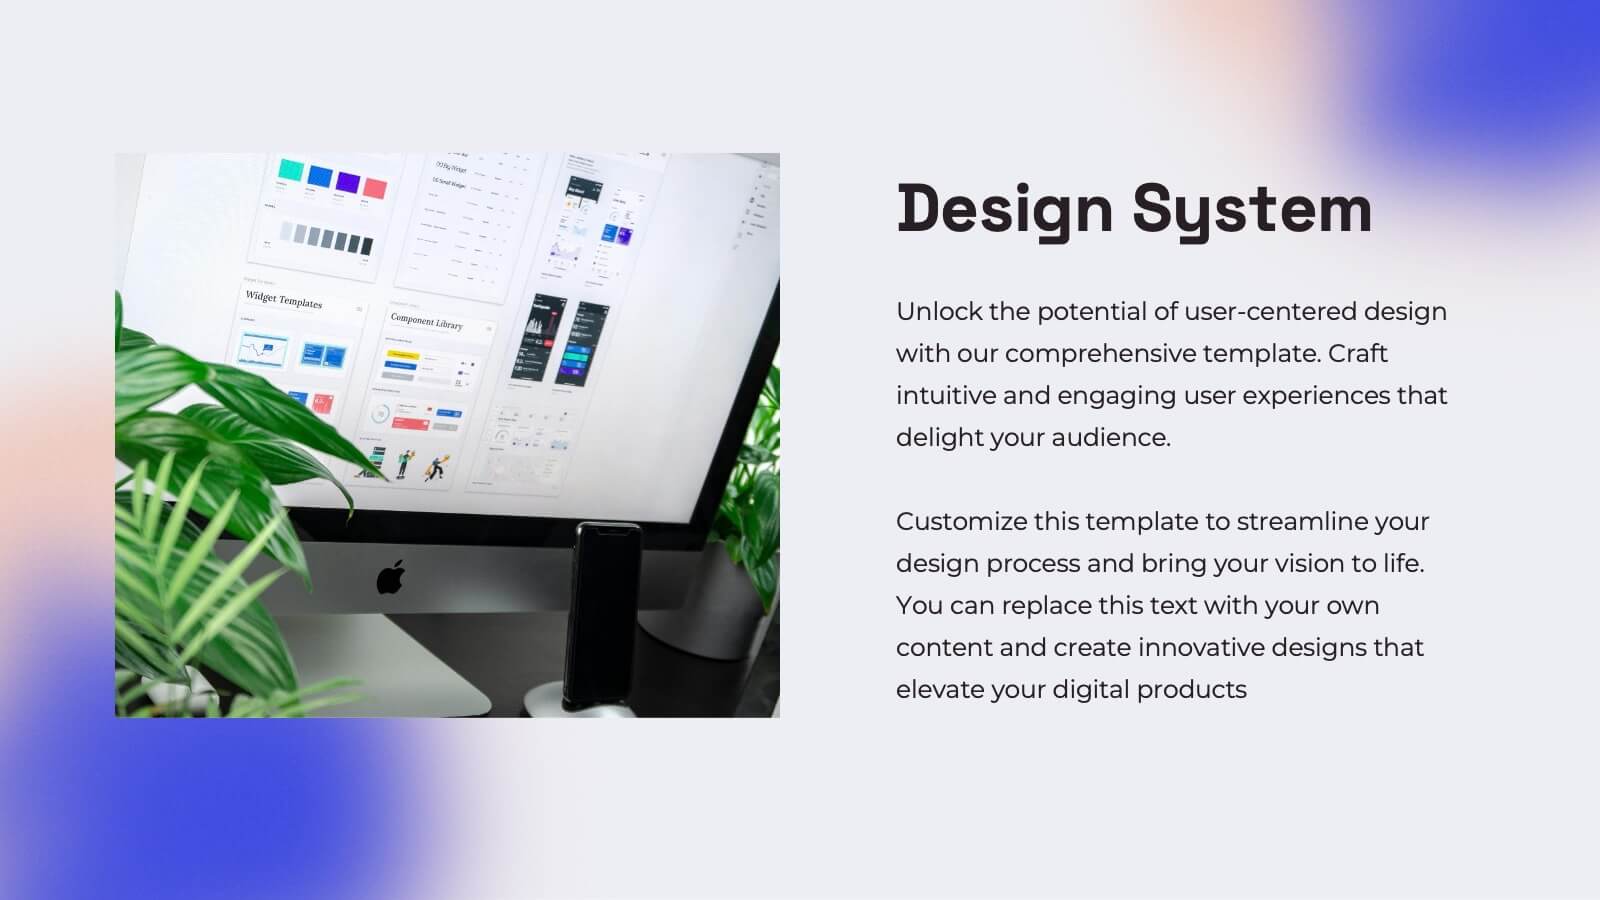
Niobium UX Research Report Presentation
Present your UX research findings with clarity and style using this vibrant UX research report template! It includes sections for user personas, wireframes, user testing, and design principles, making it ideal for sharing research insights. Fully customizable and compatible with PowerPoint, Keynote, and Google Slides, it's perfect for UX professionals and design teams.


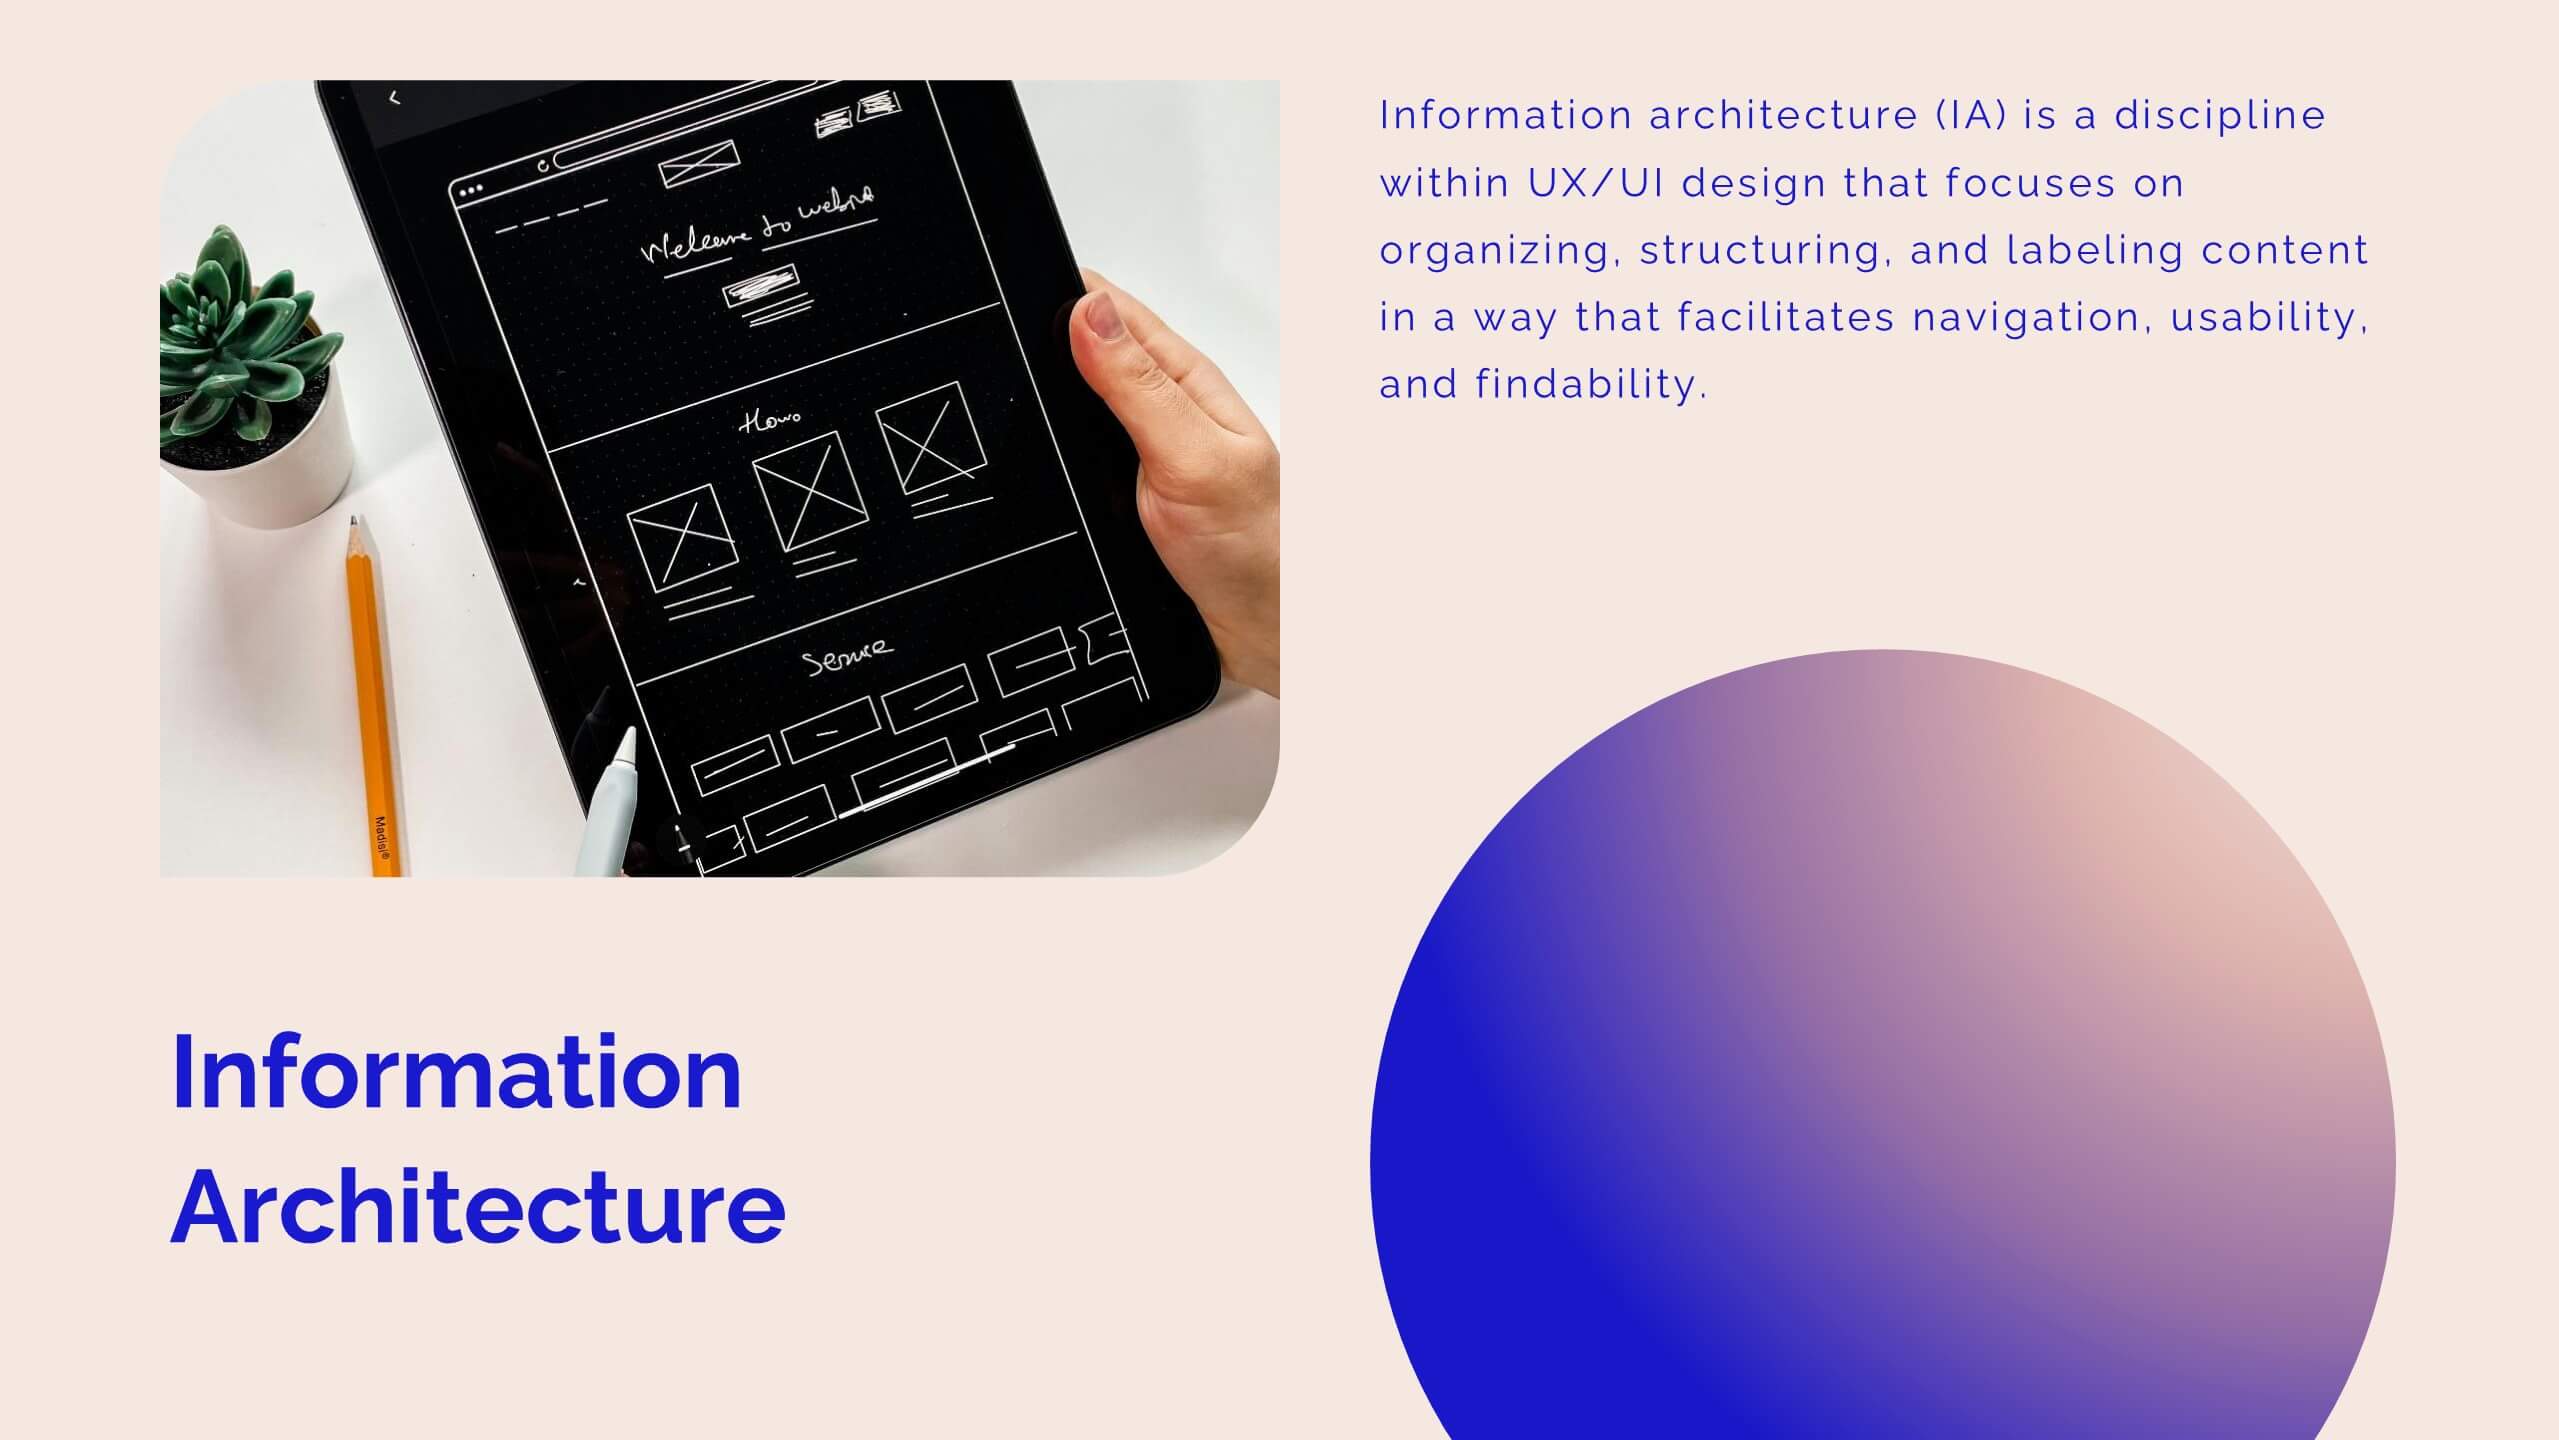
23 slides
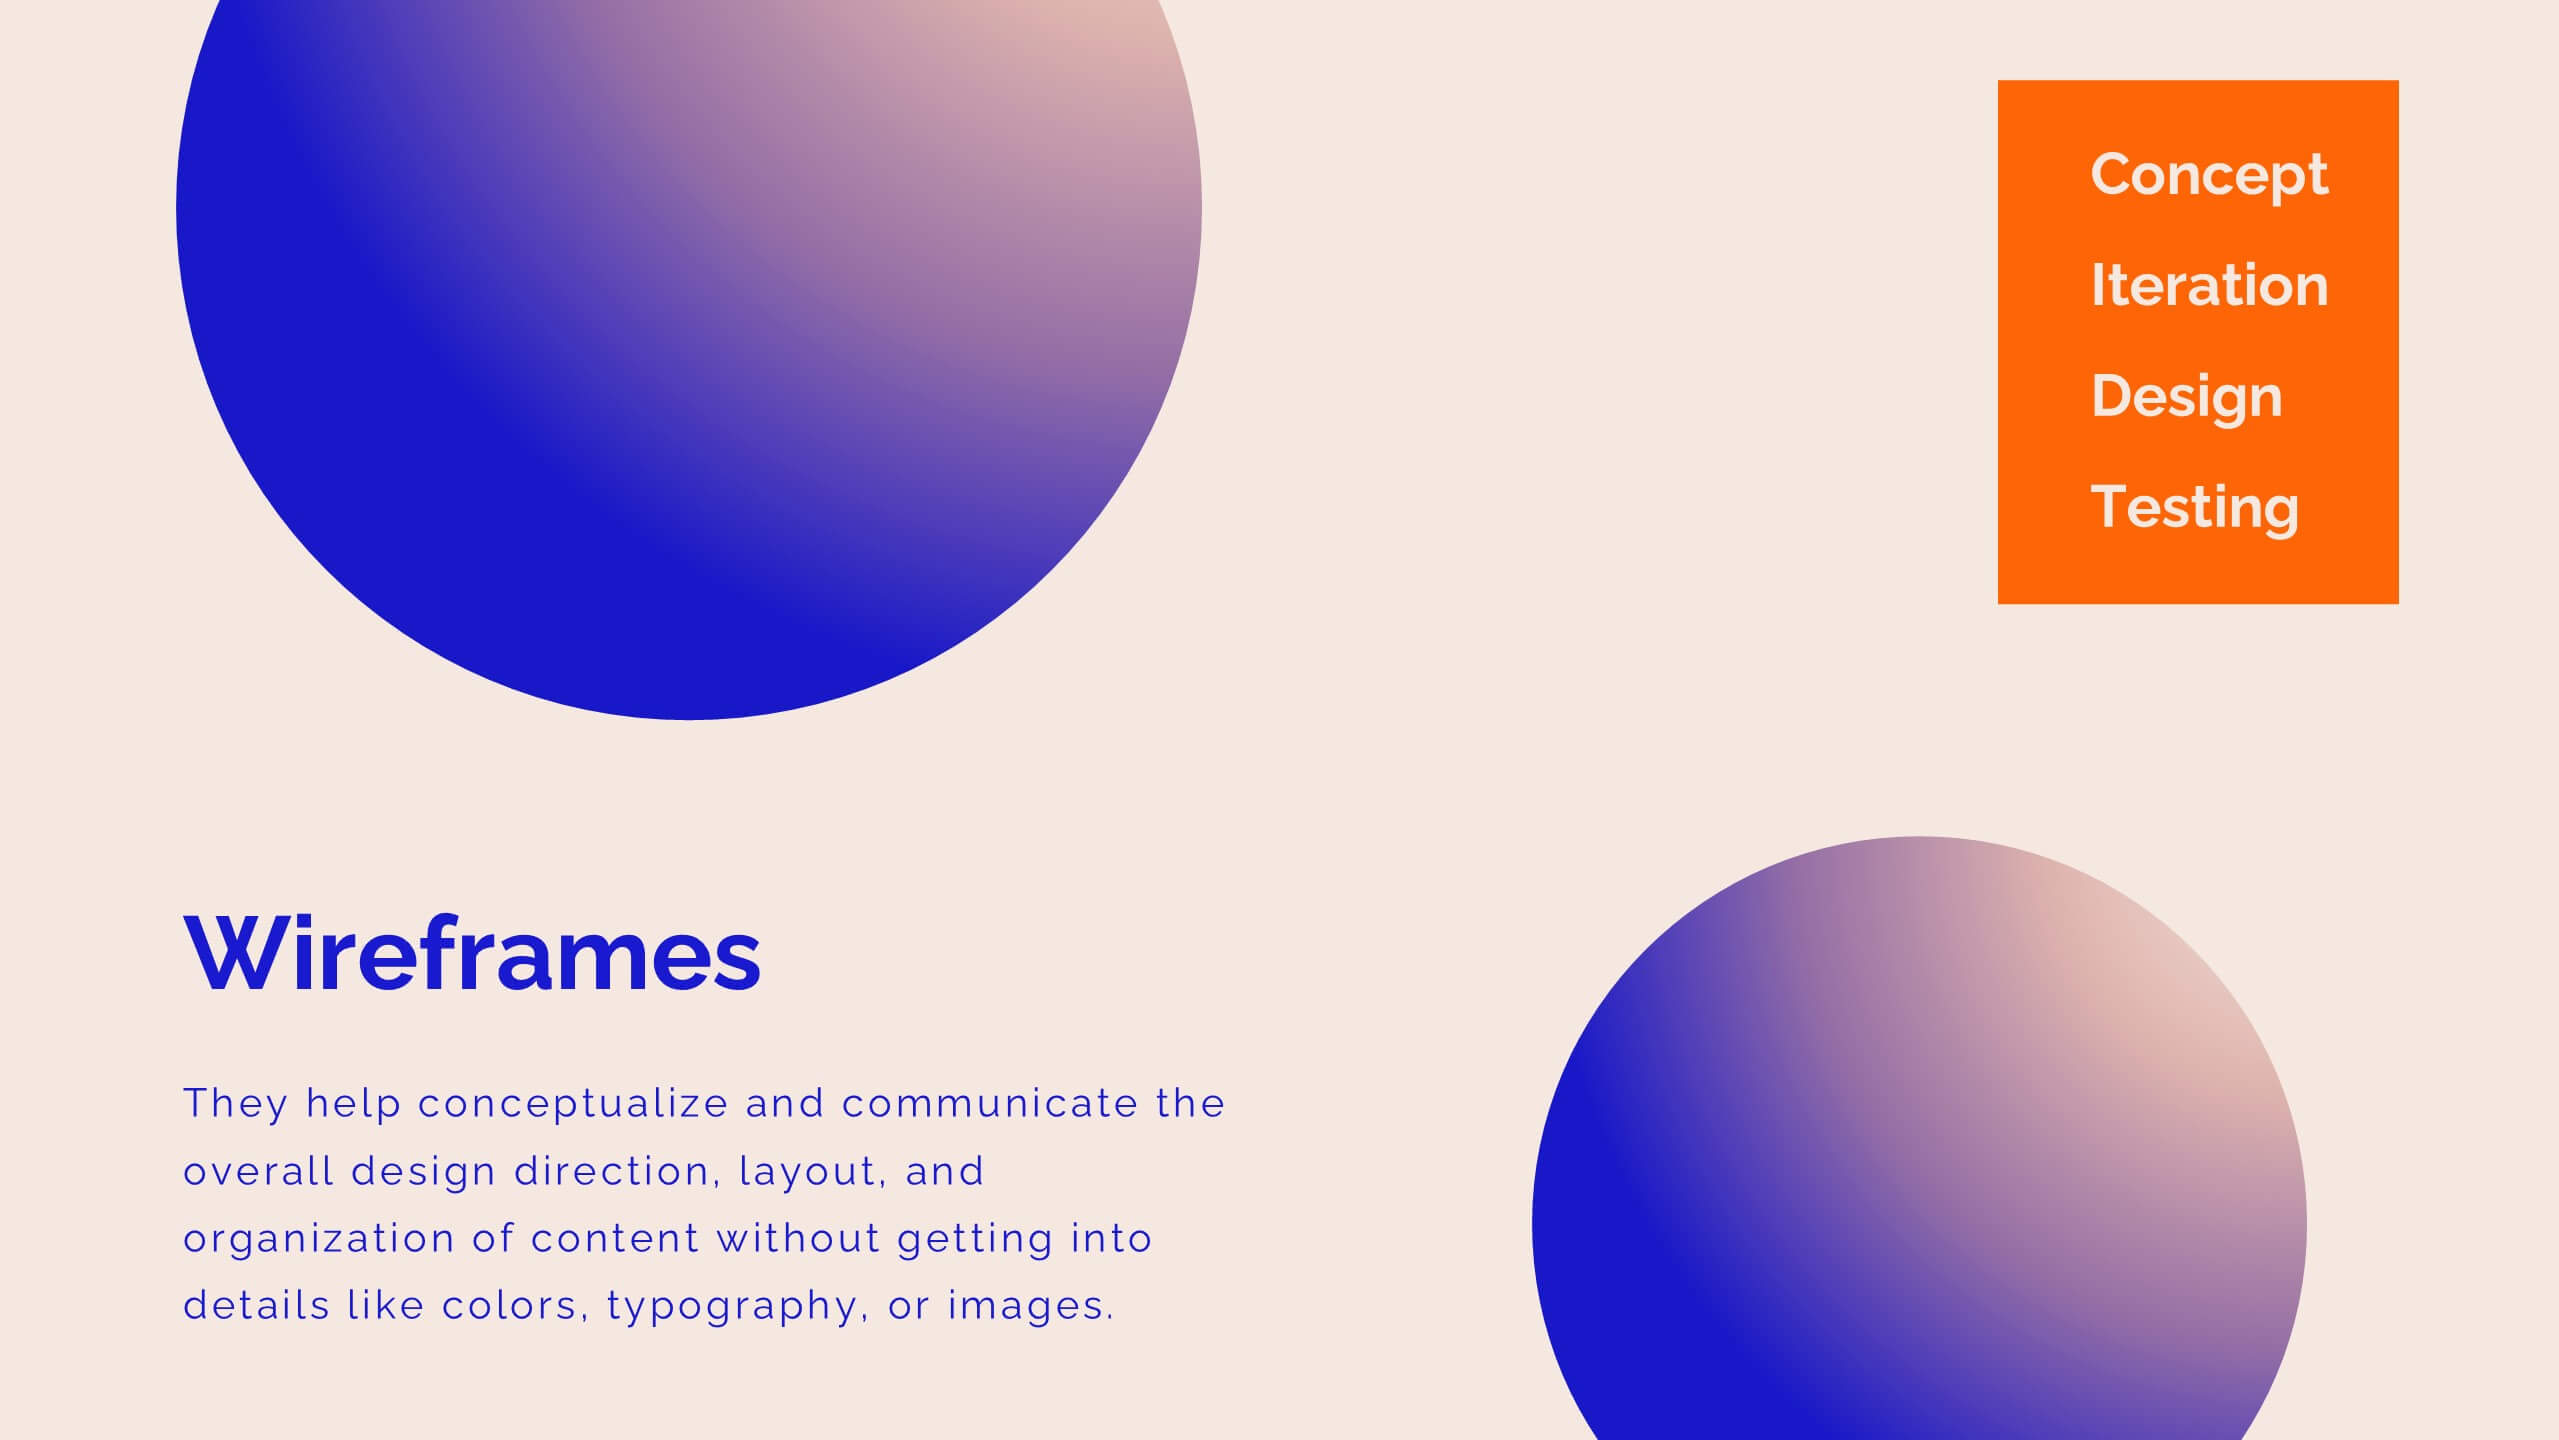
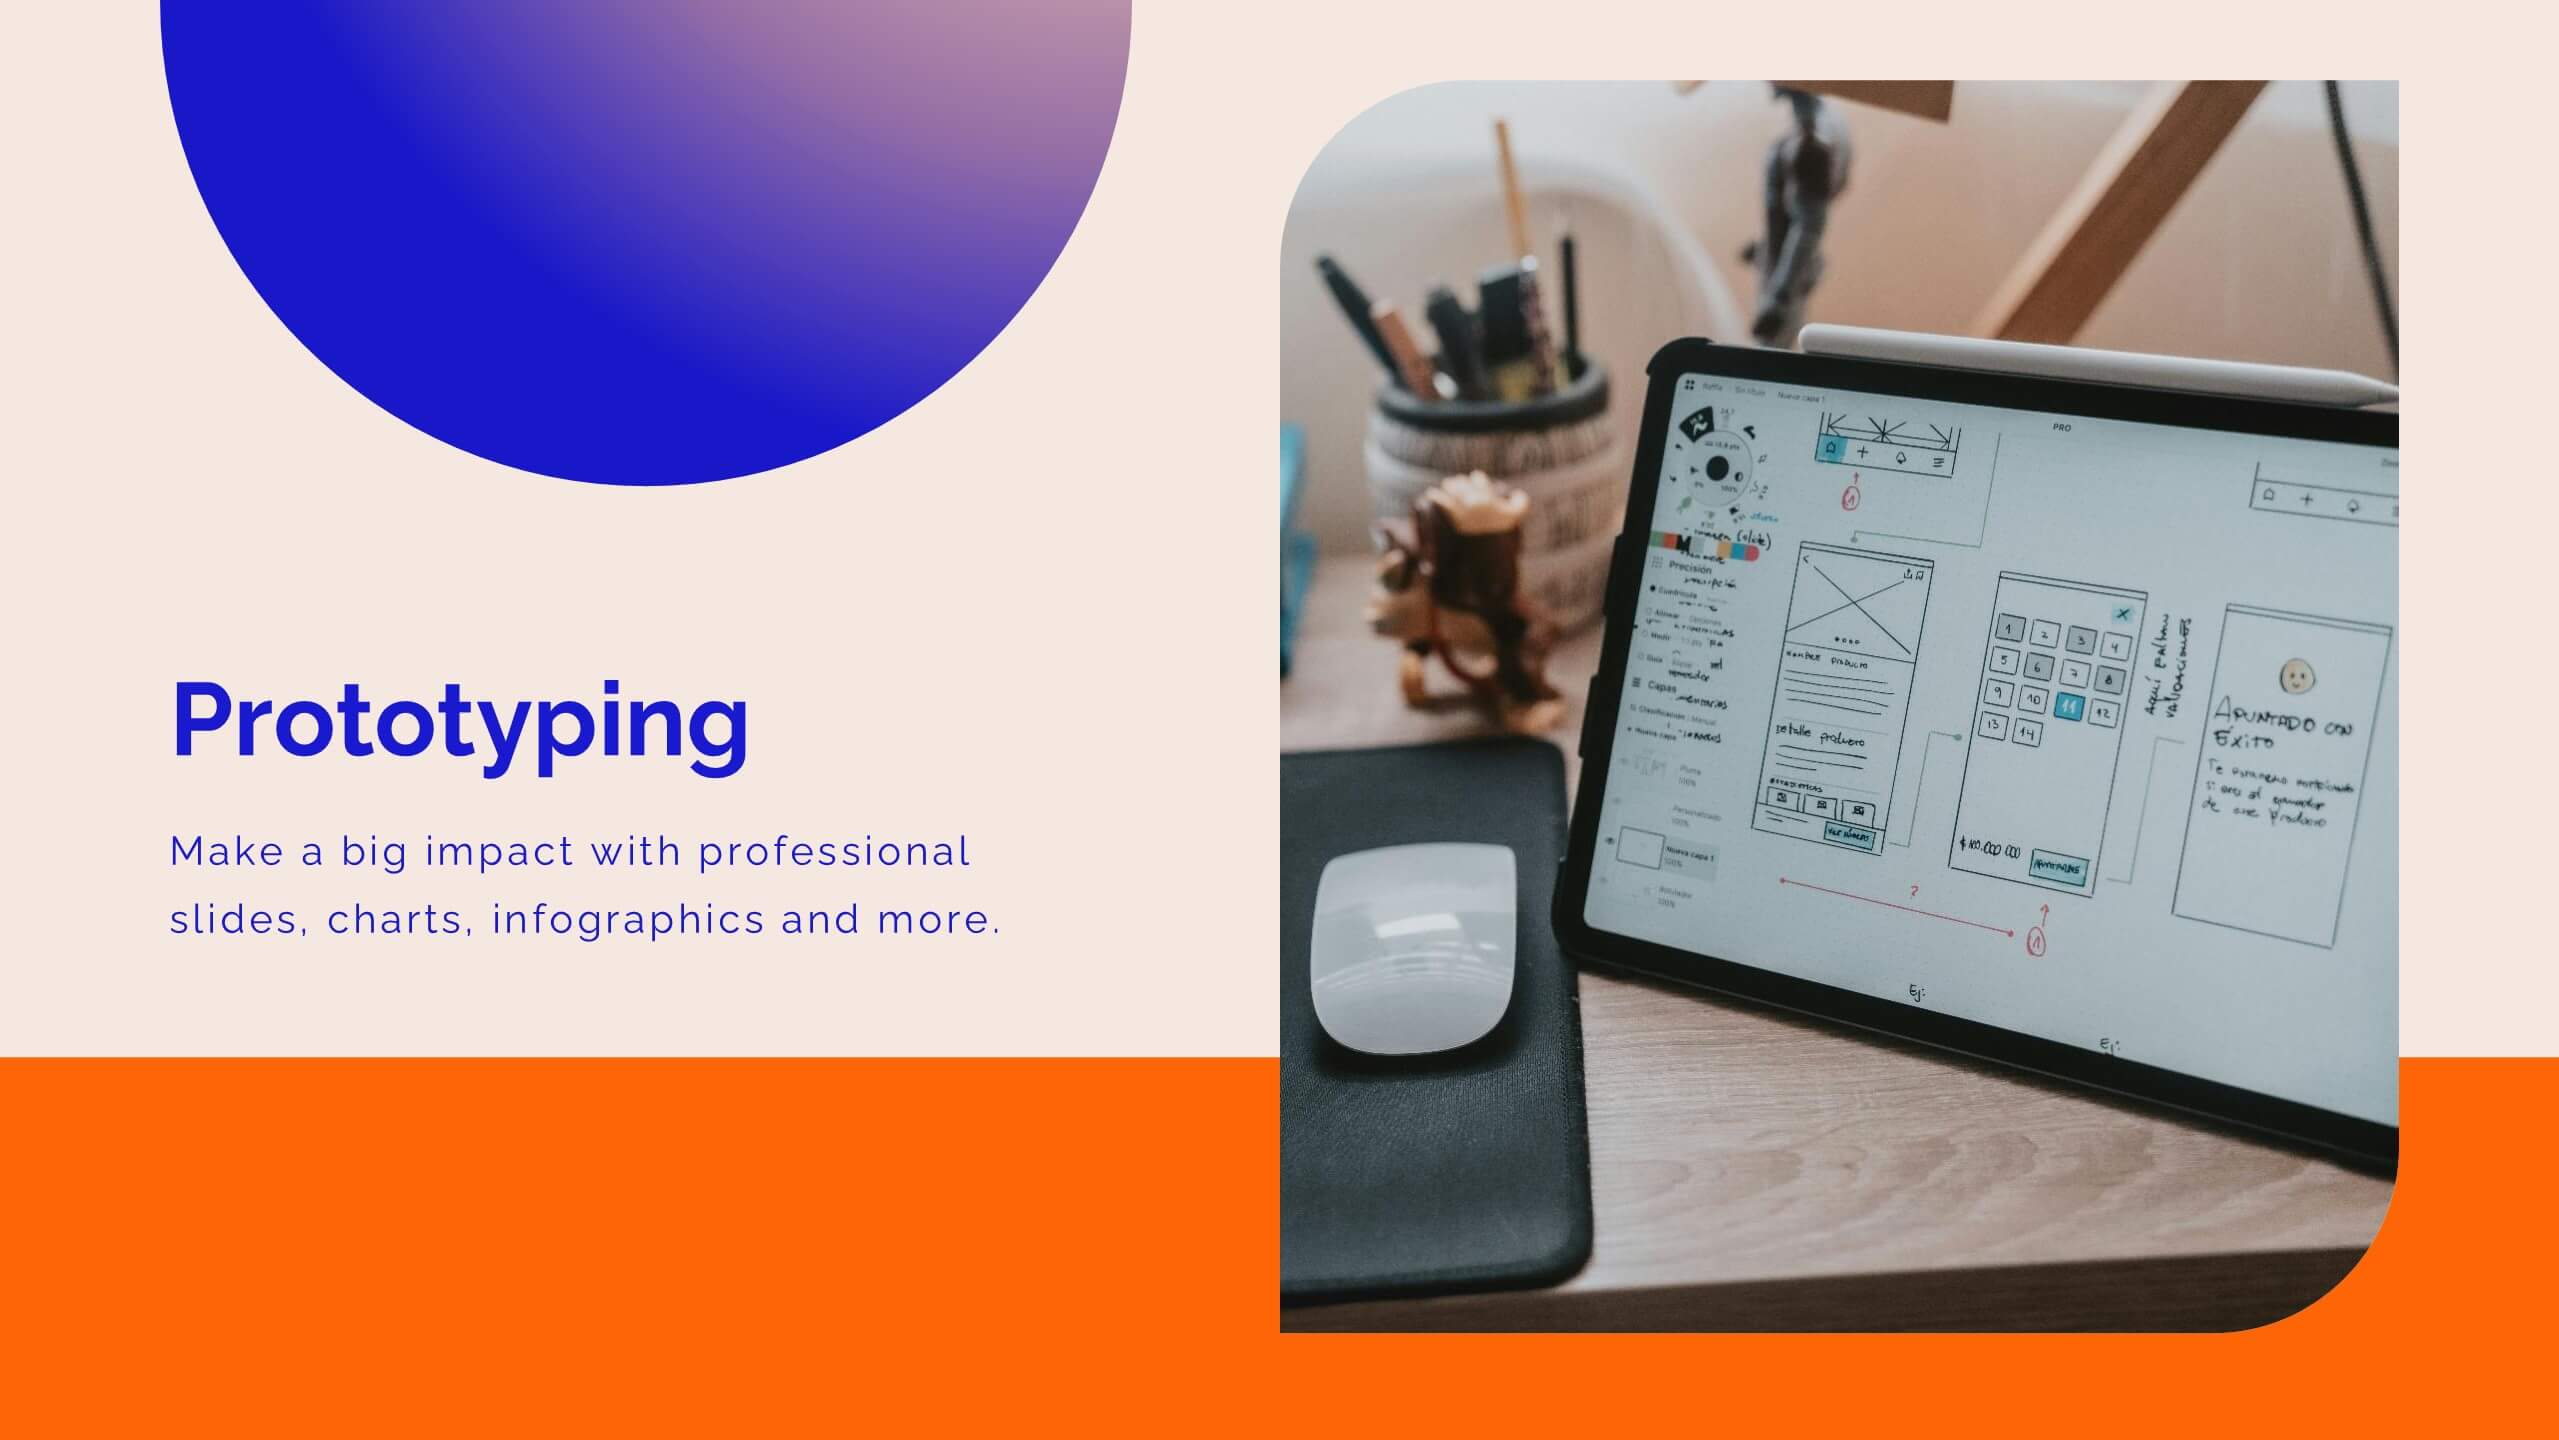
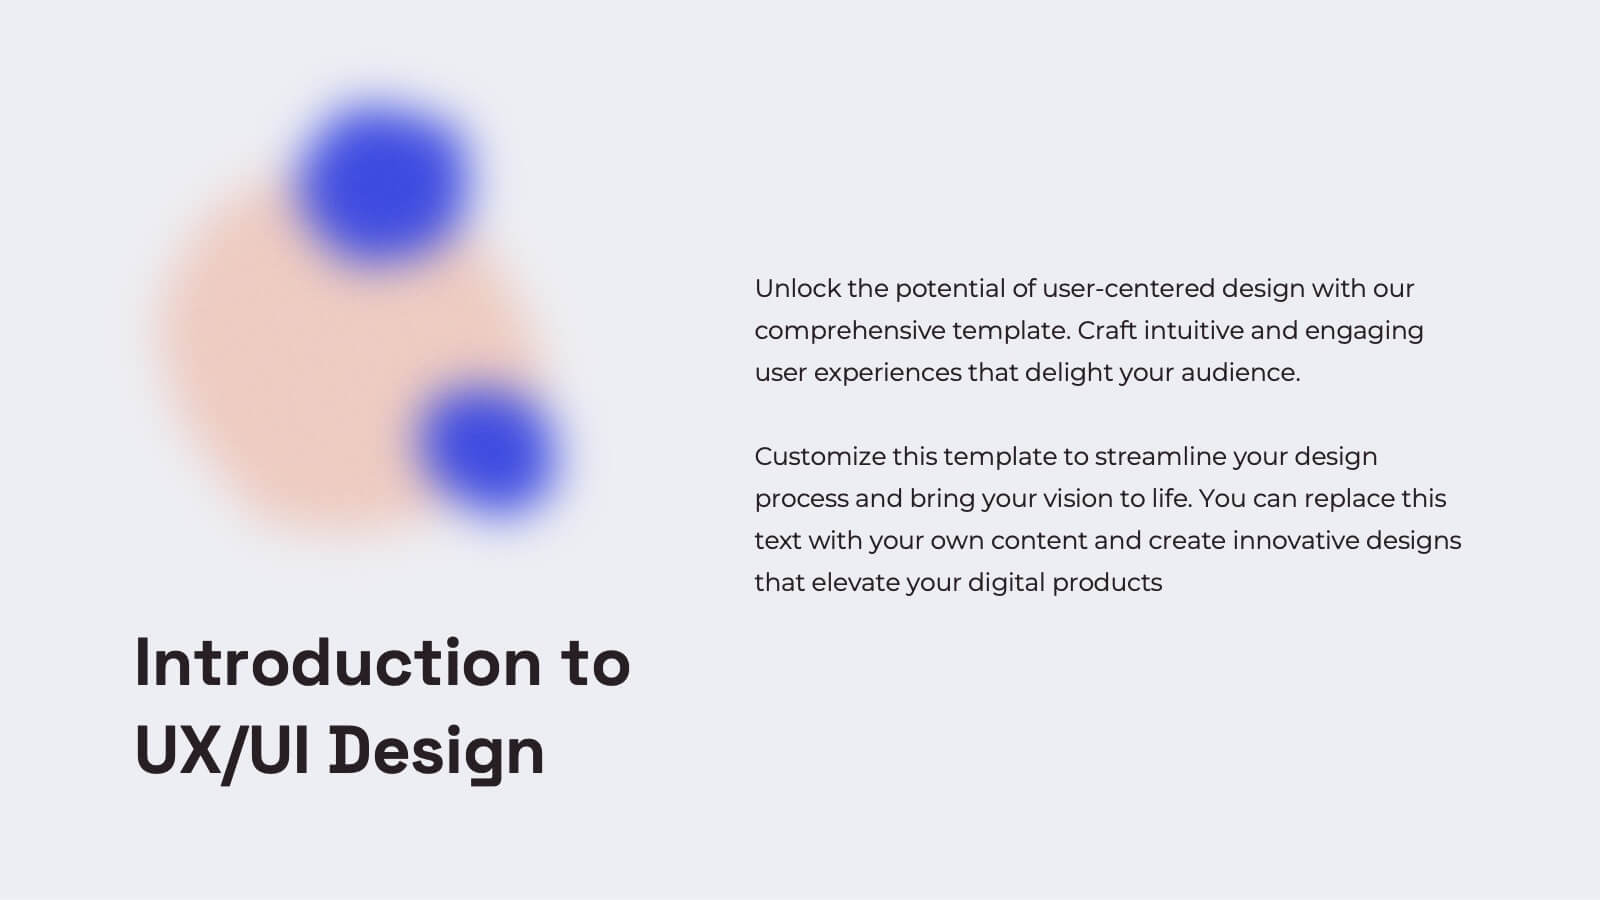
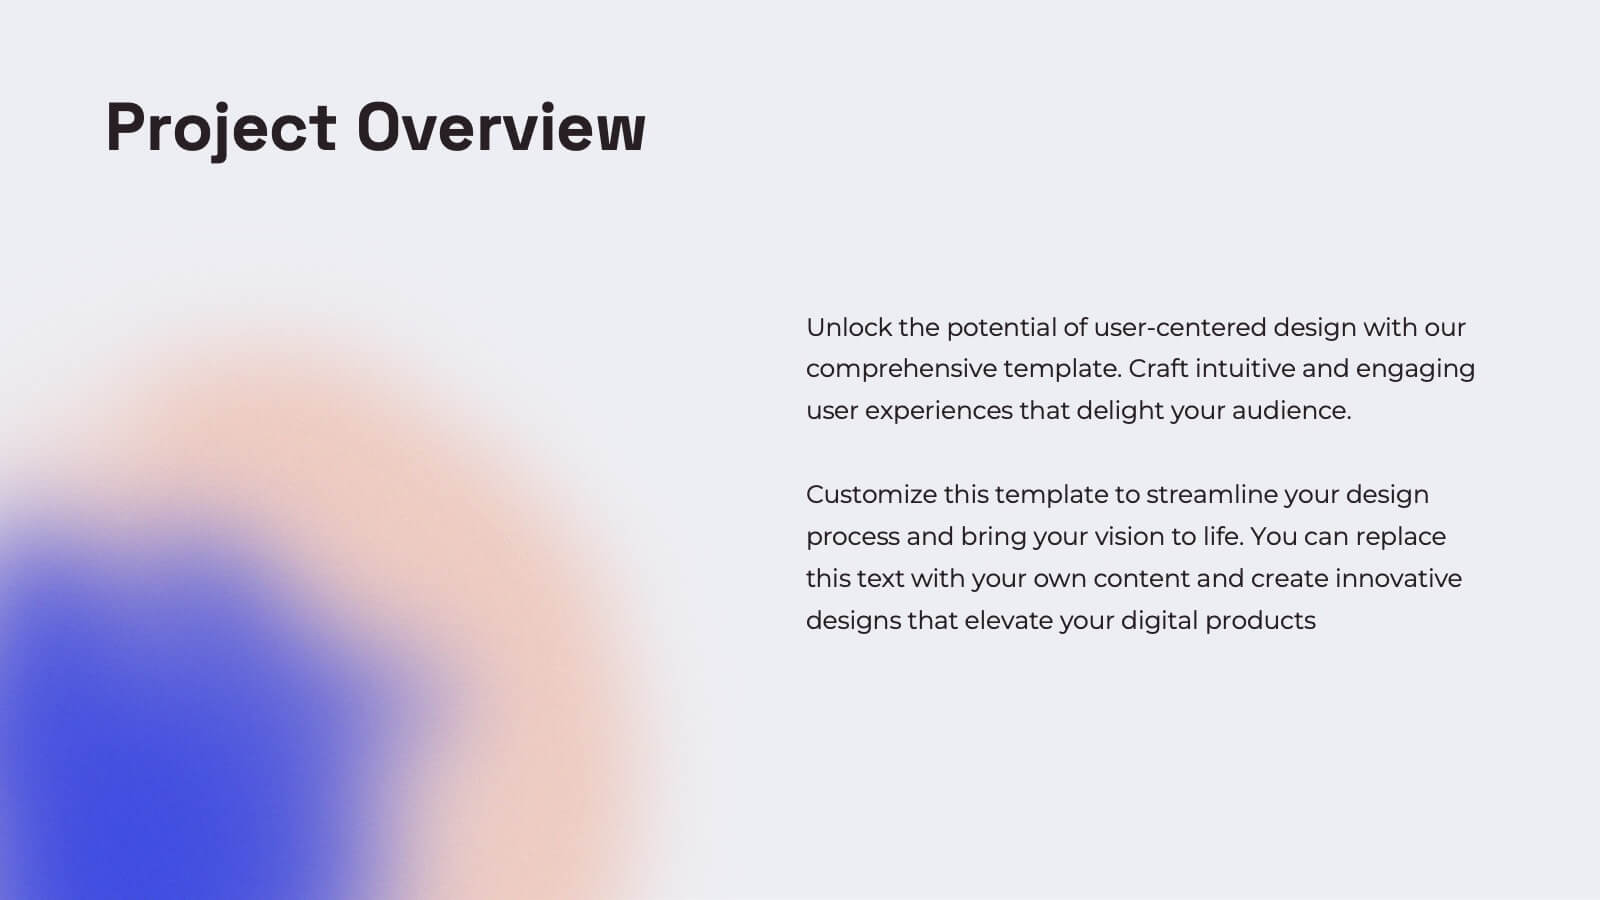
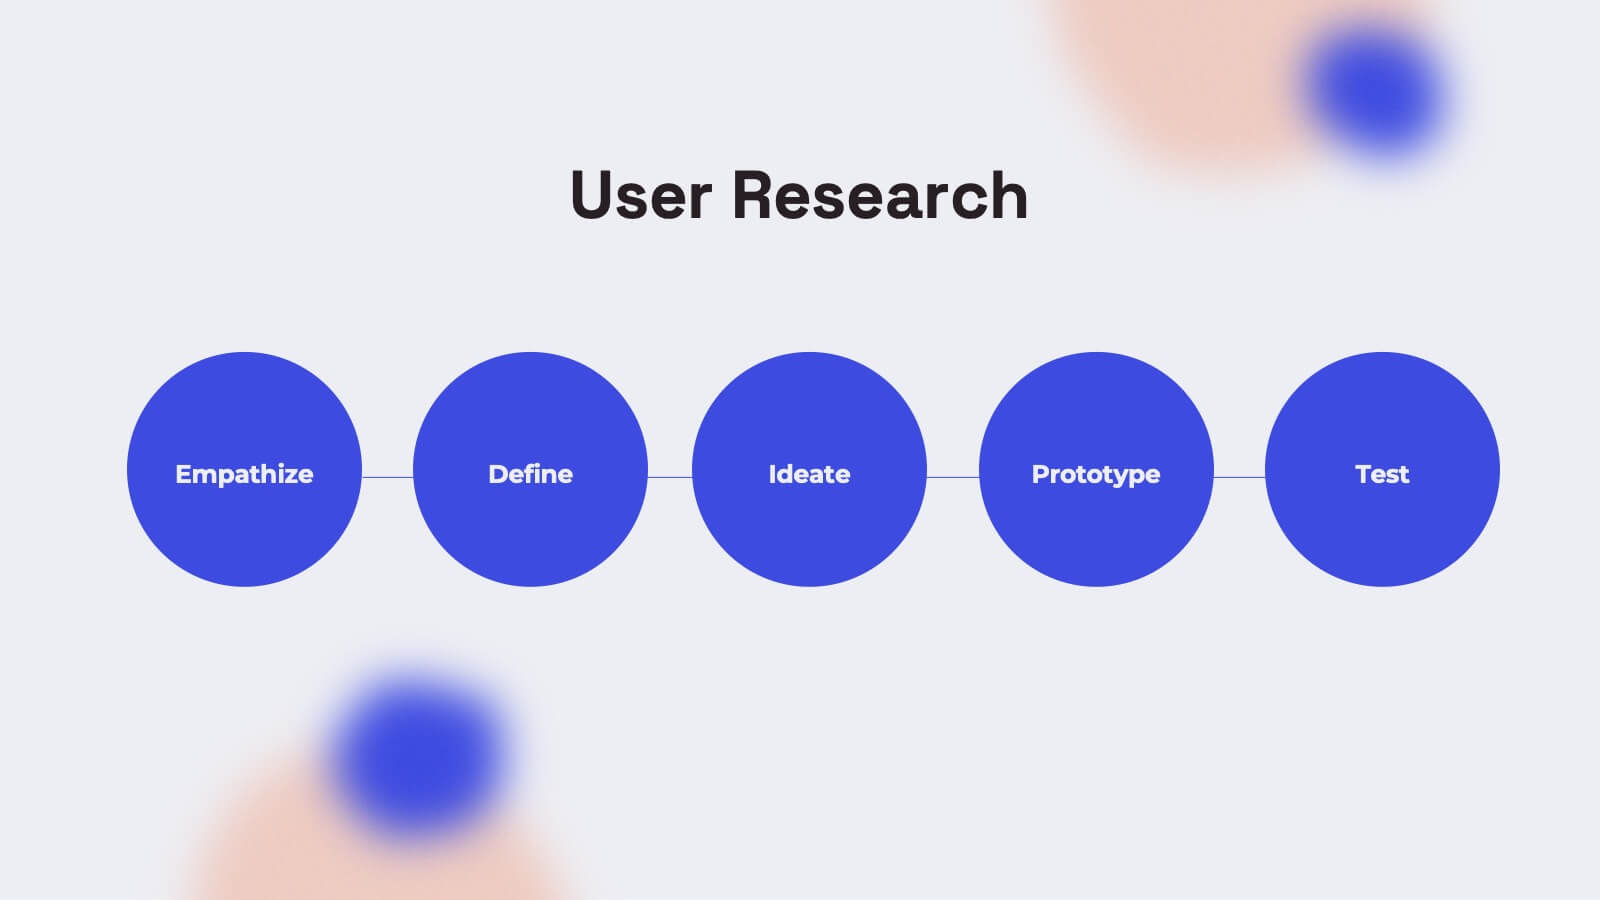
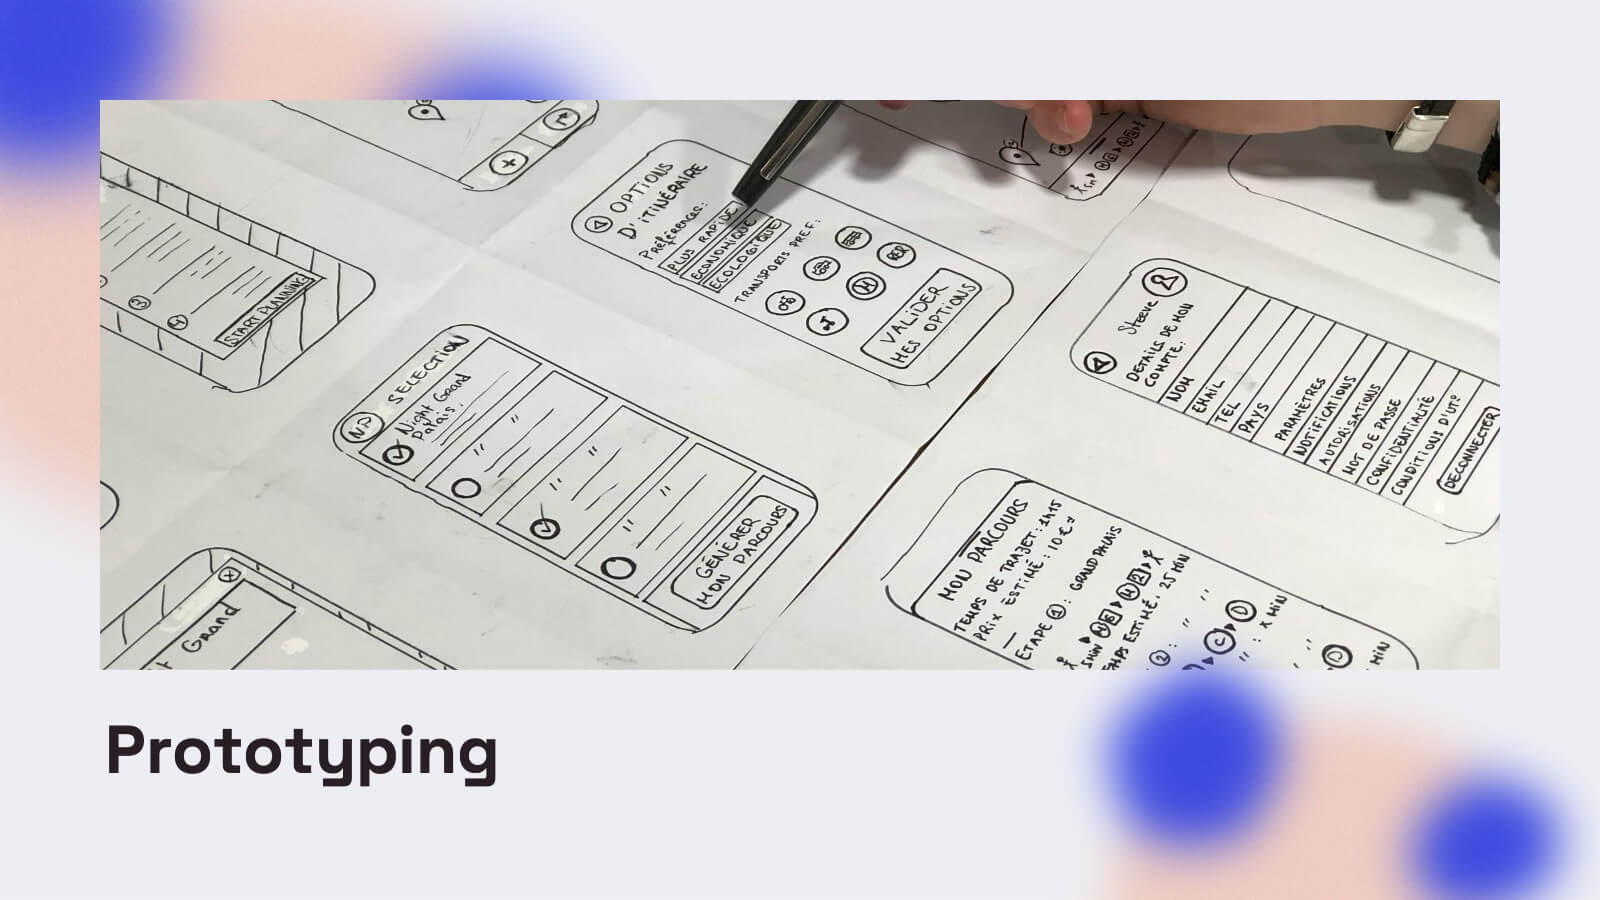
Gemini UX Design Presentation
Enhance your UX presentations with this vibrant and user-friendly template. Designed to cover every aspect of UX design, from user research and personas to wireframes and prototyping, this template ensures a comprehensive and engaging delivery. Its modern design and structured layout make your insights clear and impactful. Compatible with PowerPoint, Keynote, and Google Slides, it's perfect for any platform.


4 slides
Market Research Survey Insights Presentation
Showcase key data from your latest research with this bold, megaphone-themed survey slide. Ideal for presenting percentages and key findings side-by-side, this layout draws attention to market trends, consumer feedback, or audience segmentation. Fully editable in PowerPoint, Keynote, and Google Slides.


5 slides
Online Advertising and SEO Marketing Presentation
Elevate your digital marketing strategy with this engaging infographic template! Designed for clarity, it simplifies online advertising and SEO concepts, covering key metrics, trends, and strategies. Perfect for teams, clients, or stakeholders, it’s fully customizable and compatible with PowerPoint, Keynote, and Google Slides for seamless presentations that captivate and inform.