Energy and Natural Resources Infographics
PowerPoint Template and Google Slides Theme


Features
- 4 Unique slides
- Fully editable and easy to edit in Microsoft Powerpoint, Keynote and Google Slides
- Vertical widescreen layout
- Clean and professional designs
- Export to JPG, PDF or send by email
- Remove from favorites
Powerpoint Template
1 MB
Google Slides Template
External link
Keynote Template
1 MB
Recommend
- Remove from favorites
Powerpoint Template
1 MB
Google Slides Template
External link
Keynote Template
1 MB
6 slides
Sustainability Assets Management Infographic
Sustainability management refers to the strategic planning, implementation, and monitoring of practices that promote environmental, social, and economic sustainability within organizations. This infographic template visually presents key elements and strategies for managing sustainability assets within an organization. Visualize the process of identifying sustainability assets within an organization. This template will allow you to explain how each sustainability asset contributes to the organization's overall value proposition. Incorporate icons or graphics that align with the organization's mission and goals.
- Remove from favorites
Powerpoint Template
1 MB
Google Slides Template
External link
Keynote Template
1 MB
5 slides
RACI Role Assignment Matrix Overview Presentation
Clarify team responsibilities with the RACI Role Assignment Matrix Overview Presentation. This professional template helps define who is Responsible, Accountable, Consulted, and Informed across key project tasks. Perfect for streamlining communication, reducing overlap, and improving accountability. Fully editable in PowerPoint, Canva, and Google Slides.
- Remove from favorites
Powerpoint Template
1 MB
Google Slides Template
External link
Keynote Template
1 MB
6 slides
Brain Vector Infographic
This Brain Vector Infographic is an imaginative tool for presenting complex concepts and ideas in an easy-to-digest visual format. The design employs brain imagery to symbolize various aspects of thought processes, intelligence, brainstorming, or mental health. Its sections are strategically placed to reflect different cognitive areas, making it perfect for educational settings or business workshops focused on innovation. Fully editable and compatible with PowerPoint, Google Slides, and Keynote, this template allows for full customization, from colors to text, adapting to your unique presentation needs. Whether for academic, or personal use, this infographic simplifies conveying intricate information.
- Remove from favorites
Powerpoint Template
1 MB
Google Slides Template
External link
Keynote Template
2 MB
10 slides
Revenue Growth Strategies and Metrics Presentation
Highlight your key success drivers with the Revenue Growth Strategies and Metrics Presentation. This upward arrow-based layout is perfect for showcasing growth phases, financial KPIs, or strategic revenue initiatives. Clean, professional, and fully editable in PowerPoint, Keynote, and Google Slides—ideal for business reviews, sales pitches, and quarterly updates.
- Remove from favorites
Powerpoint Template
1 MB
Google Slides Template
External link
Keynote Template
1 MB
8 slides
Environmental Impact Reporting Presentation
Showcase sustainability data with clarity using the Environmental Impact Reporting Presentation. Perfect for tracking plastic usage, waste trends, and eco-initiatives. The infographic-style visuals highlight four distinct data points with bold icons and labeled callouts. Fully editable in PowerPoint, Keynote, and Google Slides—ideal for ESG reports, audits, or environmental awareness campaigns.
- Remove from favorites
Powerpoint Template
1 MB
Google Slides Template
External link
Keynote Template
1 MB
5 slides
Financial Credit Card Management Presentation
Present credit card processes, workflows, or customer engagement steps with this clean, step-by-step infographic layout. Featuring five clearly defined stages, icons, and space for key insights, it’s perfect for visualizing application journeys, fraud prevention, or usage optimization. Great for banks, fintech presentations, or financial coaching. Fully editable in PowerPoint, Keynote, and Google Slides.
- Remove from favorites
Powerpoint Template
1 MB
Google Slides Template
External link
Keynote Template
1 MB
8 slides
Mission Objectives and Long-Term Goals Presentation
Clearly define your roadmap with this Mission Objectives and Long-Term Goals presentation. This clean, step-by-step layout is ideal for showcasing strategic milestones, vision pillars, or future goals. Each point is visually aligned for logical progression, making it perfect for planning sessions. Fully editable in Canva, PowerPoint, or Google Slides.
- Remove from favorites
Powerpoint Template
1 MB
Google Slides Template
External link
Keynote Template
1 MB
7 slides
Communication Skills Infographics
Effective communication skills are essential in every aspect of life, including personal relationships, professional relationships, and societal interactions. This template provides you with a great resource for presenting your communication skills. This can help you present your ideas in an effective way. This template features customizable slide designs and graphics allowing you plenty of room to add your own content. The format makes this presentation easy to follow and understand visually as it focuses on what are the most important aspects of delivering effective communication skills.
- Remove from favorites
Powerpoint Template
1 MB
Google Slides Template
External link
Keynote Template
1 MB
4 slides
High-Performance Team Collaboration Presentation
Showcase teamwork, trust, and synergy with this bold, interconnected arms graphic. Ideal for illustrating roles, partnerships, or team frameworks, this infographic is perfect for leadership, HR, or corporate strategy slides. Fully customizable in PowerPoint, Keynote, and Google Slides.
- Remove from favorites
Powerpoint Template
1 MB
Google Slides Template
External link
Keynote Template
2 MB
10 slides
Checklist and Action Plan List Presentation
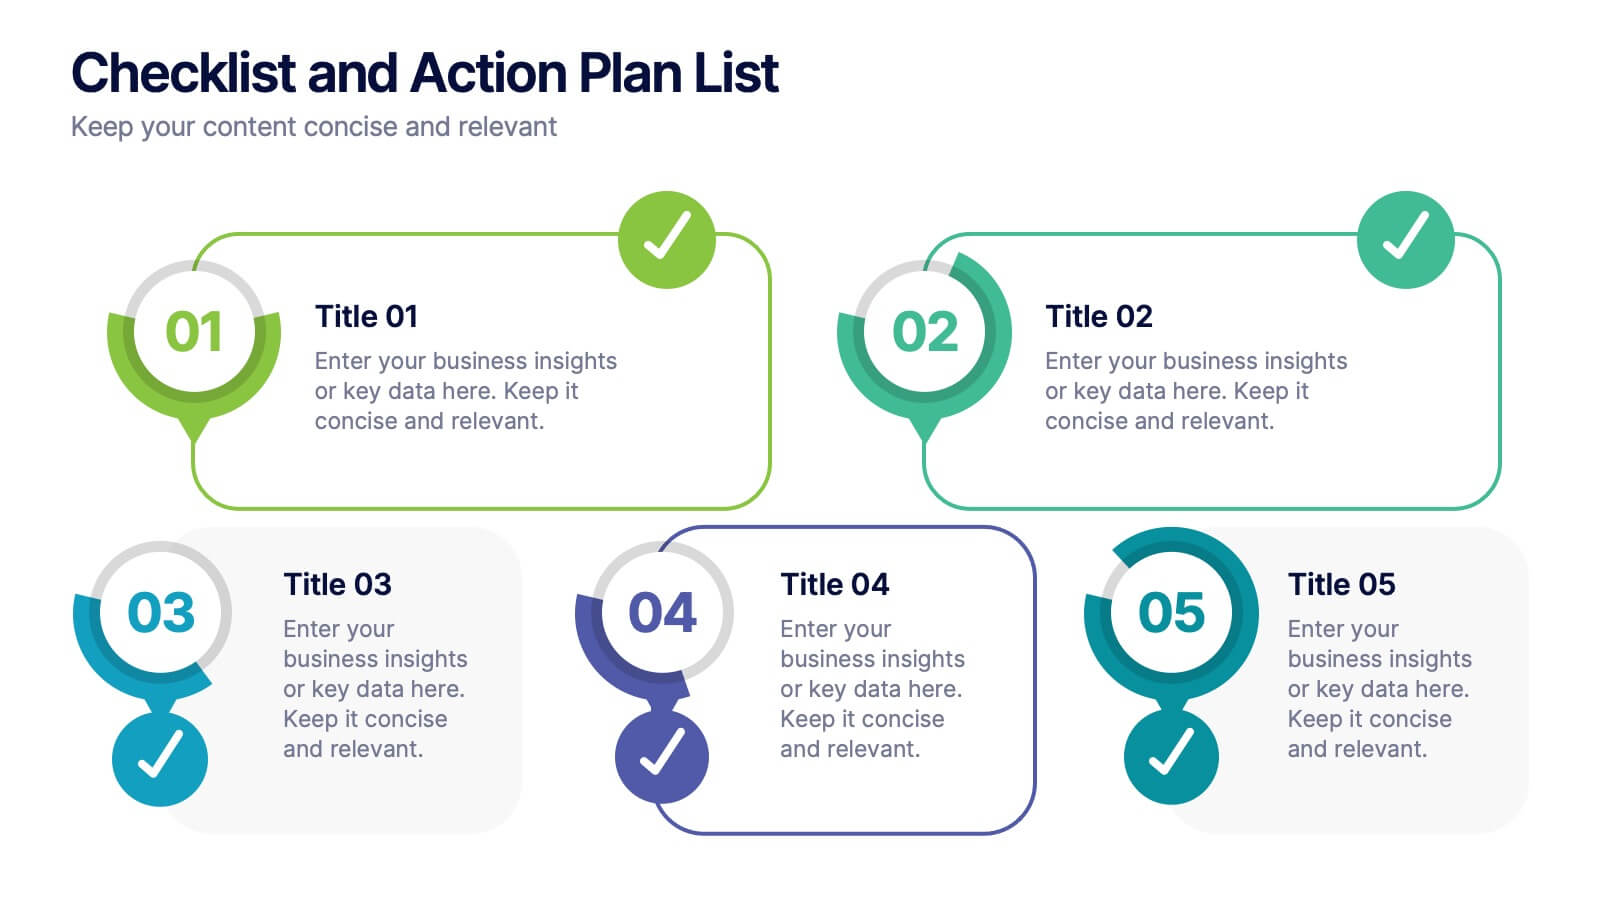
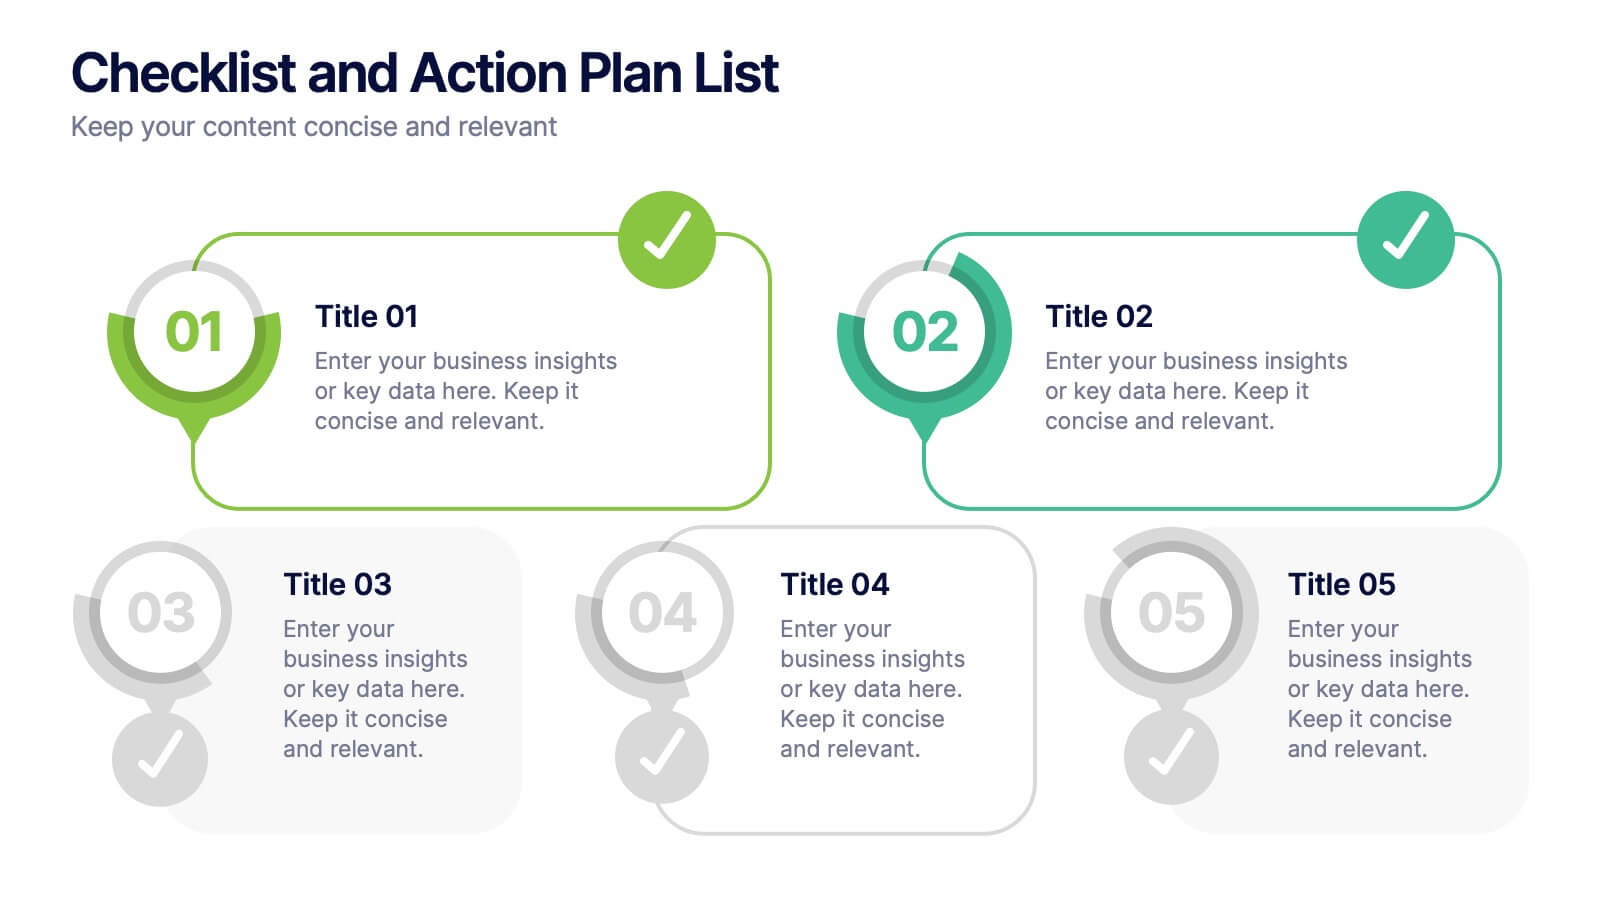
Stay organized and achieve goals efficiently with this checklist and action plan template. Designed for task tracking, project management, and strategic planning, it provides a clear visual structure for prioritizing tasks. Perfect for professionals and teams aiming for productivity. Compatible with PowerPoint, Keynote, and Google Slides for seamless editing and presentation.
- Remove from favorites
Powerpoint Template
1 MB
Google Slides Template
External link
Keynote Template
2 MB
10 slides
Competitive Advantage Blue Ocean Strategy Presentation
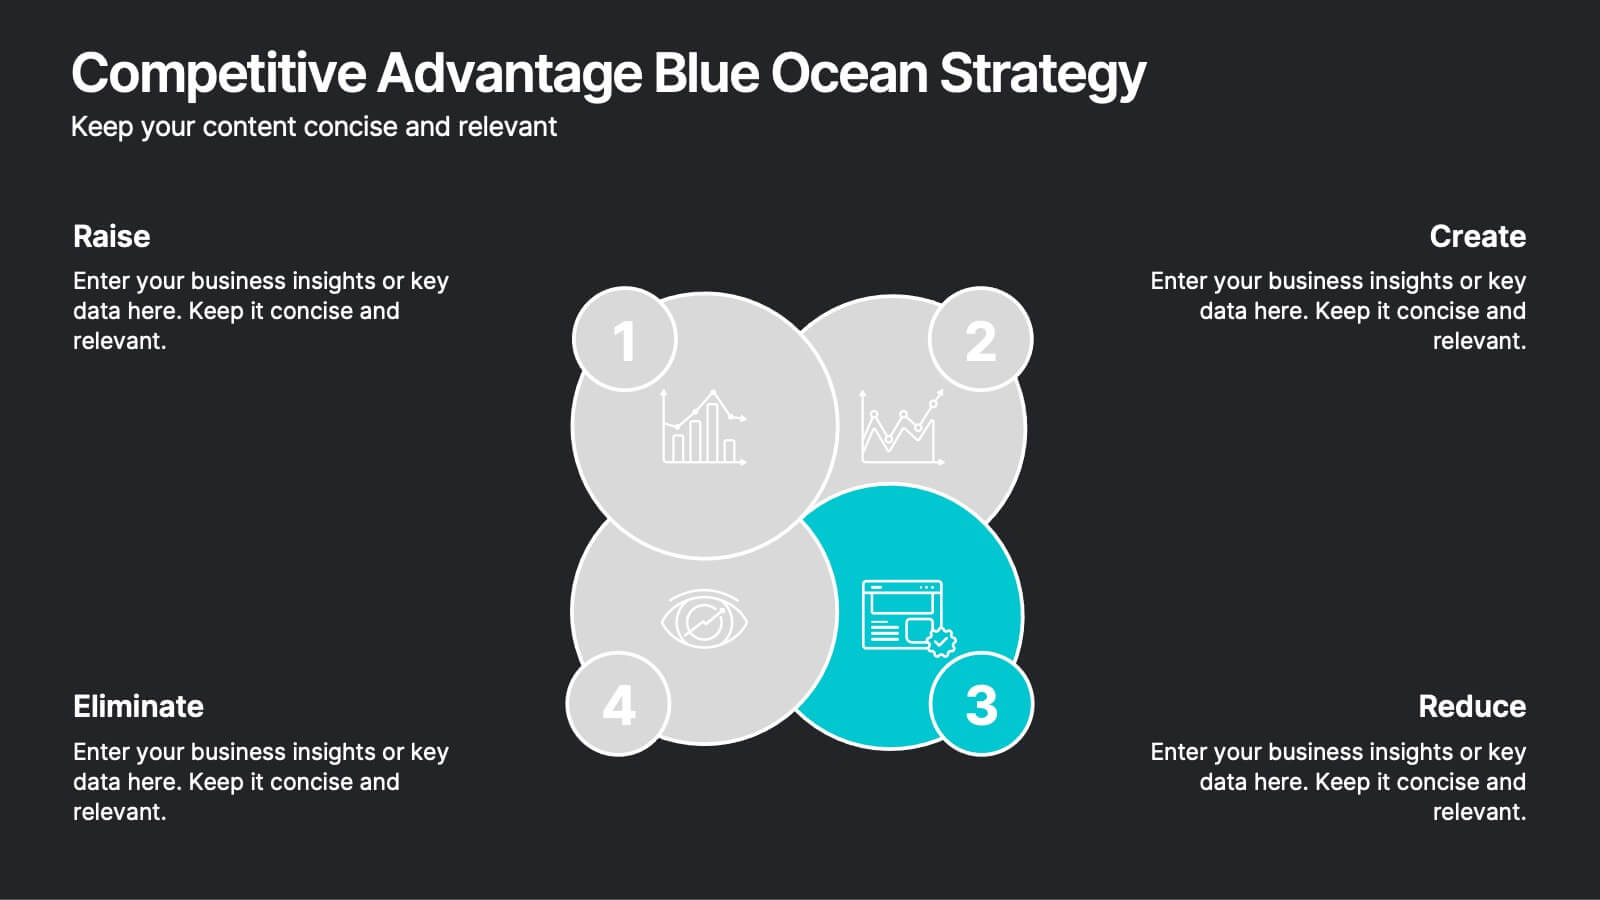
Gain a competitive edge with this Blue Ocean Strategy presentation template! Designed to help businesses identify new market opportunities, this layout focuses on the four key actions: eliminate, reduce, raise, and create. Perfect for strategic planning, innovation workshops, and business growth discussions. Fully customizable and compatible with PowerPoint, Keynote, and Google Slides.
- Remove from favorites
Powerpoint Template
1 MB
Google Slides Template
External link
Keynote Template
2 MB
6 slides
Sales Team Infographic
The series presented showcases various slide templates tailored for enhancing sales team strategies and communication. Each slide is crafted to assist sales professionals in detailing team structures, sales goals, performance metrics, and strategic initiatives effectively. Utilizing vibrant color blocks and streamlined design elements, these templates make complex sales data approachable and engaging, facilitating clear and impactful presentations. The collection is designed with adaptability in mind, incorporating elements that can be easily customized to fit different team needs and company branding. These include comparative layouts for benchmarking, timeline formats for showcasing sales cycles, and diagrammatic representations for visualizing sales processes and results. Perfect for internal meetings, sales training sessions, and stakeholder presentations, these templates serve as essential tools for sales leaders to convey their team’s progress, celebrate wins, and strategize for future sales endeavors.
- Remove from favorites
Powerpoint Template
1 MB
Google Slides Template
External link
Keynote Template
2 MB
5 slides
United States States Outline Presentation
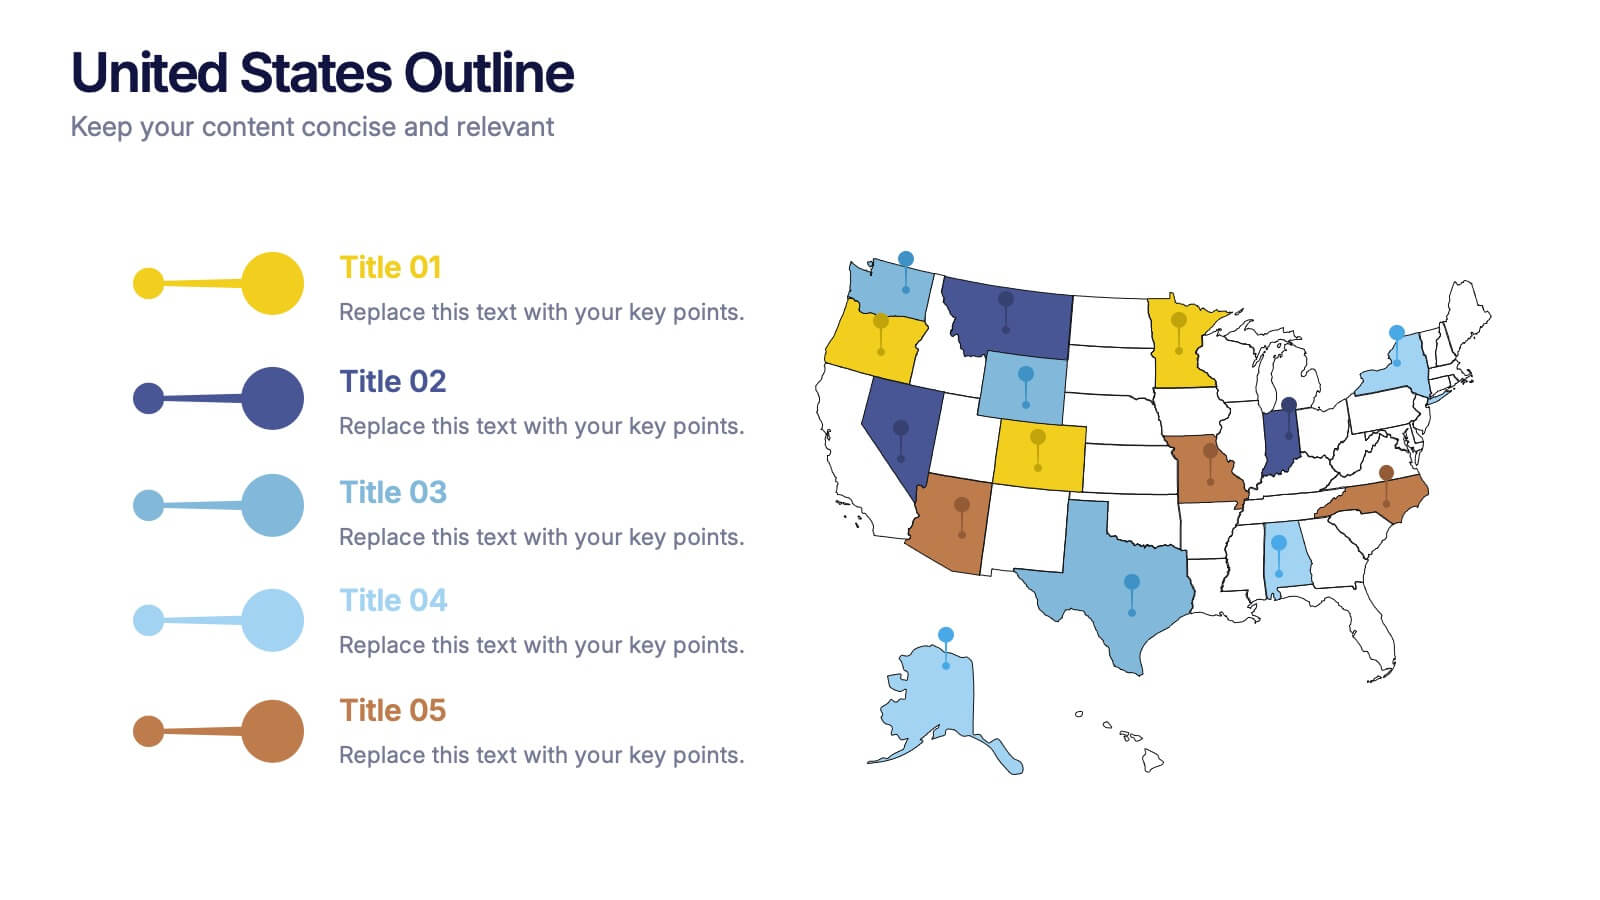
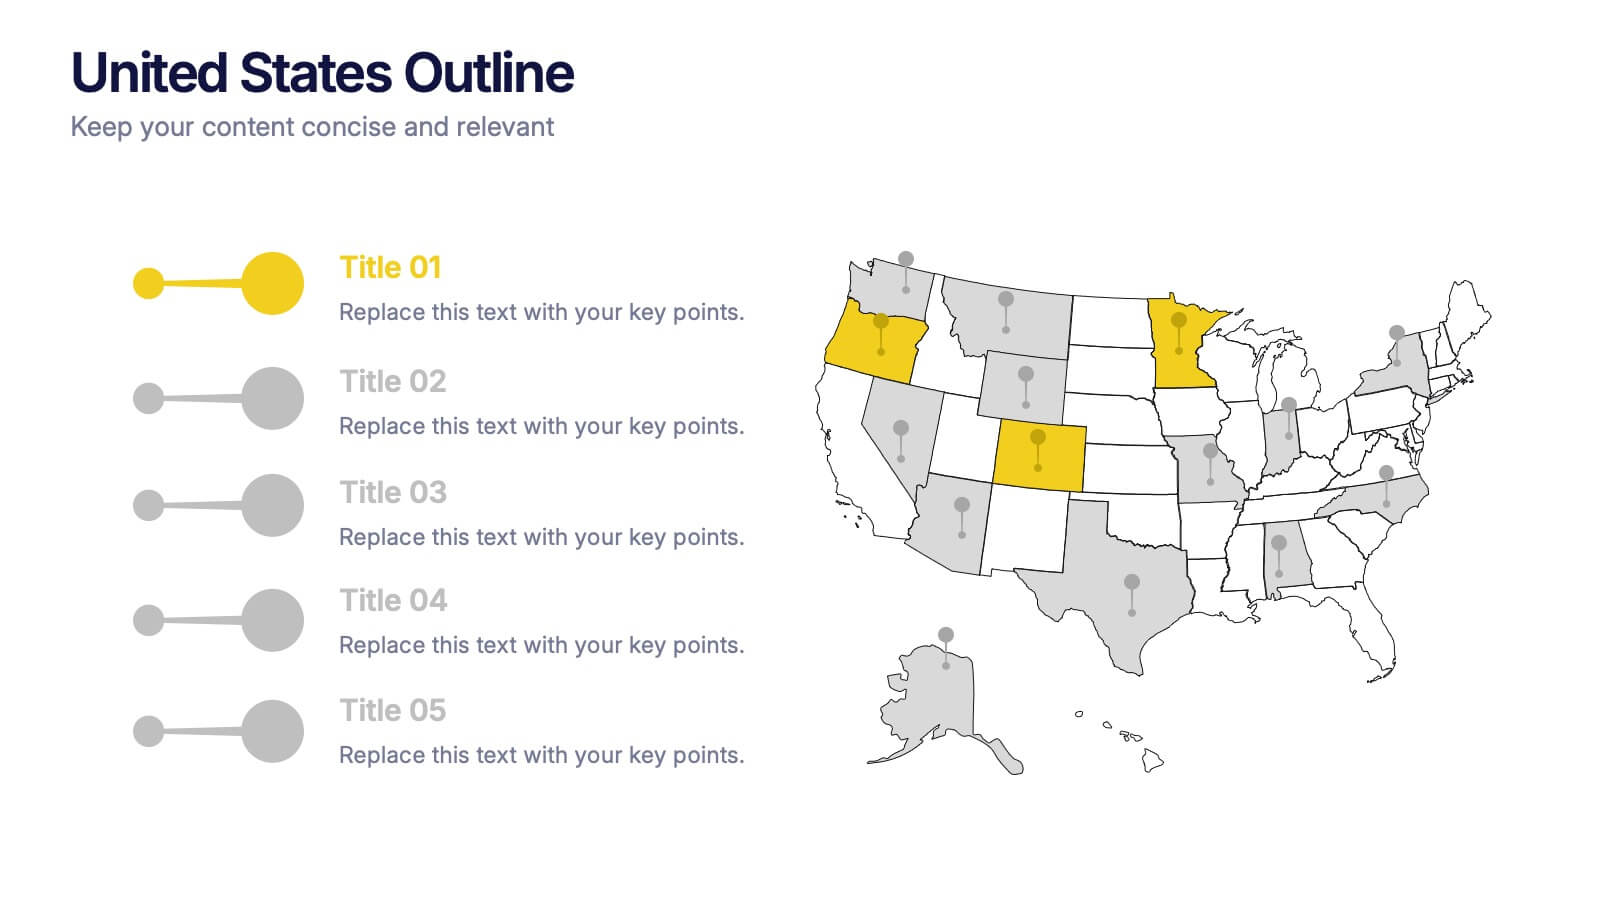
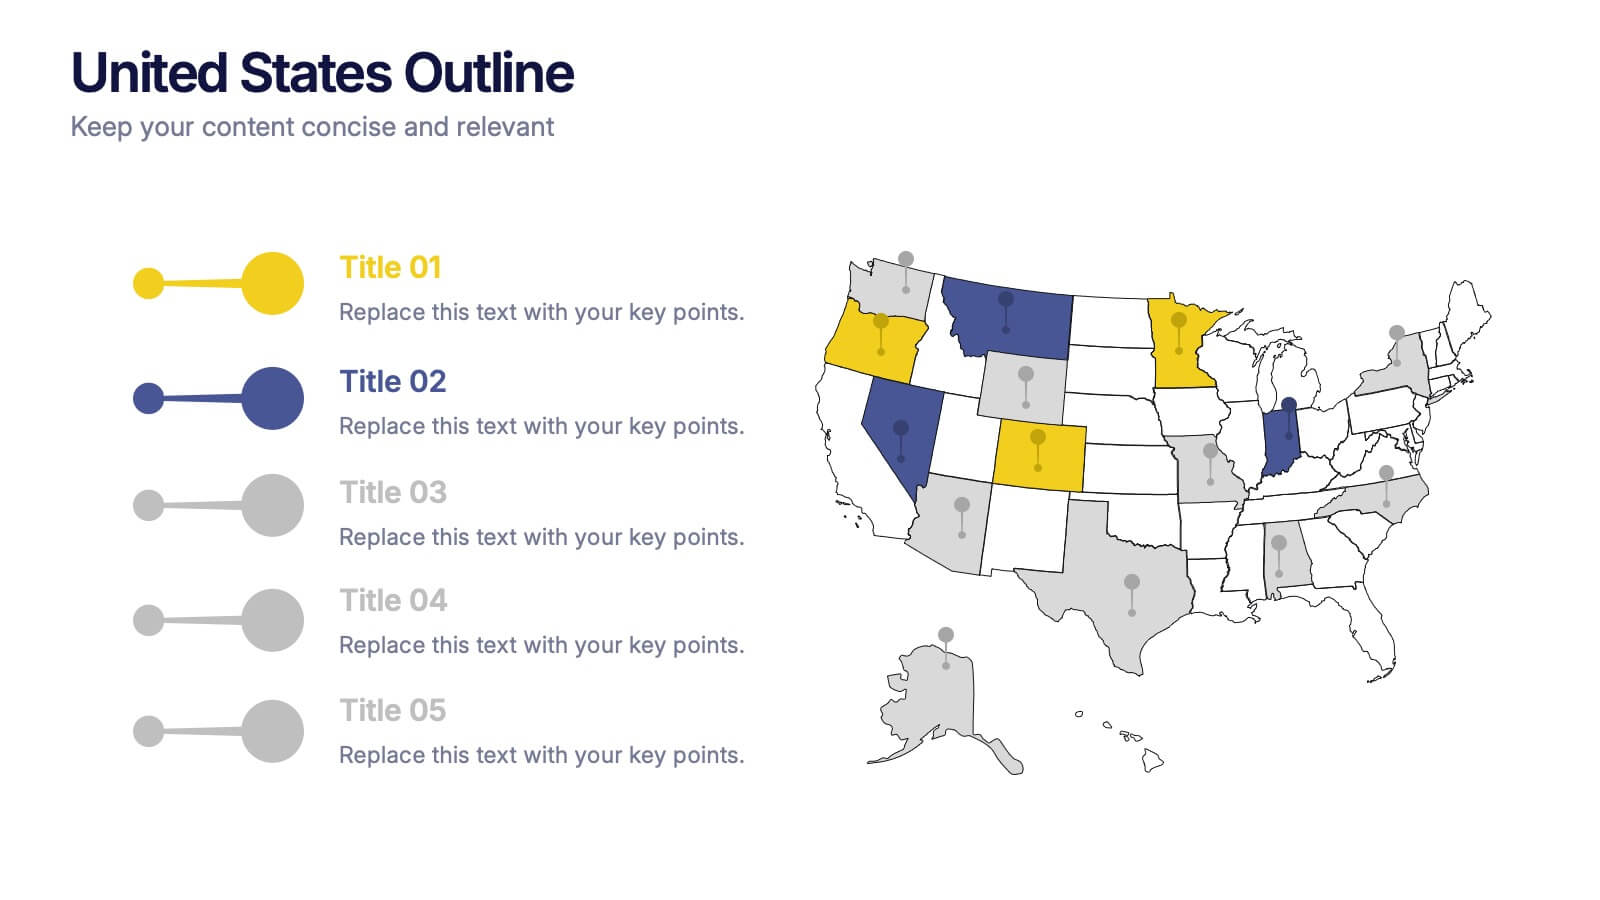
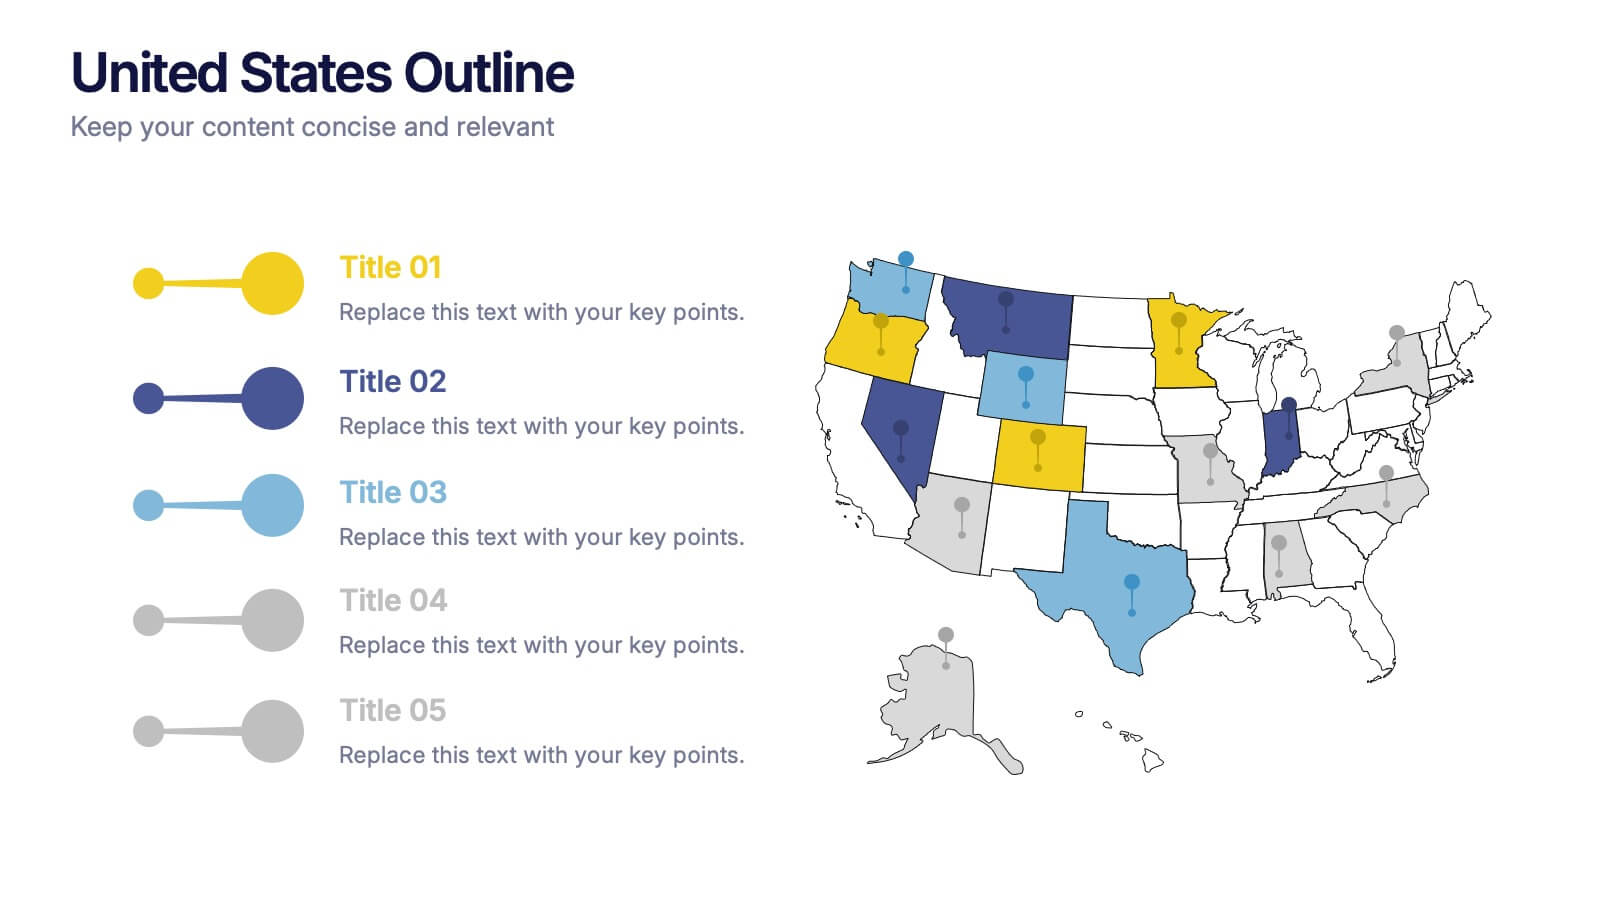
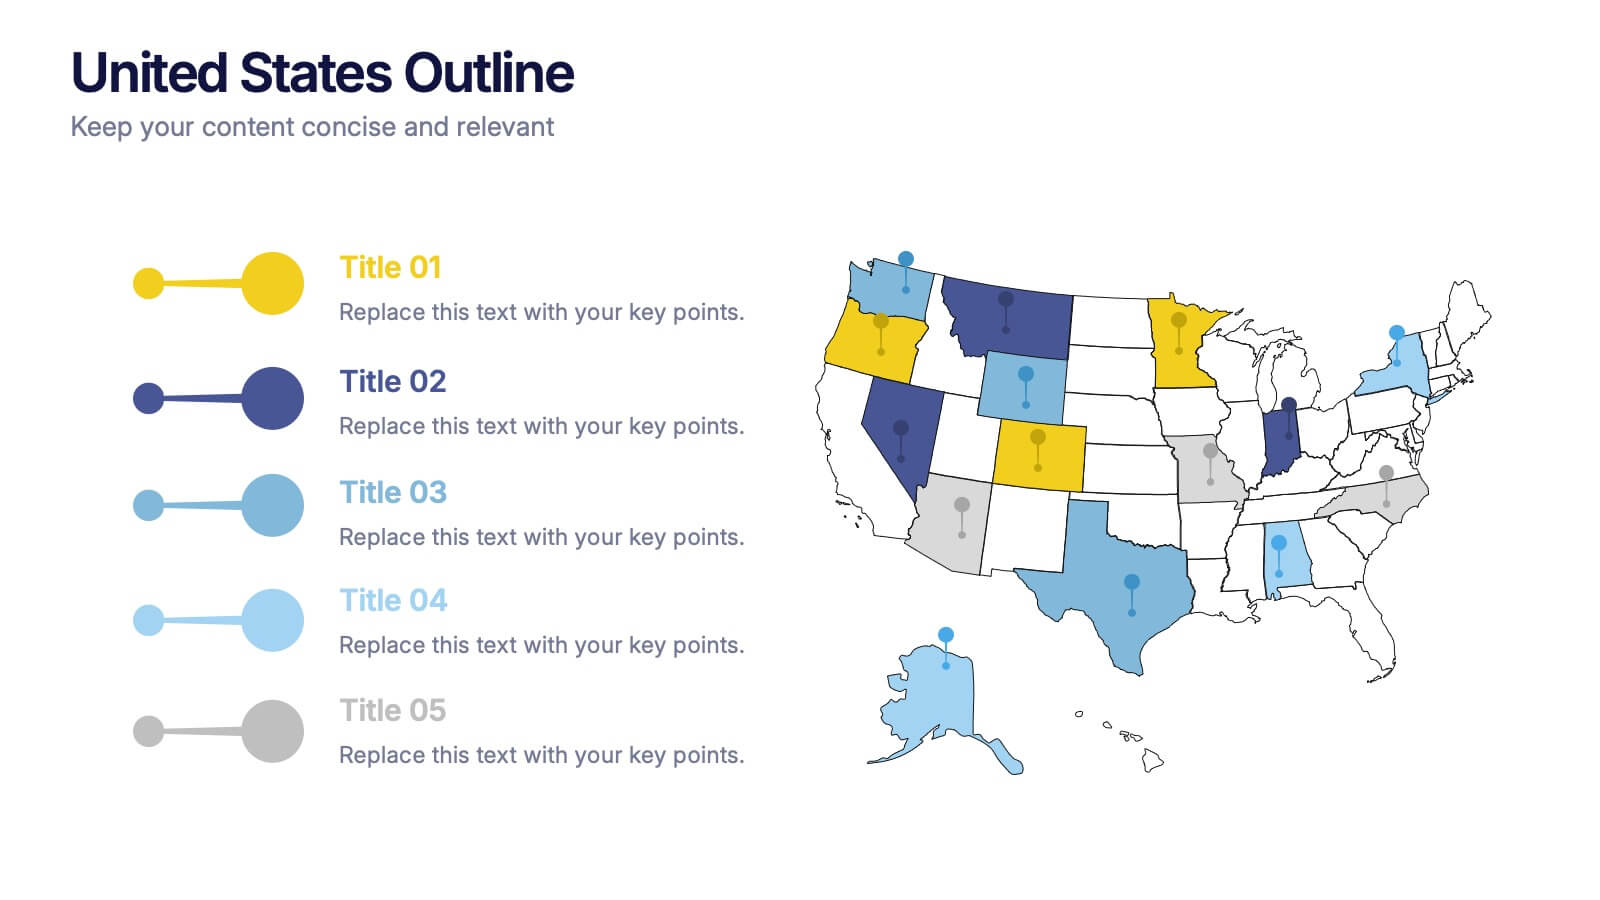
Make your data pop with a vibrant, easy-to-read snapshot of U.S. state insights. This presentation helps you highlight regional trends, compare performance, and showcase key information using a clean state-by-state outline. Perfect for reports, geography topics, or analytics. Fully compatible with PowerPoint, Keynote, and Google Slides.
- Remove from favorites
Powerpoint Template
1 MB
Google Slides Template
External link
Keynote Template
1 MB
7 slides
McKinsey 7S Weakness Infographic
The McKinsey 7S Model is a management framework developed by consulting firm McKinsey & Company. Embark on an analytical journey through organizational dynamics with our McKinsey 7S Weakness Infographic. This visually appealing and informative template is your map to navigating weaknesses and transforming them into growth opportunities. Compatible with Powerpoint, Keynote, and Google Slides. This infographic is designed to be your guide to dissecting your organization's weaknesses through the renowned McKinsey 7S framework. Leverage these insights to drive positive change and attain excellence!
- Remove from favorites
Powerpoint Template
1 MB
Google Slides Template
External link
Keynote Template
1 MB
5 slides
Political Campaign Strategies Infographics
A political campaign refers to the organized efforts of individuals or groups to promote a particular candidate, political party, or specific political agenda during an election or to raise awareness and support for a specific issue. These infographic templates are designed to showcase various strategies and techniques used in political campaigns. This is perfect for politicians, campaign managers, or anyone involved in the political arena who wants to present their campaign strategies. Its customizable layout and eye-catching design enable politicians to communicate their campaign, engage with their audience, and rally support for their goals.
- Remove from favorites
Powerpoint Template
1 MB
Google Slides Template
External link
Keynote Template
1 MB
5 slides
Organizational Decision Support System Presentation
Visually showcase team alignment and consensus using the Organizational Decision Support System slide. This layout features a row of team icons paired with "Yes"/"No" speech bubbles, making it perfect for illustrating decision outcomes, vote breakdowns, or approval processes. Easily editable in PowerPoint, Keynote, and Google Slides.
- Remove from favorites
Powerpoint Template
1 MB
Google Slides Template
External link
Keynote Template
1 MB
5 slides
History in Science Infographics
The history in science refers to the development of scientific knowledge throughout human history. These Infographics can be used to visualize and simplify complex scientific concepts and discoveries in a historical context. This can help students and others interested in science understand the evolution of scientific theories and breakthroughs over time, and how they have shaped our understanding of the world. These infographics use a variety of visual elements, such as timelines, graphs, illustrations, and icons, to tell a compelling story about the history of science. Compatible with Powerpoint, Keynote, and Google Slides.


