


Features
- 5 Unique slides
- Fully editable and easy to edit in Microsoft Powerpoint, Keynote and Google Slides
- 16:9 widescreen layout
- Clean and professional designs
- Export to JPG, PDF or send by email


Do you have any questions?
Recommend


7 slides
Pricing Comparison Table Infographic
Dive into the strategic world of pricing with our intricately designed pricing table infographic. Imbued with the trustworthiness of blue, the crisp clarity of white, the optimism of yellow, and the urgency of red, our template visualizes pricing strategies in an engaging manner. Furnished with detailed infographics, distinct icons, and adaptable image placeholders, it translates complex pricing data into an easy-to-grasp format. Seamlessly crafted for Powerpoint, Keynote, or Google Slides. A vital asset for business analysts, marketers, sales professionals, or any brand strategizing its pricing model. Engage your audience; let every slide be a value proposition.


4 slides
To-Do Lists and Task Management Presentation
Stay organized and boost productivity with the To-Do Lists and Task Management Presentation. This sleek layout features vertical note-style columns that are perfect for displaying tasks, priorities, or checklists in a structured format. Ideal for project timelines, personal goals, or team deliverables. Each list area includes customizable titles, checkmarks, and space for key points. Fully editable in PowerPoint, Keynote, and Google Slides—perfect for visual task tracking across presentations.


5 slides
Strategic Planning with Foundational Pillars Presentation
Define the structure behind your strategic vision with the Strategic Planning with Foundational Pillars presentation. This template showcases four strong pillars beneath a classical pediment, symbolizing the stability and balance of your business strategy. Each pillar represents a core principle—perfect for themes like leadership, values, operations, or goals. Clean, modern, and entirely editable in PowerPoint, Keynote, and Google Slides, this visual works great for executive briefings, annual plans, or business consulting pitches.


6 slides
Porter's Five Forces Management Infographic
Porter's Five Forces is a framework, that helps businesses understand the attractiveness and profitability of an industry by examining five key forces that shape its competitive landscape. These infographic templates provide a visually appealing and concise overview of Porter's Five Forces framework. They are designed to help businesses and professionals analyze the competitive dynamics of an industry and make informed strategic decisions. By using this to help your audience understand the forces that shape industry competitiveness, they can identify potential threats and opportunities to make informed decisions, and gain a competitive edge.


5 slides
SWOT Analysis Infographics
SWOT analysis is a strategic planning tool used to assess the strengths, weaknesses, opportunities, and threats of an individual, organization, or project. These infographics are powerful visual tools that allow you to present comprehensive SWOT analysis in a clear and impactful way. Whether preparing a business presentation, strategic planning session, or educational material, this template provides a visually engaging format to showcase the key aspects of a SWOT analysis. The customizable features of the template allow you to tailor it to your specific industry ensuring that your SWOT analysis is presented in a concise, and impactful manner.


5 slides
Agile Project Roadmap Presentation
Visualize your quarterly project plans with clarity using this Agile roadmap slide. Designed with a horizontal layout for Q1 to Q4, this infographic includes three workstreams and color-coded bars to represent initiatives or sprints. Icons provide quick visual cues for different teams or objectives. Ideal for agile teams, product managers, or project leads who need a clean, editable layout. Compatible with PowerPoint, Keynote, and Google Slides.


21 slides
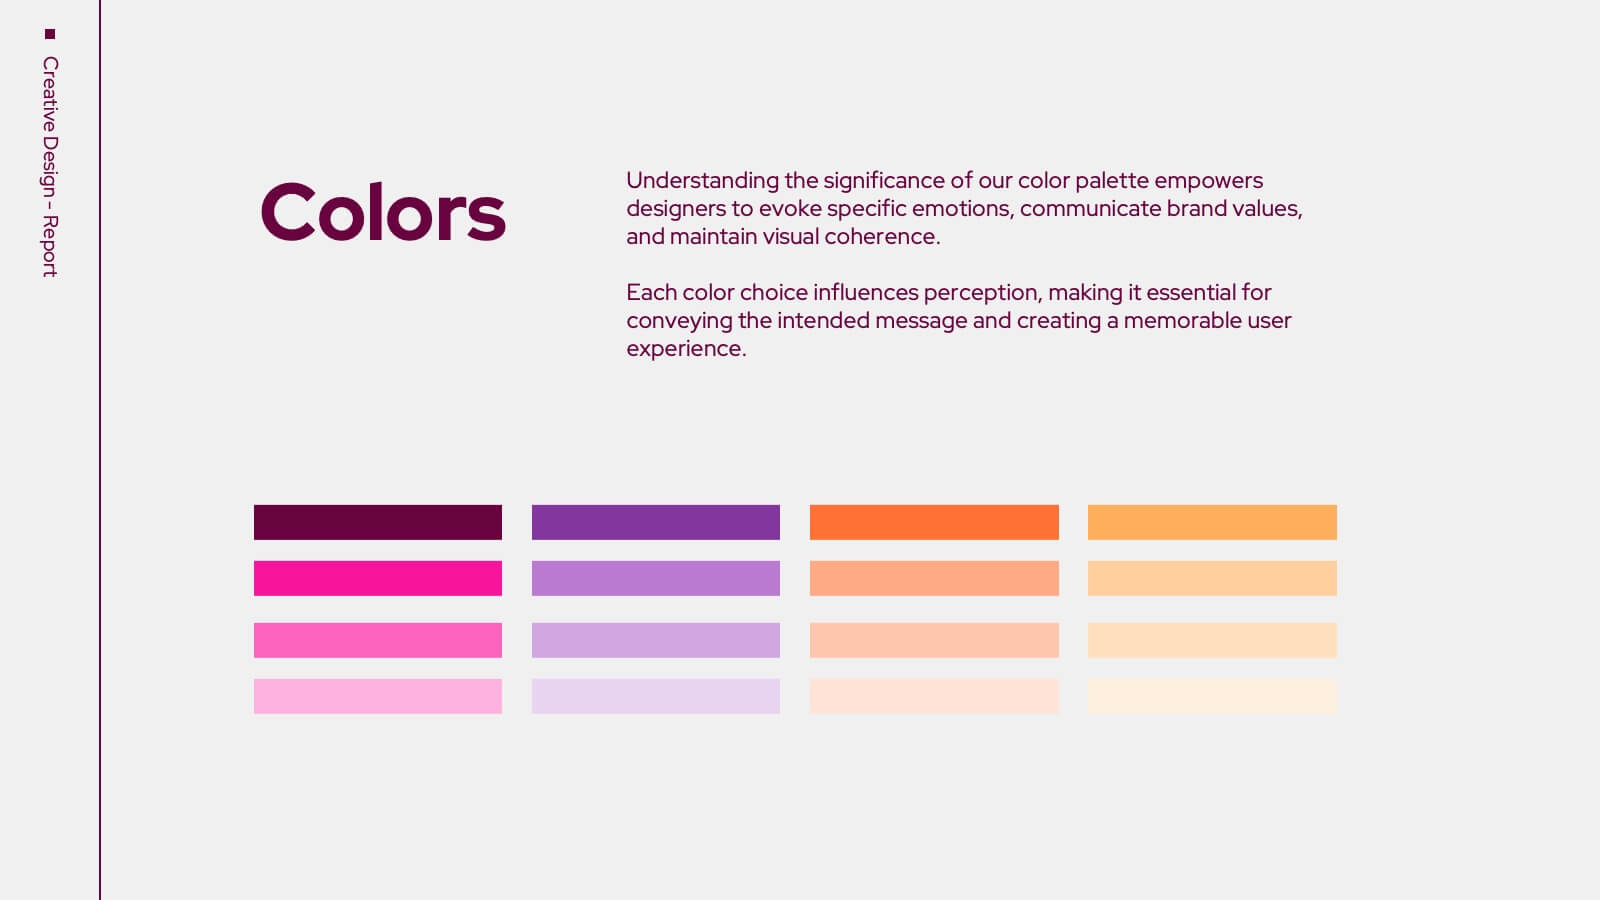
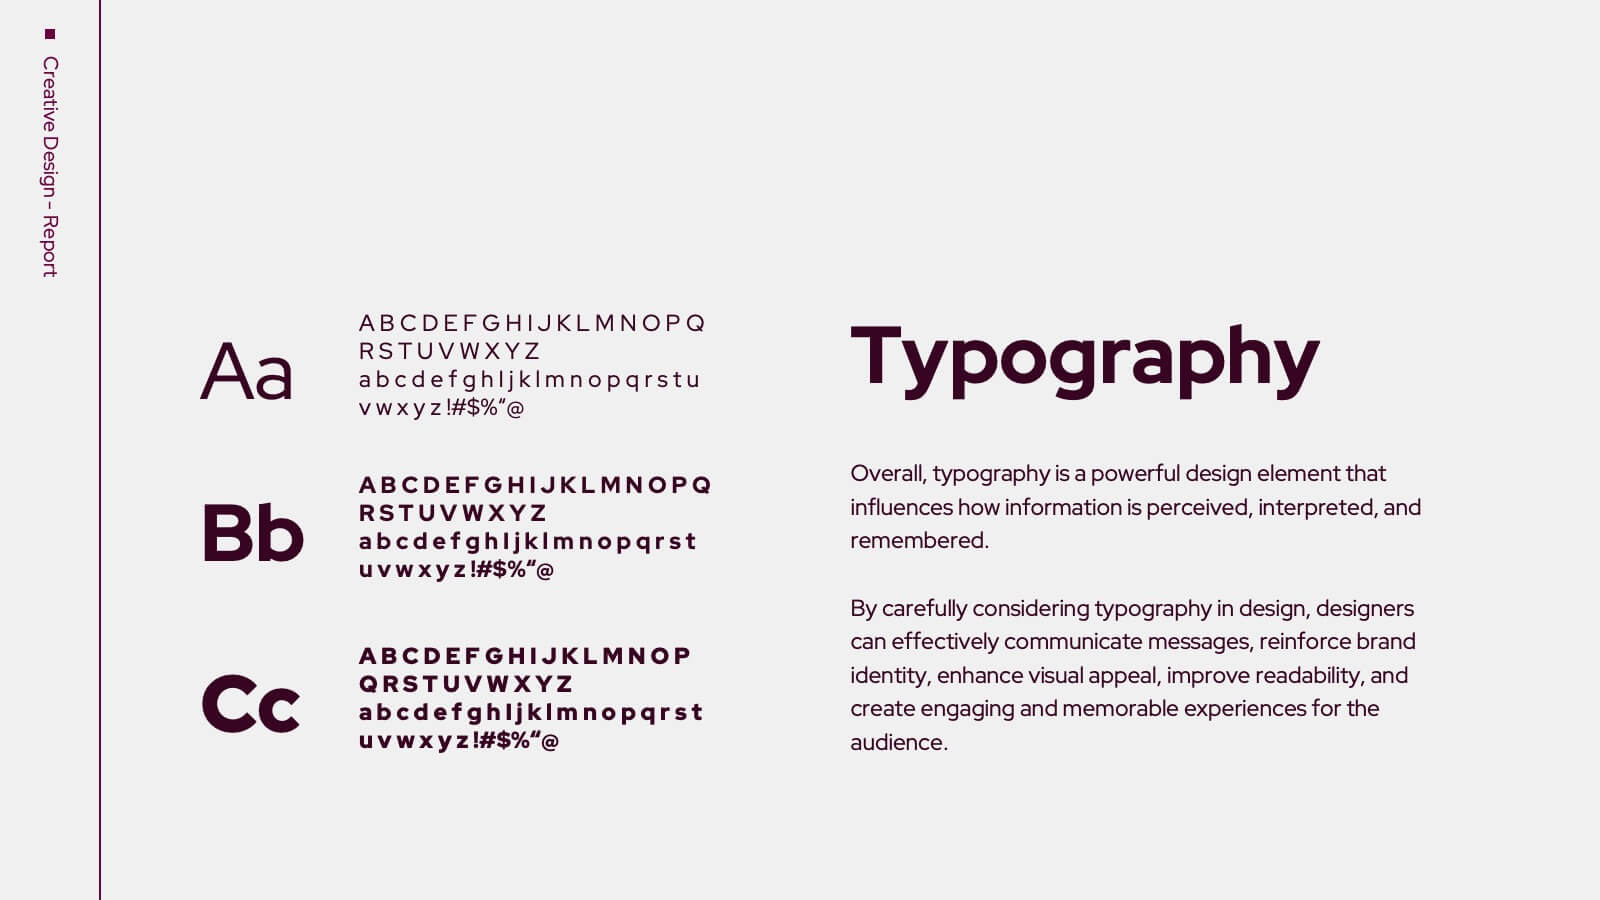
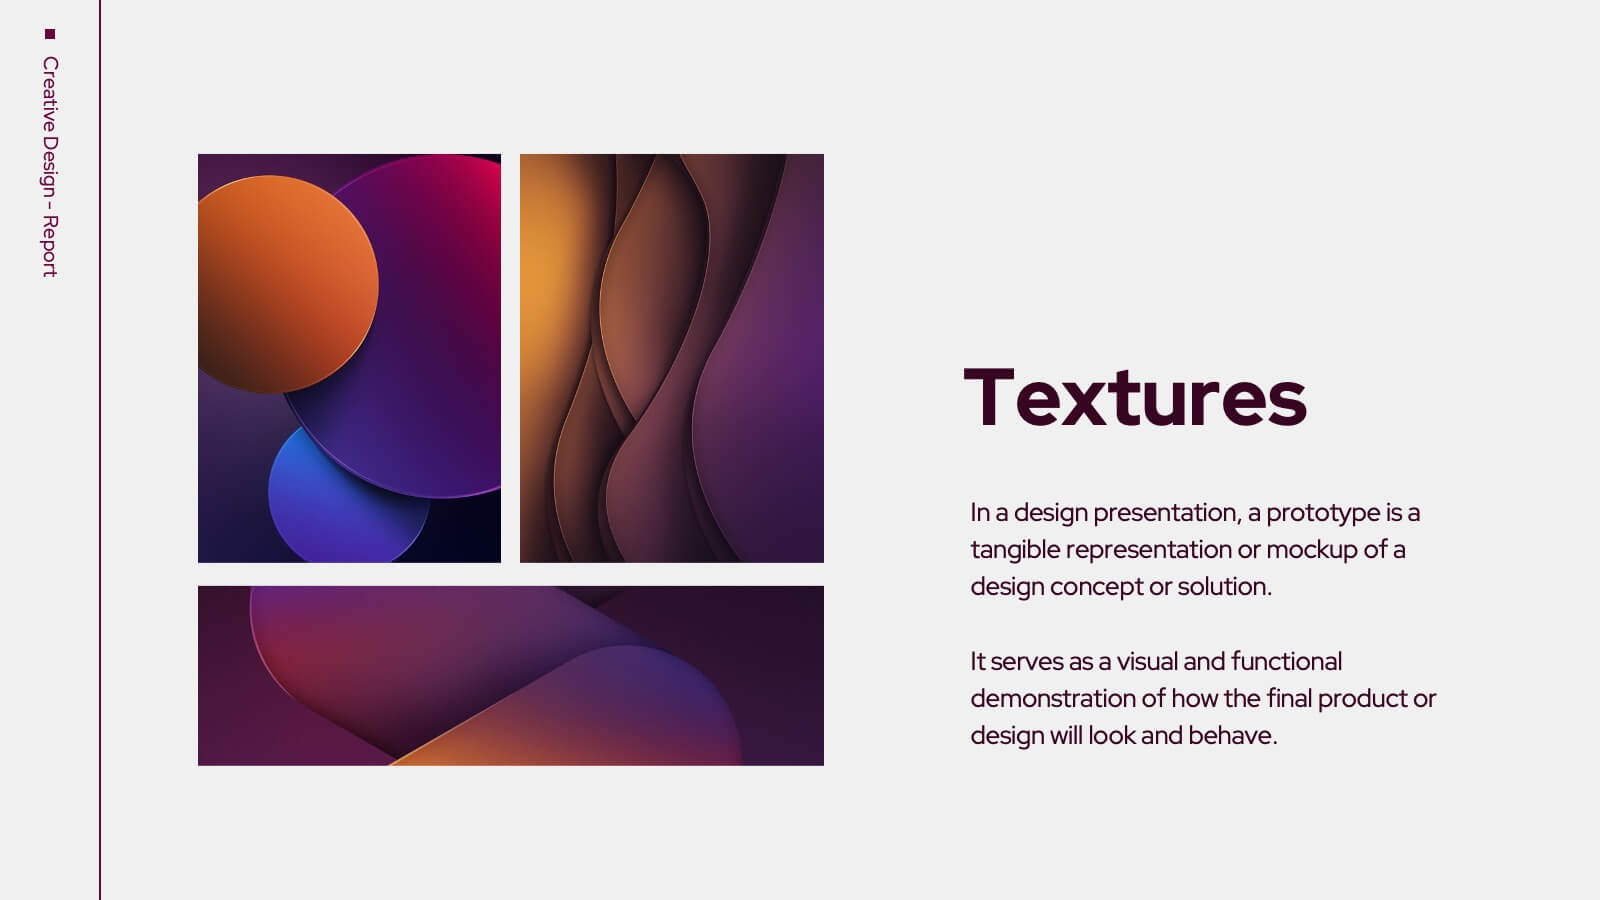
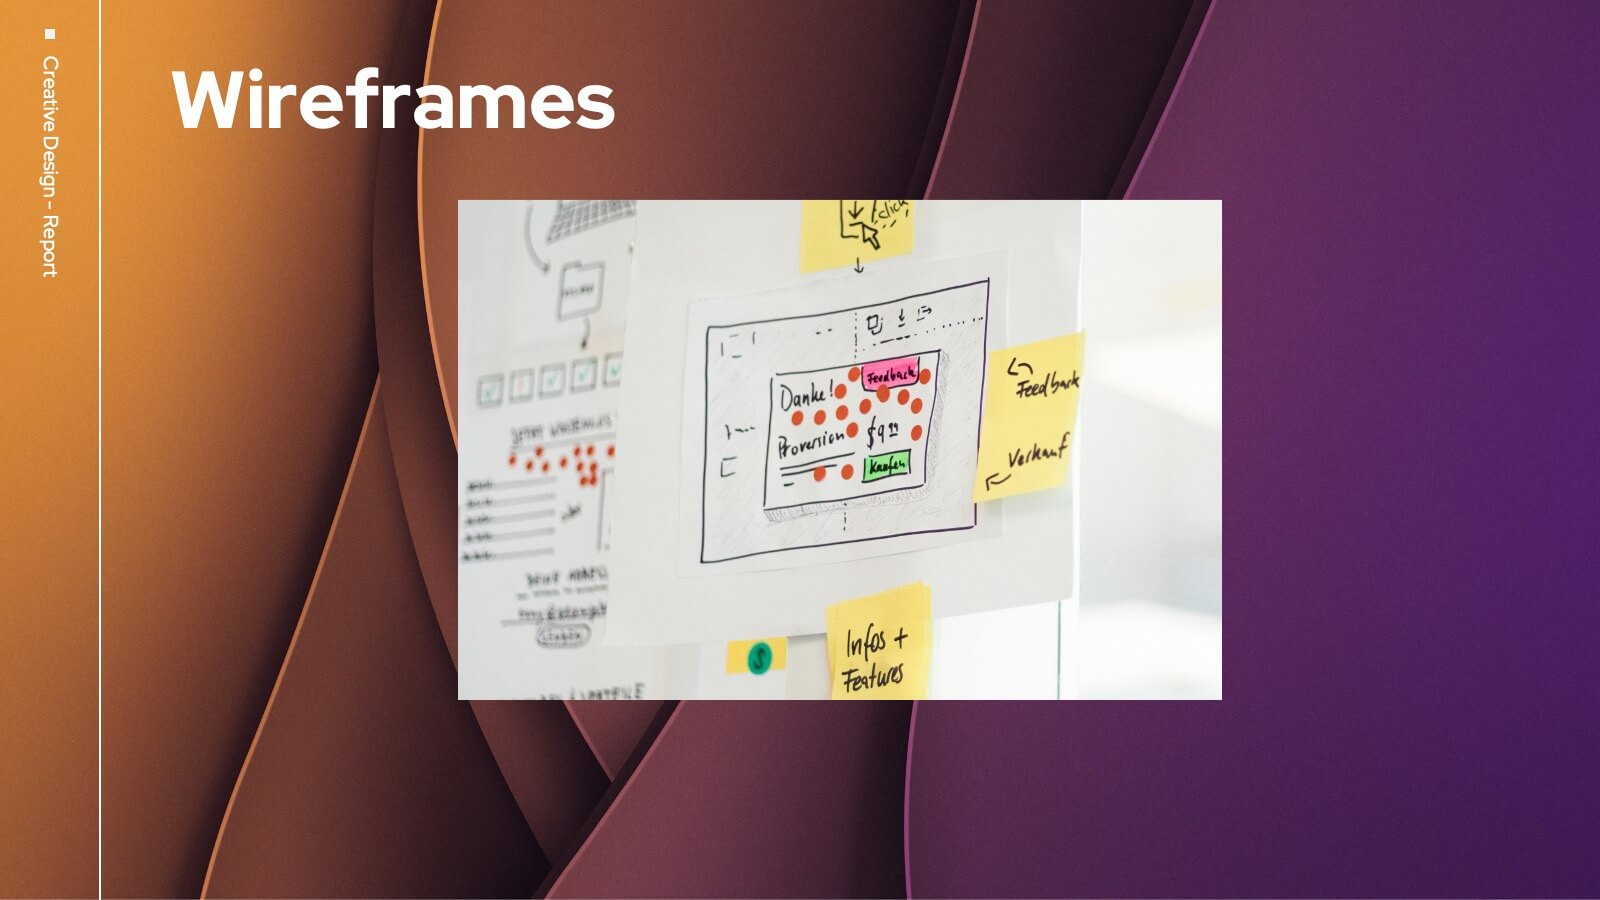
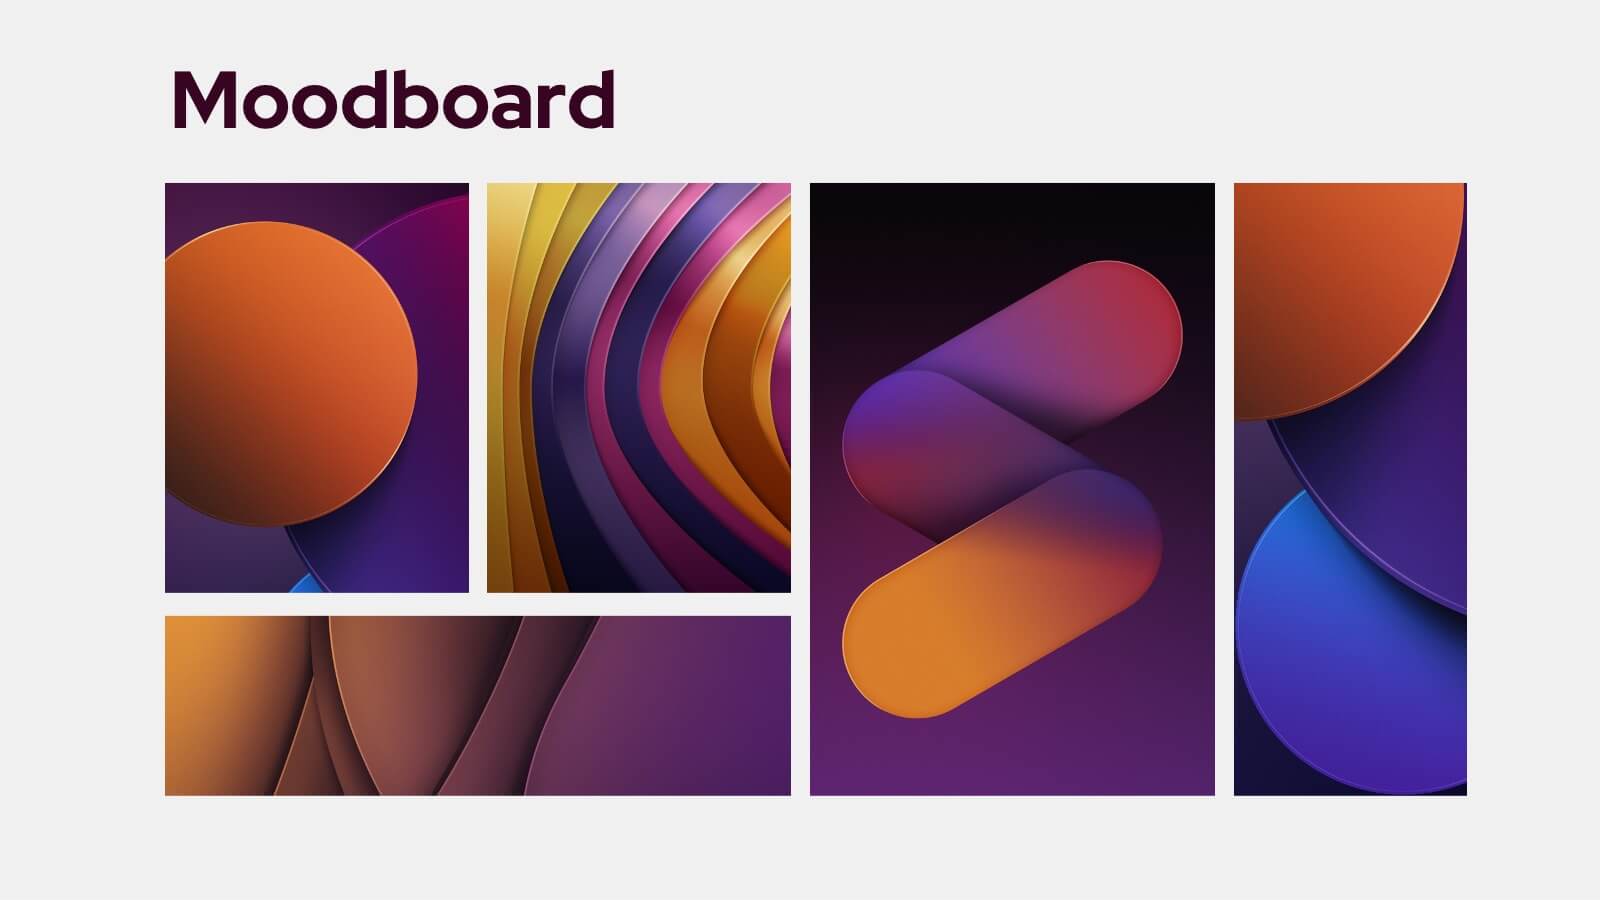
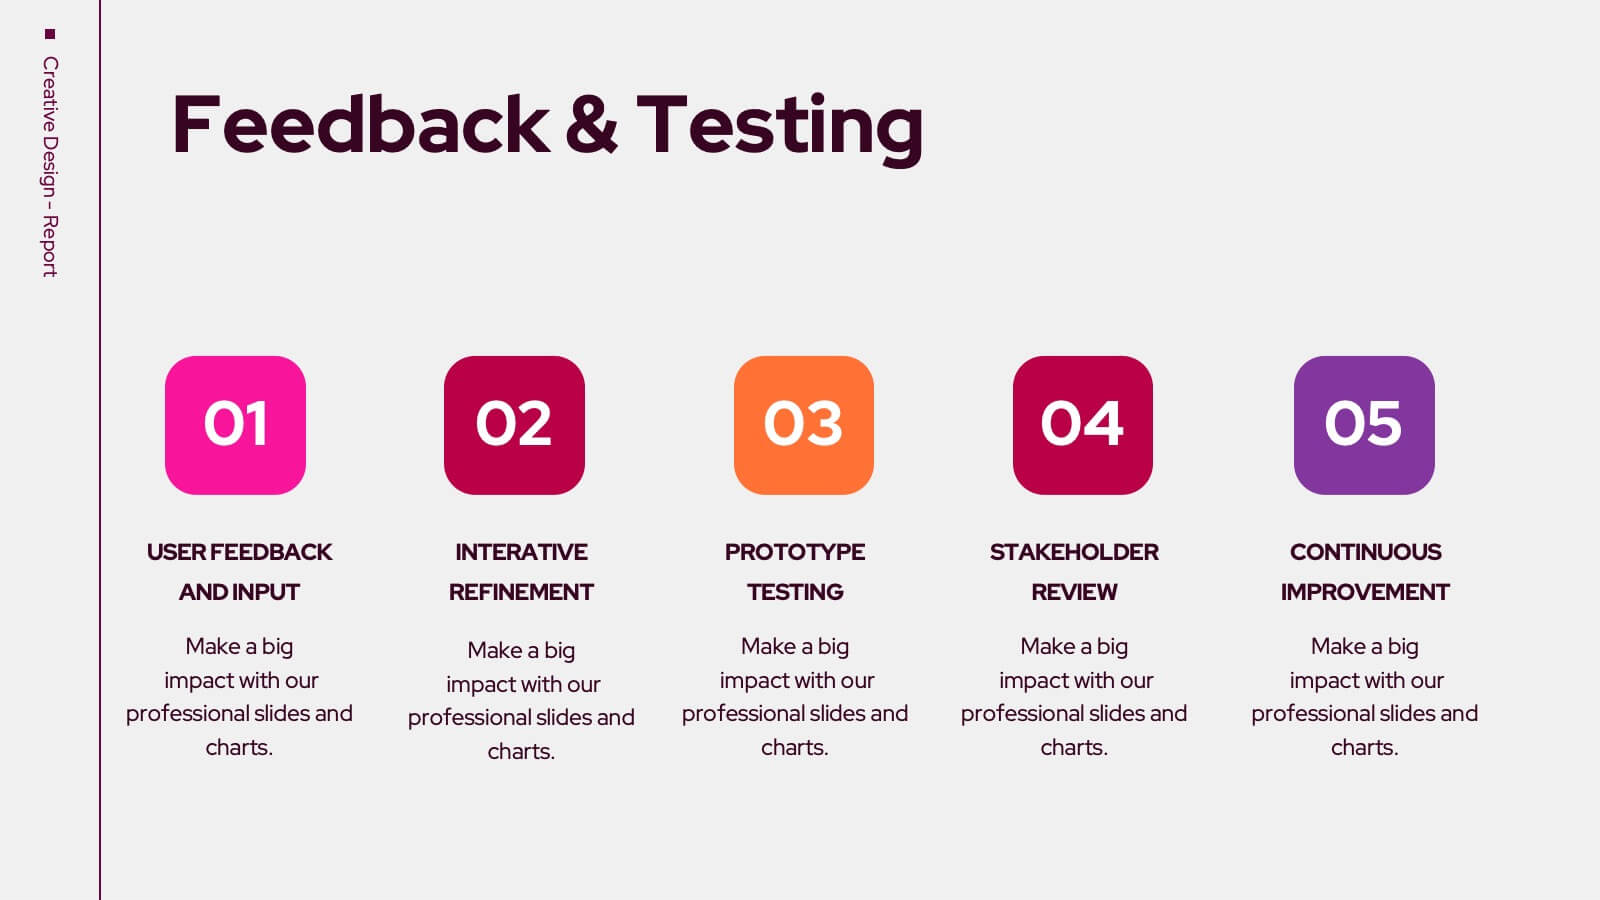
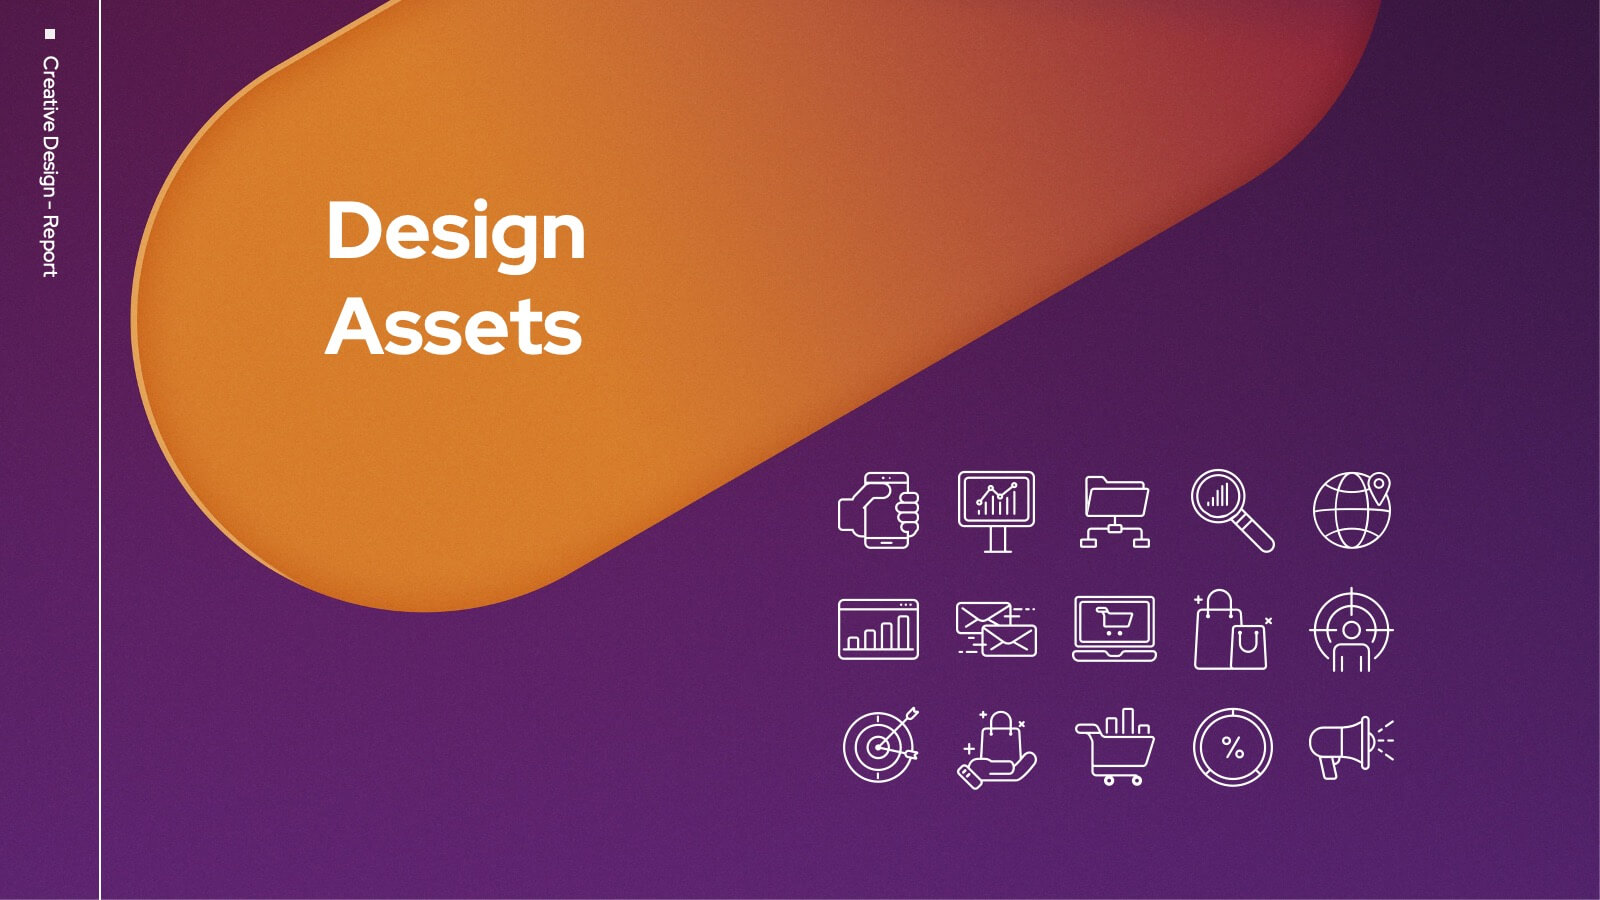
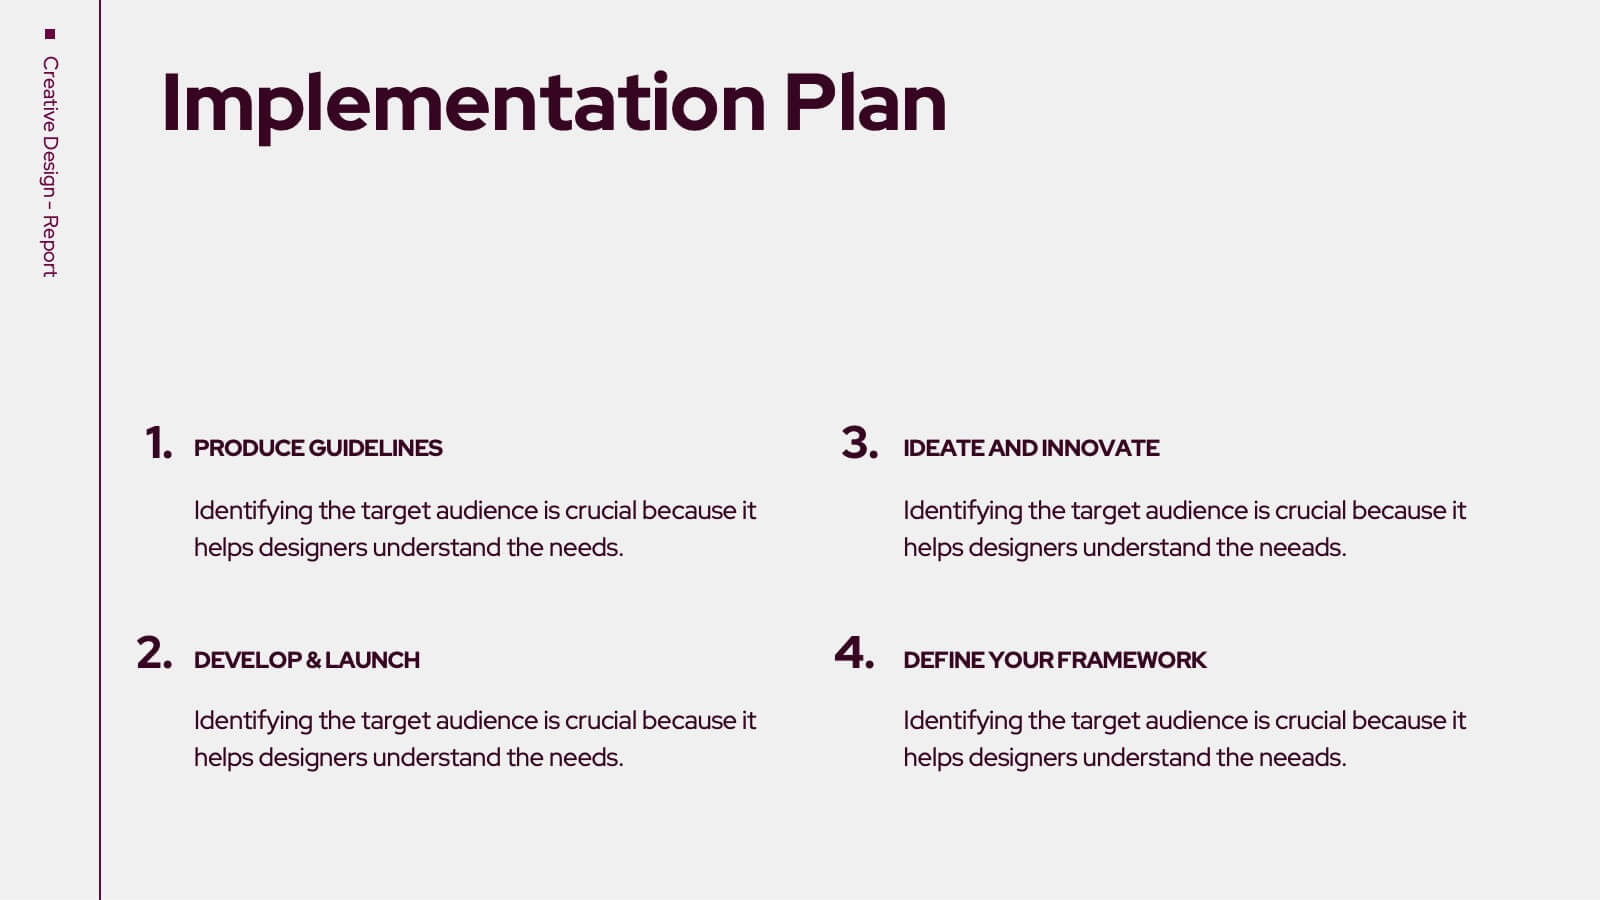
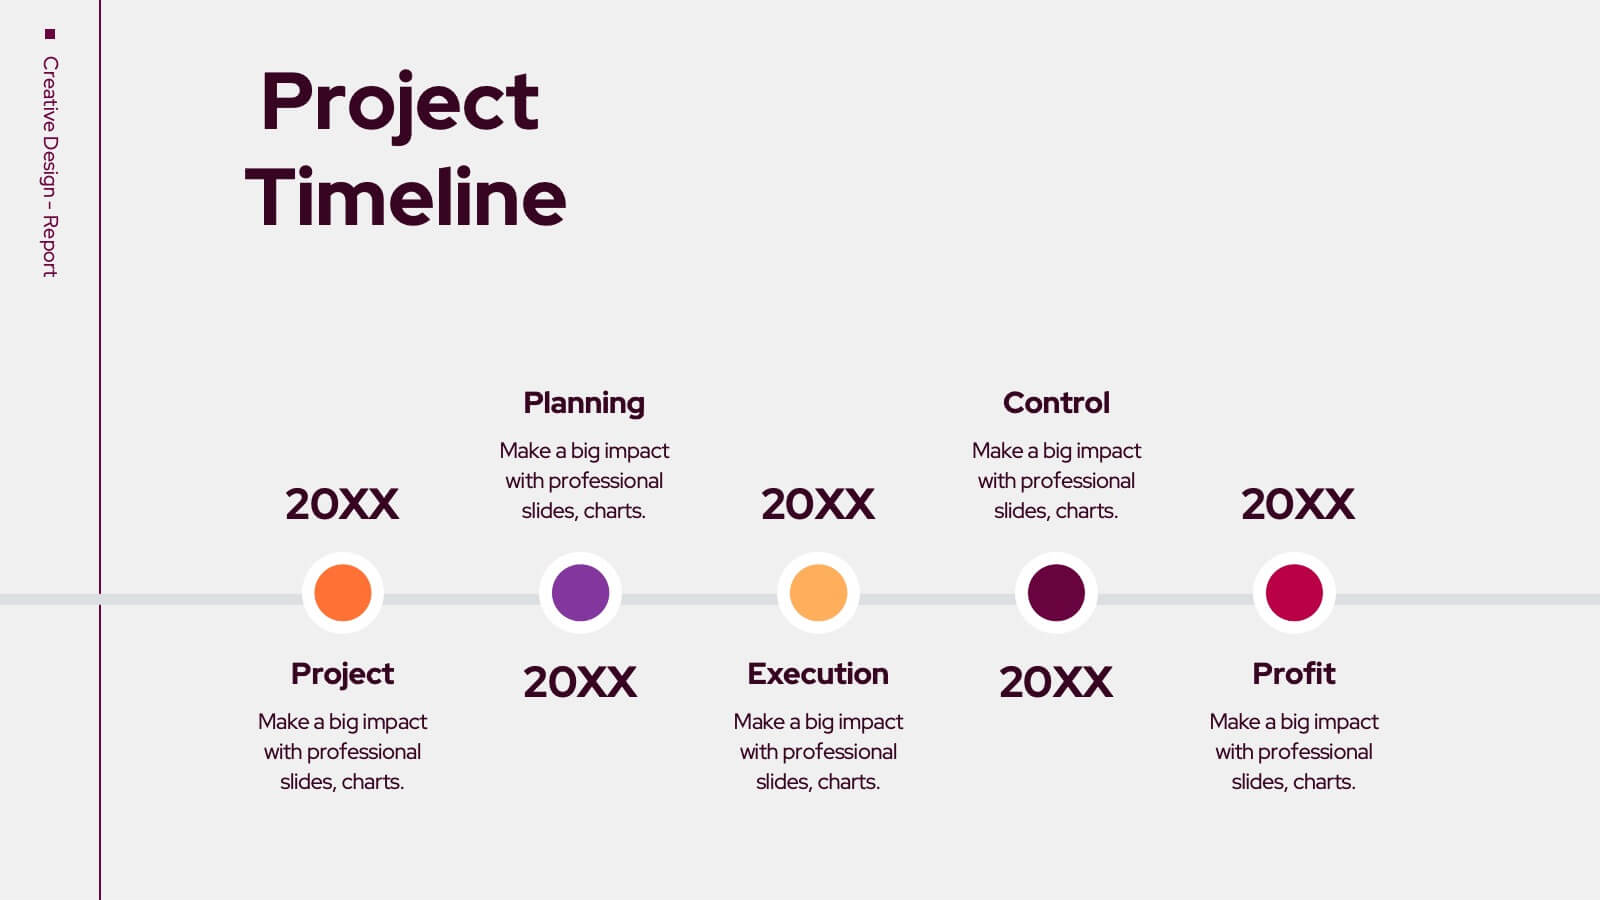
Trojan Creative Design Report Presentation
Unleash your creativity with this striking Trojan-inspired presentation template! Ideal for showcasing your design projects, this presentation enables you to highlight key concepts, inspirations, and visual elements effectively. Its engaging layout ensures your ideas shine through, captivating your audience. Compatible with PowerPoint, Keynote, and Google Slides for seamless presentations.


22 slides
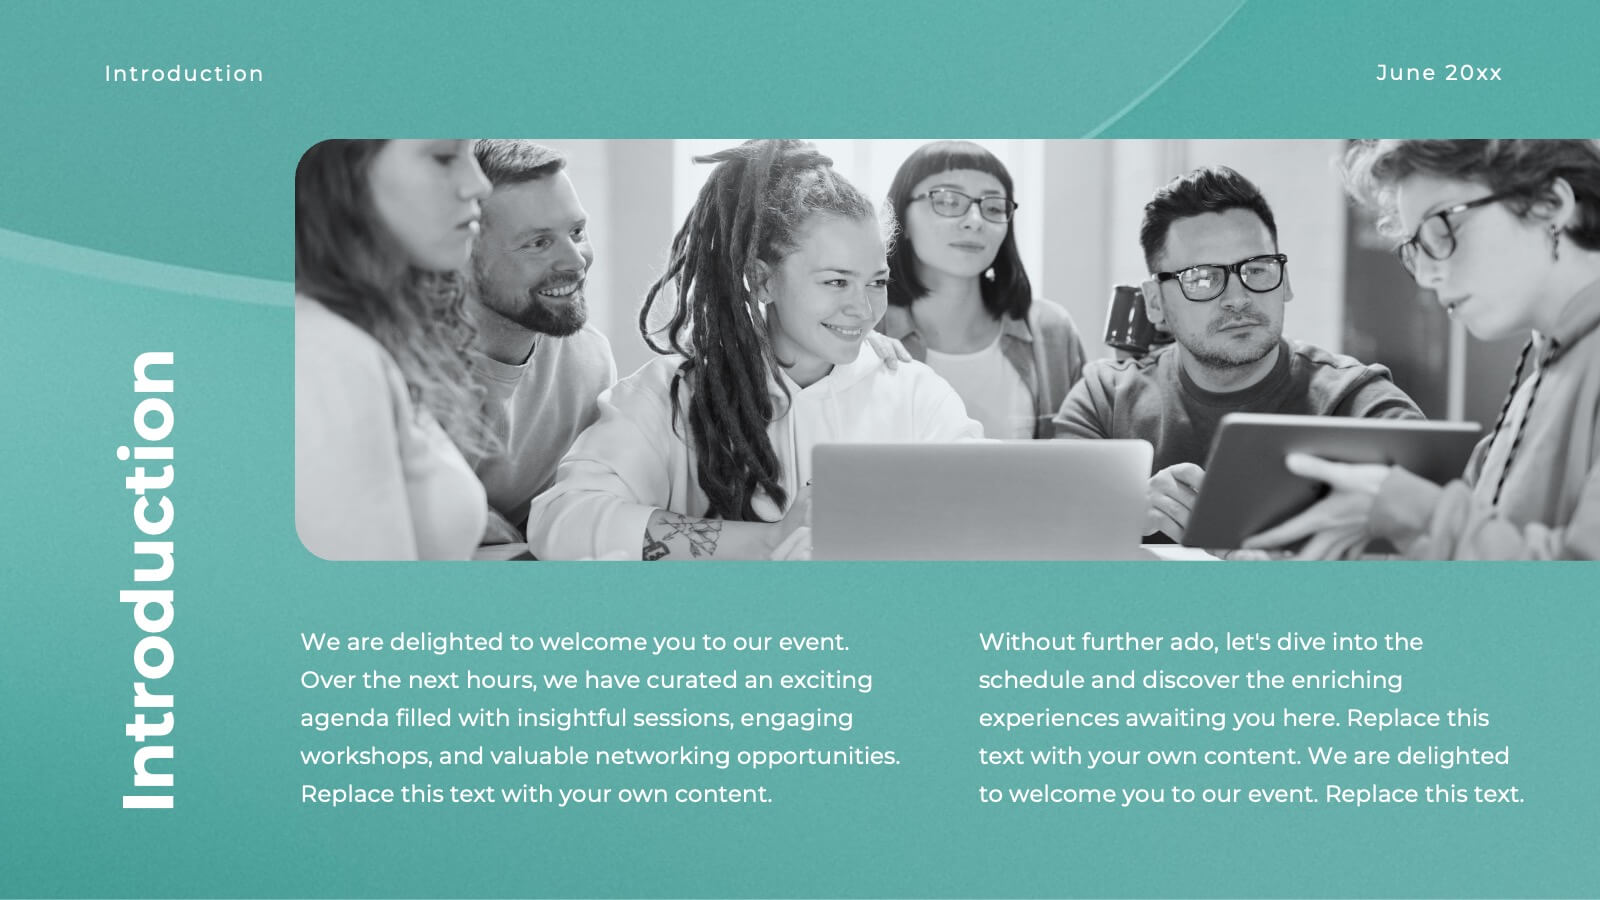
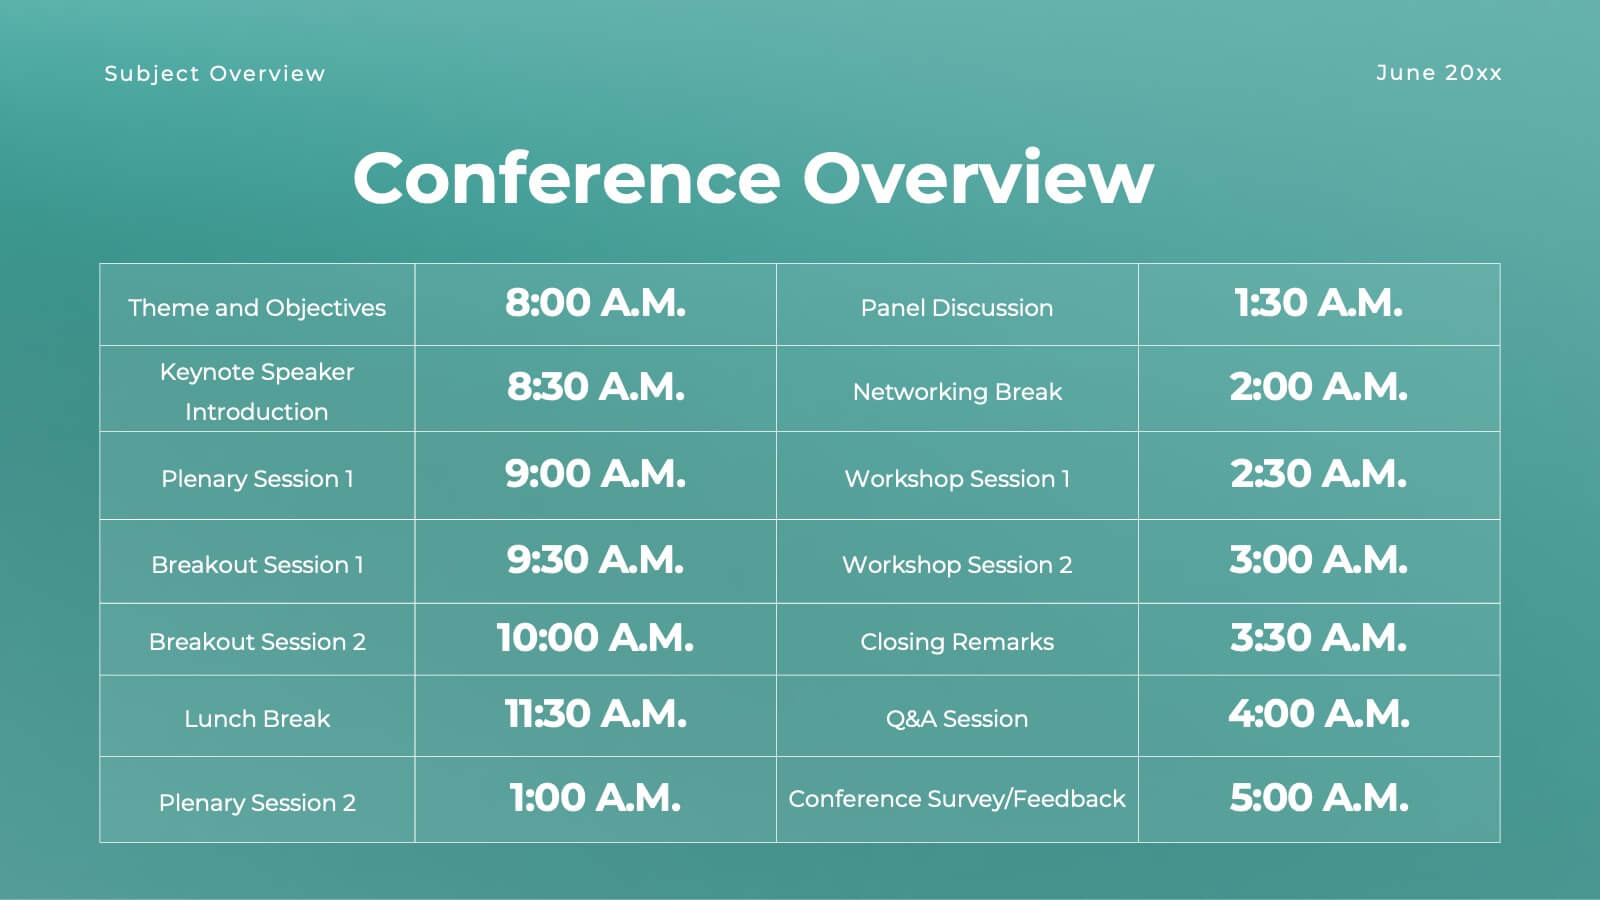
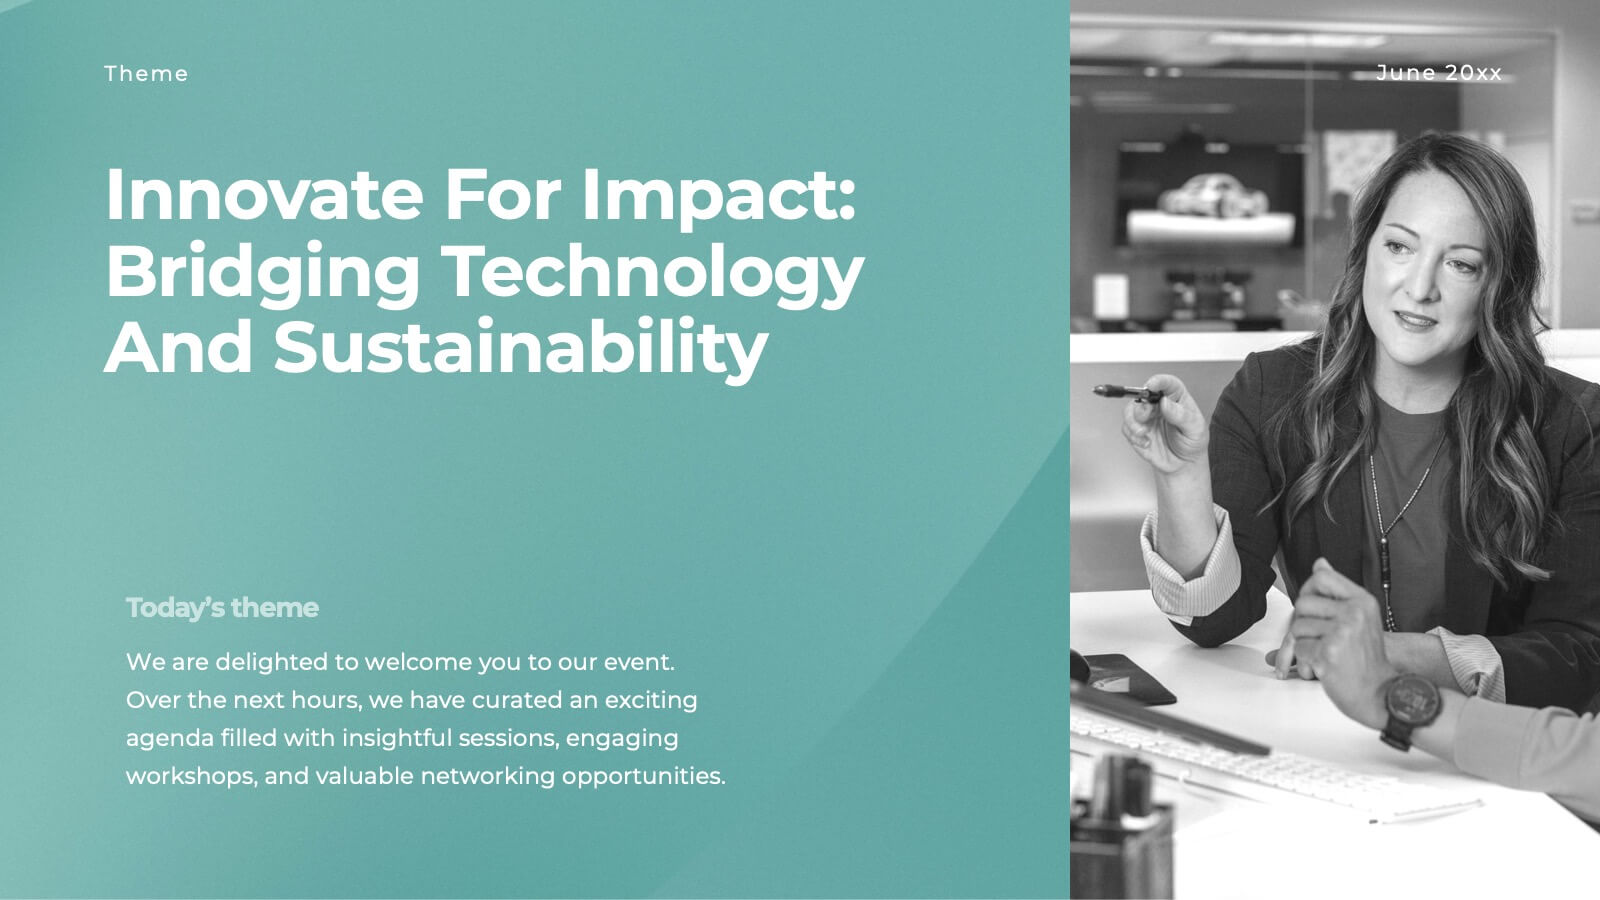
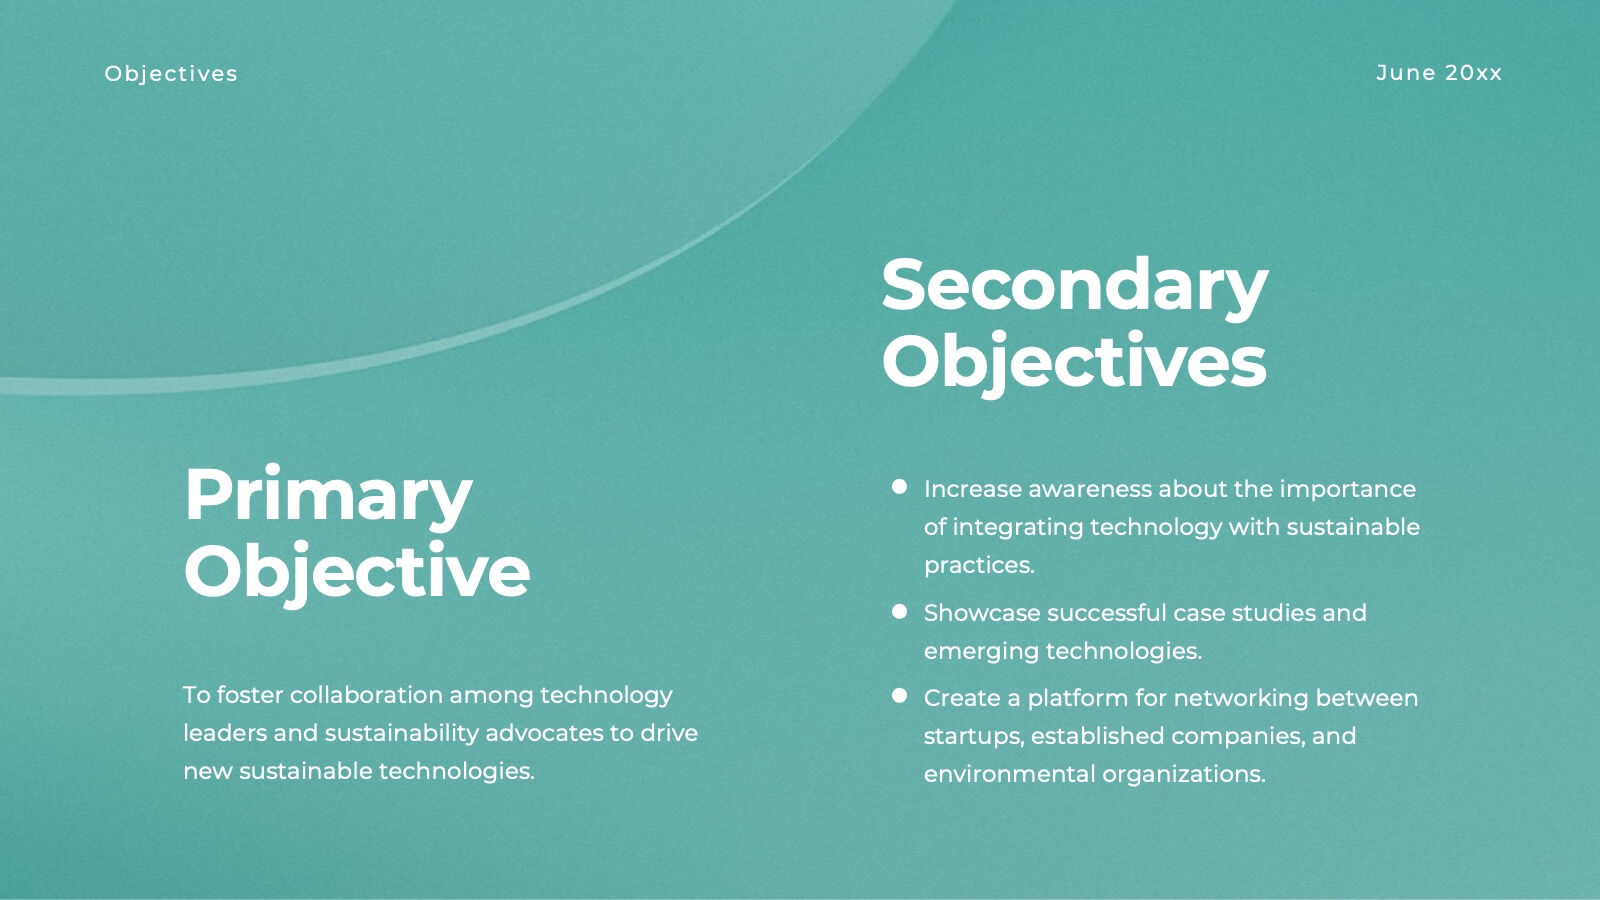
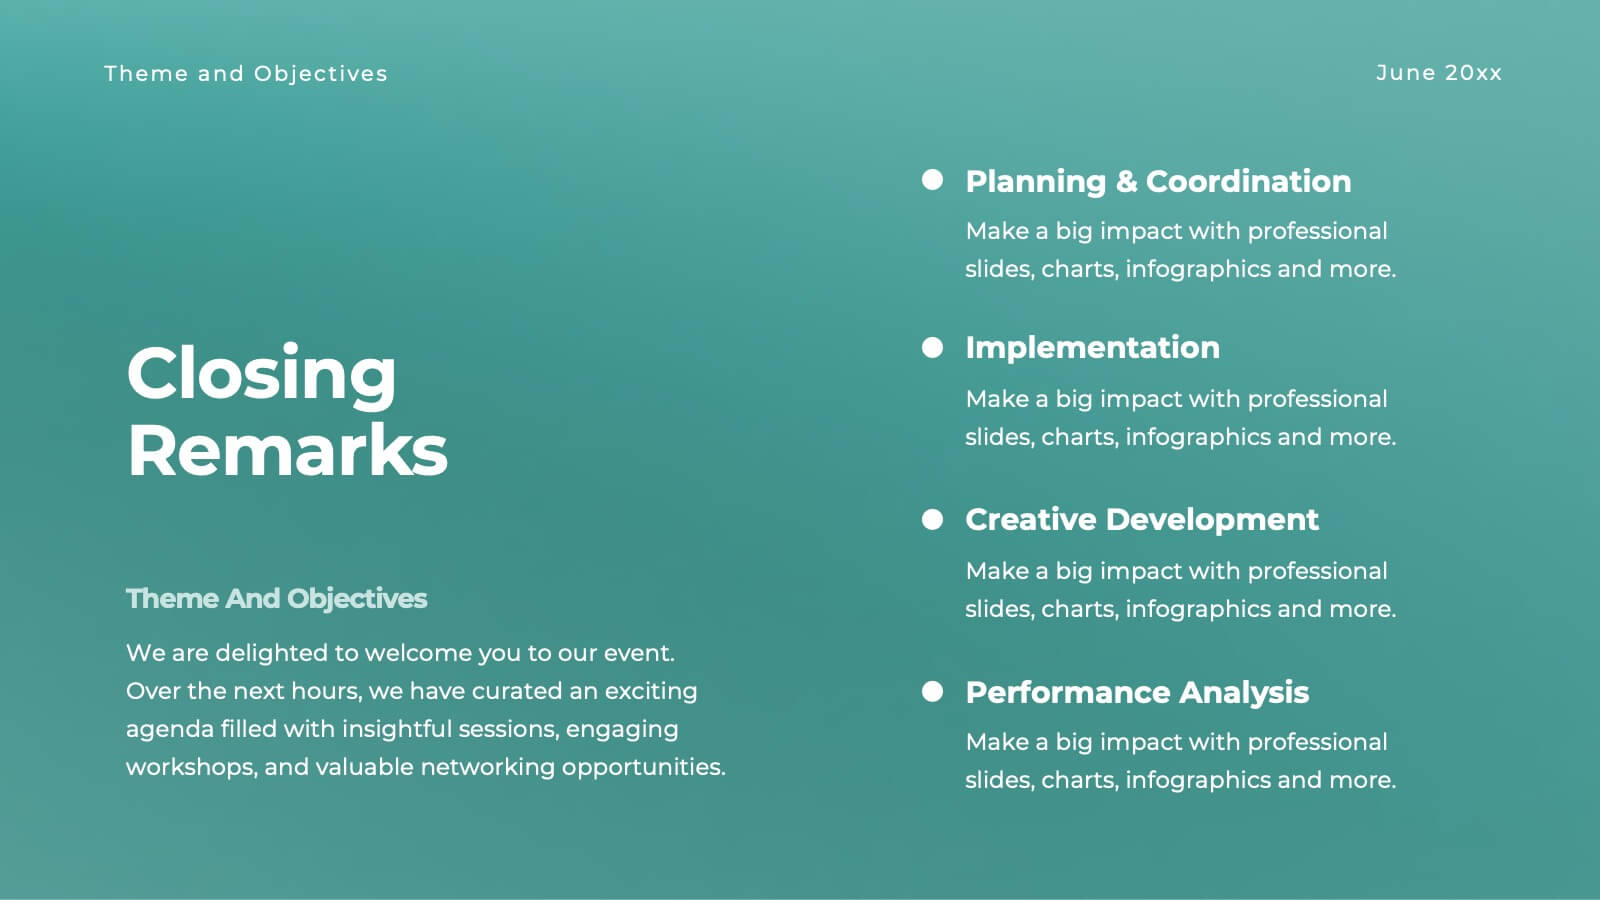
Halo Small Business Pitch Deck Presentation
Streamline your business presentations with this versatile pitch deck template! Ideal for conferences and meetings, it includes slides for objectives, session details, keynote speakers, and panel discussions. Keep your audience engaged with professional design and clear, structured content. Compatible with PowerPoint, Keynote, and Google Slides for seamless presentations on any platform.


5 slides
Customer Perceived Value Analysis Presentation
Capture the essence of customer perception with this visually engaging template. Designed for businesses aiming to assess and enhance value propositions, it breaks down key insights into digestible segments. Perfect for marketing strategies and consumer behavior analysis, this template is fully compatible with PowerPoint, Keynote, and Google Slides for seamless customization.


4 slides
Digital Course Creation Flow Presentation
Guide your audience through the steps of building a digital course with this clear and modern flowchart layout. Designed to simplify complex processes, this visual template is ideal for educators, instructional designers, or online coaches. Fully compatible with PowerPoint, Keynote, and Google Slides for easy customization and seamless use.


5 slides
Recycling Basics Infographics
Recycling is the process of converting waste materials into new products to reduce the consumption of raw materials, energy usage, and environmental pollution. These infographic templates are designed to educate and motivate individuals to embrace recycling as a sustainable practice. With its eye-catching design, concise information, and visually appealing graphics, this template will help raise awareness and inspire positive recycling behaviors in your audience. This template allows you to effectively communicate key information about recycling. This is compatible with Powerpoint, Keynote, and Google Slides.


5 slides
SEO and Funnel Tactics in Marketing Presentation
Showcase your digital strategy step-by-step with the SEO and Funnel Tactics in Marketing Presentation. Designed with a layered visual layout, this template helps you highlight up to five key stages of your marketing funnel—from awareness to conversion. Fully customizable in PowerPoint, Canva, Keynote, and Google Slides.


4 slides
Empathy Mapping for Product Development Presentation
Strengthen user understanding with the Empathy Mapping for Product Development Presentation. This template helps teams visualize what users think, feel, say, and do—essential for creating intuitive products and experiences. Ideal for design sprints, UX workshops, and product planning sessions. Fully editable in PowerPoint, Keynote, Canva, and Google Slides.


4 slides
Team Alignment and Discussion Summary Presentation
Foster collaboration and keep everyone on the same page with the Team Alignment and Discussion Summary presentation. This template highlights discussion points, action items, and key takeaways alongside a professional image layout—perfect for recaps, team syncs, and leadership updates. Fully editable in PowerPoint, Keynote, and Google Slides.


10 slides
Competitive Advantage Blue Ocean Strategy Presentation
Gain a competitive edge with this Blue Ocean Strategy presentation template! Designed to help businesses identify new market opportunities, this layout focuses on the four key actions: eliminate, reduce, raise, and create. Perfect for strategic planning, innovation workshops, and business growth discussions. Fully customizable and compatible with PowerPoint, Keynote, and Google Slides.


5 slides
Circular Wheel for Process Flow Presentation
Visualize your workflow with clarity using this 5-step circular process diagram. Perfect for illustrating continuous improvement, feedback loops, or operational stages. Each segment is color-coded and numbered for easy navigation and understanding. Fully editable in PowerPoint, Keynote, and Google Slides—customize icons, colors, and text to suit your message.


12 slides
Corporate Case Study Analysis
Break down your business case into clear, actionable sections with this five-step analysis layout. Each stage—from point A to E—is designed for highlighting core components such as challenges, processes, and insights. Ideal for consultants, executives, and analysts. Compatible with PowerPoint, Keynote, and Google Slides.