


Features
- 6 Unique slides
- Fully editable and easy to edit in Microsoft Powerpoint, Keynote and Google Slides
- 16:9 widescreen layout
- Clean and professional designs
- Export to JPG, PDF or send by email


Do you have any questions?
Recommend


10 slides
Agile Sprint Planning with Scrum Board Presentation
Plan and track your sprints effectively with this Agile Scrum Board Template. Featuring customizable “Stories,” “To Do,” “In Progress,” and “Testing” columns, this layout helps visualize workflow and team tasks clearly. Perfect for scrum masters and agile teams. Compatible with PowerPoint, Keynote, and Google Slides for easy editing.


5 slides
Digital Marketing Plan Presentation
Build momentum for your online strategy with a clean, structured layout that turns complex ideas into clear, stackable steps. This presentation helps outline goals, channels, and campaign actions in a visual flow that’s easy to follow and adapt. Fully customizable for PowerPoint, Keynote, and Google Slides.


6 slides
Market Trends and Risk Analysis with PESTEL Presentation
Present strategic insights with clarity using this Market Trends and Risk Analysis with PESTEL slide. Ideal for business consultants, marketers, and strategic planners, this slide helps dissect external factors—Political, Economic, Sociocultural, Technological, Environmental, and Legal—into clearly labeled segments using a modern hexagonal layout. Each section offers dedicated space for brief analysis or key data points, making it perfect for risk assessment, market evaluation, and forecasting discussions. Easily customizable in PowerPoint, Keynote, and Google Slides.


26 slides
Wave Brand Identity Presentation
Take your brand's identity to the next level with the Wave Brand Identity Presentation template! Designed to capture the essence of your brand in a visually striking and comprehensive format, this template is perfect for showcasing your brand's vision, values, and personality. It includes sections for brand vision and mission, core values, target audience, and brand positioning, ensuring that every aspect of your brand identity is clearly communicated. The sleek design elements and modern layout make it easy to present your brand's unique selling proposition (USP) and key differentiators, helping you to build a strong, cohesive brand story. Ideal for brand strategists, marketing teams, and creative professionals, this template is fully customizable and works seamlessly with PowerPoint, Keynote, and Google Slides. Bring your brand's story to life and leave a lasting impression with the Wave Brand Identity template!


21 slides
Hyperluma Startup Business Plan Presentation
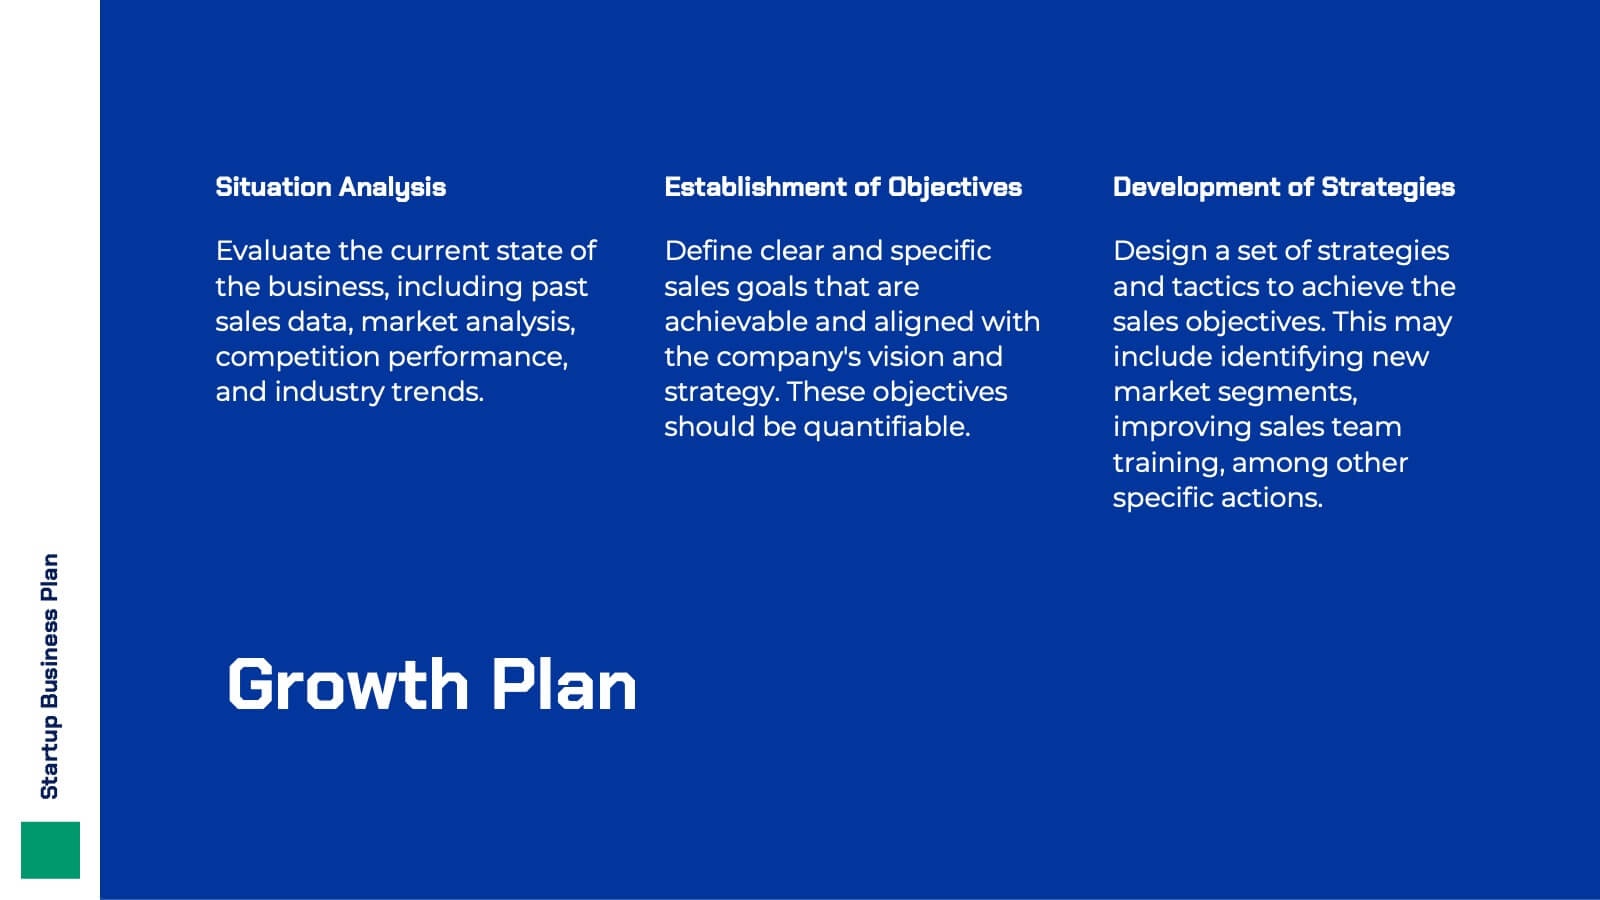
Launch your vision with this startup business plan template, crafted to communicate your mission, market potential, and growth strategy with clarity and impact. Covering customer needs, unique value propositions, and financial projections, it’s ideal for entrepreneurs and founders. This template is compatible with PowerPoint, Keynote, and Google Slides, ready to fuel your startup’s journey.


7 slides
Project Stakeholder Analysis Infographic
Stakeholder analysis is a technique used in project management and organizational strategy to identify and understand the interests, influence, and impact of individuals or organizations that can significantly affect or be affected by a project or decision. This infographic template is your compass to navigating the intricate landscape of stakeholders, understanding their influence, and engaging them effectively for project success. Compatible with Powerpoint, Keynote, and Google Slides. The vibrant design and strategic insights of our template will empower you to navigate the stakeholder cosmos and steer your project towards triumph.


11 slides
Sales Dashboards Infographic
A sales dashboard is a visual representation of sales data and key performance indicators (KPIs) that provides a quick and comprehensive view of a company's sales performance and related metrics. Step into the fast-paced world of sales with our sales dashboards infographic template. It's your compass for charting the course to success in the dynamic realm of sales, providing a visual guide that transforms data into actionable insights. This infographic is designed to to track progress towards sales goals, identify trends, and optimize strategies to improve sales performance. Compatible with Powerpoint, Keynote, and Google Slides.


7 slides
Framework Documentation Infographic
A framework infographic presents a framework for organizing and understanding complex information, to provide an overview of the key elements and relationships between them. This template is designed to break down your large amounts of information into smaller, more manageable parts. This infographic can be used in fields such as business, marketing, and strategy, as well as in education and research. Use it to explain complex concepts, theories, and models, and to provide a visual representation of how elements fit together. This can take a variety of forms, including flowcharts and diagrams.


5 slides
5-Level Pyramid Diagram Presentation
Build your message from the ground up with a clean, layered visual that makes complex ideas feel easy to follow. This presentation highlights hierarchical structure, priorities, and step-by-step concepts in a polished, professional layout perfect for business or education. Fully compatible with PowerPoint, Keynote, and Google Slides.


6 slides
Product and Service Options Presentation
Showcase your offerings with the Product and Service Options Presentation template. This structured design highlights key features, benefits, and differentiators, making it ideal for business proposals, service breakdowns, and marketing strategies. Fully customizable for PowerPoint, Keynote, and Google Slides, ensuring seamless integration into your presentation.


5 slides
Big Data Interpretation and Metrics Presentation
Break down complex data into digestible segments with the Big Data Interpretation and Metrics Presentation. Featuring a puzzle-inspired layout, this template is ideal for illustrating interconnected data points, analytics strategies, or metric-based frameworks. Fully customizable in PowerPoint, Keynote, and Google Slides.


4 slides
Annual Calendar Layout for Projects
Plan your year like a pro with this clean and colorful visual layout—it’s designed to help you stay focused, organized, and on track month by month. Whether you're mapping out team projects, campaign milestones, or business goals, this annual calendar format makes it easy to see everything at a glance. Fully compatible with PowerPoint, Keynote, and Google Slides.


4 slides
Project Responsibility Assignment Matrix Presentation
Visualize team roles and task accountability at a glance with this Project Responsibility Assignment Matrix. This structured layout categorizes assignments using the RACI model—Responsible, Accountable, Consulted, and Informed—organized by team and position. Ideal for project managers, team leads, and operations planners, it helps ensure clarity, reduce overlap, and promote accountability across departments. Easily editable in PowerPoint, Keynote, and Google Slides for seamless customization and cross-platform use.


6 slides
3D Technologies Infographics
Dive into the world of 3D Technologies with our customizable infographic template. This template is fully compatible with popular presentation software like PowerPoint, Keynote, and Google Slides, allowing you to easily customize it to showcase various aspects and applications of 3D technologies. The 3D Technologies infographic template provides a visually engaging platform to explore and explain the world of three-dimensional technology, from 3D printing and modeling to virtual reality and augmented reality. Whether you're an enthusiast, educator, or industry professional, this template offers a user-friendly canvas to create informative presentations and educational materials. Elevate your understanding of 3D Technologies with this SEO-optimized infographic template, thoughtfully designed for clarity and ease of use. Customize it to highlight the key principles, applications, and innovations within the 3D technology landscape, making complex concepts accessible to your audience. Start crafting your personalized infographic today to delve into the exciting realm of 3D Technologies.


5 slides
Scientific Research Data Presentation
Bring your research to life with a clean, dynamic layout designed to simplify complex findings and highlight key scientific insights. This presentation offers a structured flow for showcasing data, experiments, or results in a clear and engaging way. Fully compatible with PowerPoint, Keynote, and Google Slides.


5 slides
WFH Policy Overview Presentation
Bring clarity and confidence to your remote-work guidelines with a clean, puzzle-style layout that makes every policy easy to follow. This presentation explains key expectations, communication standards, and workflow essentials designed to support productive work-from-home environments. Fully customizable and compatible with PowerPoint, Keynote, and Google Slides.


6 slides
Stock Market Investment and Analysis Presentation
Showcase your market insights with this dynamic zigzag arrow diagram—perfect for highlighting bullish vs. bearish trends, financial analysis, and investment milestones. The slide features a split-path layout with icons and editable text areas to clearly compare strategies or illustrate turning points. Fully customizable in PowerPoint, Keynote, and Google Slides.