


Features
- 12 Unique slides
- Fully editable and easy to edit in Microsoft Powerpoint, Keynote and Google Slides
- 16:9 widescreen layout
- Clean and professional designs
- Export to JPG, PDF or send by email


Do you have any questions?
Recommend


6 slides
Sports Equipment Infographics
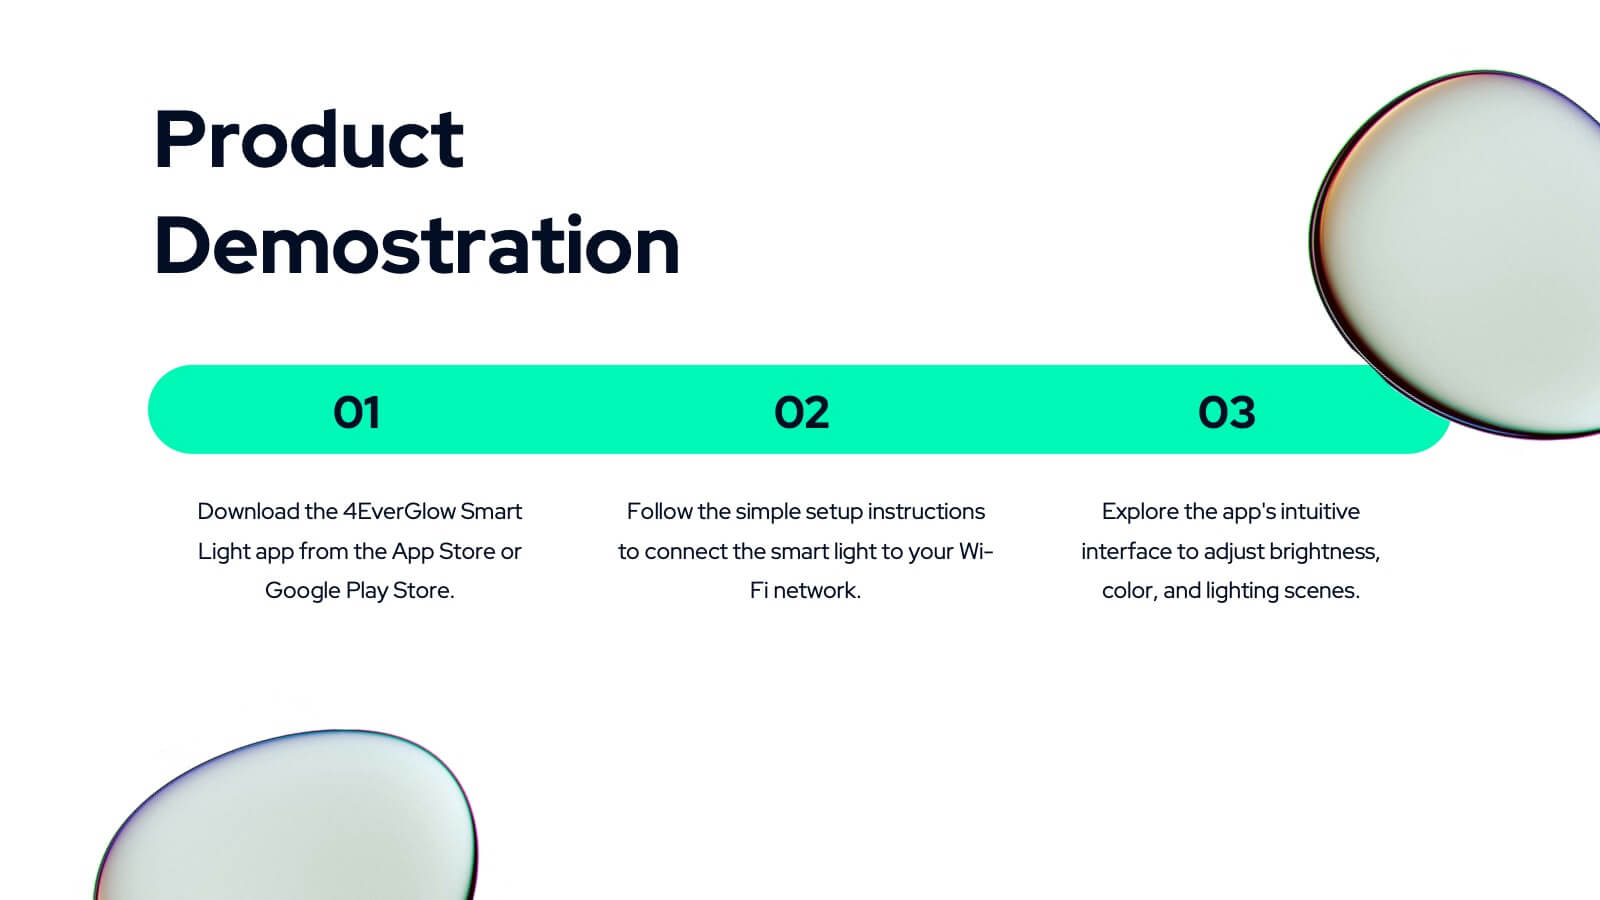
The "Sports Equipment" infographic template is a dynamic and engaging tool, perfectly crafted for PowerPoint, Keynote, and Google Slides. This template is an excellent choice for sports retailers, equipment manufacturers, and fitness enthusiasts who wish to showcase a range of sports gear and its features. The template vividly displays various types of sports equipment, detailing their use, benefits, and technical specifications. It's designed to highlight product features, usage tips, and maintenance advice, making it highly useful for product demonstrations, sales presentations, and customer education. With a vibrant and energetic design, the color scheme of the template is tailored to capture the spirit of sports and fitness. This not only makes the presentation visually striking but also aligns with the themes of activity, energy, and health. Whether used in a retail setting, a trade show, or a fitness workshop, this template ensures that the diverse range of sports equipment is presented in a visually appealing, organized, and informative manner.


3 slides
Project Status Report Overview Presentation
Bring clarity to your progress updates with this clean, easy-to-read template designed to track milestones, performance, and project goals at a glance. Ideal for team meetings and executive summaries, it turns data into visual insight. Fully compatible with PowerPoint, Keynote, and Google Slides for effortless customization and presentation.


20 slides
Firelight Design Portfolio Presentation
This Design Portfolio Presentation Template offers a bold and modern layout to showcase your creative projects, services, and achievements. It features sections for project highlights, awards, client testimonials, and pricing, making it perfect for freelancers and agencies. Fully customizable in PowerPoint, Keynote, and Google Slides.


6 slides
Threat and Mitigation Bowtie Model
Break down complex threats and responses with the Threat and Mitigation Bowtie Model Presentation. This infographic visualizes the relationship between root causes, a central hazard event, and its potential consequences—alongside the controls that mitigate them. Clean, editable layouts and multiple visual states let you emphasize either side of the bowtie. Ideal for risk assessments, business continuity planning, and safety presentations. Compatible with PowerPoint, Keynote, and Google Slides.


6 slides
Defining Project Scope
Visualize your project's key components with this sleek hexagonal layout, perfect for outlining milestones, deliverables, and priorities. This six-part diagram helps teams align goals and clarify scope early in the process. Ideal for PMs, strategists, and consultants. Fully editable in PowerPoint, Keynote, and Google Slides.


7 slides
Organizational Analysis McKinsey 7S Presentation
Explore the core of organizational alignment with our McKinsey 7S Model presentation template. Perfectly crafted for analyzing and optimizing business structures, this template guides you through the seven essential elements: Strategy, Structure, Systems, Shared Values, Skills, Staff, and Style. Its intuitive design ensures effective communication and clarity in your presentations. Optimized for PowerPoint, Keynote, and Google Slides, it's an invaluable tool for consultants and business strategists aiming to enhance internal coherence and performance.


4 slides
Business Plan in 4 Clear Steps
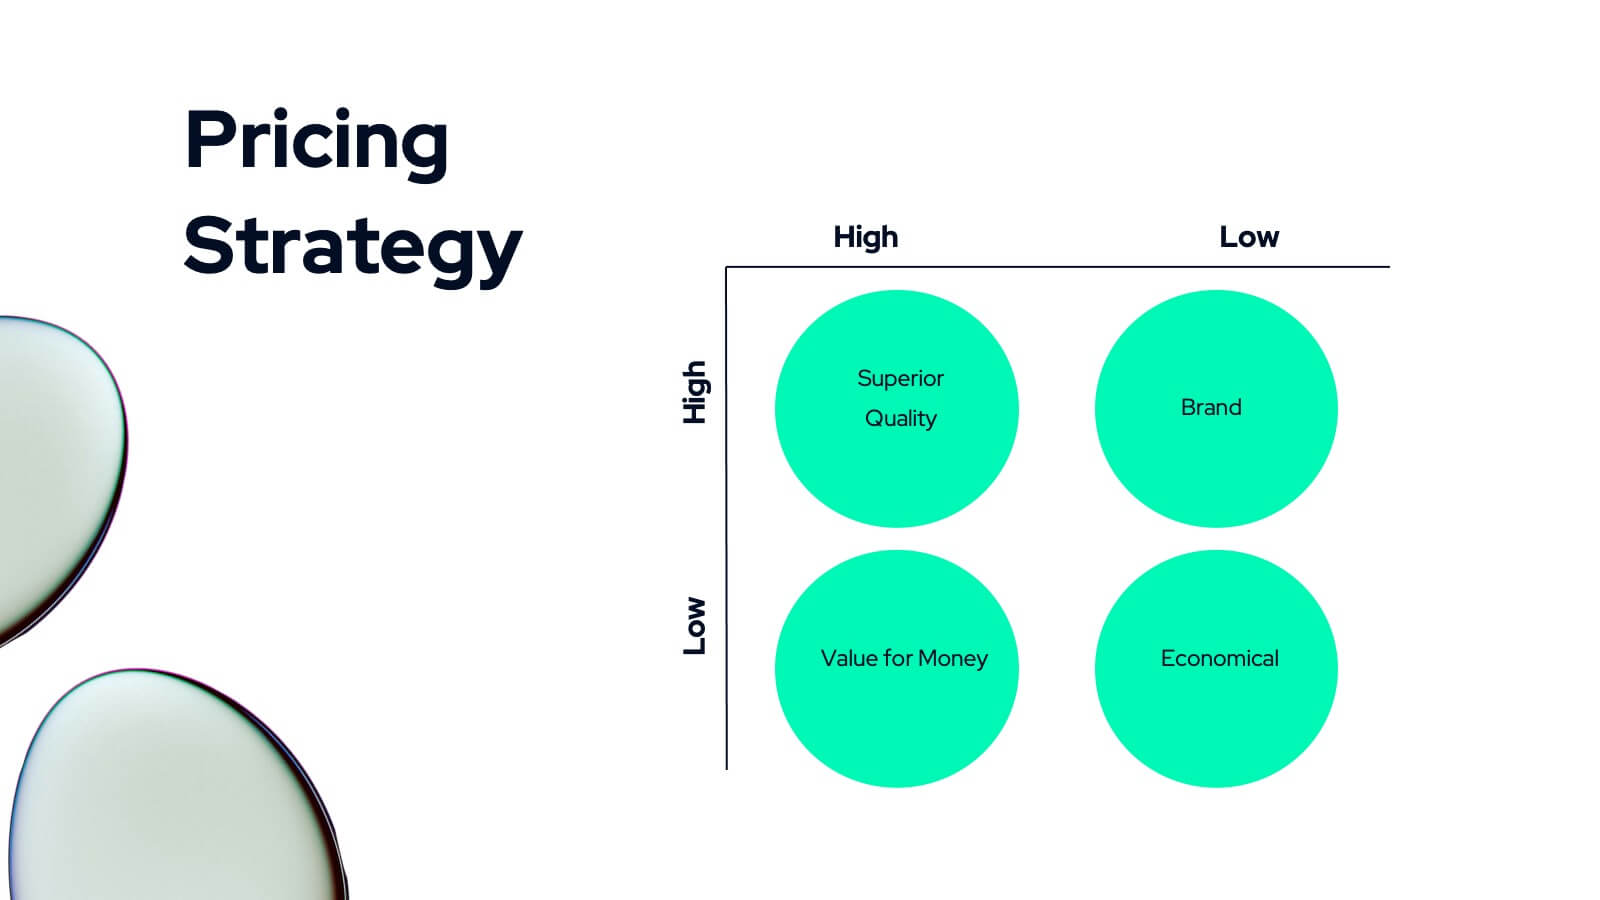
Break down your business strategy into four simple, actionable stages with this bold, visual template. Featuring a colorful quadrant layout inside a professional case graphic, it's perfect for business plans, roadmaps, or project overviews. Easily editable in PowerPoint, Keynote, and Google Slides.


5 slides
Social Media Strategies Presentation
Bring your online vision to life with a clean, modern layout that makes planning campaigns feel effortless. This presentation helps you map out goals, content pillars, audience insights, and platform tactics with clarity and impact. Fully editable and compatible with PowerPoint, Keynote, and Google Slides.


6 slides
Annual Scheduling with Calendar Milestones Presentation
Make your year feel like a well-oiled machine with this bold, color-coded visual layout. It helps you map out project phases, monthly milestones, and long-term plans with clarity and structure. Ideal for strategy meetings or annual reviews, this editable template works seamlessly in PowerPoint, Keynote, and Google Slides.


5 slides
2024 Financial Report Summary Presentation
Turn complex financial data into a clear visual story that’s easy to follow and engaging to present. This clean, data-focused design helps highlight yearly performance, key insights, and budget breakdowns with precision. Fully editable and compatible with PowerPoint, Keynote, and Google Slides for effortless customization and presentation delivery.


5 slides
Manufacturing in the US Infographics
Delve into the industrial heartbeat of America with the manufacturing in the US infographics. Rendered in patriotic hues of red, blue, and white, this vertical, creative, and informative template is a powerhouse of insight, perfect for industry analysts, educational purposes, or corporate presentations aiming to explore the intricacies of U.S. manufacturing. The infographic doesn’t just present data; it tells the story of American industry, with engaging graphics, intuitive icons, and dedicated spaces for real imagery that bring facts to life. This tool is invaluable for anyone needing to communicate the vast scope of U.S. manufacturing prowess effectively and compellingly.


6 slides
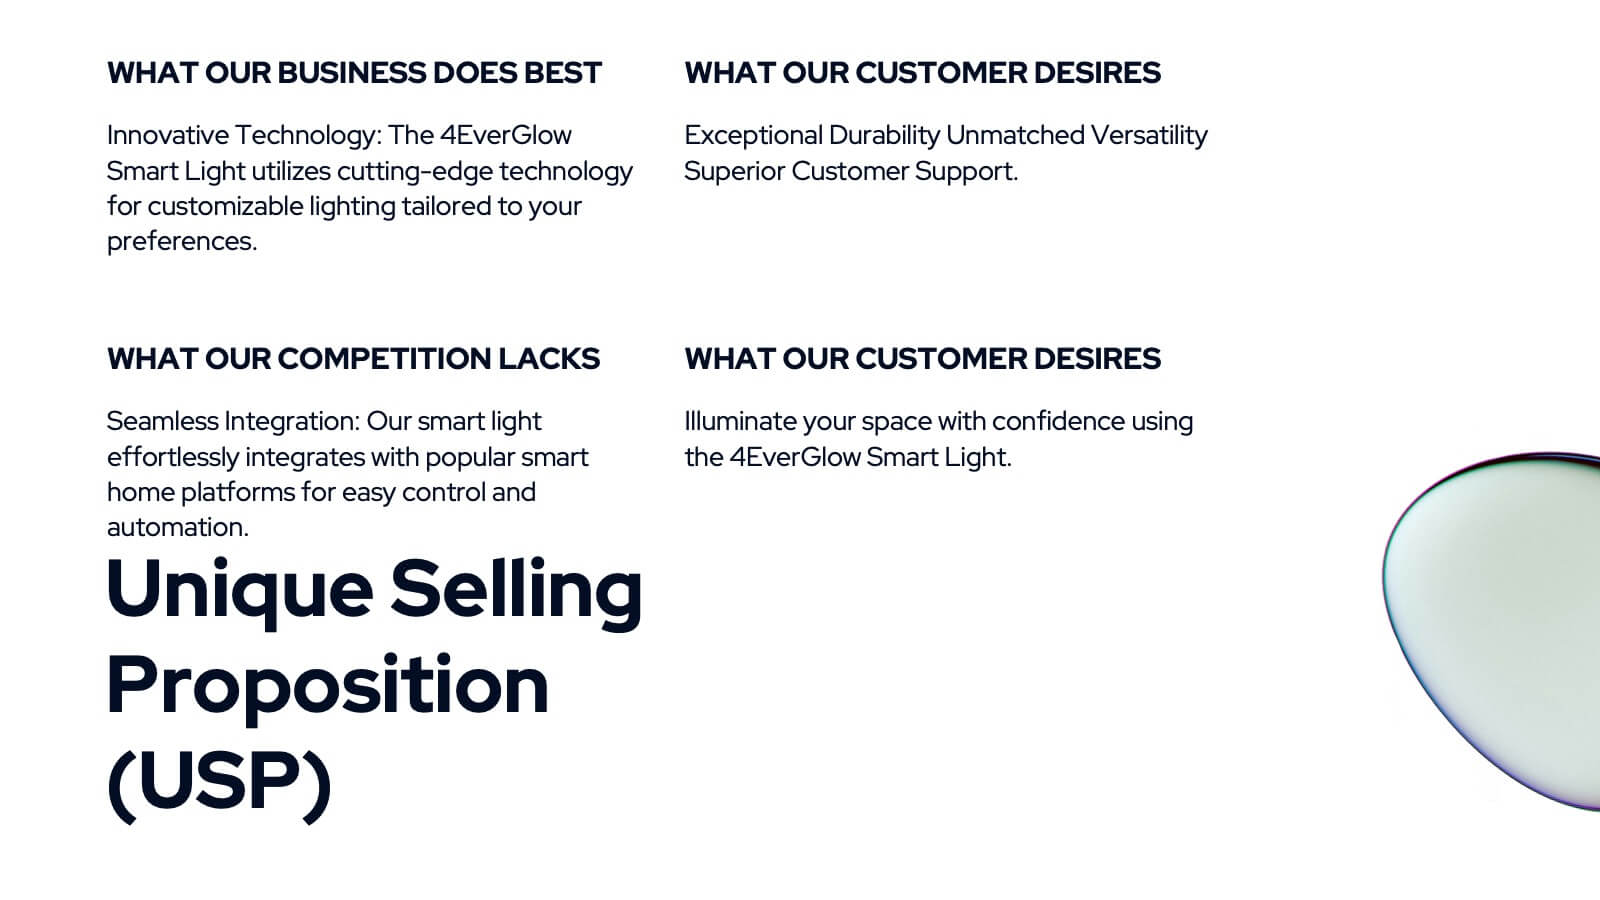
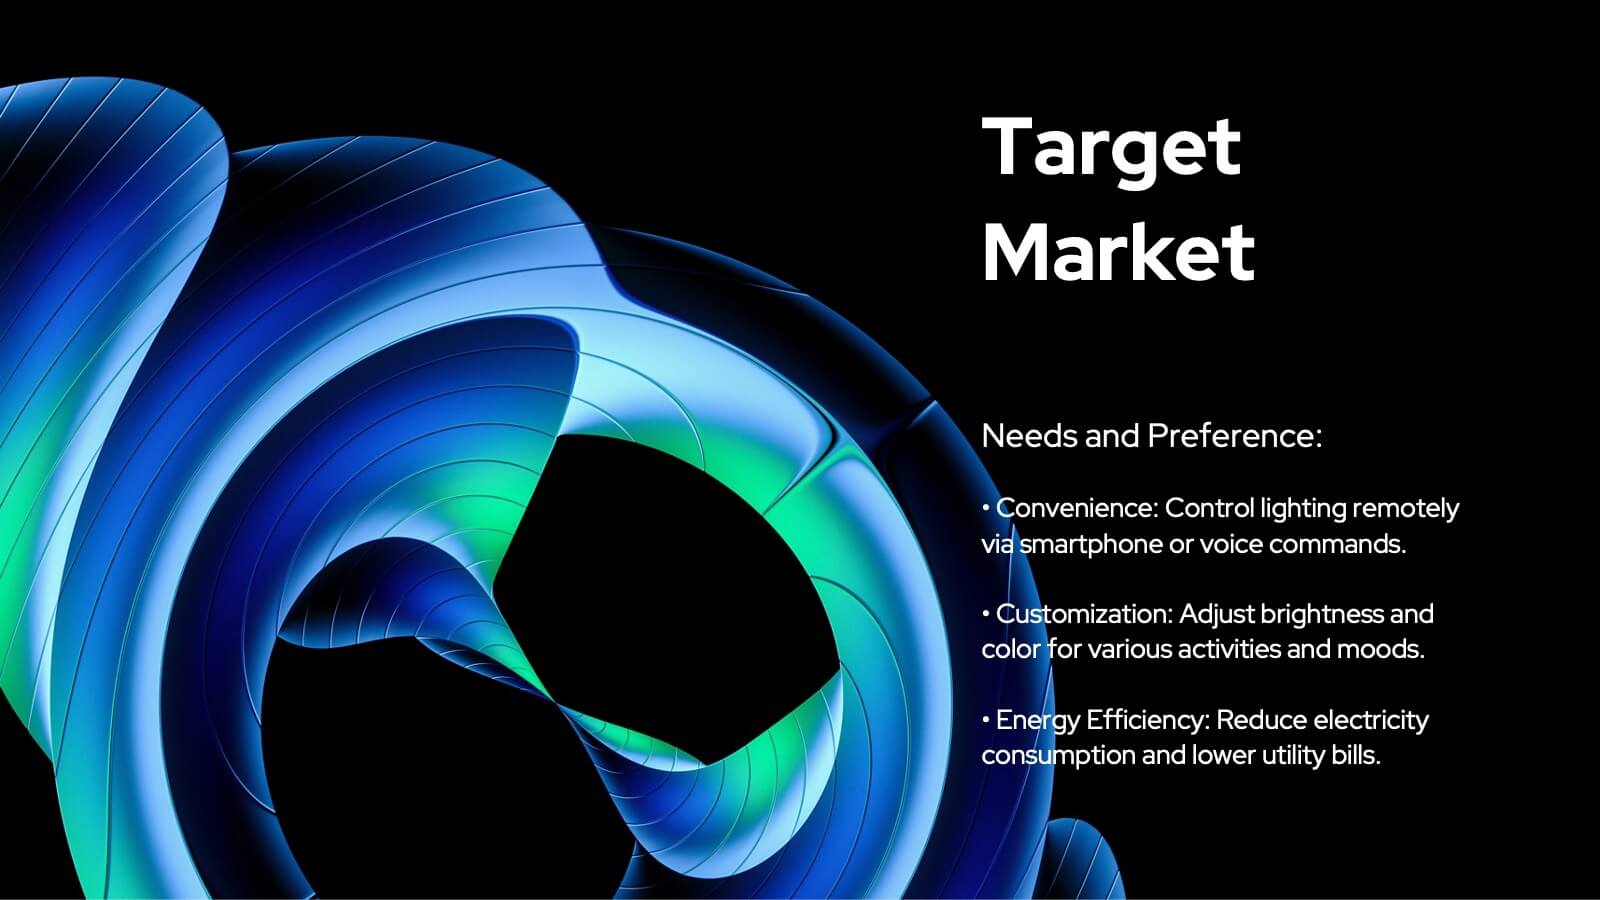
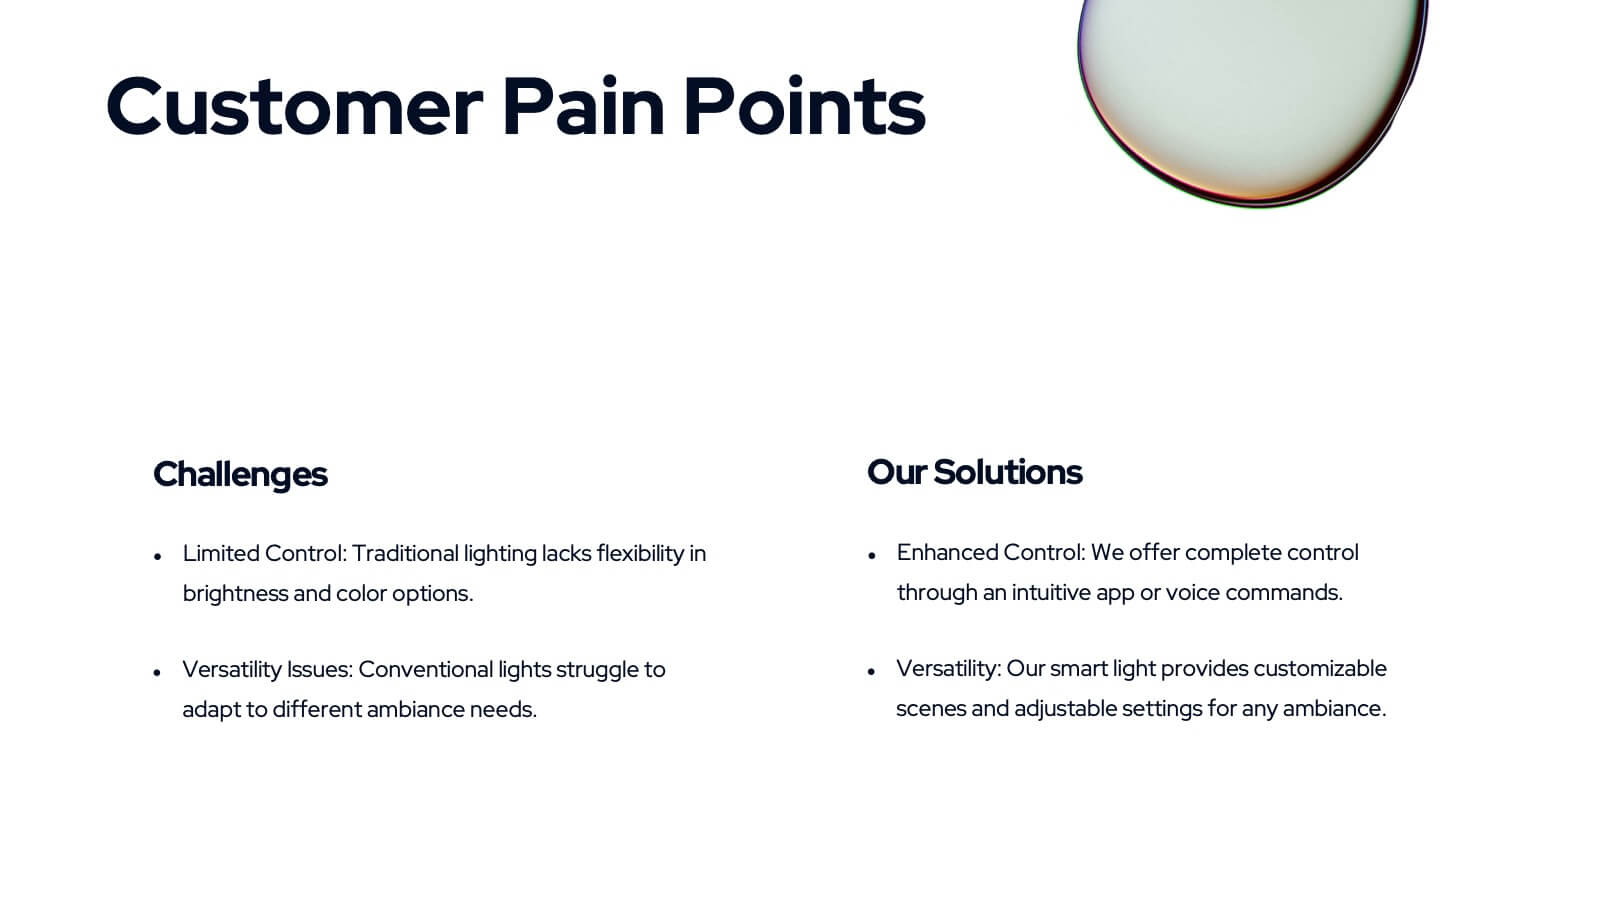
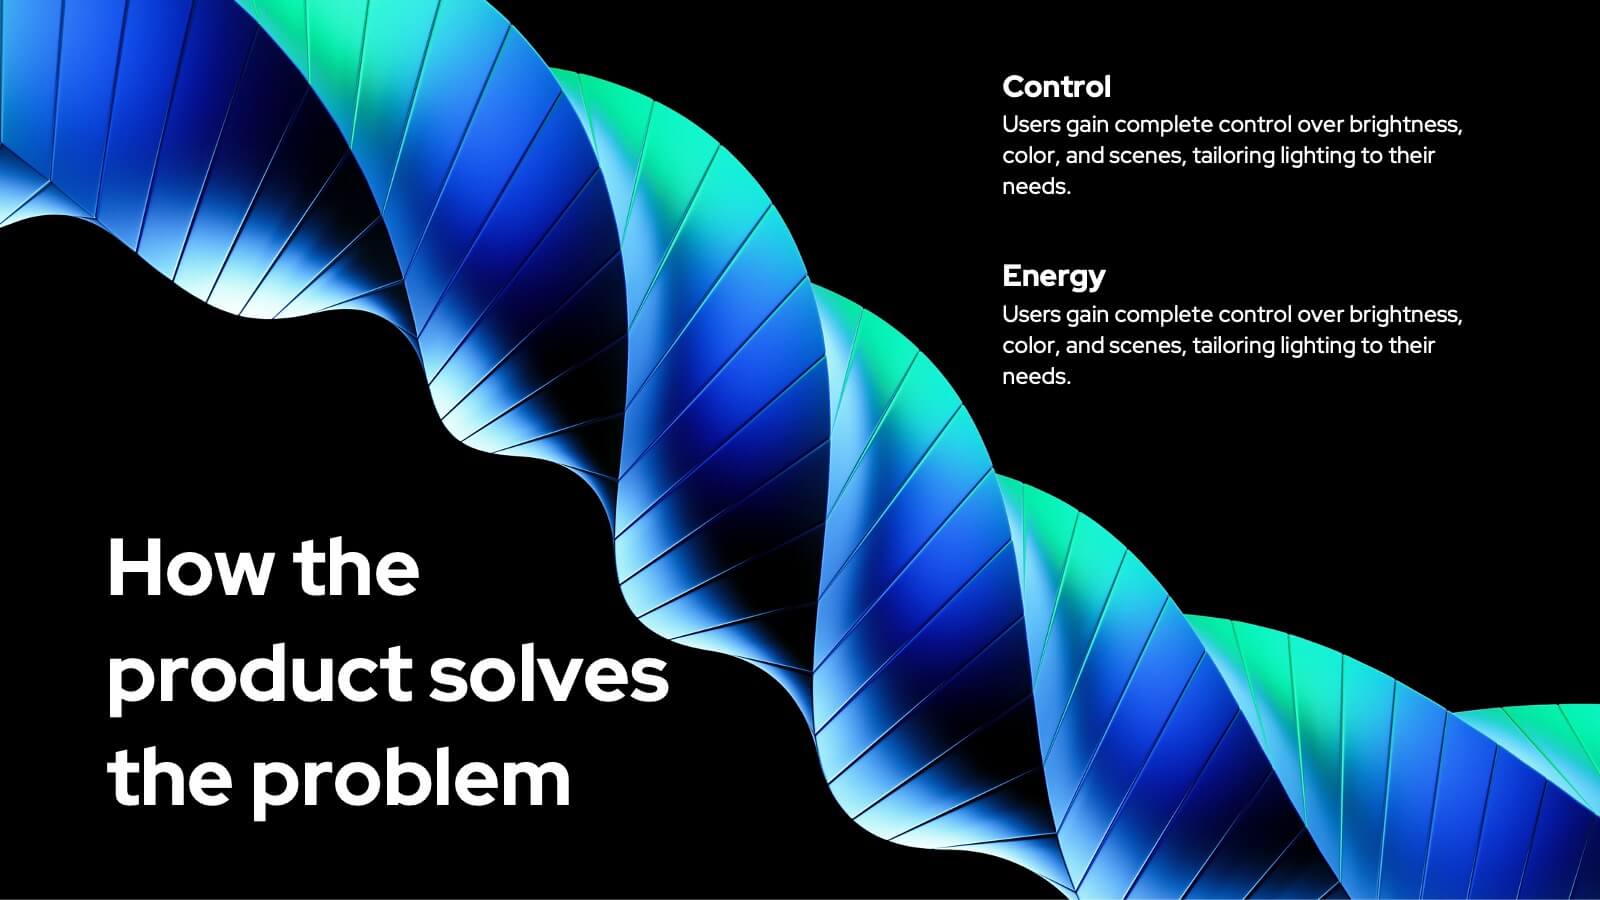
Business Value Proposition Presentation
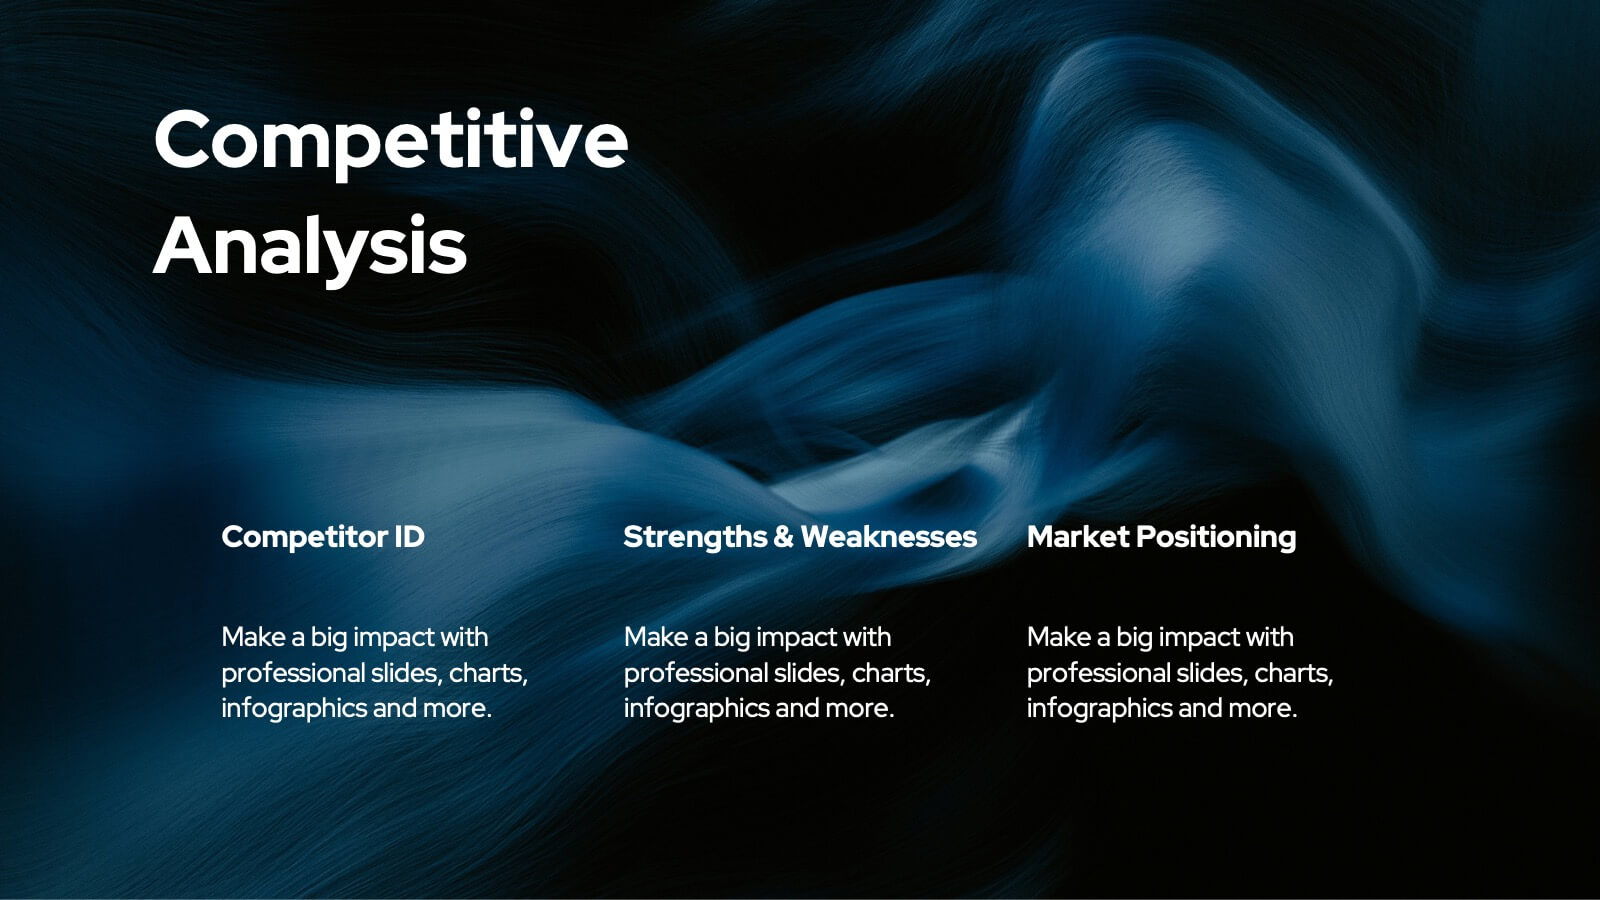
Ignite your strategy with this captivating template that highlights your unique business value. This tool breaks down key value propositions, market differentiators, and customer benefits in an engaging format. Perfect for pitching ideas, it clarifies competitive advantages and growth opportunities. Compatible with PowerPoint, Keynote, and Google Slides for seamless presentations.


5 slides
Climate Change and Conservation Presentation
Make your message on climate action clear and compelling with this visually striking template. Featuring an impactful thermometer and globe graphic, this layout is perfect for showcasing key climate data, conservation efforts, and environmental goals. Each step is numbered and color-coded for easy storytelling and clarity. Ideal for NGOs, science educators, and sustainability advocates. Fully editable in PowerPoint, Keynote, and Google Slides.


21 slides
Selkie New Product Proposal Presentation
Dive into your next big idea with this sleek, Selkie-inspired presentation template, designed for presenting a new product proposal! Highlight key features, market opportunities, and potential growth in a visually captivating format that flows effortlessly. Engage your audience and make an impact. Compatible with PowerPoint, Keynote, and Google Slides for easy customization.


5 slides
WFH Policy Overview Presentation
Bring clarity and confidence to your remote-work guidelines with a clean, puzzle-style layout that makes every policy easy to follow. This presentation explains key expectations, communication standards, and workflow essentials designed to support productive work-from-home environments. Fully customizable and compatible with PowerPoint, Keynote, and Google Slides.


7 slides
Porter's Five Forces Diagram
Porter's Five Forces is a strategic framework developed by Michael Porter that helps analyze the competitive environment of an industry. The five forces are represented in a diagram to understand the competitive dynamics and attractiveness of an industry or market. In this infographic template, the forces are represented as five segments of a circle or a graphical illustration with arrows and descriptions. Compatible with Powerpoint, Keynote, and Google Slides. This template is a powerful, bold, and insightful tool that dissects competitive forces, revealing strategic insights for businesses.


4 slides
Cloud Computing IT Architecture Presentation
Enhance your Cloud Computing IT Architecture presentations with this dynamic layered cloud infographic. Perfect for visualizing cloud storage and security frameworks, this template is fully customizable and compatible with PowerPoint, Keynote, and Google Slides.