


Features
- 5 Unique slides
- Fully editable and easy to edit in Microsoft Powerpoint, Keynote and Google Slides
- 16:9 widescreen layout
- Clean and professional designs
- Export to JPG, PDF or send by email


Do you have any questions?
Recommend


7 slides
Asia Map Infographic Presentation Template
Asia is the largest, most populous, and most culturally diverse continent. Asia constitutes of nearly one-third of Earth's landmass and is lying entirely north of the equator. The continent is home to a variety of cultures, ethnic groups, and religions. This Asian map template includes the different labeled countries, and graphs with statistics. This can be used to show your audience the geographical layout of Asia, or as an example of what a modern, professional presentation should look like. This template is a great resource for students, teachers and people who want to learn more about Asia.


10 slides
Corporate Governance and Law Presentation
Master the essentials of organizational oversight with the "Corporate Governance and Law" template, which offers a structured approach to business management, effectively illustrating key elements such as performance, strategy, governance, talent, and integrity. This layout ensures easy comprehension and is ideal for illustrating the hierarchical relationships and regulatory frameworks in corporate environments. Compatible with PowerPoint, Keynote, and Google Slides.


6 slides
User Experience Rating System Presentation
Evaluate user satisfaction with this user experience rating system template! Designed to visually represent feedback levels, this structured layout helps businesses analyze customer experiences, identify strengths, and address pain points. Perfect for UX research, surveys, and performance assessments. Fully customizable and compatible with PowerPoint, Keynote, and Google Slides


8 slides
Target Demographic Insights
Get a clear view of your audience with the Target Demographic Insights Presentation. This template uses a visual bullseye layout to highlight key demographic data through concentric circles and percentages. Ideal for marketers, brand strategists, or analysts, it helps you communicate audience segmentation and market reach effectively. Fully editable in PowerPoint, Keynote, and Google Slides.


7 slides
Success Iceberg Infographic
Iceberg Infographic are visual guides to understanding the world of business. Ideal for anyone who wants to understand the basics of business, from what it is and how it works to why it matters. This template is easy to read, and can be used for everything from data visualization to teaching people how to use a new product. Give your audience a look at the most important parts of your business. The template is easy to use, and allows you to highlight your data. Fully customizable and compatible with Powerpoint, Keynote, and Google Slides. There are multiple color themes, fonts, and shapes to choose from, and endless combinations to make it truly yours.


6 slides
Medical School Infographics
The "Medical School" infographic template is a meticulously curated and visually sophisticated tool, expertly tailored for PowerPoint, Keynote, and Google Slides. This template is an indispensable asset for medical educators, students, and healthcare professionals, aiming to illustrate the rigorous and multi-faceted journey of medical education. This template masterfully outlines key components of medical school, including curriculum structure, clinical rotations, research opportunities, and key milestones like exams and residencies. Its organized and detailed layout is perfect for guiding prospective students, orienting new enrollees, or showcasing medical programs during educational fairs and open houses. The design is as professional as it is educational, with a color scheme that is both serene and scholarly. This not only ensures your presentation is visually appealing but also aligns with the serious and life-changing nature of medical education. Whether it's used for orientation, academic presentations, or informational seminars, this template ensures that the journey through "Medical School" is presented in a manner that's both comprehensive and visually compelling.


5 slides
Global Warming Impacts Infographics
Global Warming refers to the long-term increase in Earth's average surface temperature due to human activities, primarily the emission of greenhouse gases. This is a visually engaging infographic template that highlights the impacts of global warming on the environment, ecosystems, and human societies. This template is made to create an understanding of the consequences of climate change and raise awareness about the urgent need for action. The eye-catching visuals and impactful messaging, make these infographics ideal for presentations, educational material, or awareness campaigns related to global warming and environmental sustainability.


5 slides
Psychological Depth Iceberg Insight
Explore the layers of thought, emotion, and motivation with the Psychological Depth Iceberg Insight Presentation. This template is designed to help visualize conscious vs. subconscious drivers—ideal for leadership training, behavior analysis, or mindset coaching. Fully editable in PowerPoint, Keynote, and Google Slides to fit your narrative.


6 slides
Probability Venn Diagram Infographic
This infographic template displays a set of Probability Venn Diagrams. These are visual tools used to represent the logical relationships between different sets of items, commonly utilized in statistics. They are perfect for presentations to explain concepts like intersections, unions, and complements of sets. Each Venn diagram in the image varies in complexity and color scheme, providing a range of options to illustrate how individual sets overlap or differ, which is useful in showing probabilities, possible logical relations, and more. These diagrams can be especially helpful in business or academic settings where data relationships need to be clarified visually.


6 slides
Presentation Roadmap Agenda Outline
Plan your sessions with clarity using the Presentation Roadmap Agenda Outline Presentation. This sleek visual tracks five key points along a timeline, using numbered markers and matching text areas—perfect for agendas, project stages, or presentation flows. Fully customizable in PowerPoint, Keynote, and Google Slides.


7 slides
Cloud Infographic Presentation Template
This Cloud infographic, is a versatile and professional template designed for corporate presentations. This is perfect for businesses and organizations in the technology and IT field, as well as any company looking to showcase their data and information in a visually appealing way. This template features a corporate style with a blue theme, which gives it a professional look and feel. The slides are filled with icons, and other visual elements that will help you communicate your message in an effective way. This template has everything you need to create an engaging and informative presentation.


20 slides
Onyx Project Proposal Presentation
This sleek, modern project proposal template is designed for clarity and impact. Featuring sections like objectives, scope of work, pricing structure, and client testimonials, it’s ideal for presenting detailed proposals to stakeholders. Perfectly compatible with PowerPoint, Keynote, and Google Slides, it ensures a professional presentation that impresses every time!


22 slides
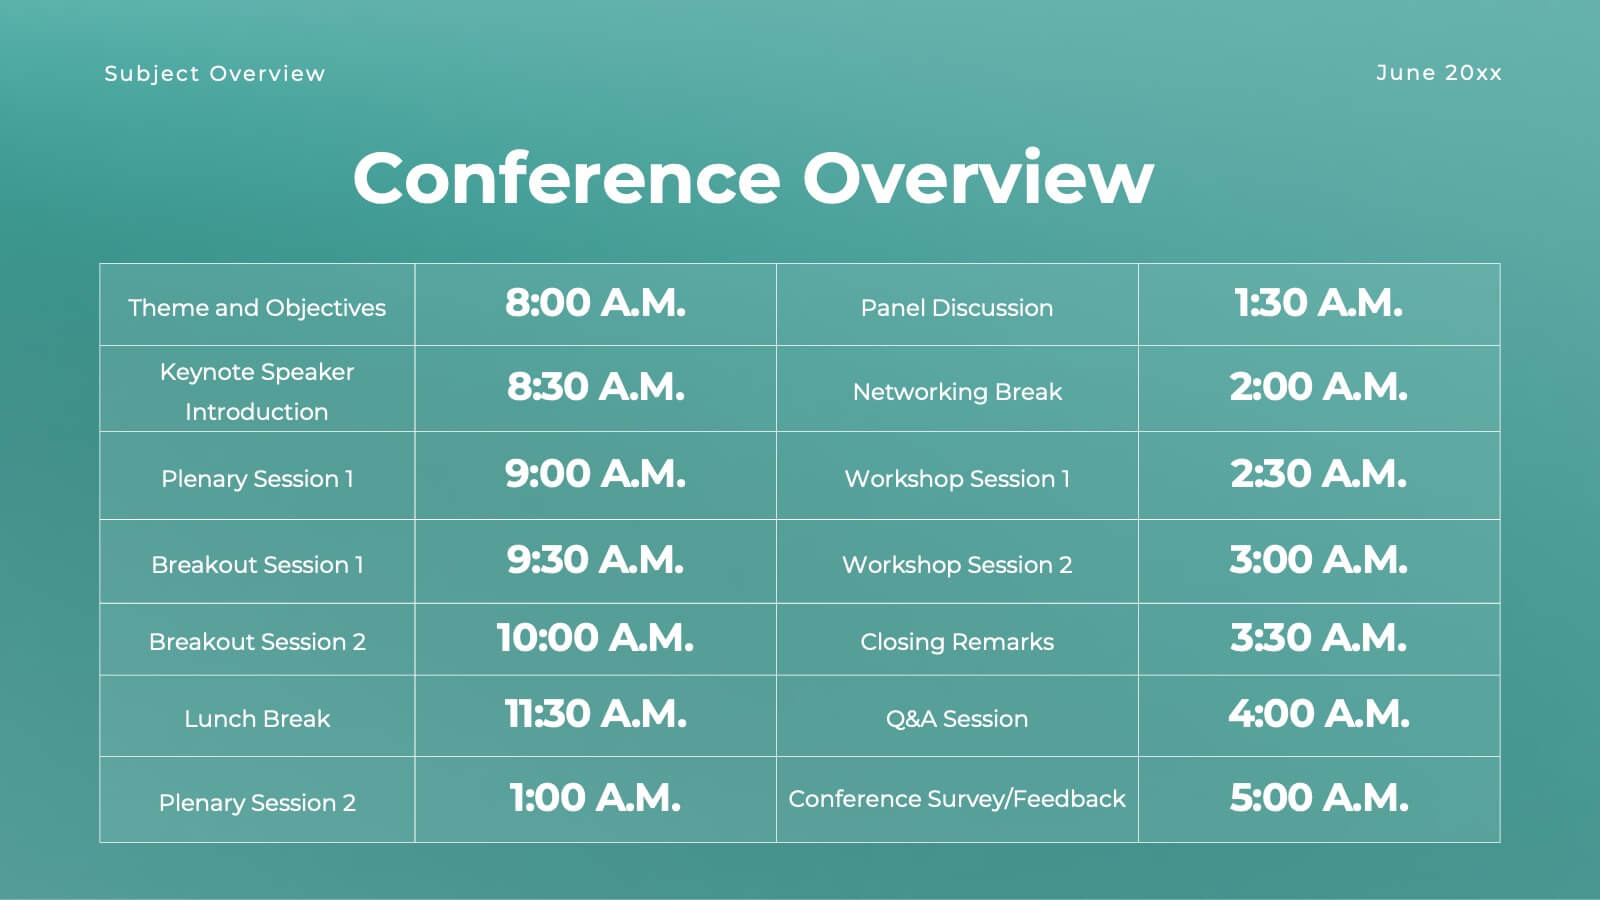
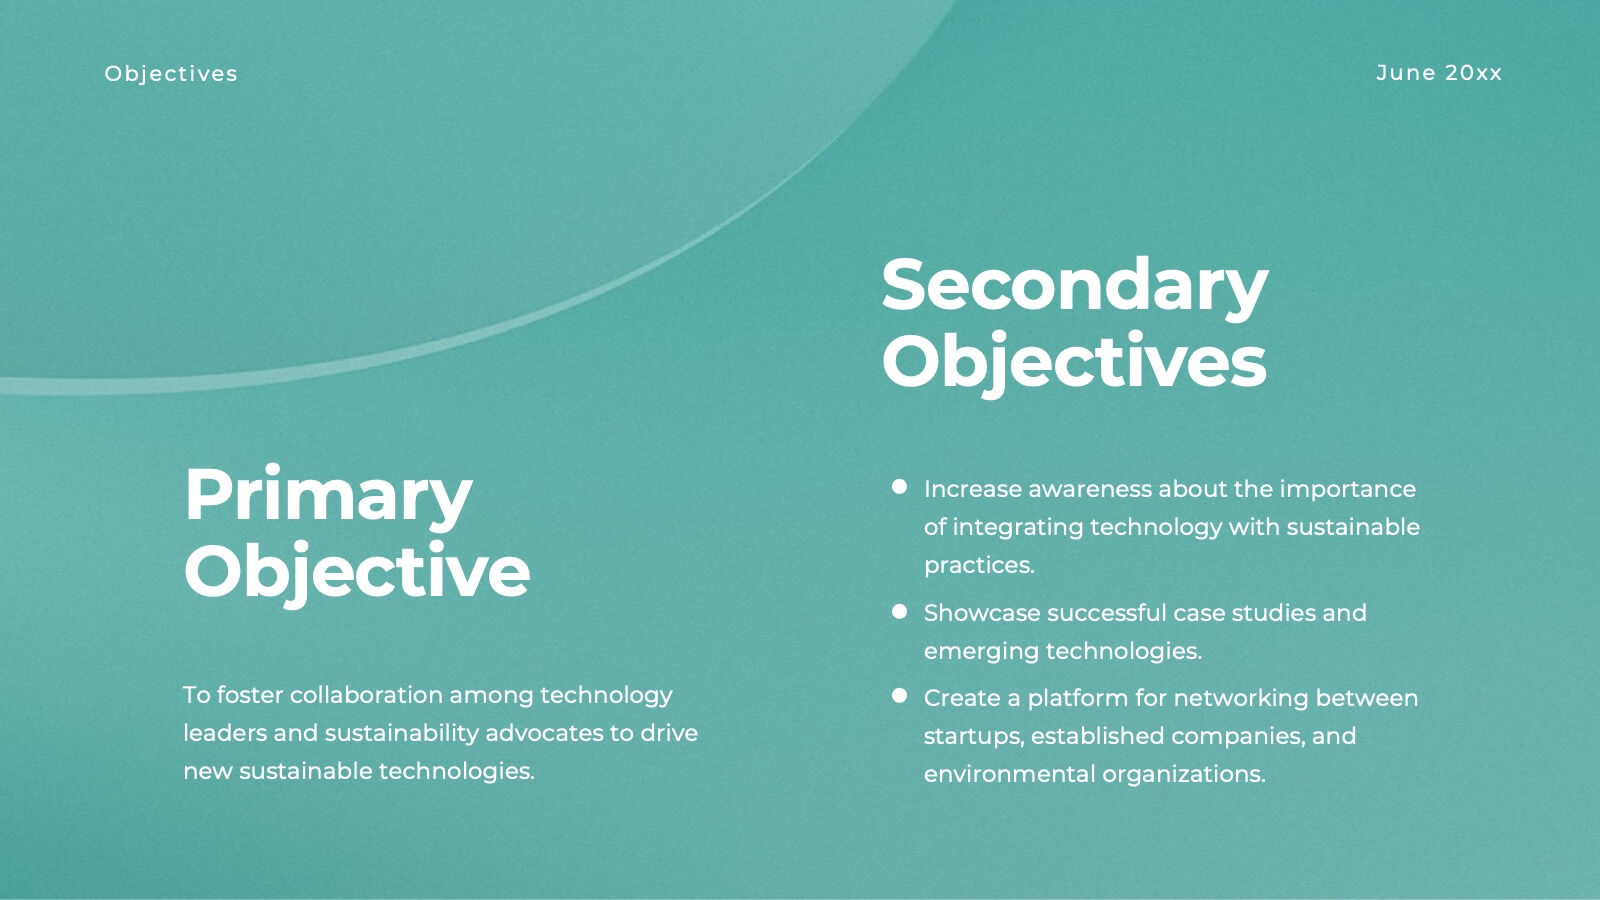
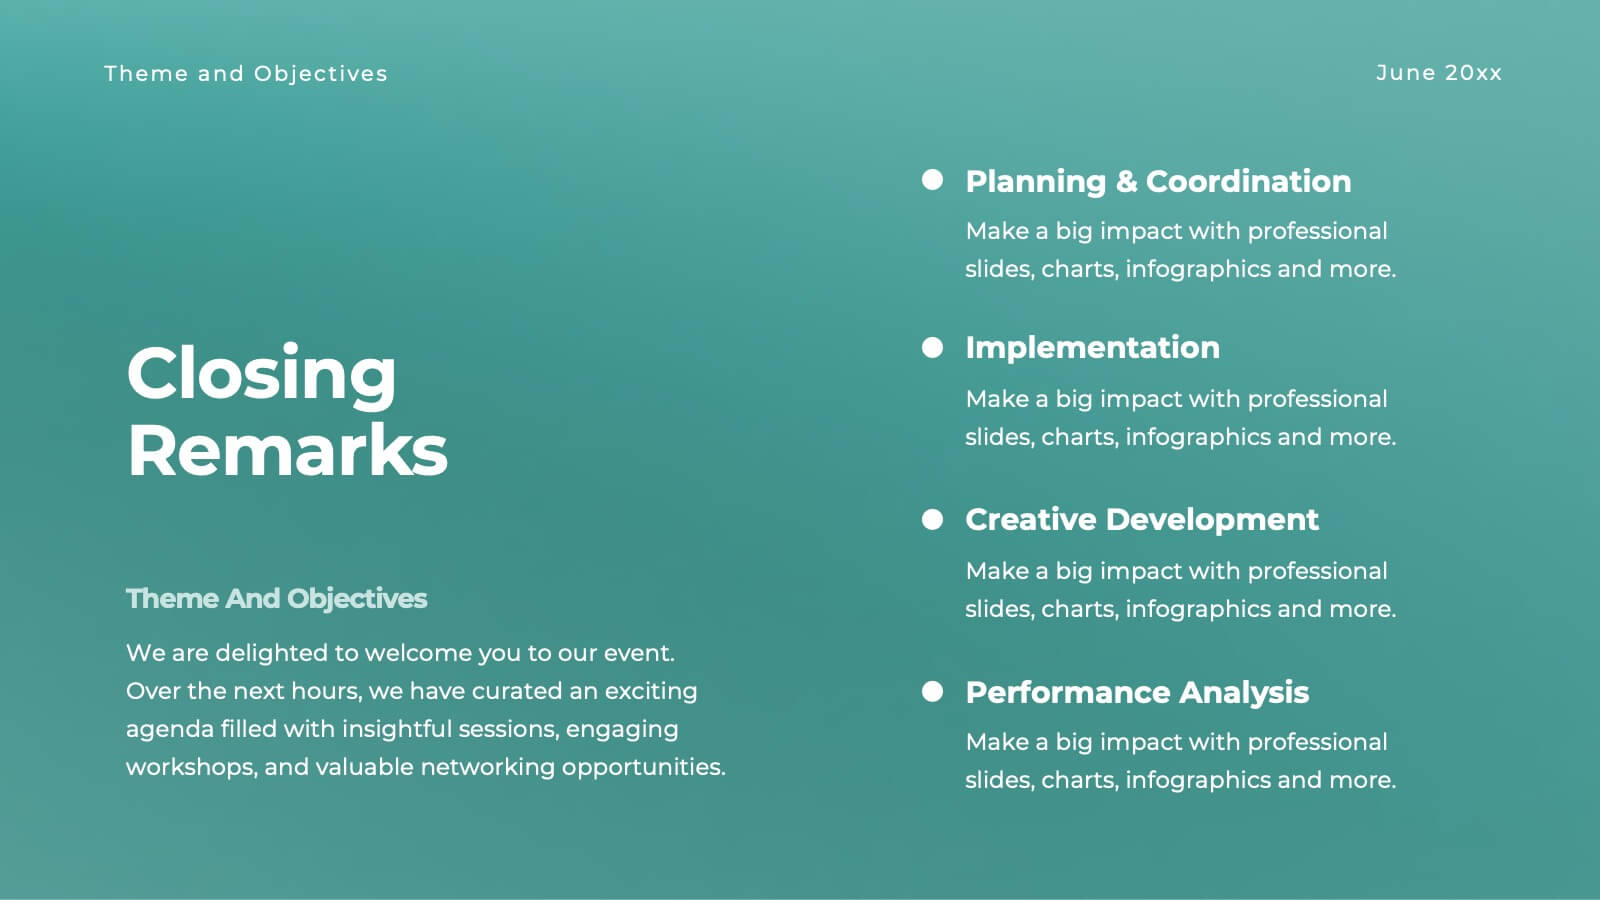
Halo Small Business Pitch Deck Presentation
Streamline your business presentations with this versatile pitch deck template! Ideal for conferences and meetings, it includes slides for objectives, session details, keynote speakers, and panel discussions. Keep your audience engaged with professional design and clear, structured content. Compatible with PowerPoint, Keynote, and Google Slides for seamless presentations on any platform.


14 slides
Business Proposal Presentation
Step into a world of strategic planning and execution with the Business Plan presentation template. The leading slide grabs attention, emblazoned with the bold title 'Business Plan', ready to unfold the story of your enterprise. Progress through a detailed Table of Contents, foreshadowing the comprehensive analysis within. You'll find meticulous breakdowns of data analytics, budget and pricing, benefits for clients and customers, and returns on investment. Each segment is crafted to deliver a thorough examination of your business model and projections. Punctuating the proposal are thought-provoking quotes and a clear call to action, guiding your potential partners towards engagement. A friendly 'We will be delighted to work with you' solidifies the welcoming approach, and the credits slide ensures due acknowledgement of all sources and contributions. This template is a beacon for any business aiming to present a compelling case for partnership or investment.


4 slides
Marketing SWOT Assessment Presentation
Analyze your brand’s position with this colorful Marketing SWOT Assessment layout. Clearly outline strengths, weaknesses, opportunities, and threats in a column format, perfect for client reports or strategy sessions. Fully customizable in PowerPoint, Keynote, and Google Slides—ideal for marketers seeking clarity, structure, and visual impact in every presentation.


5 slides
Visual Differentiator Comparison Slide Presentation
Make your unique selling points stand out with the Visual Differentiator Comparison Slide Presentation. This slide is designed to highlight key advantages between two offerings or brands using side-by-side stacked bars and icons. Emphasize what sets you apart at a glance. Fully editable in Canva, PowerPoint, and Google Slides.


6 slides
OKR Goal-Setting Framework Presentation
Achieve clarity and focus with the OKR Goal-Setting Framework. This structured layout helps visualize objectives and key results using hexagonal elements for a clear strategic overview. Perfect for business planning, performance tracking, and team alignment. Fully editable and compatible with PowerPoint, Keynote, and Google Slides for effortless customization.