


Features
- 6 Unique Slides
- Fully editable and easy to edit in Microsoft Powerpoint, Keynote and Google Slides
- 16:9 widescreen layout
- Clean and professional designs
- Export to JPG, PDF or send by email


Do you have any questions?
Recommend


7 slides
State-by-State Business Data Presentation
Break down insights with this State-by-State Business Data Presentation. Featuring a U.S. map segmented by regions, this slide is ideal for illustrating localized performance, regional statistics, or market segmentation. Customize text labels and highlight specific zones to match your business needs. Fully editable in PowerPoint, Keynote, and Google Slides.


4 slides
Human Resources KPI Dashboard Presentation
Bring your metrics to life with this clean and modern dashboard designed to highlight essential HR performance insights. It helps you present key indicators clearly, making data easy to compare and understand at a glance. Perfect for HR reviews or internal updates, and fully compatible with PowerPoint, Keynote, and Google Slides.


20 slides
Alchemy Sales Forecast Presentation
Elevate your sales strategy with this sleek and modern sales forecast presentation template. Featuring sections for sales objectives, pricing strategies, performance metrics, and future opportunities, it’s perfect for teams aiming to analyze and plan effectively. Fully compatible with PowerPoint, Keynote, and Google Slides for seamless professional presentations.


5 slides
Mental Health Counseling Infographics
Mental health counseling is a form of therapy that focuses on helping individuals improve their mental and emotional well-being. These infographic templates are designed to raise awareness about mental health counseling and its benefits. This aims to educate and inform individuals about the importance of seeking professional help for mental health concerns and highlights the various aspects of mental health counseling. Use these to present your next educational presentation on mental health or online platforms, this provides essential information and visual aids to encourage the benefits of seeking counseling.


7 slides
Strategic Highlights Executive Summary Presentation
Showcase your business priorities with the Strategic Highlights Executive Summary Presentation. This layout features up to seven colorful, clearly labeled content blocks—perfect for summarizing goals, KPIs, initiatives, or focus areas. Easy to edit in PowerPoint, Keynote, Google Slides, or Canva for quick customization and clean executive reporting.


7 slides
Loves Travel Infographic Presentation
Travel is an opportunity to get out of our comfort zones and be inspired to try new things, it changes our perspective on the world. Use this template to give your audience an overview of a trip and prepare them for what they will be experiencing. This template features an infographic style design, with plenty of room to describe the locations and activities as well as instructions and tips. Build your own infographic with this template, and add it to your presentations. You can easily add your own content in PowerPoint, Keynote, or Google slides and turn it into a fun presentation in minutes.


26 slides
Kimbr Presentation Template
Kimbr is a modern and simple Powerpoint template that uses bold text in order to immediately catch your audience’s attention and let them focus on your innovative ideas. Combined with the modern and minimalistic style of Kimbr, this presentation packs a punch in the minimalism department: It comes with unique and modern slides perfect for Spa businesses or anyone looking for a clean minimal presentation. In addition, it has Charts, timelines and image placeholders, you'll be sure to find a space for all your information. Don't wait any longer and get started presenting your ideas today.


5 slides
A to Z Slide Concept Presentation
Bring your ideas to life with a bold, block-style visual that makes complex concepts feel simple and structured. This slide is perfect for breaking down processes, frameworks, or step-by-step explanations in a clear, memorable way. Fully editable and compatible with PowerPoint, Keynote, and Google Slides.


6 slides
Personal Productivity Time Management Techniques Presentation
Streamline your workflow with the Personal Productivity Time Management Techniques presentation slide. Featuring a step-by-step staircase layout, this template visually maps out five core techniques or habits leading to improved efficiency and goal achievement. Each step includes an icon and placeholder text for easy customization. Ideal for productivity coaches, corporate trainers, or time management workshops. Fully editable in PowerPoint, Keynote, and Google Slides.


5 slides
Agriculture Industry Infographics
Delve into the heart of the agricultural sector with our agriculture industry infographics. Cast in the earthy tones of green and yellow, reflecting growth and harvest, this template brings the farming industry to your fingertips. Its creative, vertical design infused with farm-style aesthetics makes it perfect for agricultural educators, and farming consultants seeking to present data with a touch of nature's essence. Compatible with Powerpoint, Keynote, and Google Slides. The template boasts graphics, intuitive icons, and flexible image placeholders. From showcasing industry trends to unraveling complex farming processes.


7 slides
Company Profile Overview Infographic
This set of company profile templates is expertly designed to help organizations succinctly and effectively convey their corporate identity and core values. Ideal for businesses seeking to outline their brand, history, and capabilities, each template is structured to enhance the presentation of company data to stakeholders and clients. The templates feature professional layouts that prioritize ease of reading and aesthetic appeal, ensuring that critical information like company achievements, mission, and service offerings are highlighted effectively. The designs incorporate a clean, contemporary style with ample space for customization, allowing companies to adapt the visuals and text to match their branding requirements. This adaptability makes the templates suitable for a wide range of industries and purposes, from corporate introductions and annual reports to marketing materials and business proposals. By providing a coherent structure that businesses can personalize with their specific details, these templates serve as a valuable tool in building a strong, professional image. They offer practical solutions for companies to present themselves in a polished and organized manner, fostering a positive impression among potential investors, clients, and partners.


4 slides
Business Strategy Alternatives Presentation
Present and compare strategic choices effectively with the Business Strategy Alternatives Presentation template. Designed to highlight key decision points, competitive advantages, and alternative approaches, this slide is ideal for business strategy discussions, market positioning, and executive planning. Fully customizable for PowerPoint, Keynote, and Google Slides to fit your presentation needs.


4 slides
Device Mockup Display Slide Presentation
Showcase your digital products with this device mockup slide. Ideal for highlighting landing pages, dashboards, or app interfaces, the layout includes clean typography and vibrant shapes for visual balance. Fully editable in PowerPoint, Keynote, and Google Slides—customize text, colors, and images to fit your tech brand or presentation style.


26 slides
Workouts for Every Body Part Presentation
Achieve total-body fitness with this dynamic presentation on targeted workouts for every muscle group. Covering effective exercises, proper form, strength training techniques, and workout plans, this template helps simplify fitness routines for all levels. Fully customizable and compatible with PowerPoint, Keynote, and Google Slides for a seamless and engaging presentation experience.


6 slides
Market Differentiation with Blue Ocean Strategy
Position your brand uniquely with this Market Differentiation slide based on Blue Ocean Strategy principles. Featuring a clean, strategic layout with a blend of visuals and text, this template is ideal for competitive analysis, innovation roadmaps, and strategic marketing plans. Fully customizable in PowerPoint, Keynote, and Google Slides.


5 slides
Best Travel Planning Template
Bring wanderlust to life with a slide that turns trip planning into a clear, engaging journey. This presentation breaks down key travel steps—documents, packing, routes, and timing—using simple visuals that keep details organized and easy to follow. Fully customizable and compatible with PowerPoint, Keynote, and Google Slides.


20 slides
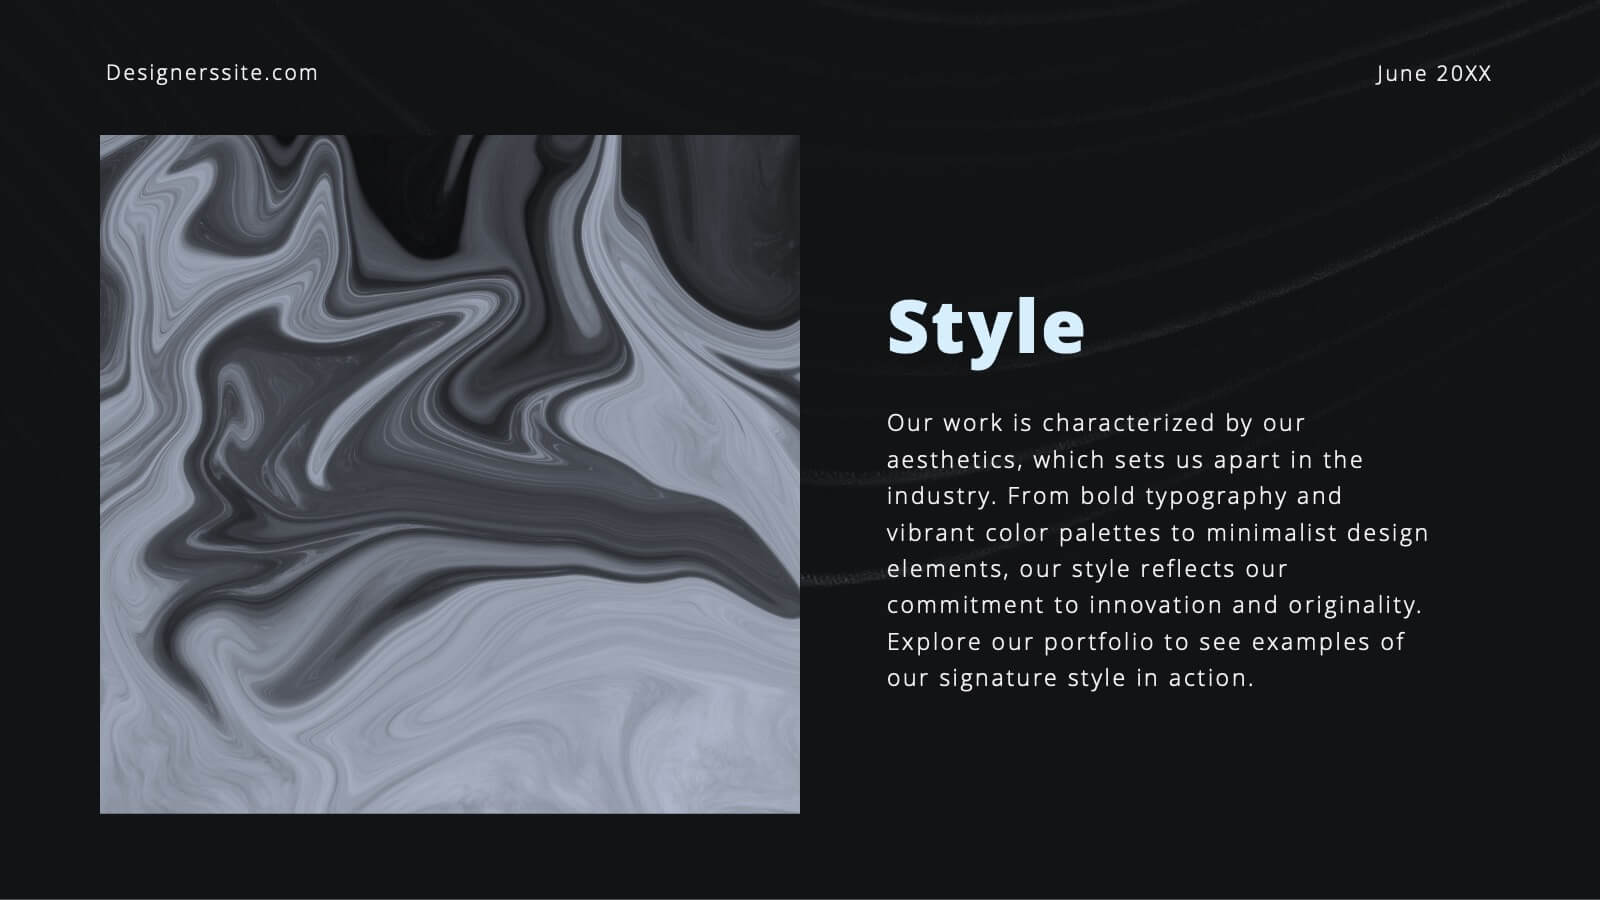
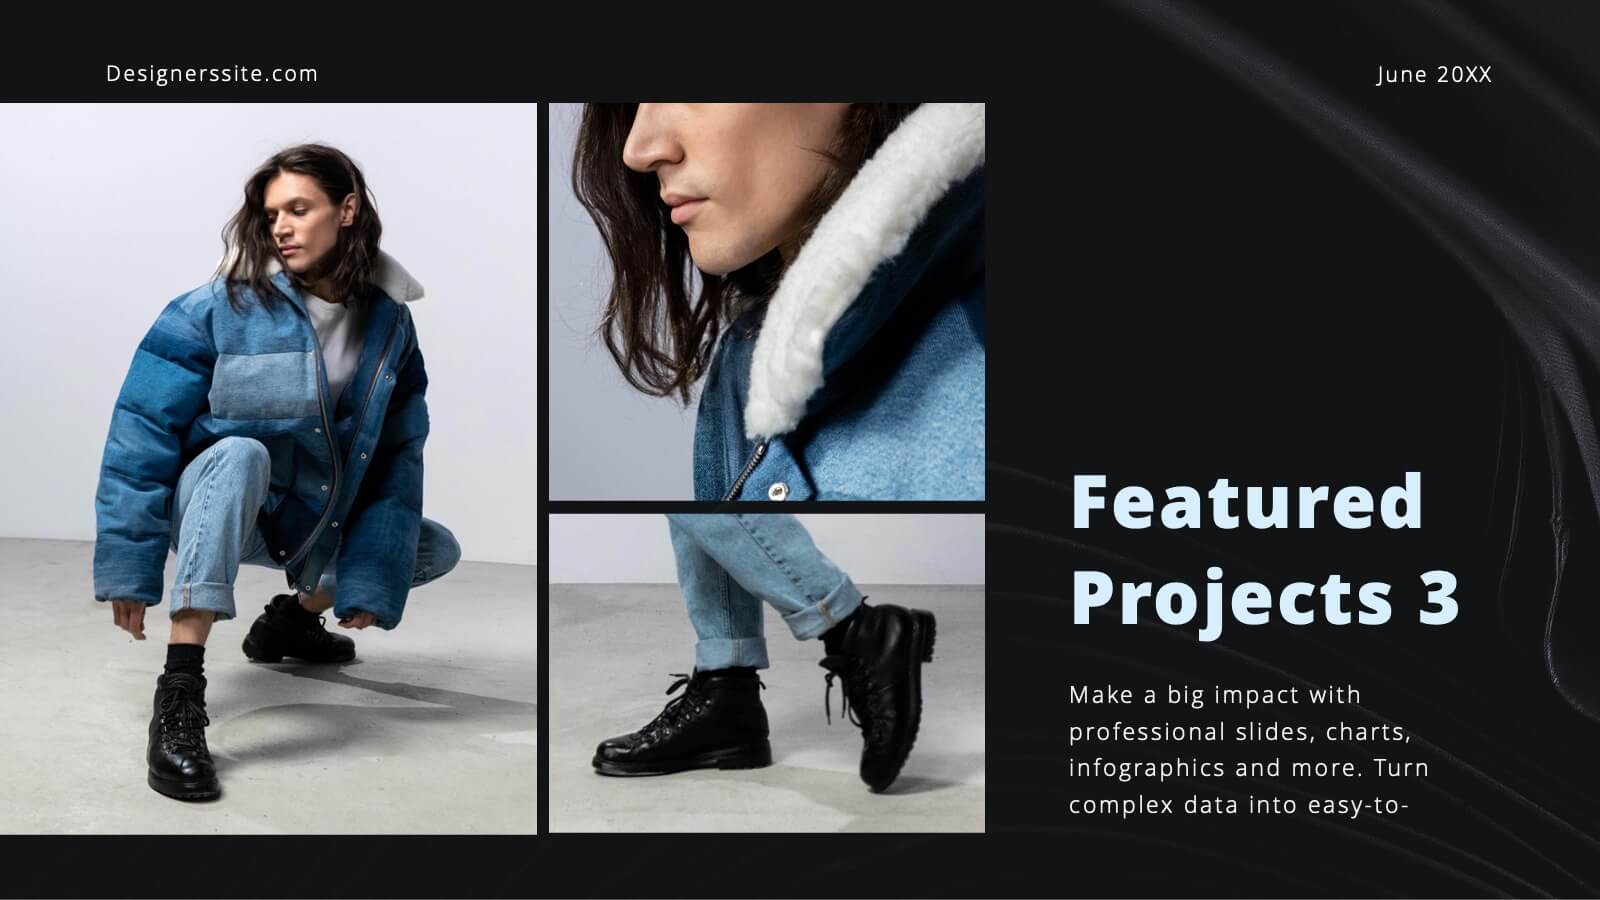
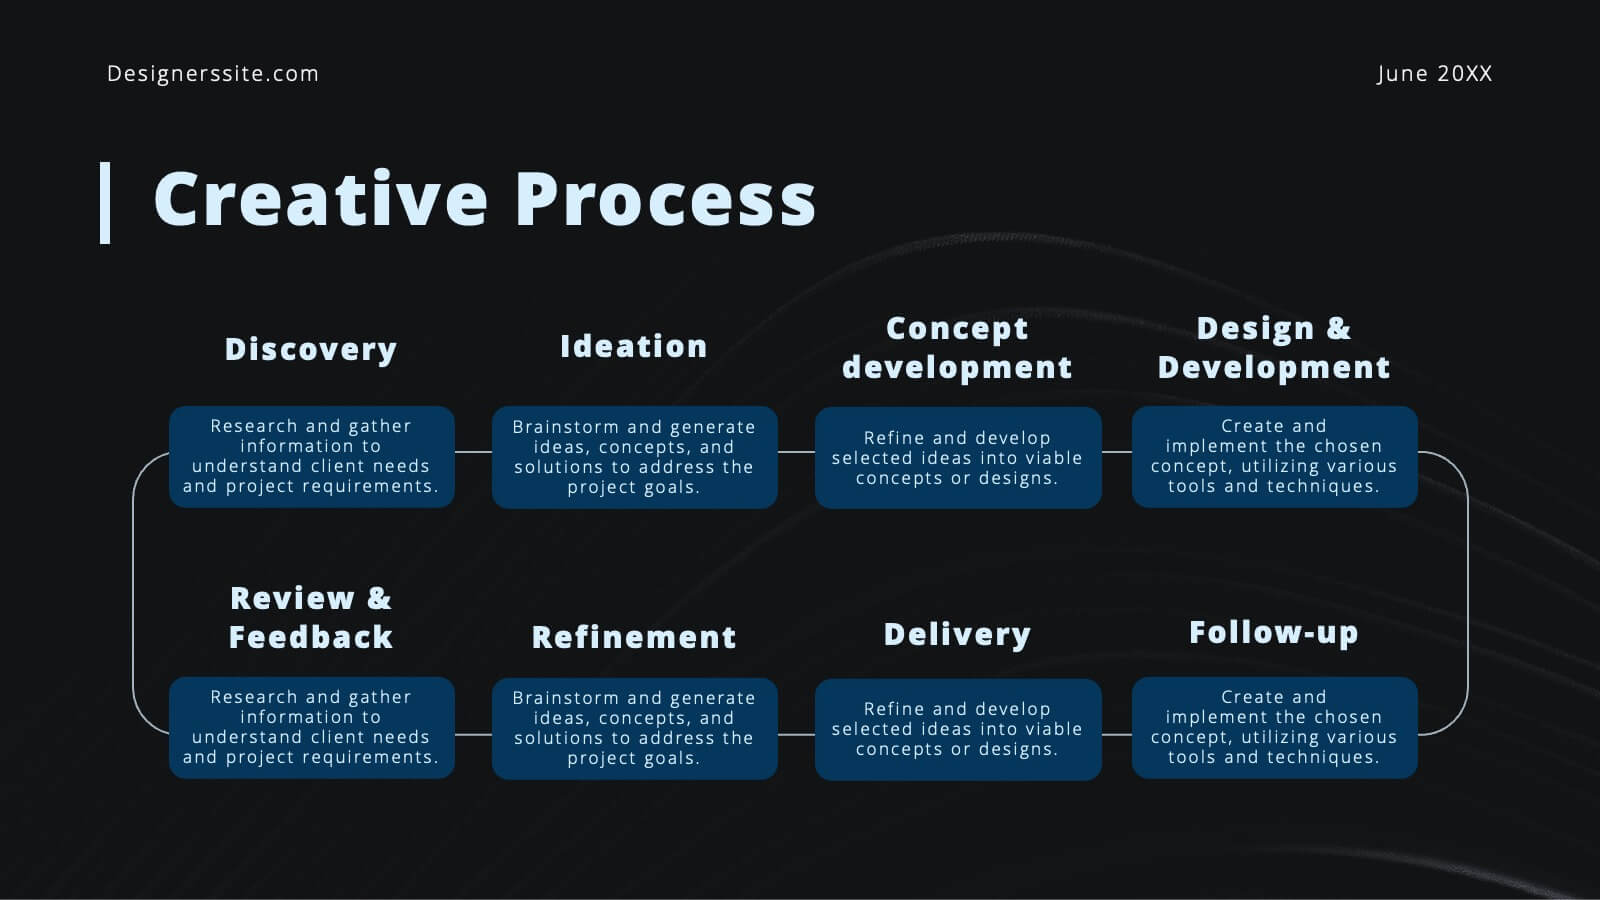
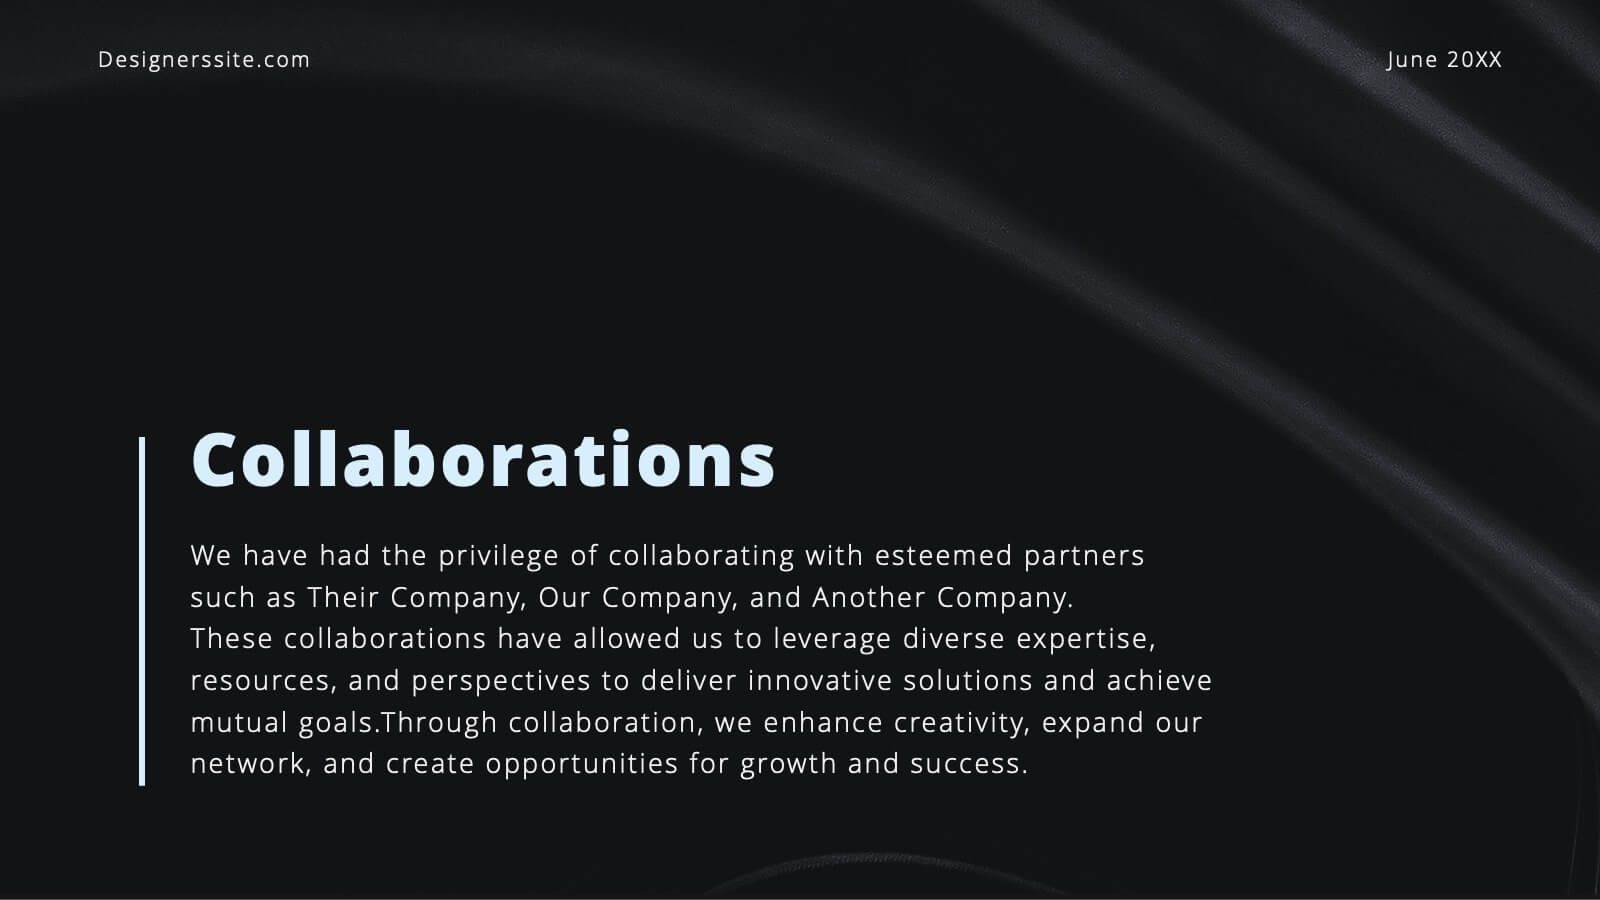
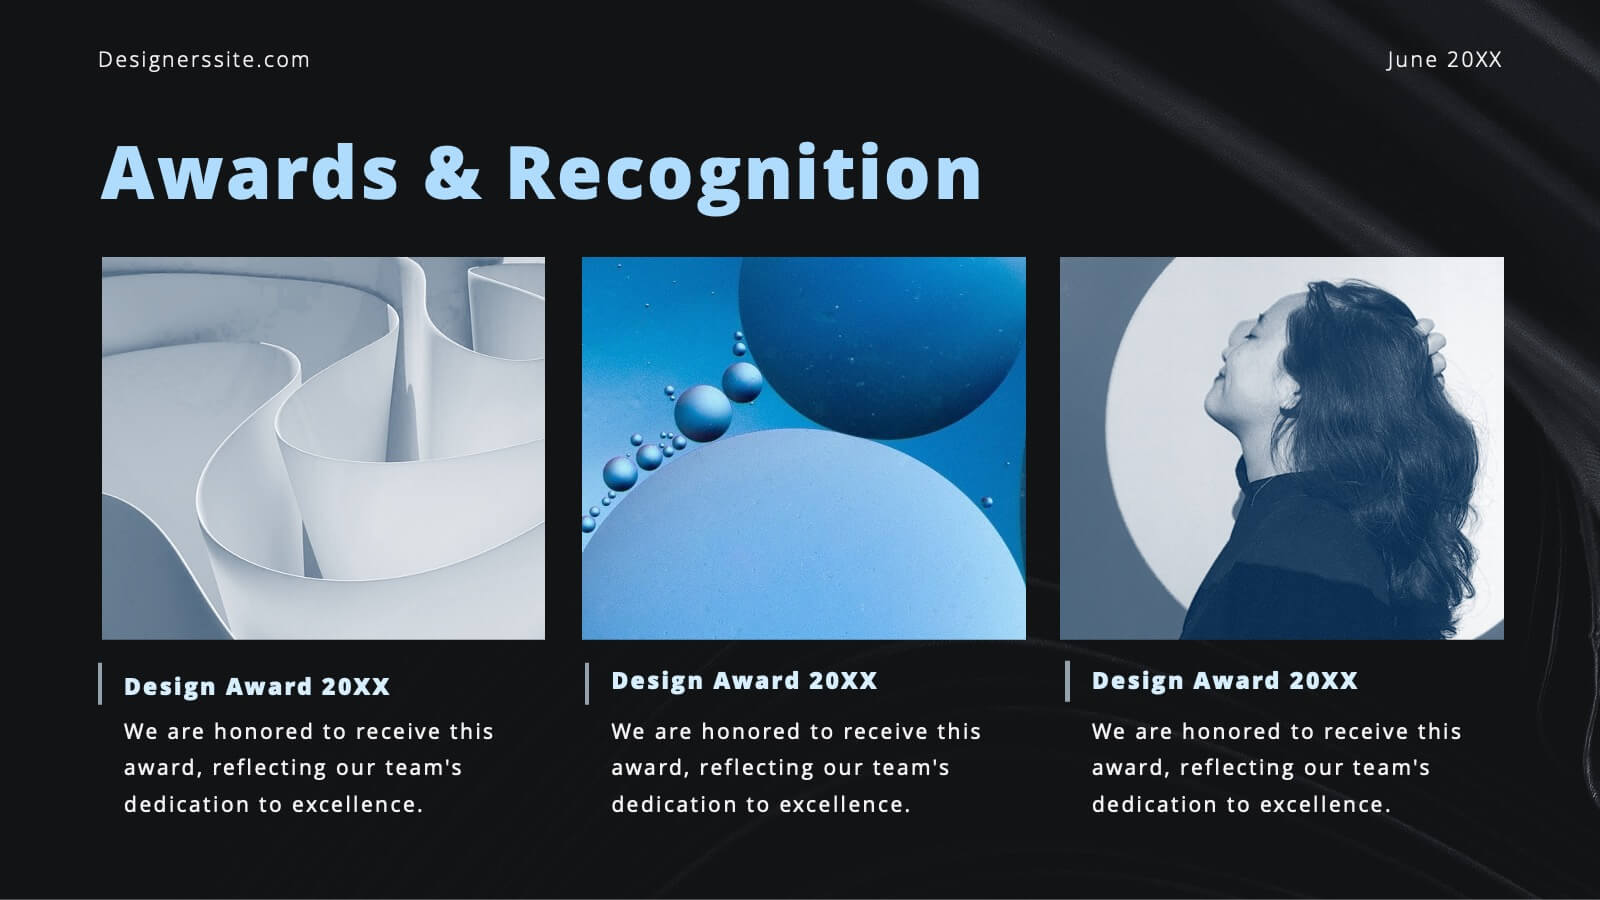
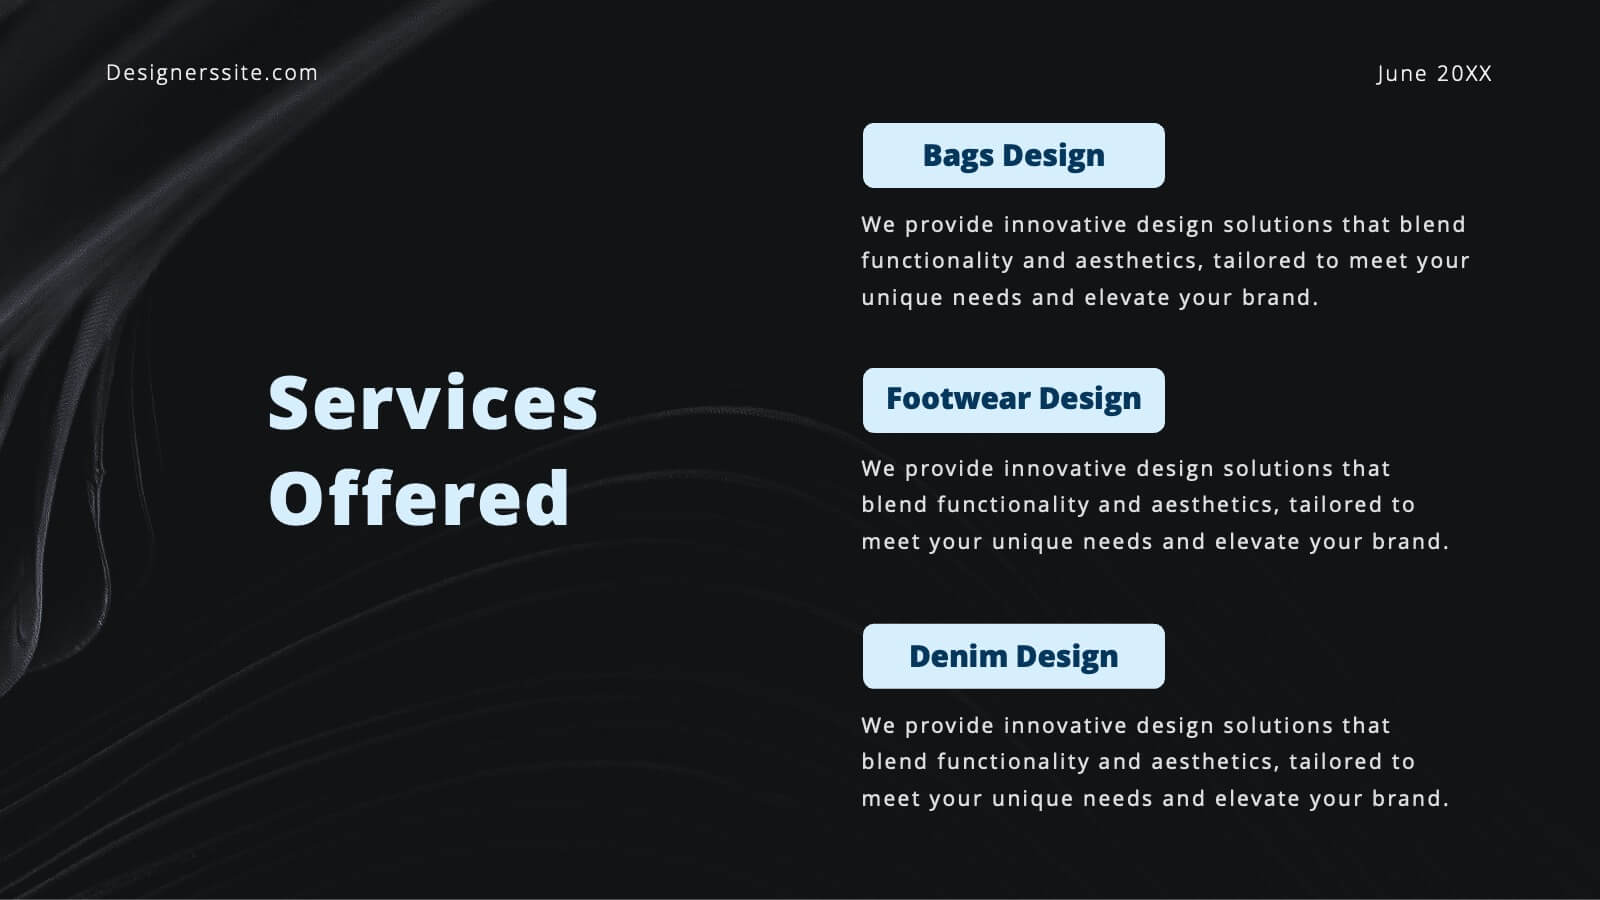
Bravo Creative Portfolio Presentation
Showcase your creative prowess with this sleek, modern portfolio presentation template. Perfect for highlighting featured projects, client testimonials, and your creative process, this template ensures your work shines. Its stylish design and professional layout make it ideal for impressing potential clients and collaborators. Compatible with PowerPoint, Keynote, and Google Slides, it's versatile for any platform.