


Features
- 5 Unique slides
- Fully editable and easy to edit in Microsoft Powerpoint, Keynote and Google Slides
- 16:9 widescreen layout
- Clean and professional designs
- Export to JPG, PDF or send by email


Do you have any questions?
Recommend


4 slides
Simple RACI Matrix Overview Presentation
Bring instant clarity to every role with a clean, puzzle-style layout designed to map responsibilities without confusion. This presentation helps teams outline who leads, supports, approves, and stays informed in any project, turning tasks into a simple visual grid. Fully editable and compatible with PowerPoint, Keynote, and Google Slides.


7 slides
Frequently Asked Questions (FAQ)
Answer key concerns clearly with this Frequently Asked Questions (FAQ) infographic template. Featuring a clean question mark-centered design with six content blocks, this layout is perfect for addressing customer queries, onboarding information, or stakeholder briefs. Fully customizable in PowerPoint, Keynote, and Google Slides.


8 slides
Europe Market Trends with Europe Map Presentation
Showcase key market insights with this Europe-focused presentation. Highlight regional trends using data-driven visuals, including percentage indicators and color-coded country comparisons. Ideal for marketing reports, business expansion plans, or performance reviews. Fully editable and compatible with PowerPoint, Keynote, and Google Slides for seamless customization across platforms.


5 slides
Global Warming Crisis Infographics
Global Warming refers to the long-term increase in the Earth's average surface temperature, primarily caused by the buildup of greenhouse gases in the atmosphere. This vertical infographics includes information about the effects of climate change on the planet. There are designed sections where you can feature data on rising temperatures, sea levels, and extreme weather events. These infographics feature unique designs that incorporate colors and images that convey the severity and urgency of this crisis. The goal of this template is to raise awareness about the need to address the global warming crisis and mitigate the impact of climate change.


7 slides
Venn Diagram Statistics Infographic Presentation
Venn diagrams are important because they show relationships between two or more ideas. The circles—either filled in with color or left empty—create a picture of how things relate to one another, while arrows show which things are overlapping. This template is easy to use and has a cool green color scheme that is easy on the eyes. It has a customizable layout to make your presentation unique! With this template, you can create awesome Venn Diagrams that will help you compare and contrast information in a way that is easy to understand. This is perfect for school projects or even work presentations.


2 slides
Elegant Thank You Slide
Leave a lasting impression with this modern and refined thank-you slide. Designed with clean lines, professional typography, and an image placeholder to showcase your team, workspace, or branding. Ideal for closing business decks and project presentations. Compatible with PowerPoint, Keynote, and Google Slides.


6 slides
Multiple Business Solutions Options Slide Presentation
Explore diverse strategies with the Multiple Business Solutions Options Slide Presentation. Featuring a vertical stack of labeled briefcases (A–F), this slide is designed to compare and communicate multiple business ideas, solutions, or pathways in a clear, structured layout. Ideal for pitching product variations, workflow choices, or market entry tactics. Each option is paired with customizable text fields for added clarity. Compatible with PowerPoint, Keynote, and Google Slides for easy editing and integration into your existing decks.


6 slides
Editable Gantt Timelines Presentation
Bring your project plans to life with a clean, colorful timeline that makes progress easy to track and goals simple to communicate. This presentation helps teams visualize schedules across quarters, highlight tasks, and manage deadlines with clarity. Fully compatible with PowerPoint, Keynote, and Google Slides.


6 slides
SMART Goal Setting Process Presentation
Clearly define and communicate your business goals with the SMART Goal Setting Process slide. This layout visually breaks down the SMART framework—Specific, Measurable, Achievable, Relevant, and Time-bound—using icons, headers, and editable descriptions for each section. Ideal for strategy planning, goal tracking, and team alignment. Easily customizable in PowerPoint, Keynote, and Google Slides to suit any industry or project.


8 slides
Health Metrics and Wellbeing Dashboard Presentation
Visualize patient insights with this dashboard-style layout combining human figures, progress bars, and anatomical icons. Ideal for healthcare data, wellness reporting, or gender-based analysis, it balances stats and storytelling effectively. Customize it easily in PowerPoint, Keynote, or Google Slides for your next health-focused presentation.
26 slides
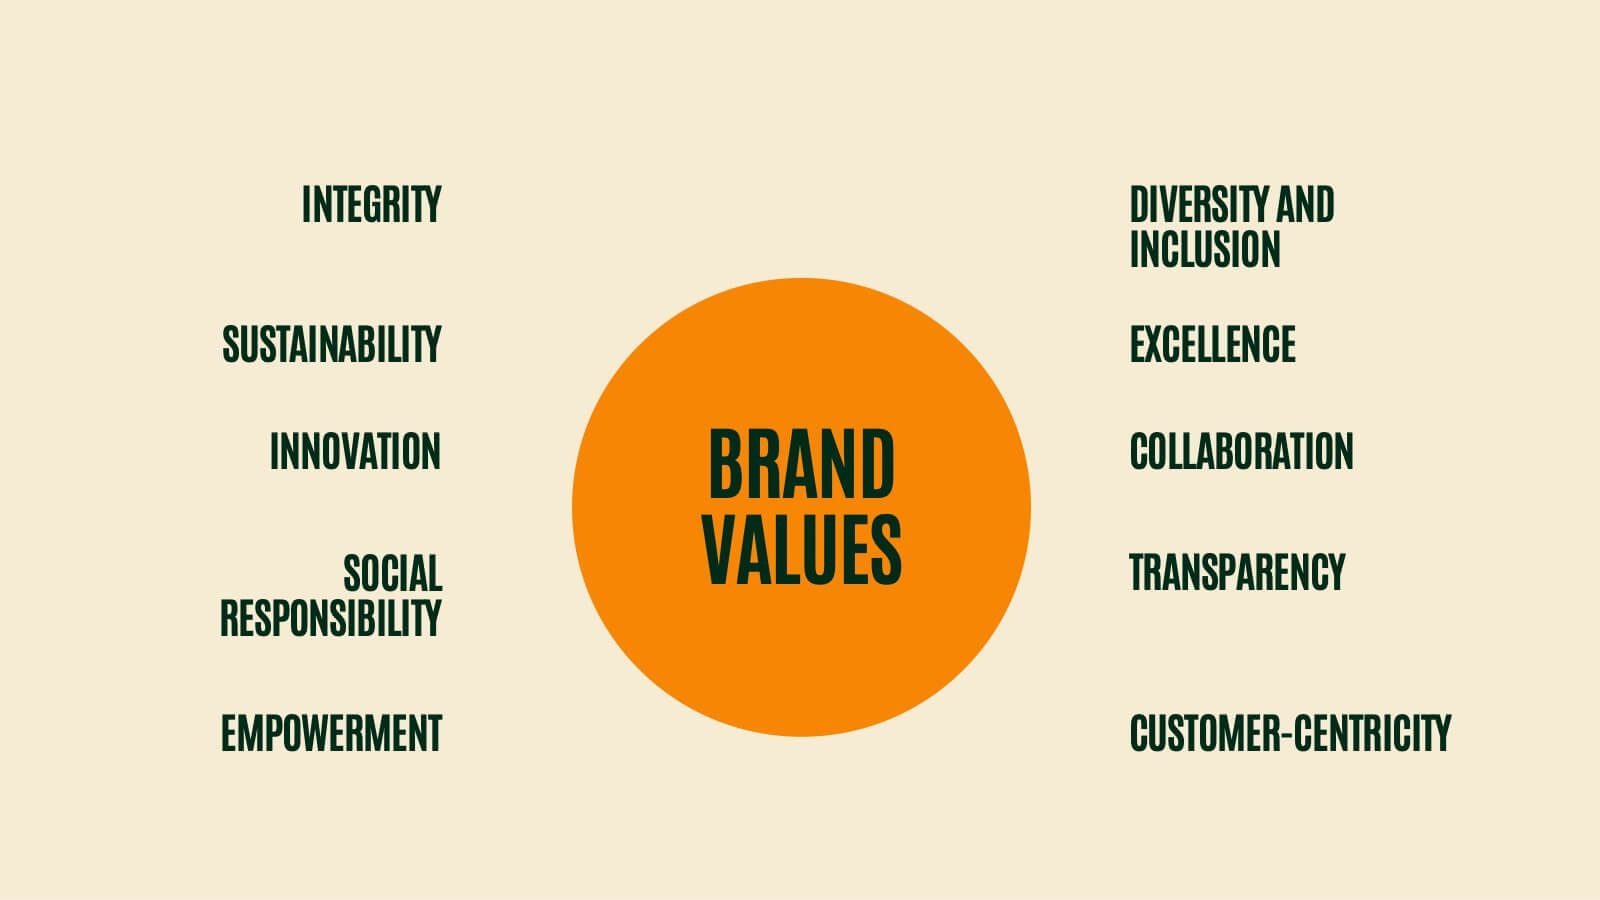
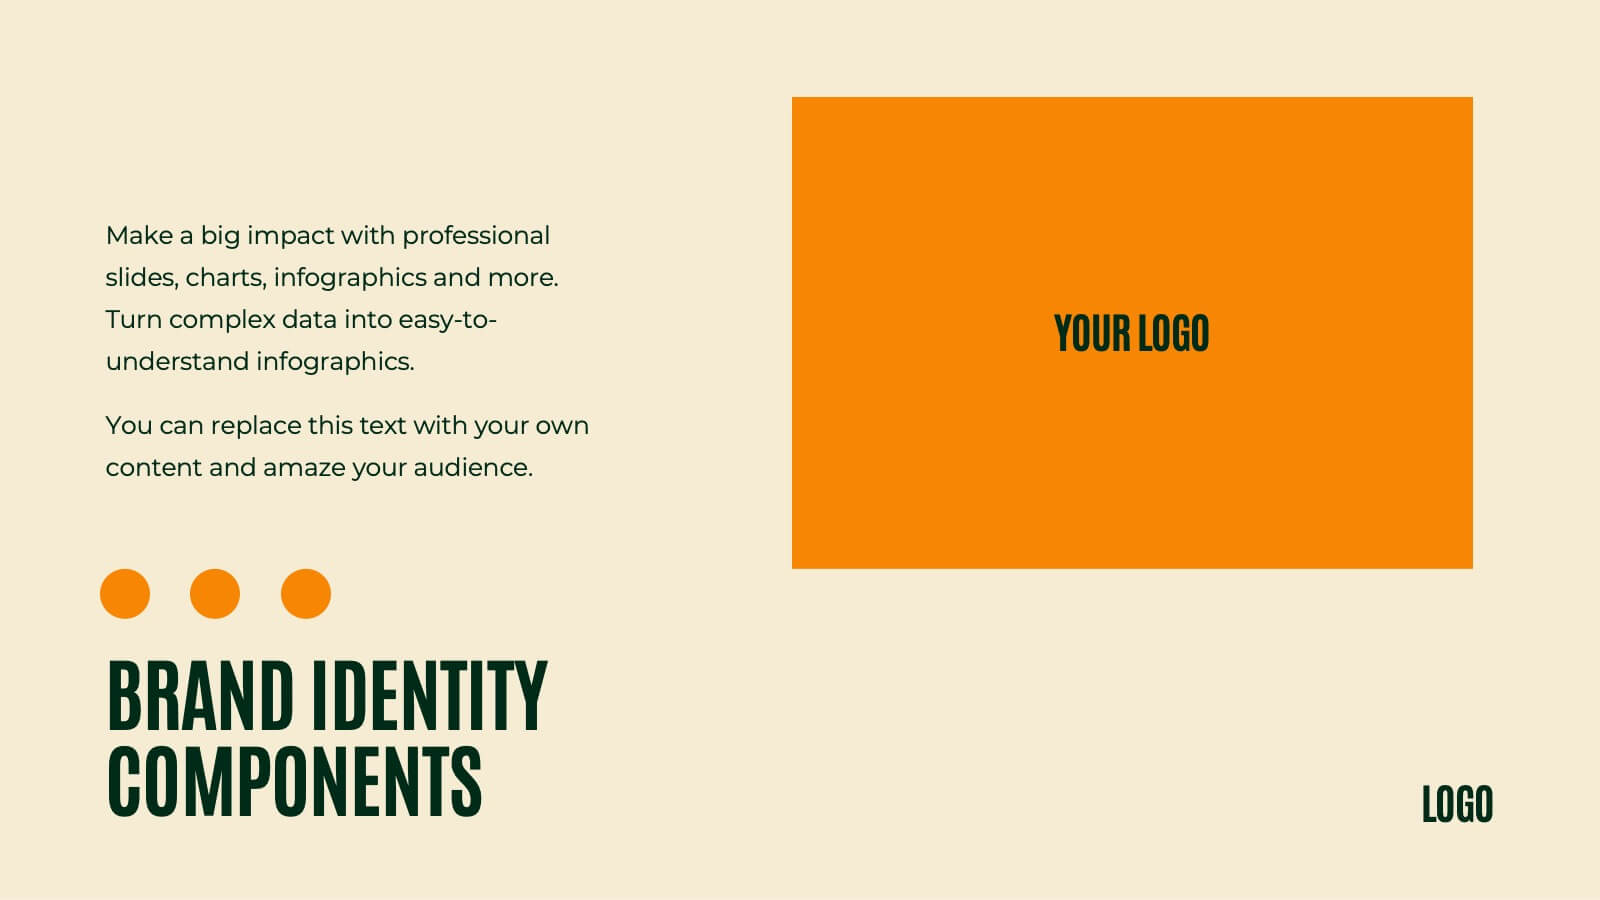
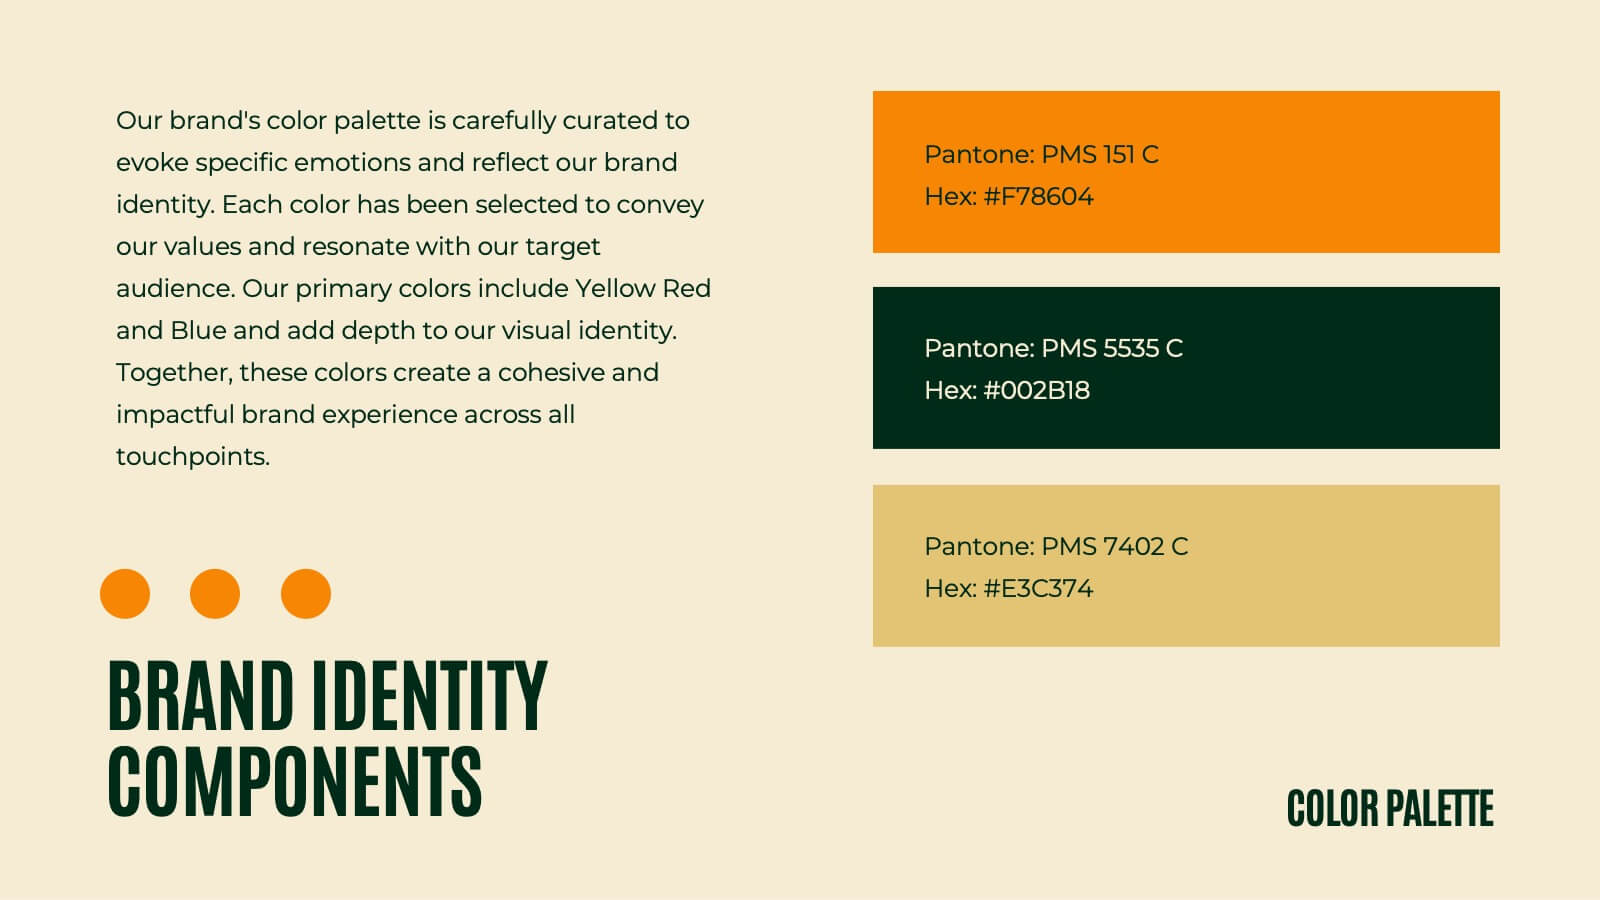
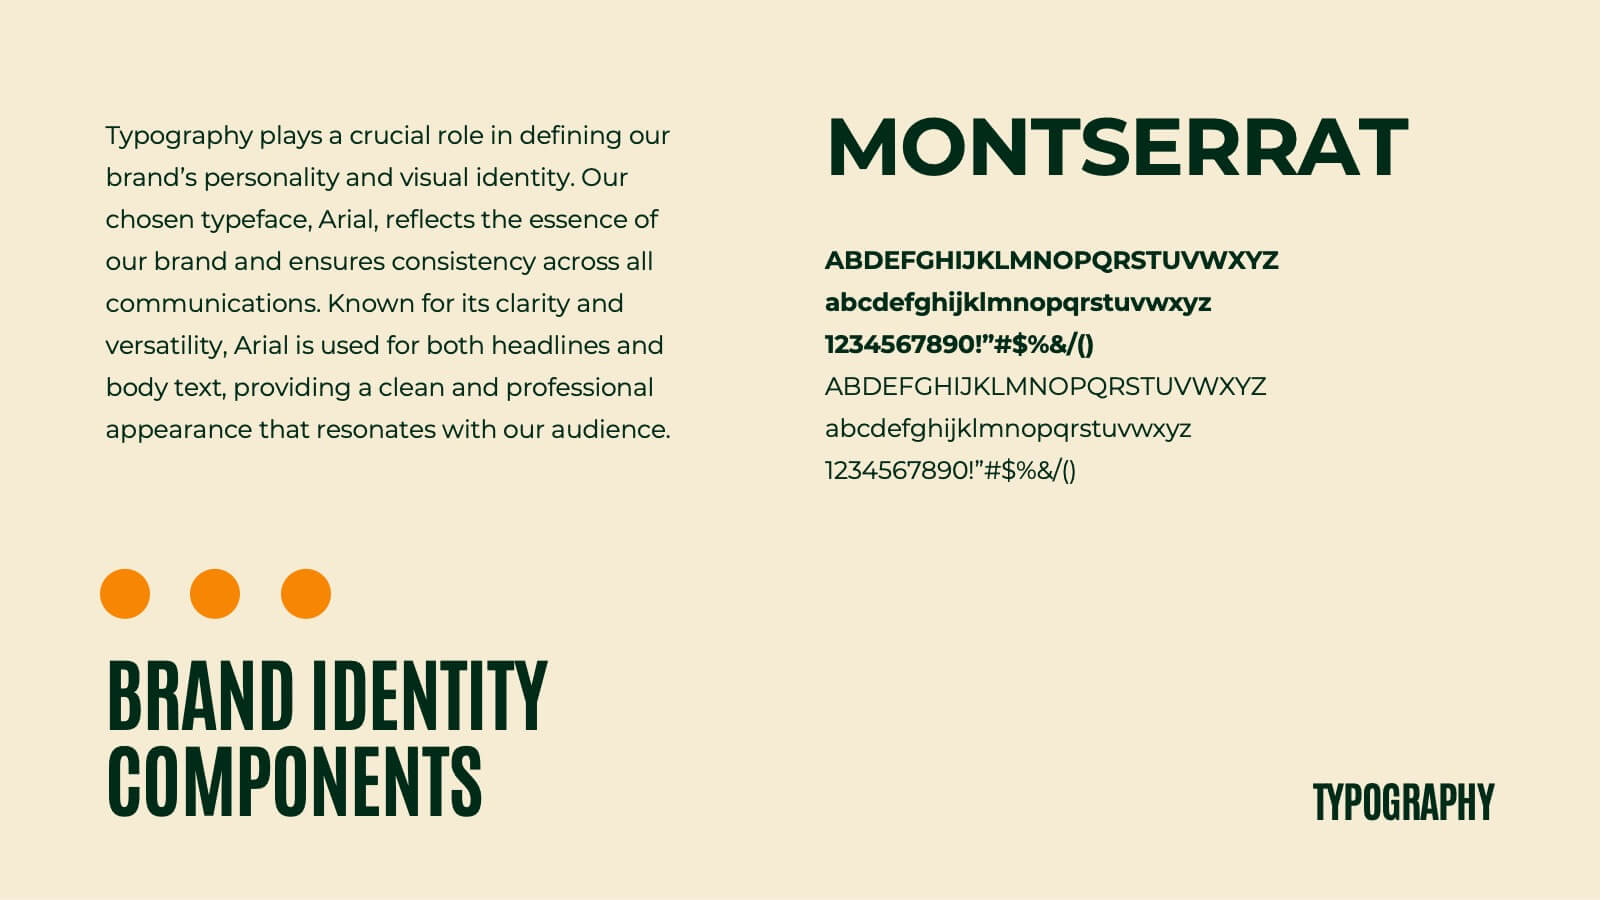
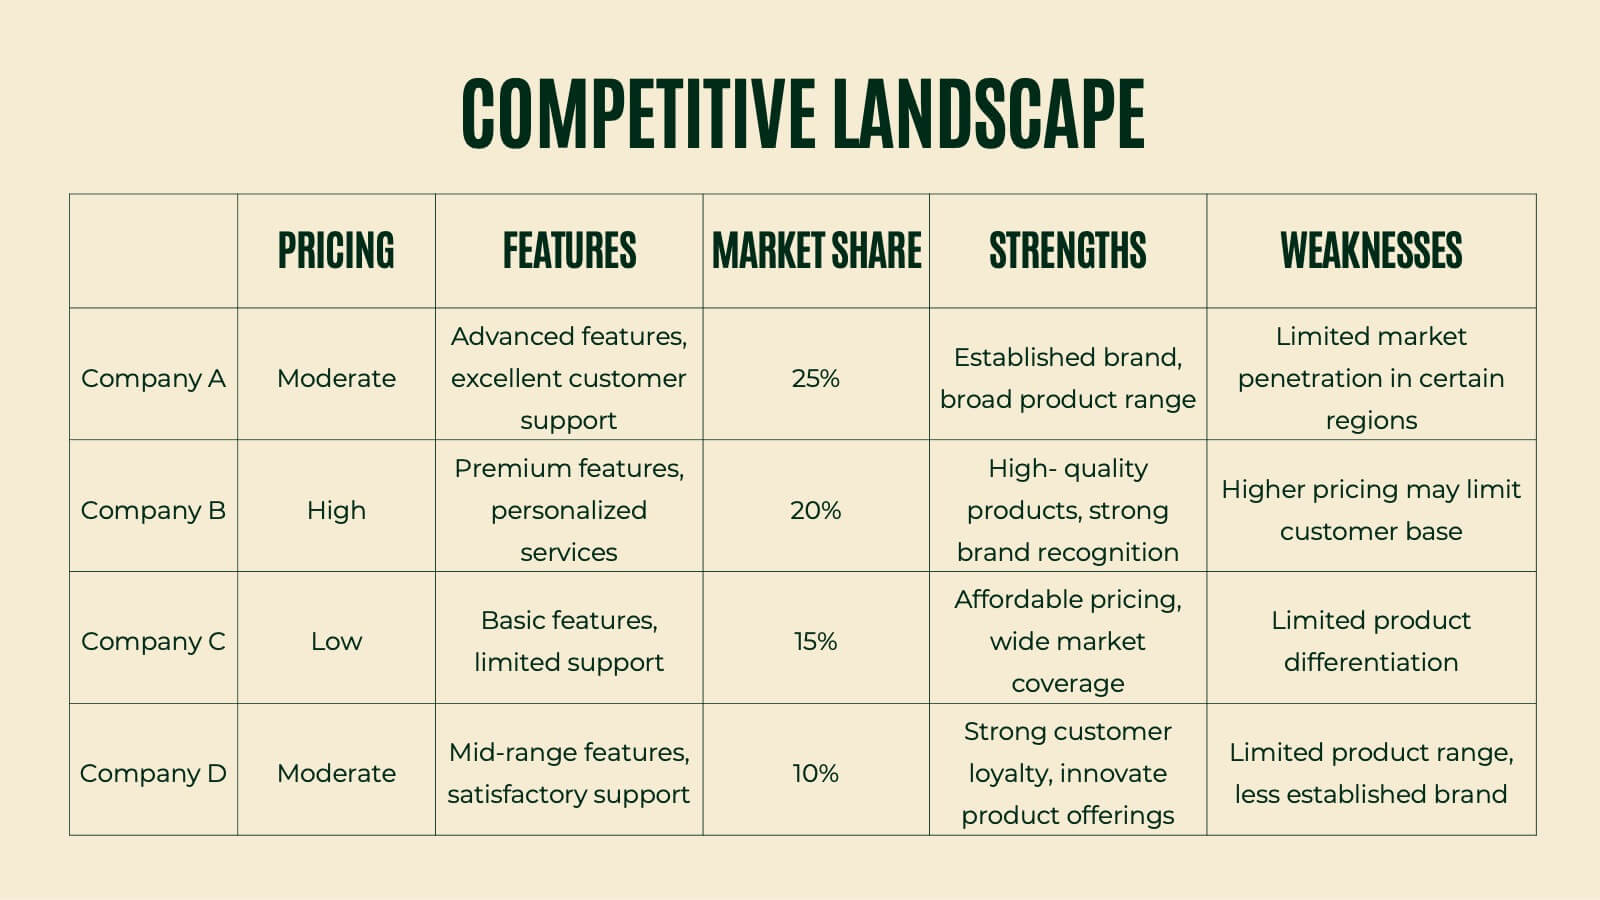
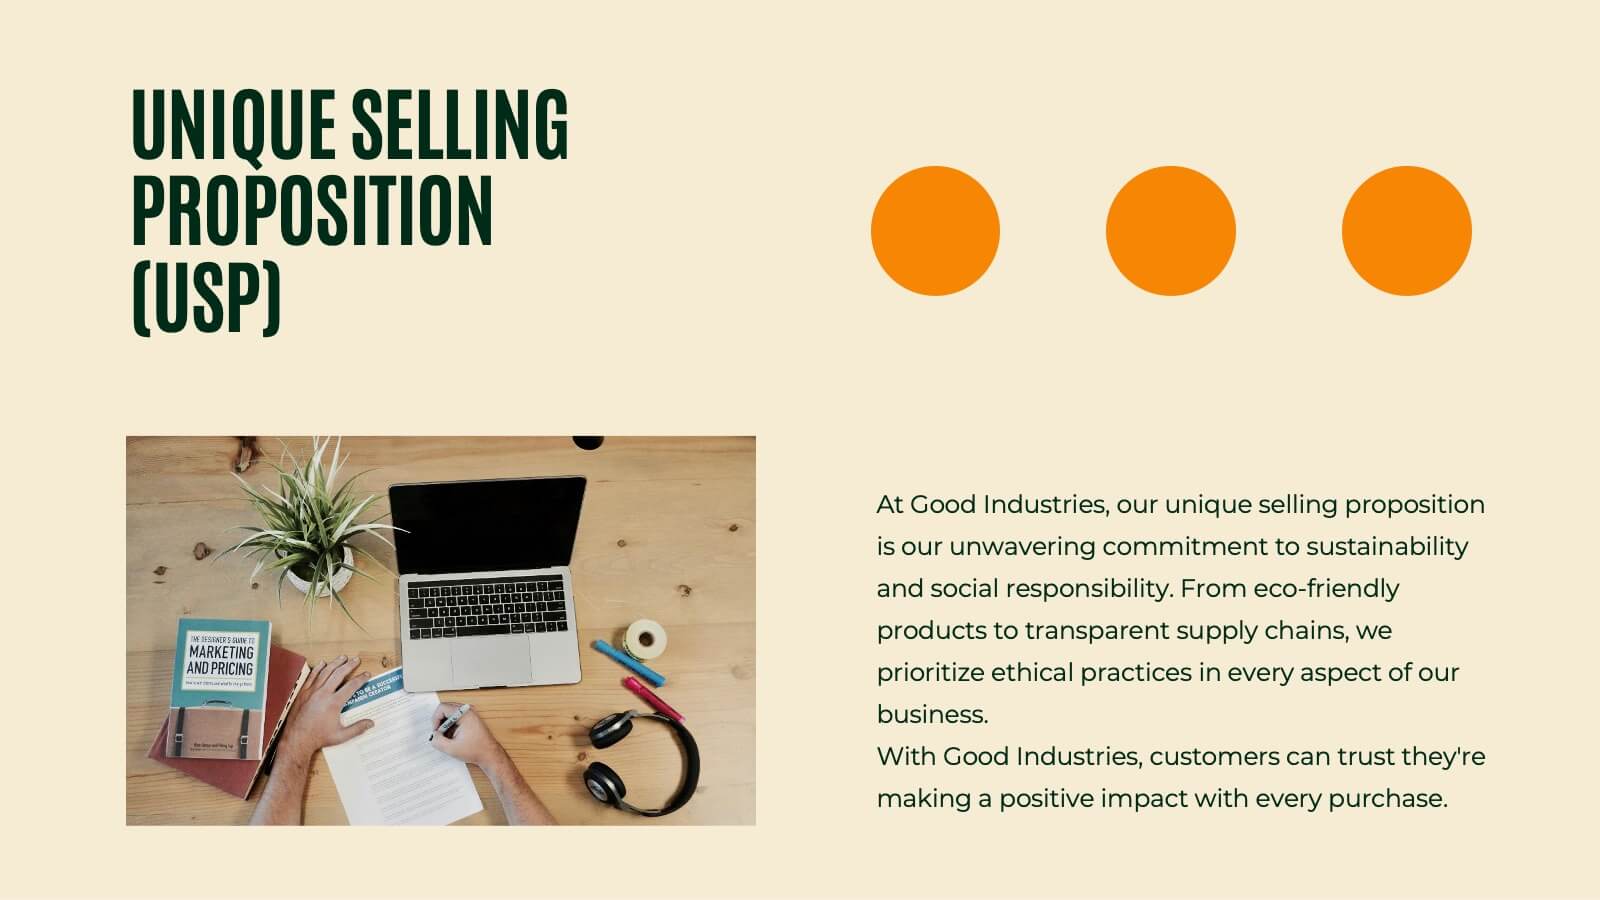
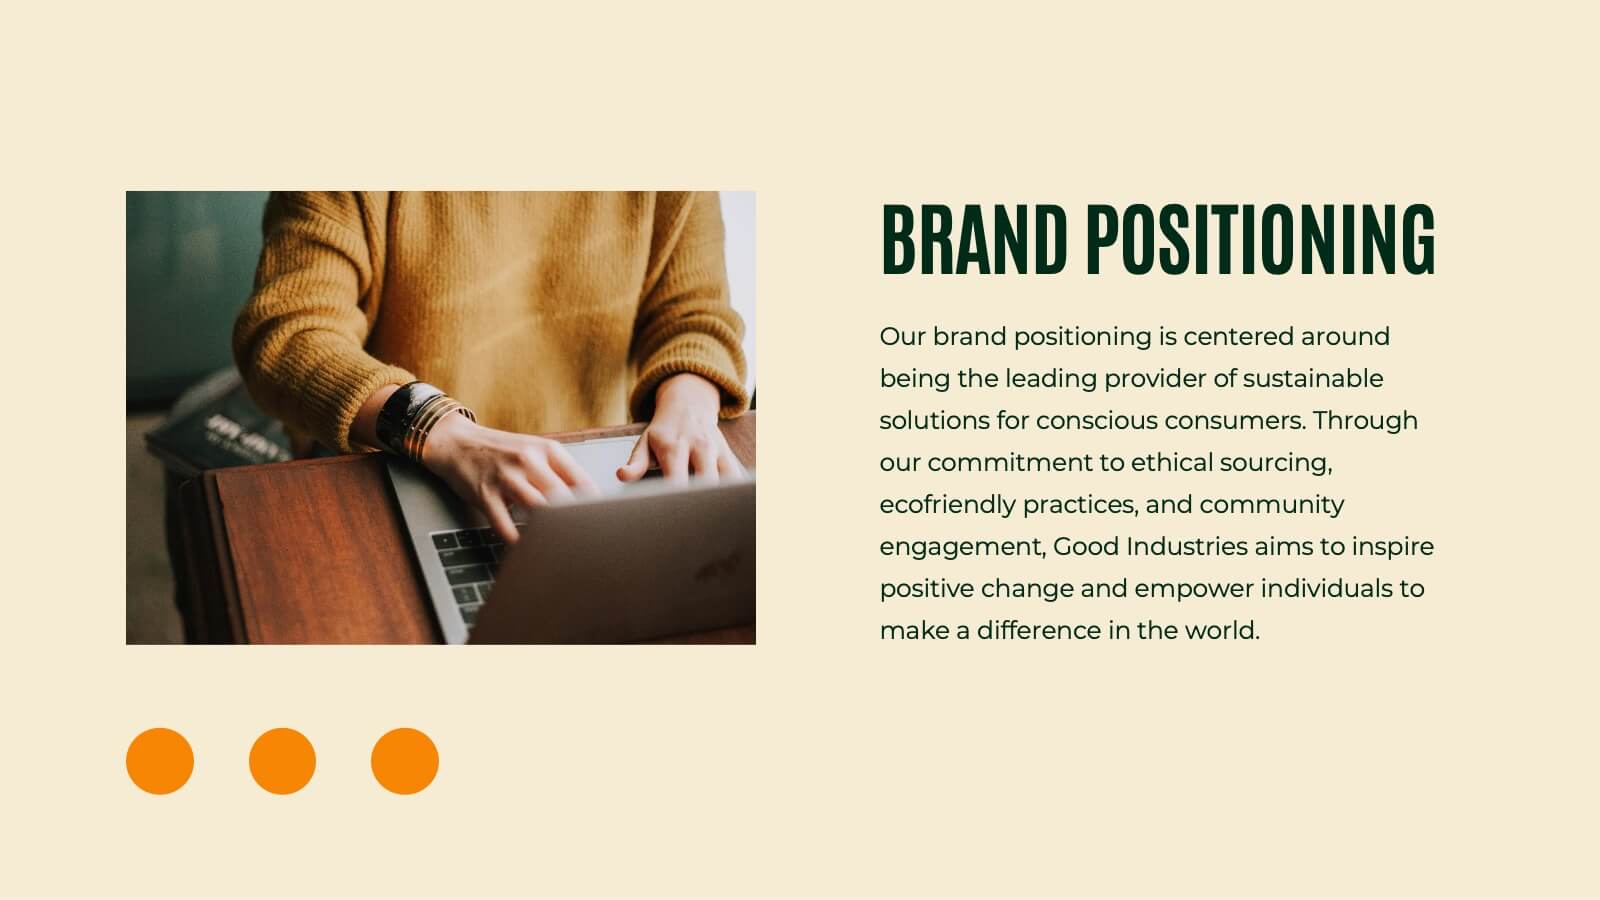
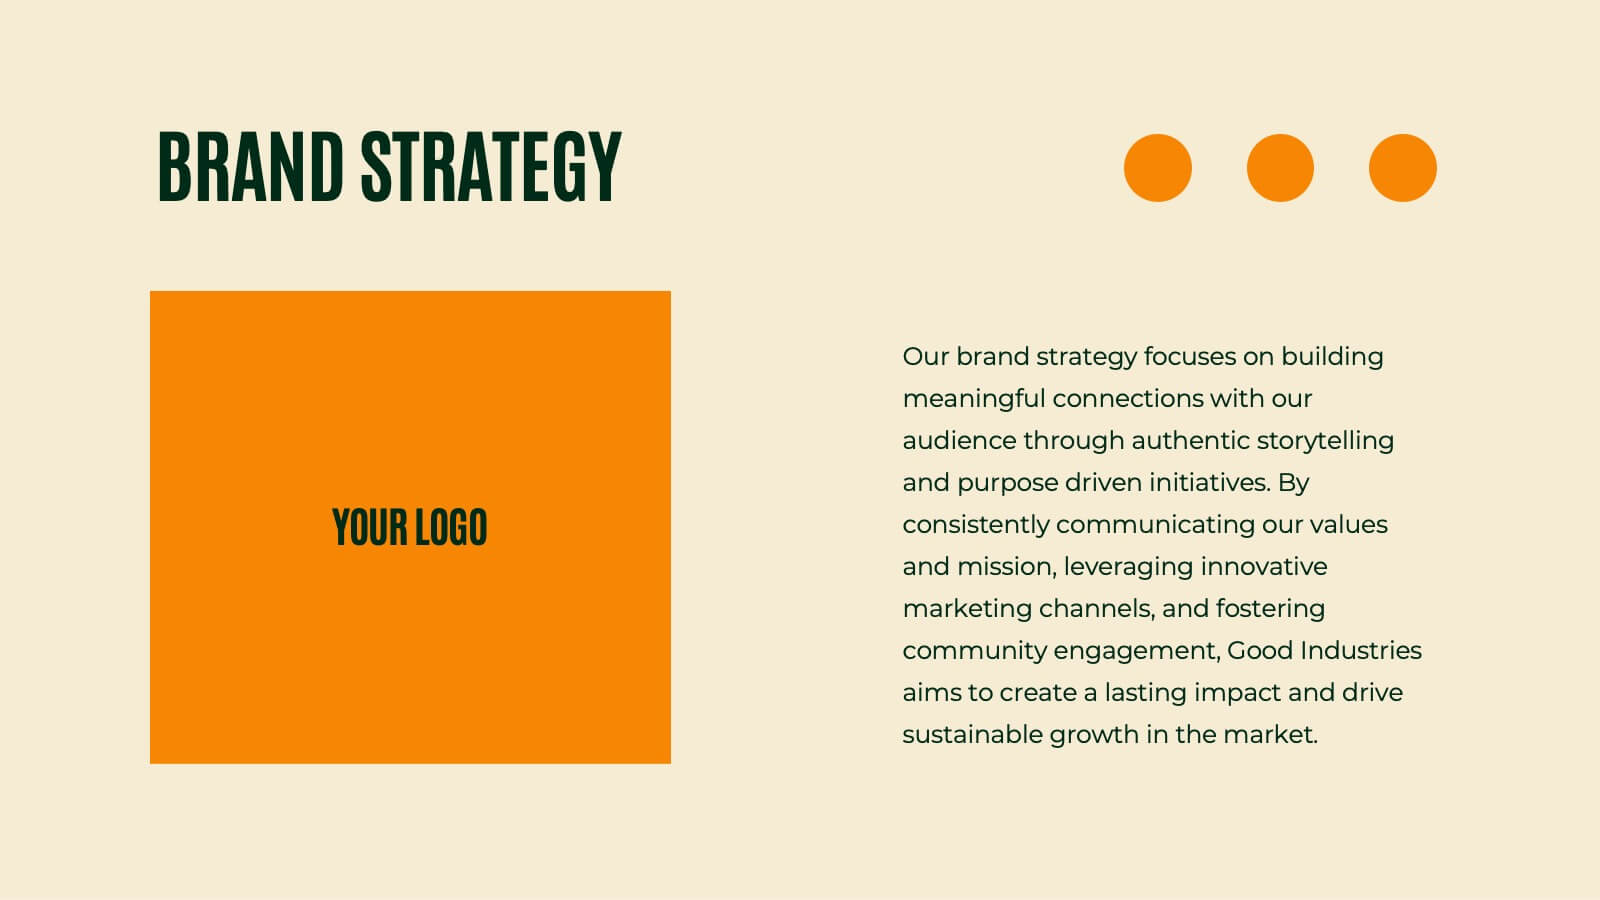
Griffin Rebranding Project Plan Presentation
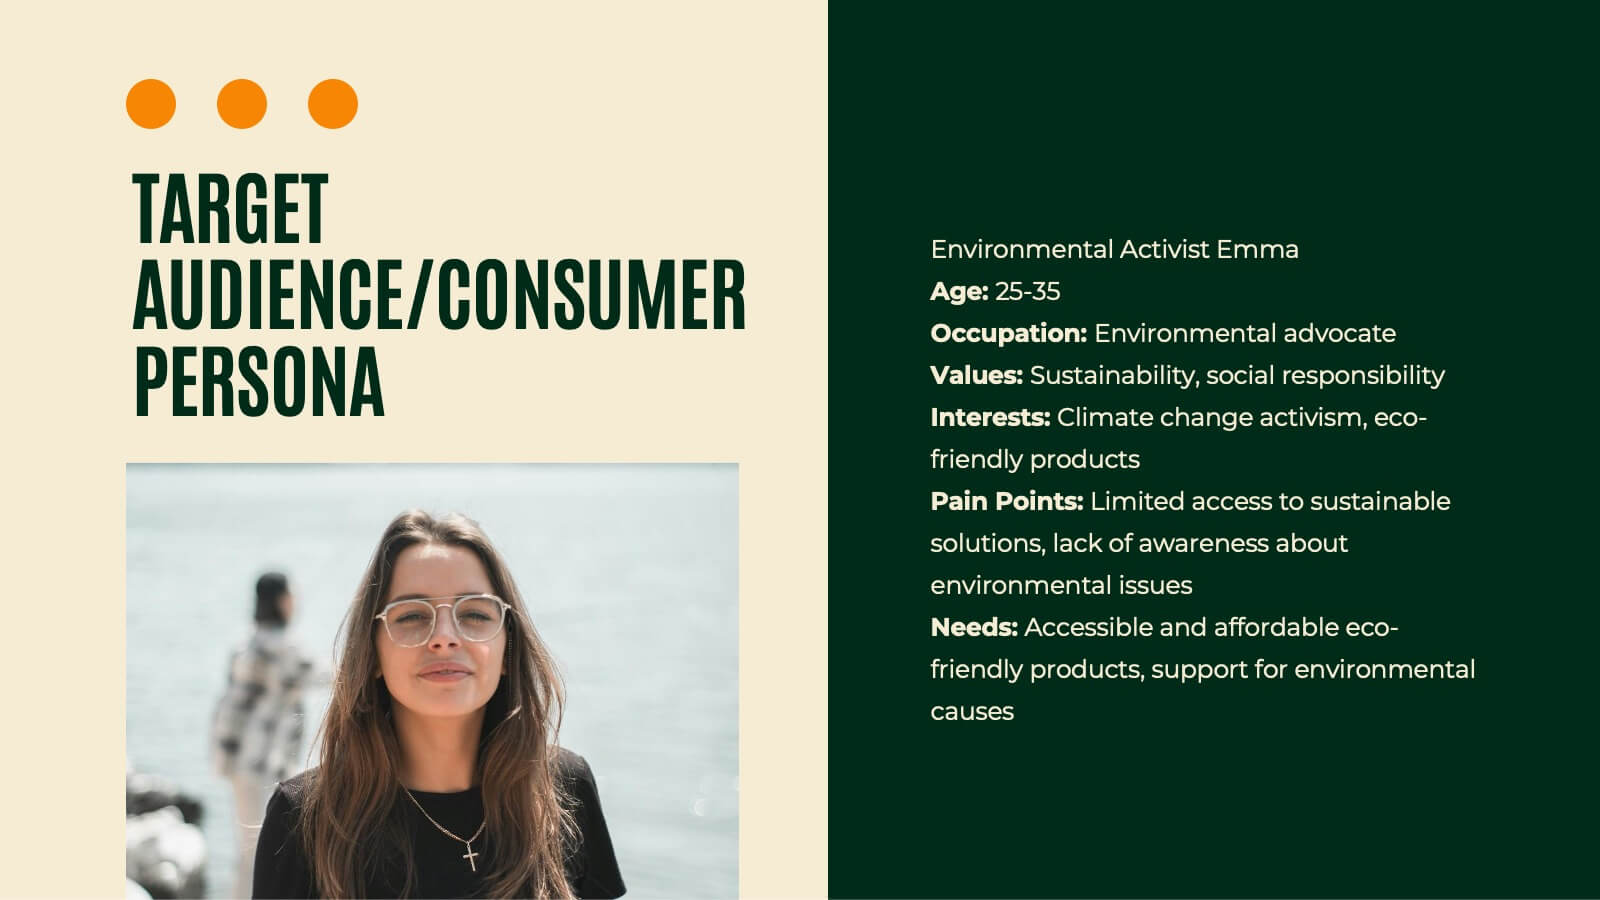
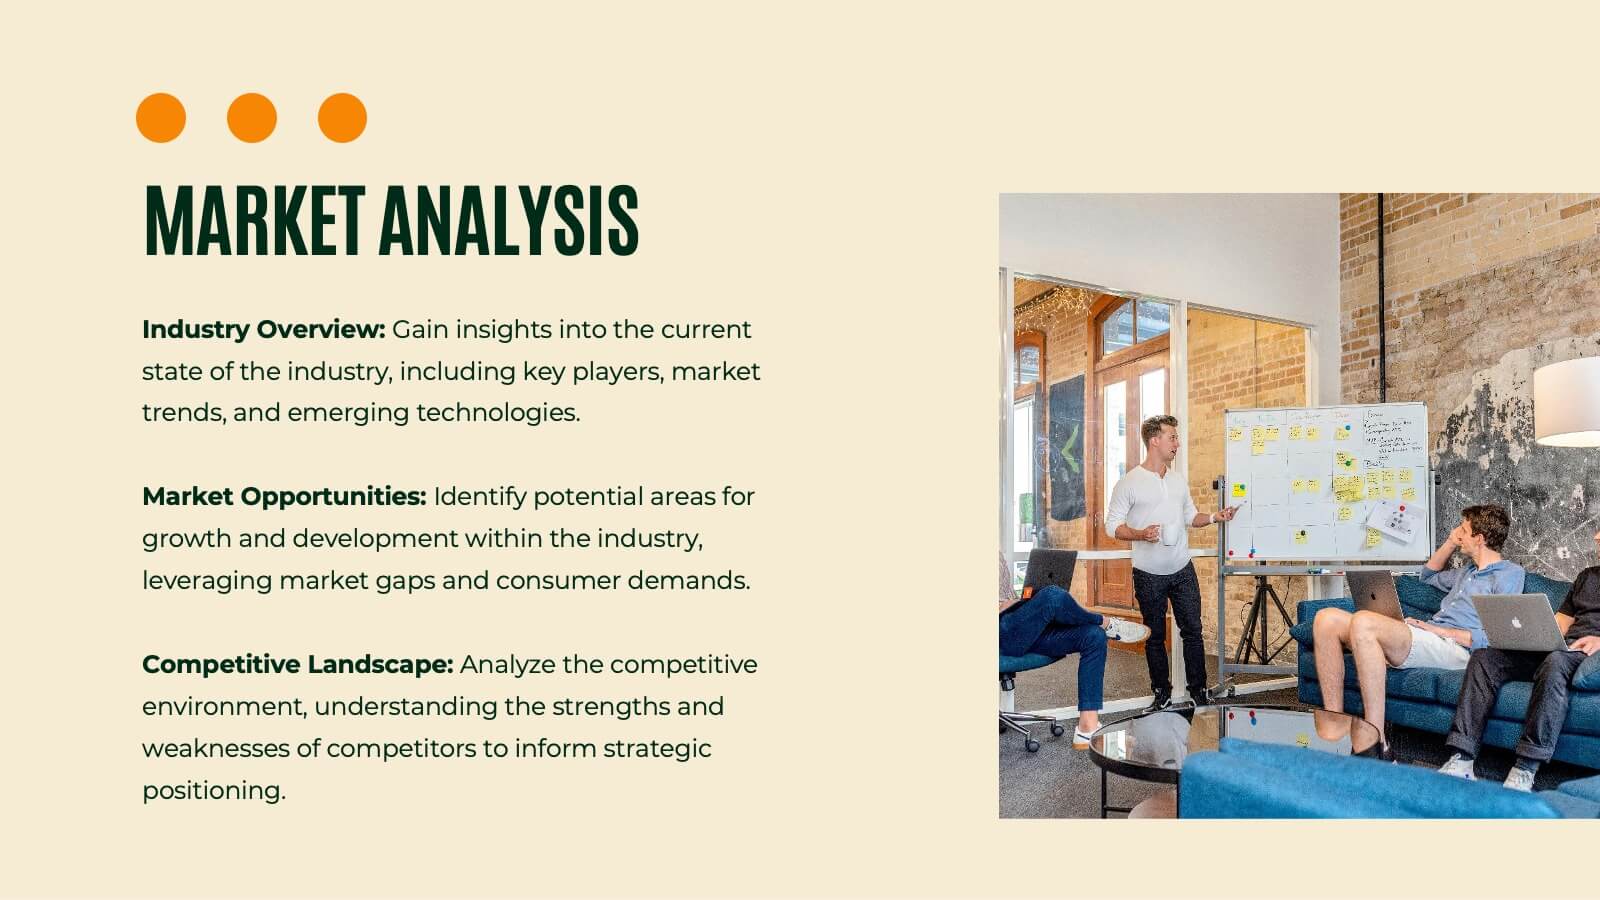
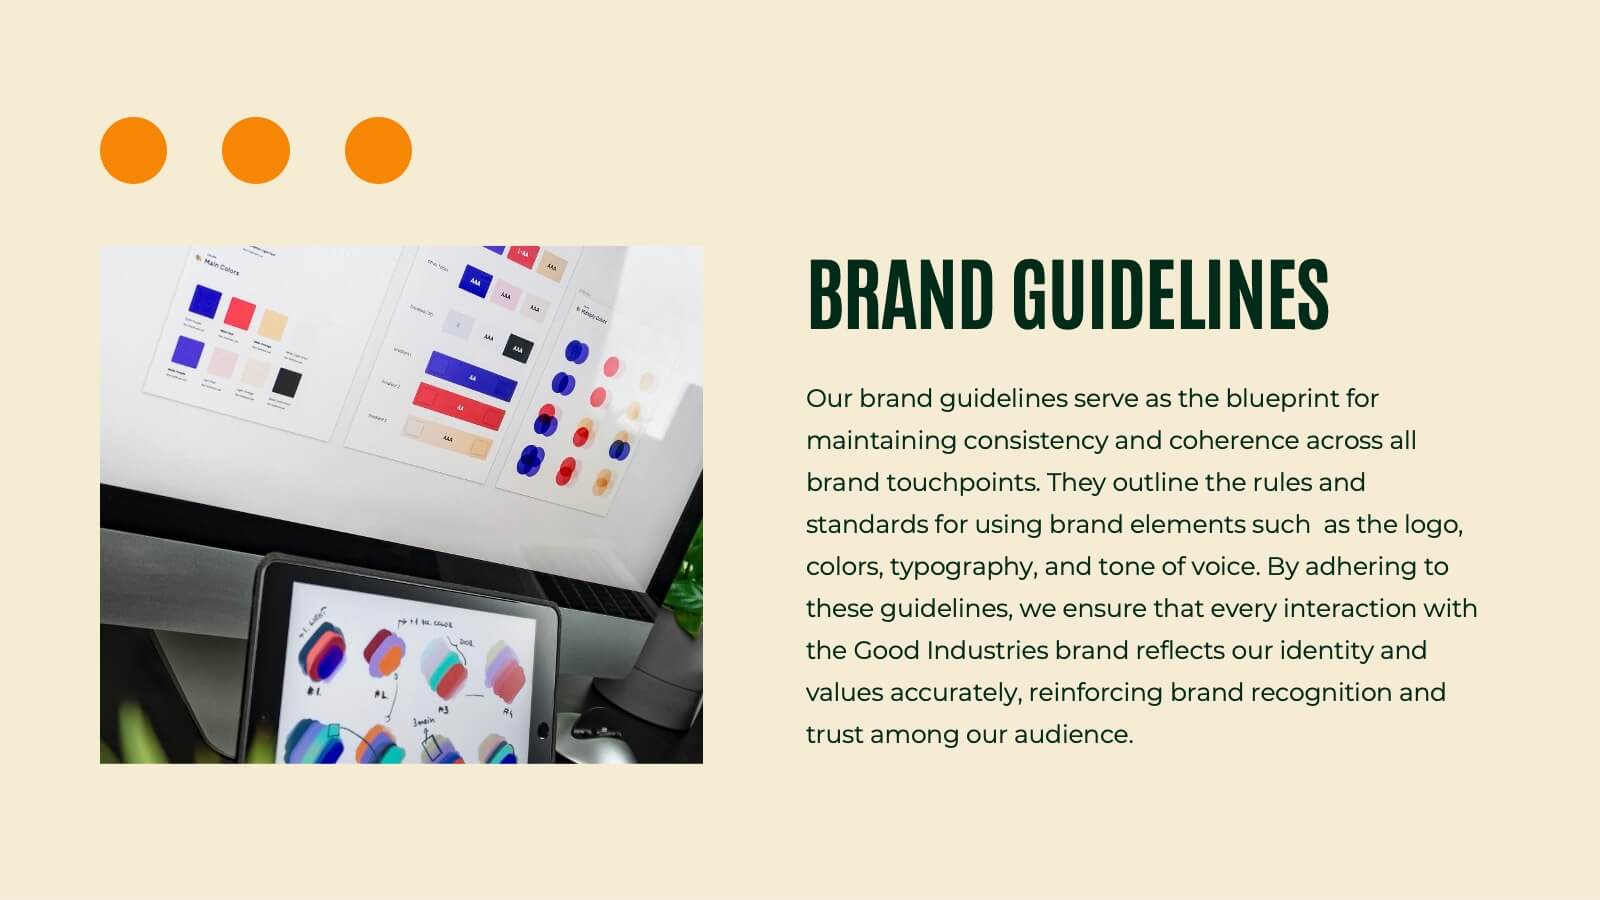
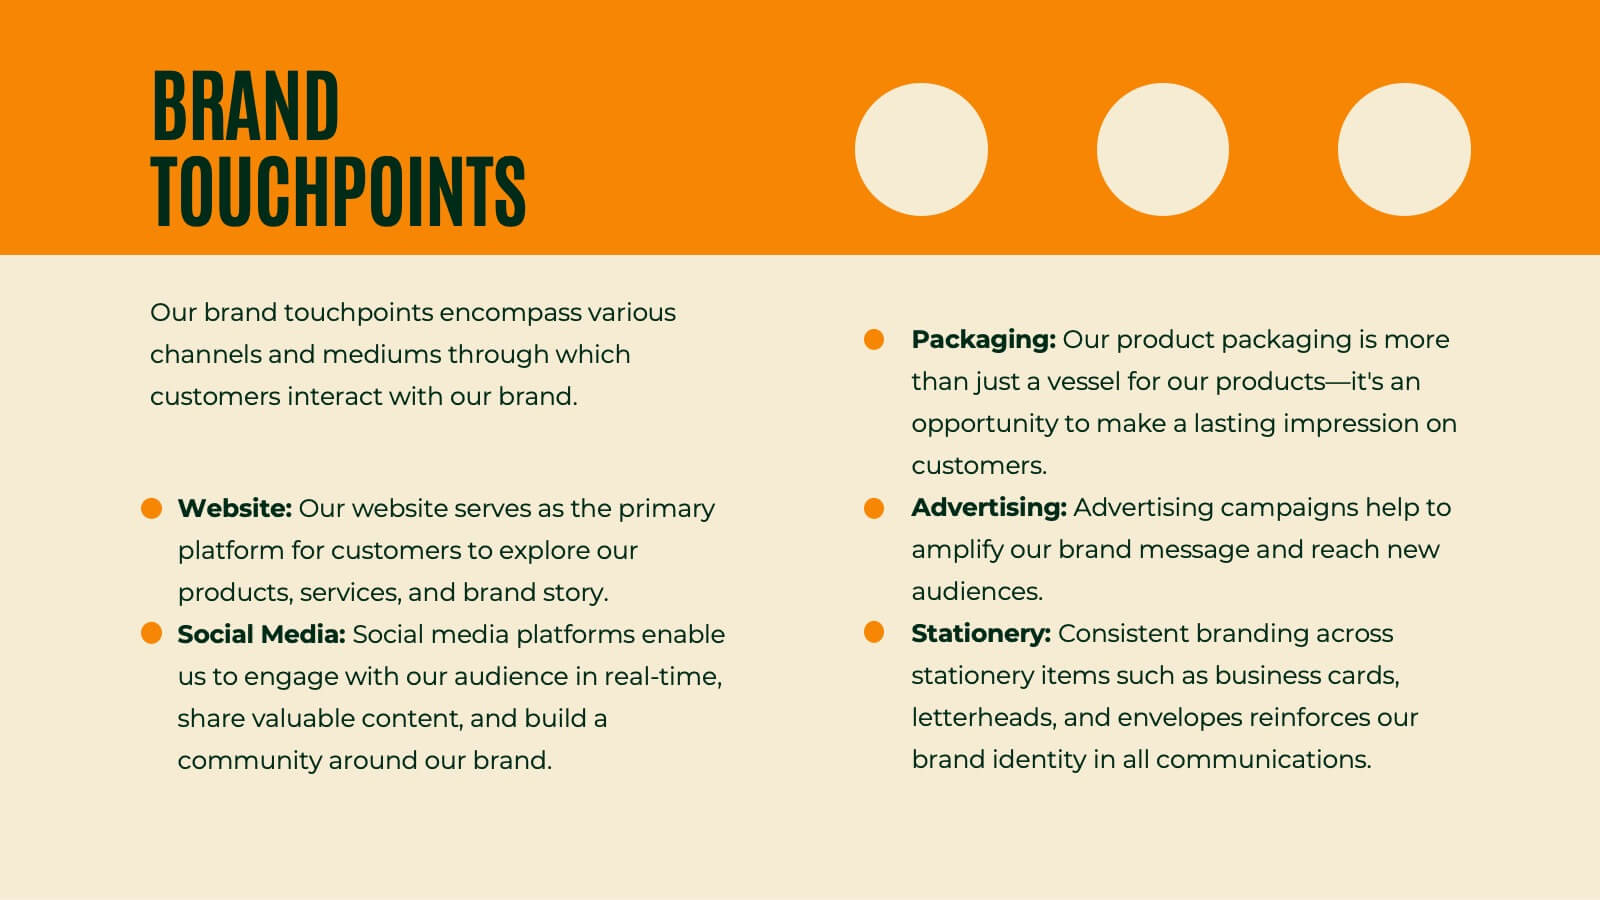
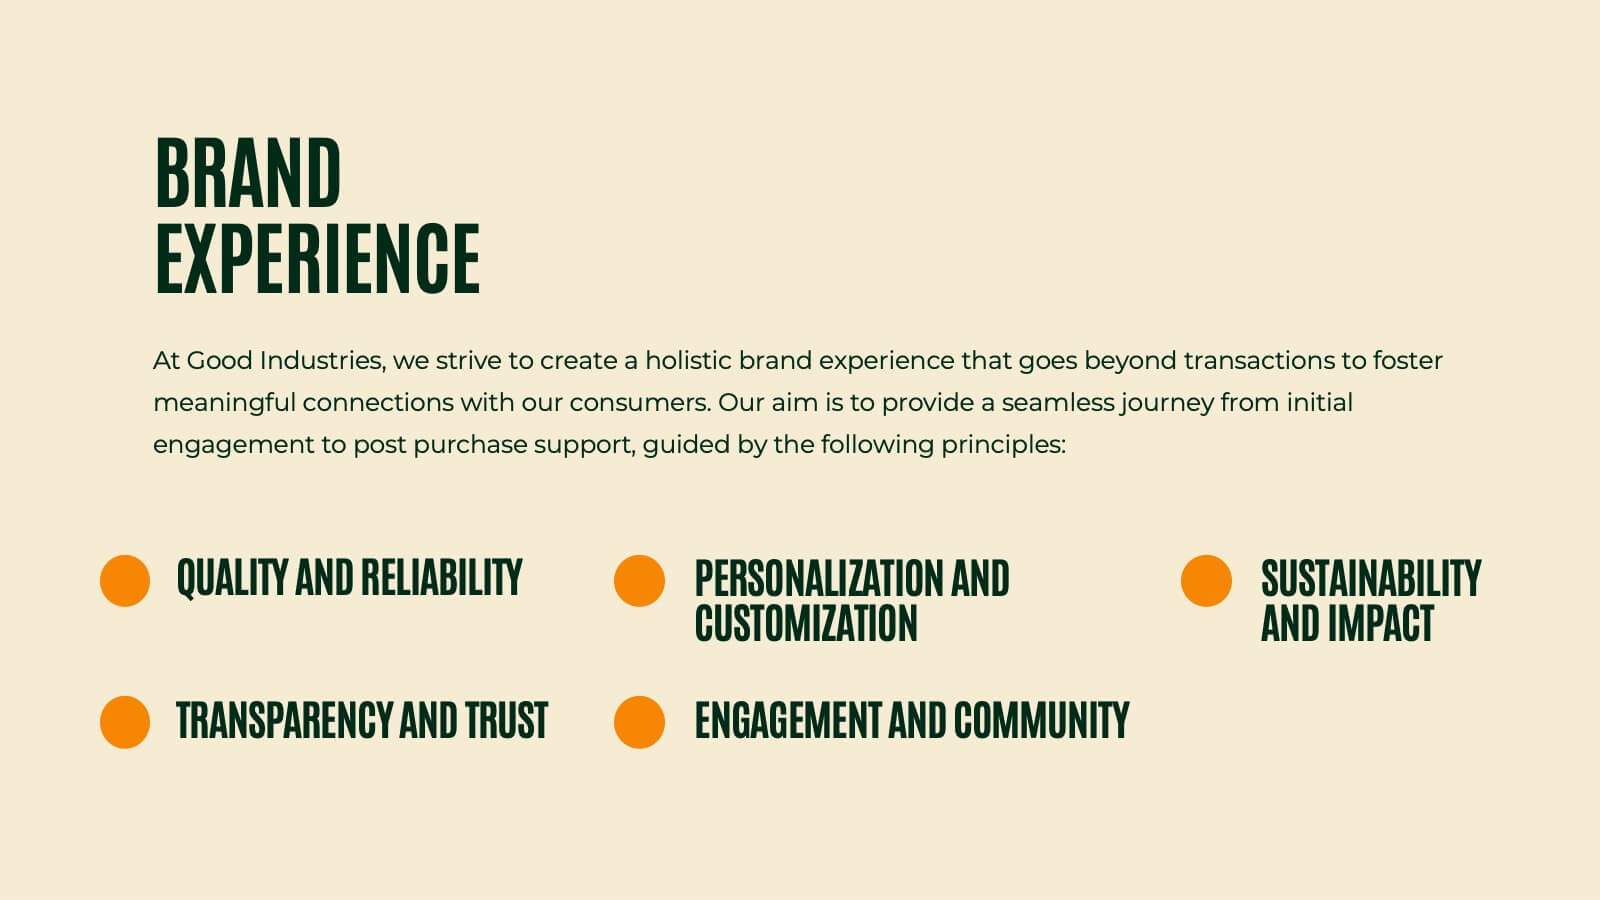
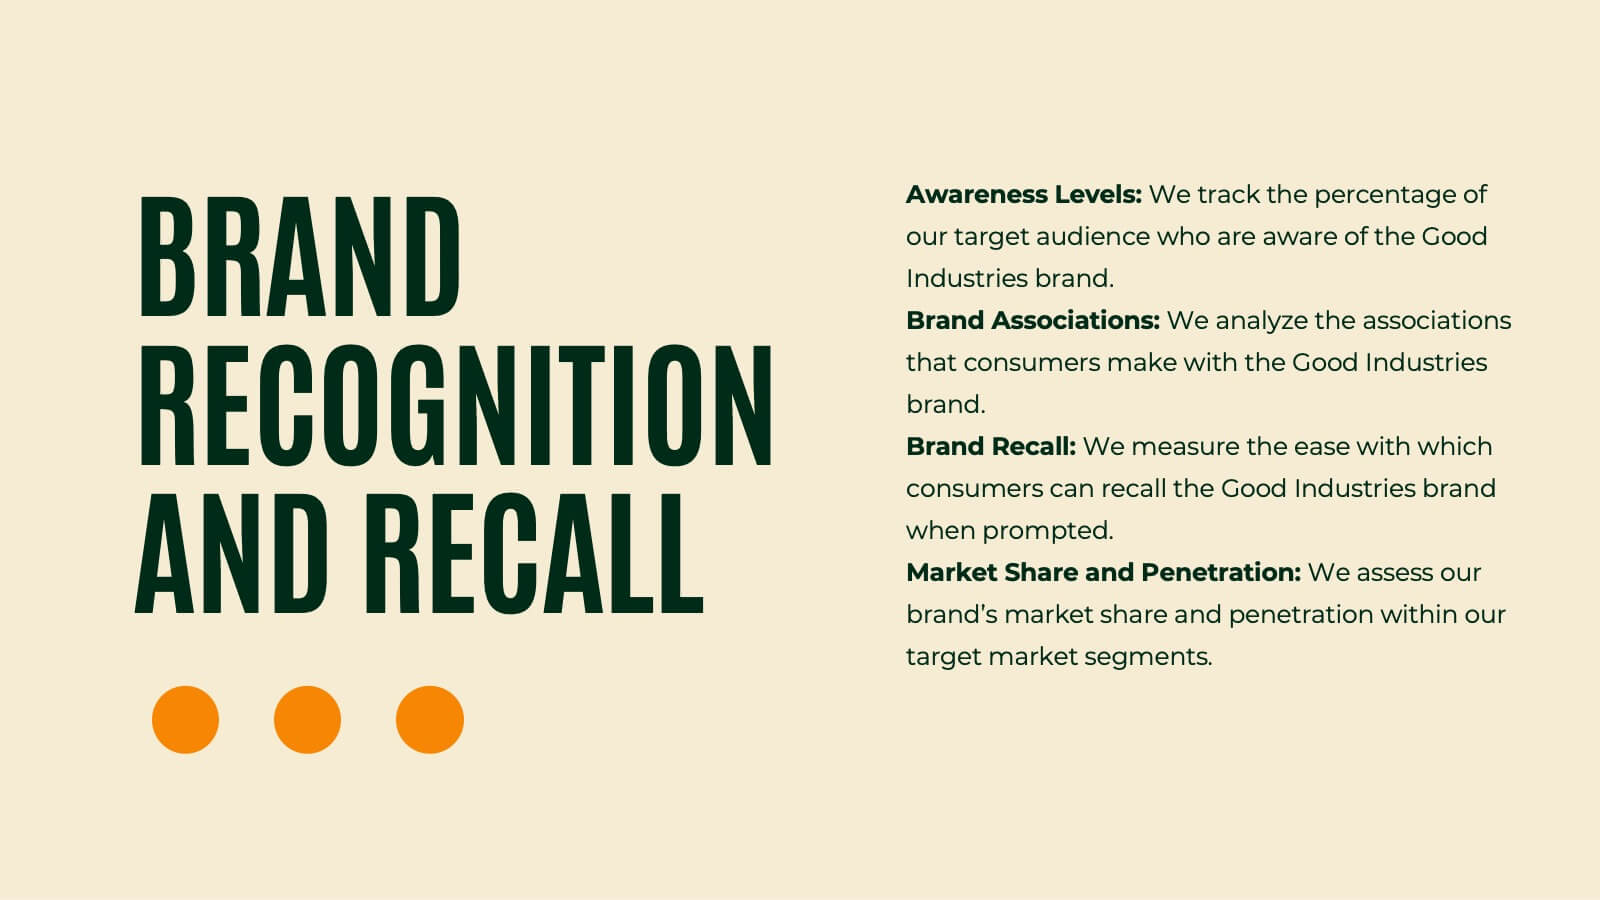
Unleash the power of branding with this vibrant presentation template! This tool guides you through essential brand elements like identity, voice, and strategy. Perfect for marketers and brand managers aiming to make a memorable impact. Compatible with PowerPoint, Keynote, and Google Slides, it's a must-have for any branding project.


22 slides
Simple Pitch Deck Presentation
Streamline your pitch process with this no-frills Pitch Deck template, designed for clear communication and powerful impact. From the get-go, the cover slide clearly announces your purpose, inviting audiences into your business narrative. The template smoothly transitions from one slide to the next, each one a stepping stone in building your case — from problem to solution. It includes a neatly organized table of contents, thought-provoking mission and vision statements, and data-rich slides for a deep dive into your business metrics. Each section, marked with bold, numbered headers, keeps your presentation on track and your audience engaged. A final 'Thank You' slide adds a touch of professionalism, and the credits section ensures that your sources are transparently acknowledged. This pitch deck is ideal for startups and businesses looking to capture attention and convey their story succinctly.


7 slides
Fishbone Diagram Infographic Presentation Template
A Fishbone diagram, also called a cause-and-effect diagram, is a tool used to identify and analyze the potential causes of a particular problem or issue. It is named for its shape, which looks like a fish skeleton with the problem or effect as the head and the various causes as the bones. This template includes a variety of different fishbone diagrams, which are representations of fish skeletons that help show you the different causes of a problem. This template is easy to use and you can add your own information to make it look just how you want, and show how different causes are connected.


6 slides
Pyramid of Needs Strategy Model
Visualize priorities with clarity using the Pyramid of Needs Strategy Model Presentation. This slide presents a five-tier pyramid design, ideal for illustrating hierarchy in strategies, goals, or user needs. Each level includes numbered labels and editable titles with supporting text, making it easy to tailor to your framework. Compatible with PowerPoint, Keynote, and Google Slides.


5 slides
Beer Drinking Infographics
The art of beer encompasses the brewing process, the craftsmanship of creating unique flavors and styles, and the enjoyment of this ancient beverage. These infographics are perfect for showcasing key facts, statistics, and interesting information related to the world of beer. This template is ideal for breweries, beer enthusiasts, bartenders, or anyone interested in sharing knowledge about different beer types, brewing processes, or beer culture. The template offers a variety of slide layouts to cover different aspects of beer drinking. The template provides sections for discussing different beer styles, brewing processes, and beer tasting.


7 slides
RACI Matrix Process Infographic Presentation
A RACI matrix is a project management tool that is used to clarify and define roles and responsibilities for project tasks and deliverables. Use this template to help you quickly create RACI charts for your next project. Made up of strategic box with shapes, colors, numeric value and text boxes that can be edited easily. This Template is a multipurpose slide as it can be used to present data visually, build a discussion on the topic and influence your audience to take action. Save time and energy with this infographic template, compatible with Powerpoint, Keynote and Google Slides.


4 slides
Corporate Strategy Business Case Presentation
Develop a winning corporate strategy with this structured business case template! Perfect for analyzing finances, operations, market trends, and client insights, this clean and organized layout helps businesses communicate key strategies effectively. Fully customizable and compatible with PowerPoint, Keynote, and Google Slides for seamless, professional presentations.