Pyramid-Triangle Visual Logic Presentation
PowerPoint Template and Google Slides Theme


Features
- 6 Unique slides
- Fully editable and easy to edit in Microsoft Powerpoint, Keynote and Google Slides
- 16:9 widescreen layout
- Clean and professional designs
- Export to JPG, PDF or send by email
- Remove from favorites
Powerpoint Template
1 MB
Google Slides Template
External link
Keynote Template
1 MB
Recommend
- Remove from favorites
Powerpoint Template
1 MB
Google Slides Template
External link
Keynote Template
1 MB
7 slides
Decision Points Infographic
Decision points are specific moments or junctures within a process, project, or any situation where a decision needs to be made. This infographic template is designed to illuminate the path of choices, empowering you to make informed decisions and steer towards success. Compatible with Powerpoint, Keynote, and Google Slides. This infographic symbolizes the diverse options one encounters in their journey, and the importance of choosing wisely. The graphs and charts depicting the dilemmas encountered, emphasize the analytical process of weighing pros and cons to arrive at the best decision.
- Remove from favorites
Powerpoint Template
1 MB
Google Slides Template
External link
Keynote Template
1 MB
7 slides
Project Proposal Structure Infographic
Optimize your project planning and presentation with this professional set of project proposal structure templates. Each slide is designed to systematically display project details, from the introduction and objectives to the detailed work plan and budget. These templates are essential tools for project managers, strategists, and business analysts aiming to convey comprehensive project proposals. Structured to support clear communication, the templates feature a logical flow that guides viewers through each critical component of the proposal. The use of a consistent blue color palette and clean typography helps maintain focus on the content, while graphical elements like charts and timelines visually break down complex information, making it easily digestible for stakeholders. Fully customizable, these templates allow for easy adaptations to specific project needs, enabling precise tailoring of text, color, and design elements. Whether for internal project approval or external client pitches, these slides will help you present a clear, structured, and persuasive project proposal.
- Remove from favorites
Powerpoint Template
External link
Google Slides Template
External link
Keynote Template
External link
26 slides
Cryptocurrency Technology Presentation
The foundation of cryptocurrency technology is the blockchain, cryptocurrency has the potential to transform the way we think about money and financial transactions, and it continues to evolve. With this template present the latest information on cryptocurrency and the emerging blockchain technologies. This features a variety of high-quality slides in many formats. Whether you want them to be edited on Keynote, PowerPoint, or google sheets this template has everything you need to make the most out of your presentation. Get creative and add your own style with this presentation template!
- Remove from favorites
Powerpoint Template
External link
Google Slides Template
External link
Keynote Template
External link
7 slides
Secondary Education Infographic
Secondary education, also known as high school education, plays a crucial role in a person's academic and personal development. This template is a useful tool for demonstrating the power of secondary education, as well as educational marketing strategies that offer students a range of tools to help them achieve success. This is ideal for infographics about career goals, student professional development, digital learning and more. Compatible with Powerpoint, keynote and google slides, you can create a powerful and engaging learning experience by presenting your data in a visually appealing way.
- Remove from favorites
Powerpoint Template
1 MB
Google Slides Template
External link
Keynote Template
1 MB
5 slides
Pandemic Spreading & Symptoms Infographics
Pandemic spreading refers to the rapid and widespread transmission of a contagious disease, affecting a large number of people across multiple regions or countries. These infographic templates are comprehensive visual tools designed to educate and inform viewers about the spreading patterns and symptoms of pandemics. These aims to raise awareness and promote understanding of how pandemics spread, their impact on public health, and the common symptoms associated with infectious diseases. Compatible with Powerpoint, Keynote, and Google Slides. These enable viewers to better understand the dynamics of pandemics and take measures to protect themselves and their communities.
- Remove from favorites
Powerpoint Template
1 MB
Google Slides Template
External link
Keynote Template
2 MB
6 slides
Business Process Flowchart Presentation
Streamline your workflow with the Business Process Flowchart presentation. This structured and visually engaging template helps you map out processes, optimize efficiency, and improve communication within your team. Designed for business analysts, managers, and strategists, this fully editable slide ensures clarity in decision-making and operations. Compatible with PowerPoint, Keynote, and Google Slides.
- Remove from favorites
Powerpoint Template
13 MB
Google Slides Template
External link
Keynote Template
4 MB
21 slides
Chimera Marketing Campaign Presentation
Create a visually engaging digital marketing presentation with this modern template! Covering essential topics like company history, market presence, target audience, and competitive landscape, this template helps you showcase your marketing strategies effectively. Fully customizable, it works seamlessly with PowerPoint, Keynote, and Google Slides for professional presentations every time.
- Remove from favorites
Powerpoint Template
1 MB
Google Slides Template
External link
Keynote Template
1 MB
4 slides
Value Creation Strategy Presentation
Develop impactful strategies with this Value Creation Strategy template. Designed to visualize key business components, it presents a structured approach to innovation, growth, and market positioning. Ideal for corporate planning and investor presentations, this template is fully compatible with PowerPoint, Keynote, and Google Slides for effortless customization.
- Remove from favorites
Powerpoint Template
1 MB
Google Slides Template
External link
Keynote Template
1 MB
6 slides
Responsibility Assignment Matrix Level Infographic
A Responsibility Assignment Matrix (RAM), is a useful tool in project management to define and clarify roles and responsibilities for various tasks and activities. This infographic template is a tool used in project management and organizational structure to define and communicate the roles and responsibilities of team members in tasks. This template will ensure that everyone involved in the project or process understands their roles and tasks, reducing confusion and improving accountability. This infographic will summarize the key points of your Responsibility Assignment Matrix. Compatible with Powerpoint, Keynote, and Google Slides.
- Remove from favorites
Powerpoint Template
External link
Google Slides Template
External link
Keynote Template
External link
7 slides
Fishbone Analysis Infographic Presentation
A fishbone Infographic is a technique used to brainstorm the cause of a problem. The unique design helps you understand how one thing can lead to another and is effective at helping you create a solution that reviews all aspects. Start this template off using the head of the fish as a prompt and webbing out from there, draw up to six main causal categories and then sub-categories. Use this infographic to organize your ideas and identify key factors, as well as decide how to prioritize them. This template is compatible and completely editable with Powerpoint, keynote and google slides.
- Remove from favorites
Powerpoint Template
1 MB
Google Slides Template
External link
Keynote Template
1 MB
6 slides
Annual Report Company Infographic
An annual report is a comprehensive document that provides an overview of a company's performance and financial activities over the course of a year. This Infographic template is a great way to present key highlights, accomplishments, and data from a year in a visually engaging and concise format. Designing an Annual Report Infographic can effectively convey the year's achievements and progress to stakeholders, investors, clients, and employees in a visually compelling and concise manner. This is designed to gather feedback from colleagues, team members, or stakeholders and make any necessary revisions to enhance the clarity and impact of the infographic.
- Remove from favorites
Powerpoint Template
1 MB
Google Slides Template
External link
Keynote Template
External link
5 slides
Online Digital Marketing Infographics
Online Digital Marketing refers to the promotion of products, services, or brands using digital channels and technologies. These infographic templates aims to educate and inspire the audience about the world of digital marketing and equip them with valuable insights and strategies to enhance their online presence. This is a valuable tool for presenting the intricacies of digital marketing in a clear and engaging manner. The templates provide slides that focus on analytics and measurement, emphasizing the importance of tracking and evaluating digital marketing efforts. You can customize the templates with your own branding to create a professional look.
- Remove from favorites
Powerpoint Template
1 MB
Google Slides Template
External link
Keynote Template
2 MB
5 slides
Work From Home Setup and Time Management Presentation
Master productivity from your living room with this Work From Home Setup and Time Management presentation. Featuring a modern, illustrated layout with five clear steps, this slide helps communicate best practices for workspace organization, focus habits, and time-blocking techniques. Ideal for remote onboarding, virtual team training, or self-discipline coaching sessions. Fully customizable in PowerPoint, Keynote, and Google Slides.
- Remove from favorites
Powerpoint Template
1 MB
Google Slides Template
External link
Keynote Template
1 MB
6 slides
Project Scope and Expansion Scale Presentation
Display growth areas and operational coverage with this segmented radial chart. Ideal for showcasing project reach, departmental impact, or phase distributions, each section includes editable icons and labels. Perfect for strategy updates, expansion pitches, or status reporting. Fully customizable in PowerPoint, Keynote, and Google Slides for professional presentations.
- Remove from favorites
Powerpoint Template
1 MB
Google Slides Template
External link
Keynote Template
1 MB
4 slides
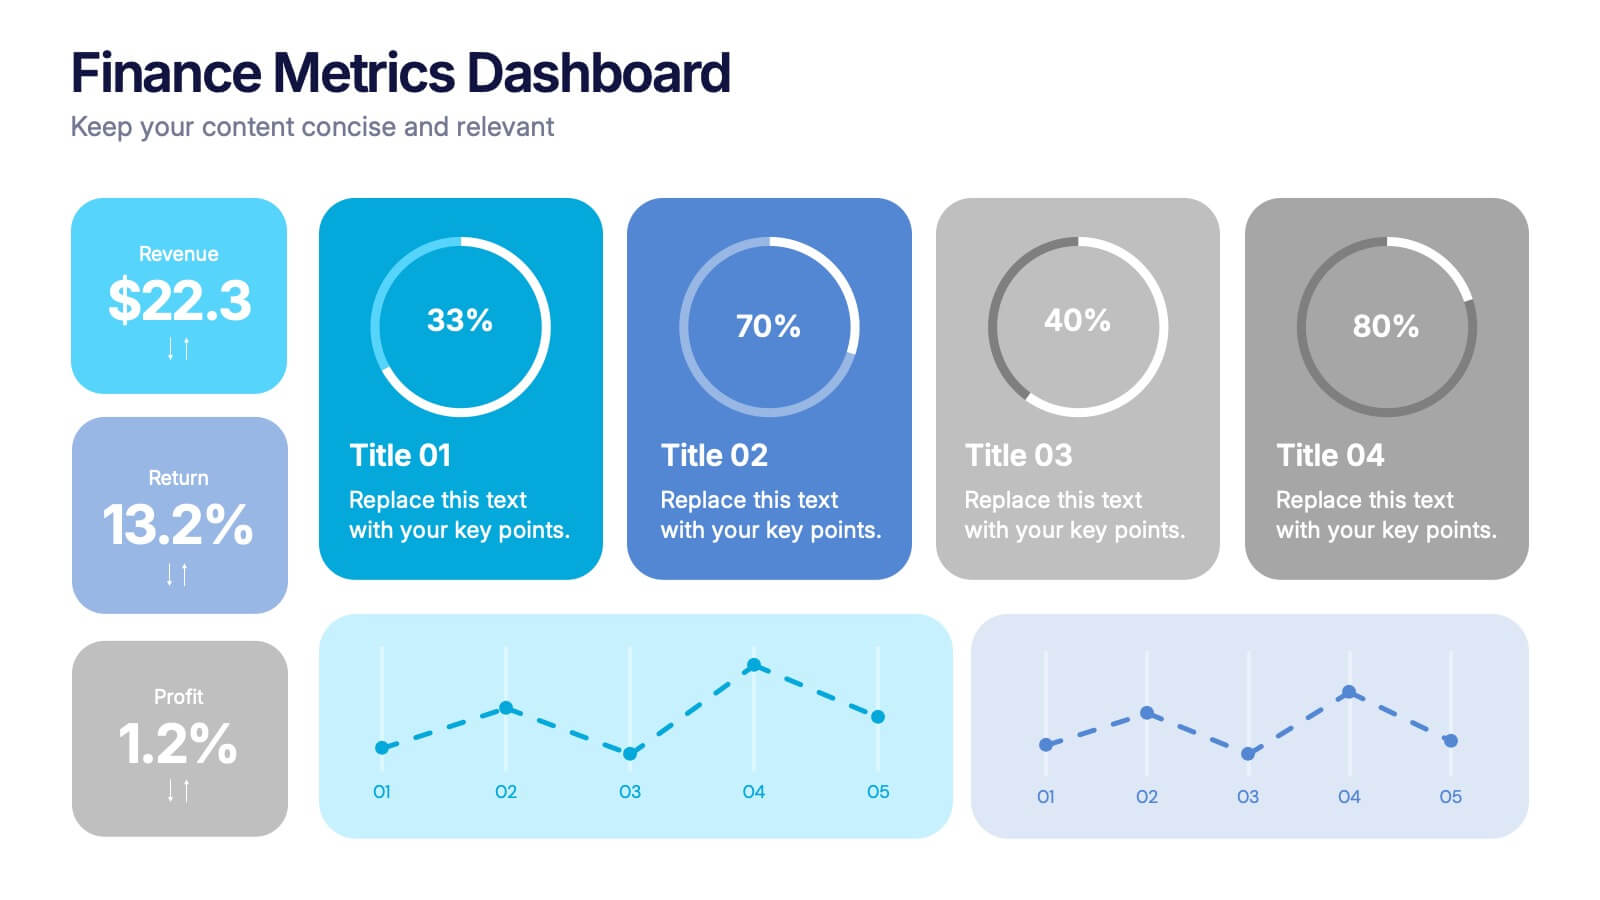
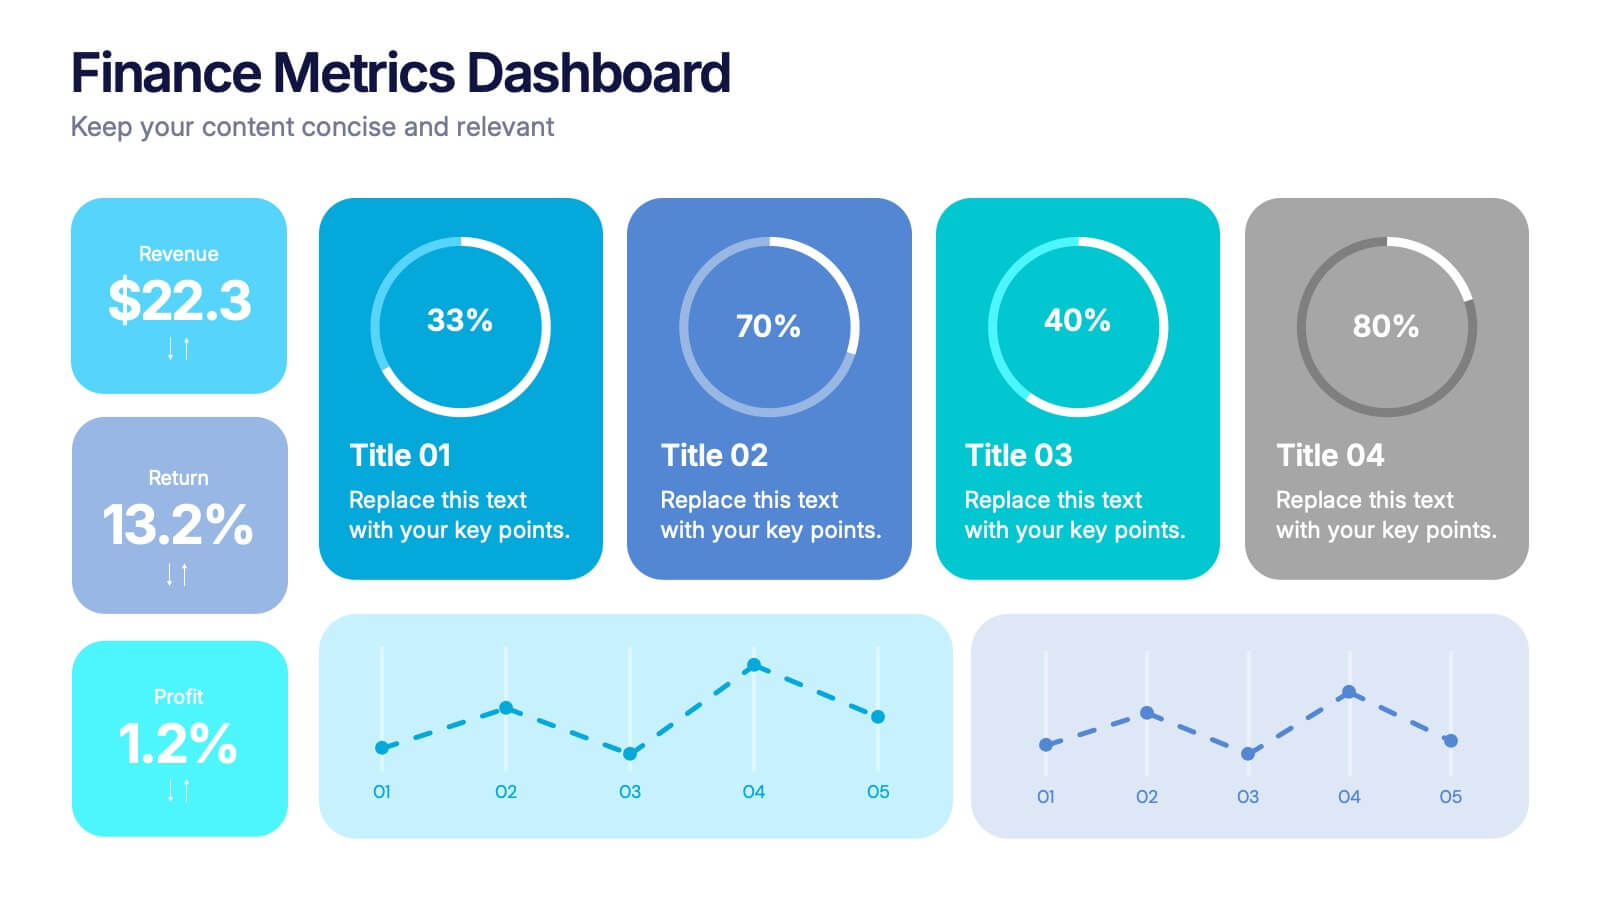
Finance Metrics Dashboard Presentation
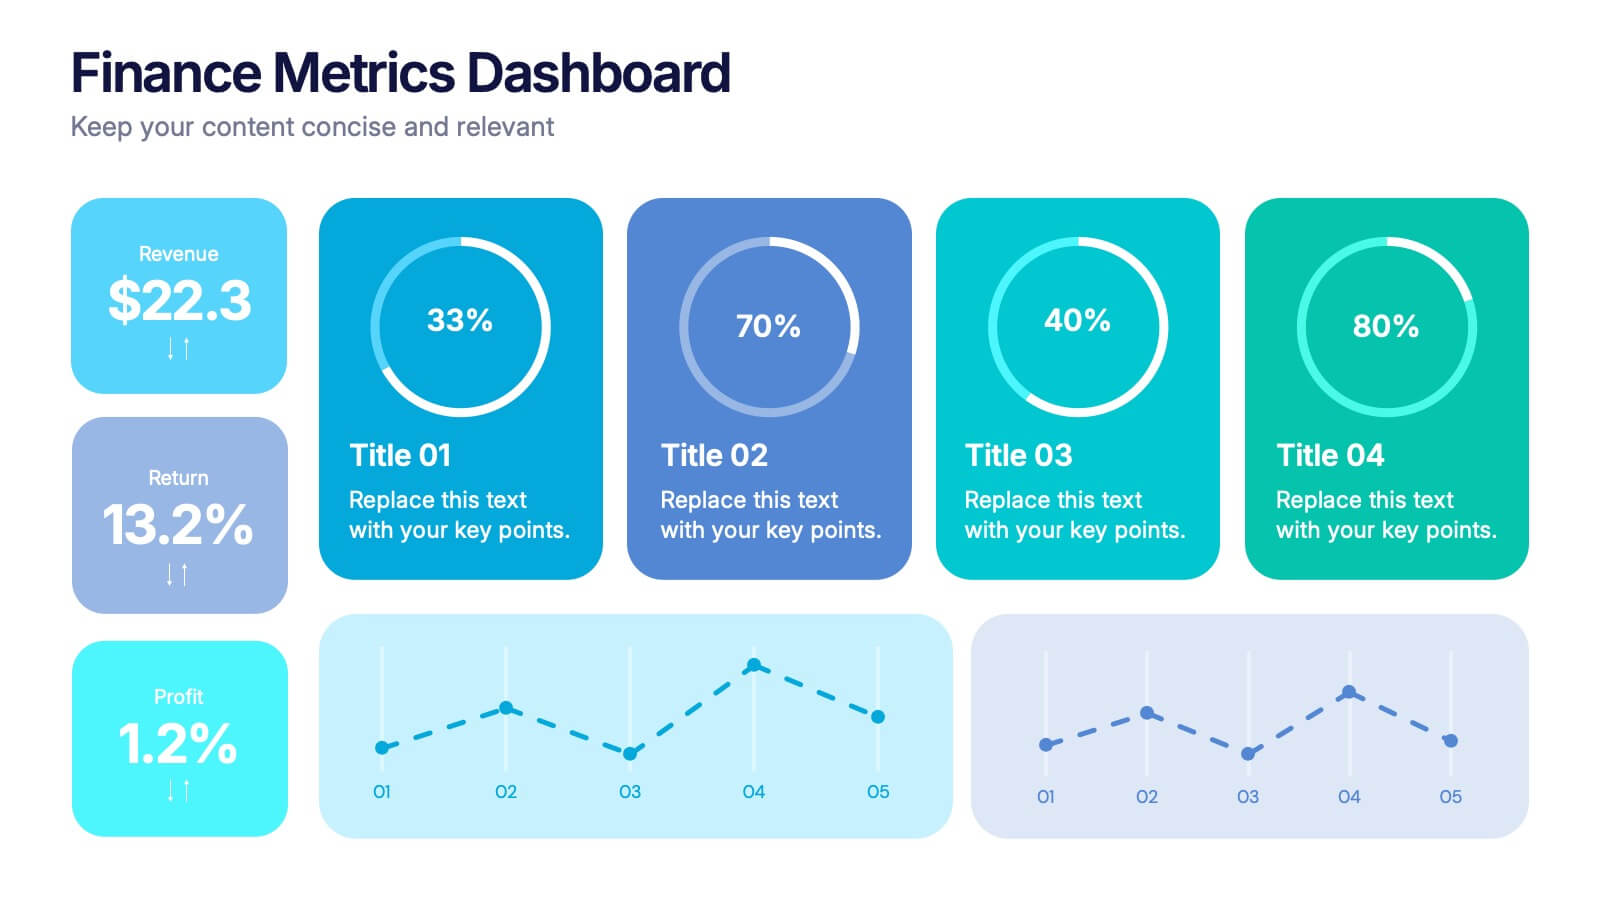
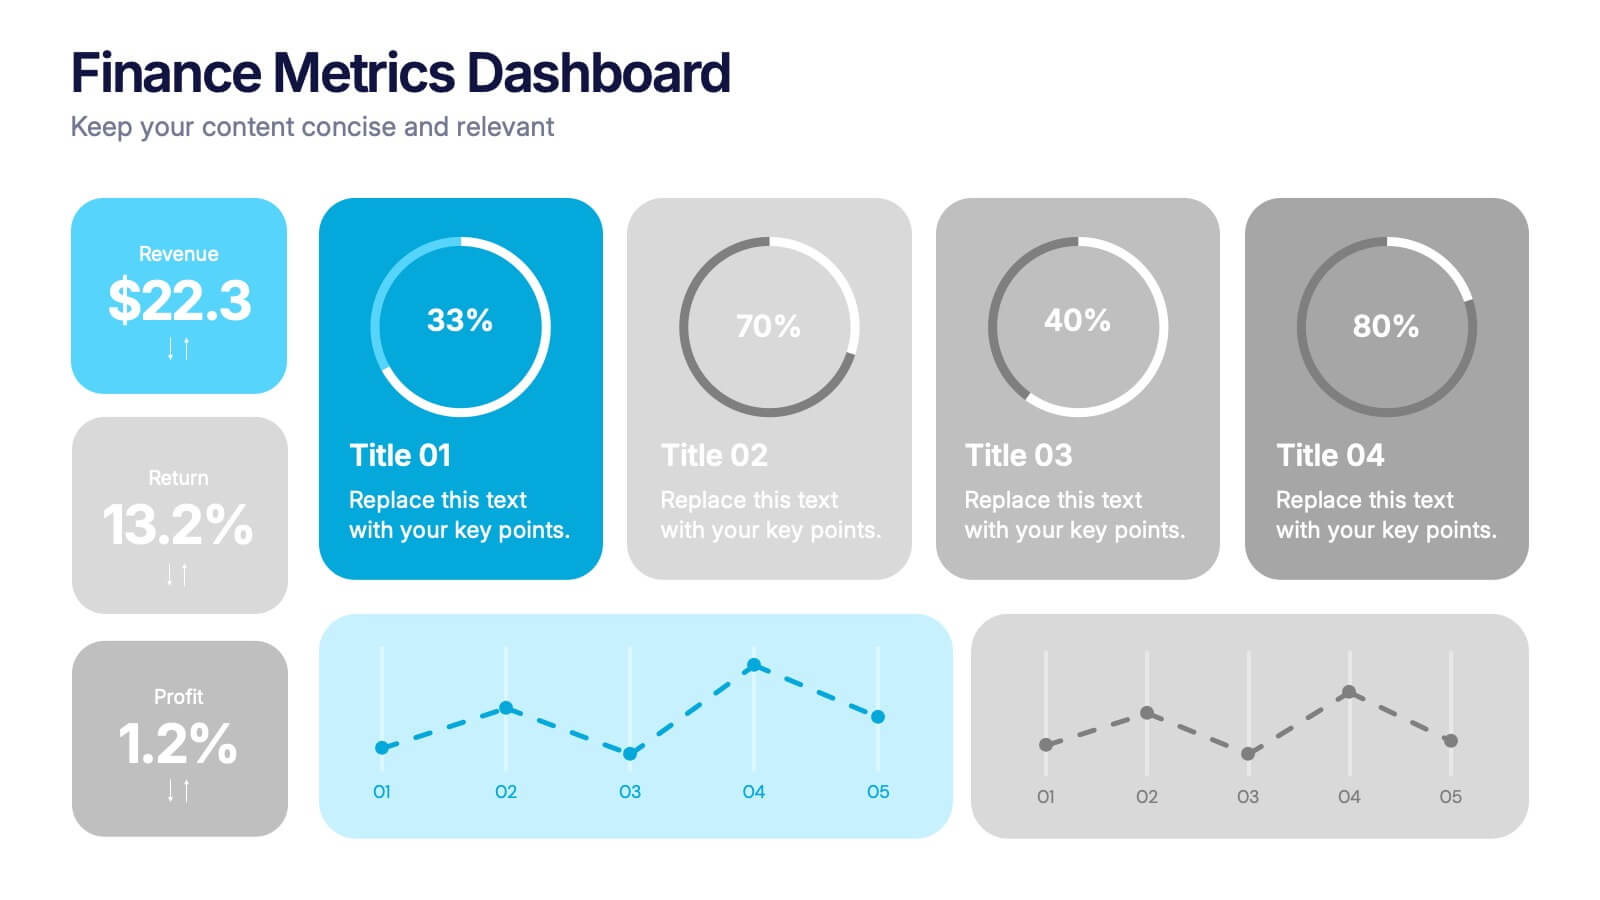
Bring your numbers to life with a bold, visual dashboard that makes complex financial data instantly clear. This presentation helps you track revenue, returns, profit, and performance trends using clean charts and modern KPI blocks designed for quick insight. Fully compatible with PowerPoint, Keynote, and Google Slides.
- Remove from favorites
Powerpoint Template
1 MB
Google Slides Template
External link
Keynote Template
2 MB
10 slides
Cloud Services Deployment Strategy Presentation
Present your IT roadmap with clarity using the Cloud Services Deployment Strategy slide. This vertical flowchart features ascending arrows and cloud icons, ideal for showing phased rollouts, service tiers, or migration plans. Easy to customize in PowerPoint, Keynote, and Google Slides.
- Remove from favorites
Powerpoint Template
4 MB
Google Slides Template
External link
Keynote Template
4 MB
22 slides
Muse UX Case Study Presentation
Deliver compelling UX case studies with a sleek presentation template designed to highlight your design journey and results. Ideal for showcasing your user-centered approach, it includes dedicated slides for project overview, user research, personas, journey mapping, wireframes, prototyping, and user testing. Clearly communicate your design principles and decision-making processes with visual design elements and brand guidelines. With specific sections for feedback, accessibility considerations, and project outcomes, this template ensures every aspect of your UX process is captured in a structured and visually engaging manner. Whether you're presenting to clients, stakeholders, or design teams, this template is fully editable and compatible with PowerPoint, Google Slides, and Keynote. Its modern design and professional layout provide an effortless way to convey the value of your UX work, making a lasting impact on your audience. Tailor it to your brand, and elevate your case studies today!


