


Features
- 24 Unique Slides
- Fully editable and easy to edit in Microsoft Powerpoint, Keynote and Google Slides
- 16:9 widescreen layout
- Clean and professional designs
- Export to JPG, PDF or send by email


Do you have any questions?
Recommend


6 slides
Customer Journey Mapping with Buyer Persona Presentation
Clearly visualize the customer experience across all touchpoints with this structured journey mapping slide. Featuring a central buyer persona graphic and six customizable steps with icons, this layout helps you break down each stage of the customer path. Perfect for UX strategy, customer service insights, and product development. Fully editable and compatible with PowerPoint, Keynote, and Google Slides.


4 slides
Environmental Impact Assessment Presentation
Bring your audience into a greener future with a clean, leaf-inspired design that makes complex sustainability insights feel clear and approachable. This presentation helps you break down key environmental factors, impact areas, and responsible planning in a simple visual flow. Fully editable and compatible with PowerPoint, Keynote, and Google Slides.
21 slides
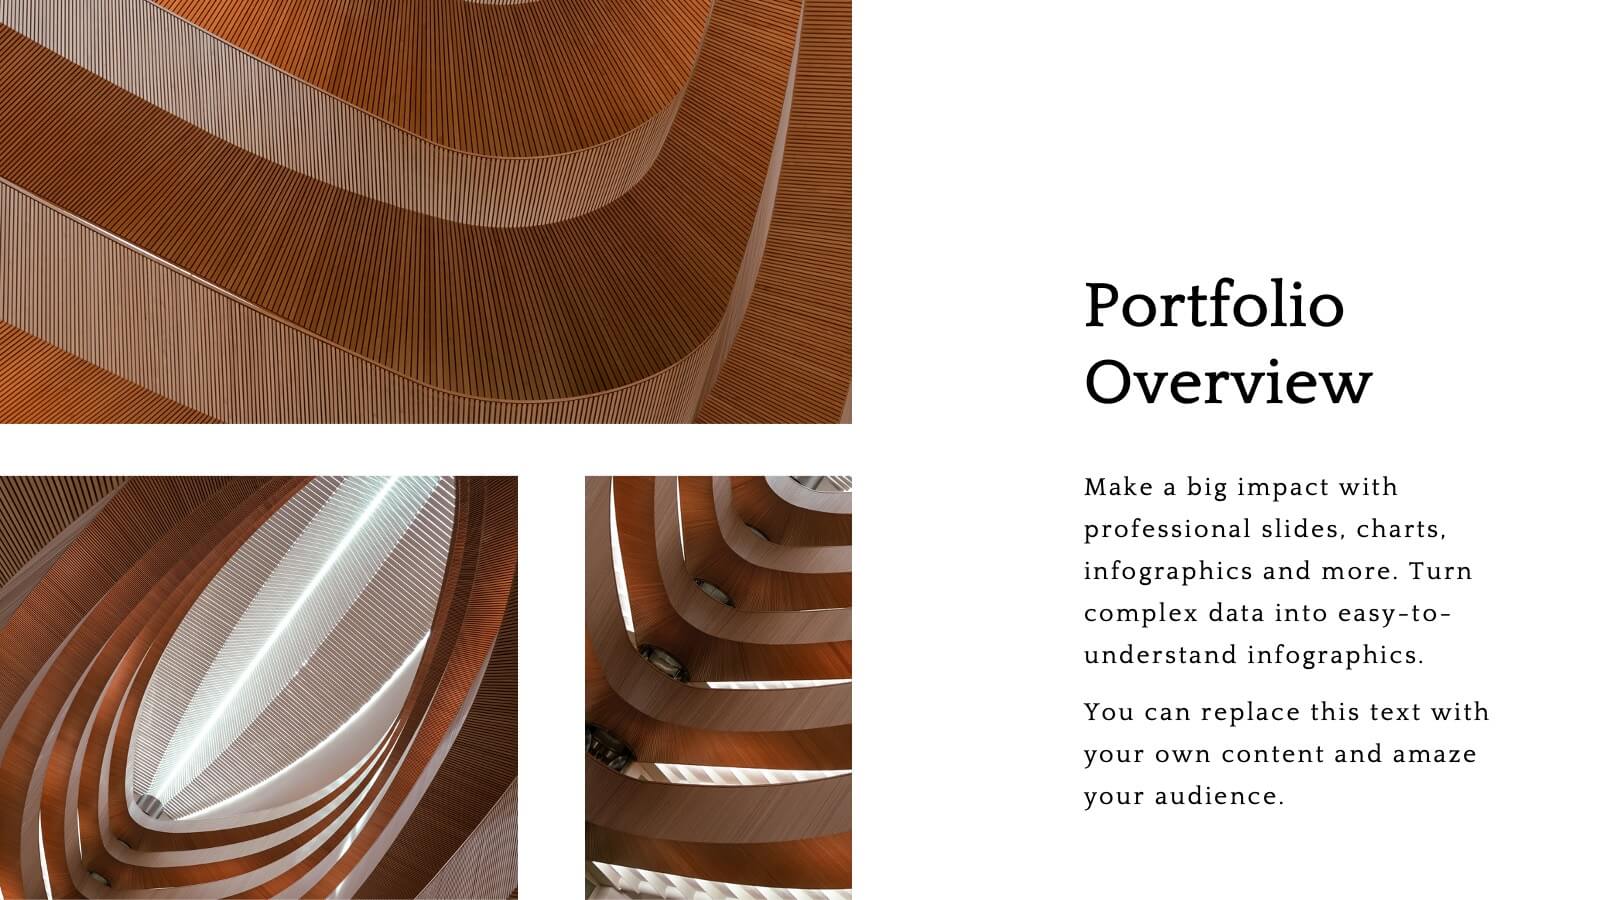
Flare Creative Portfolio Presentation
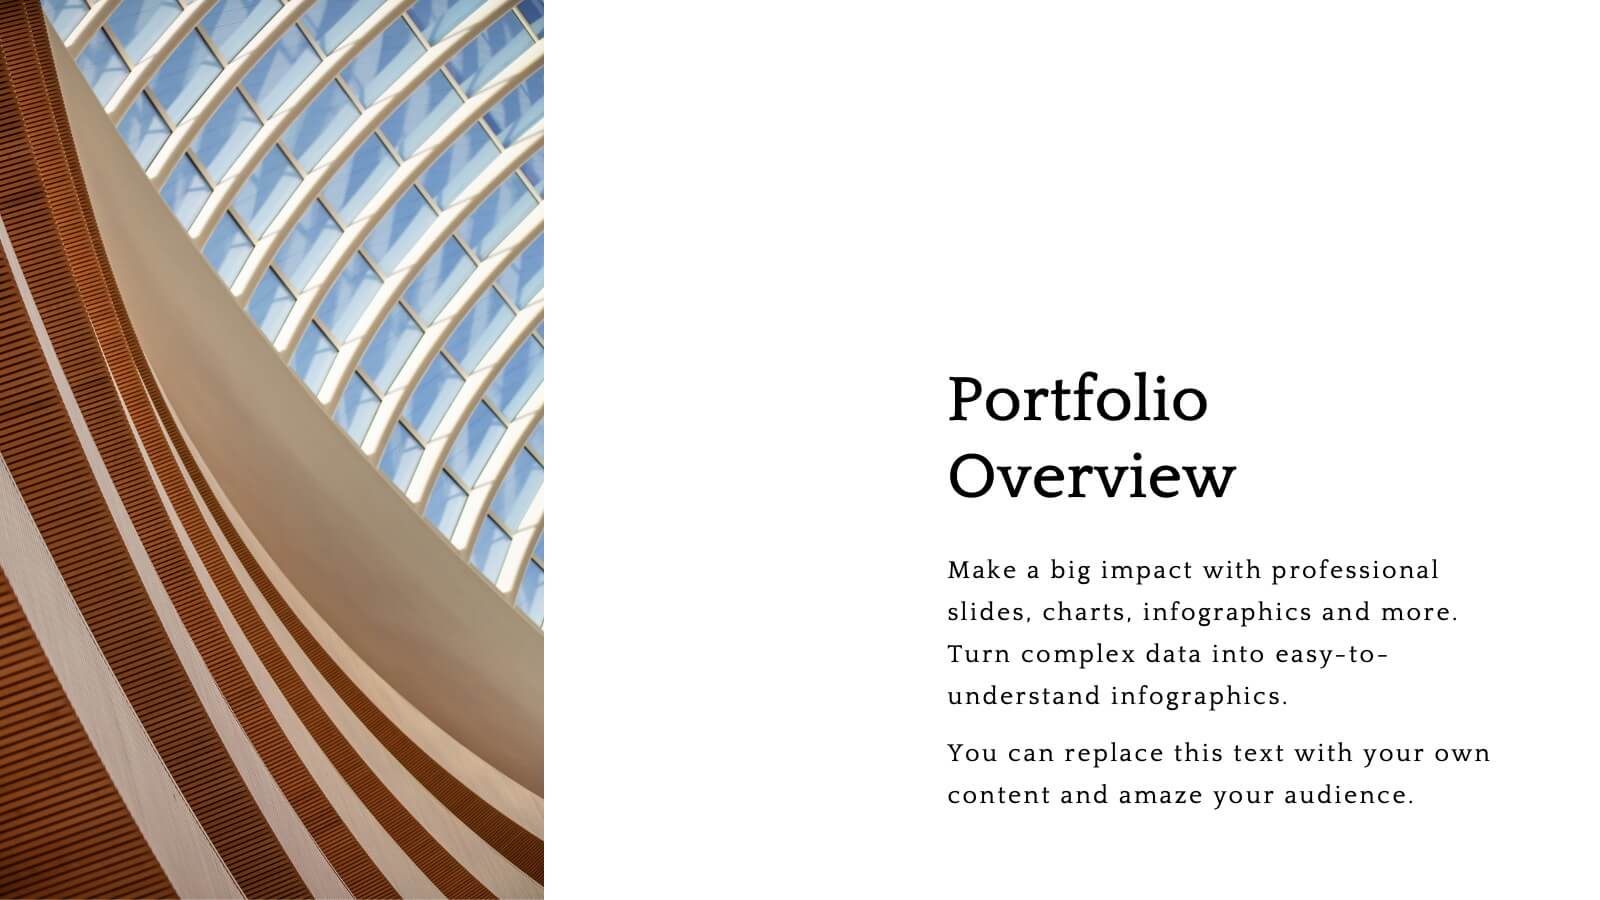
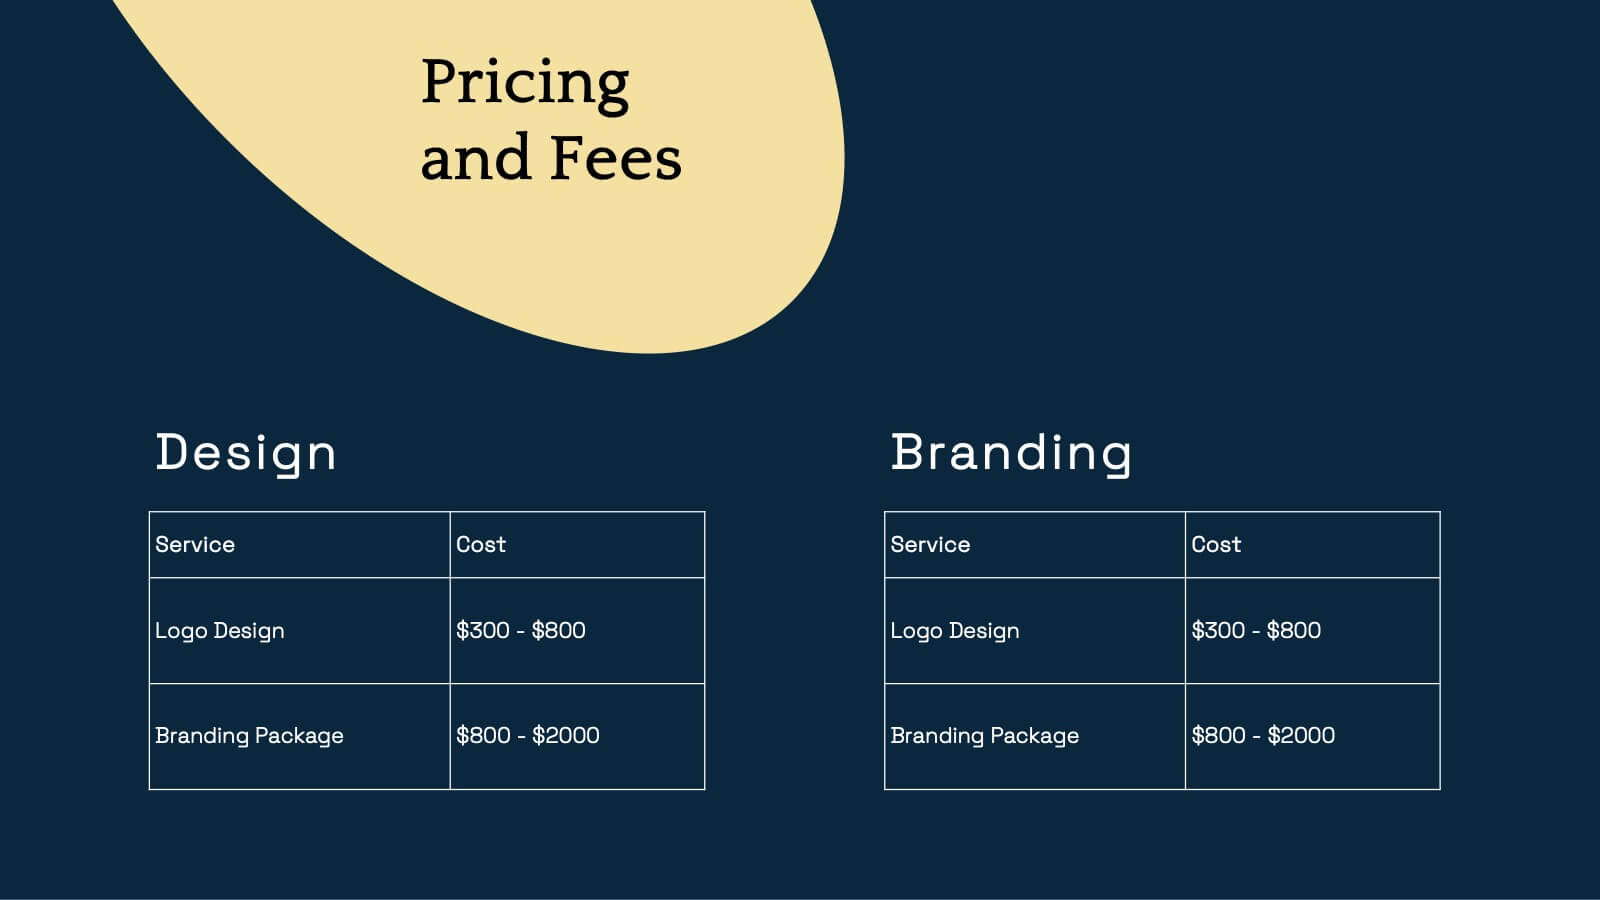
Showcase your creative work with this elegant portfolio template! Perfect for highlighting projects, client testimonials, and services offered. Ideal for artists, designers, and creatives aiming to impress clients and collaborators. Compatible with PowerPoint, Keynote, and Google Slides, this template ensures your portfolio is clear, professional, and visually stunning. Make your work shine!


6 slides
Restaurant Branding Food Presentation
Bring your ideas to life with a presentation that feels fresh, playful, and full of personality. This layout helps you showcase food branding concepts, menu themes, and visual identity elements in a clear, engaging flow that’s easy for audiences to follow. Fully compatible with PowerPoint, Keynote, and Google Slides.


21 slides
Naga Project Proposal Presentation
Present your project with confidence using this comprehensive proposal presentation! It covers crucial sections such as objectives, methodology, timeline, budget breakdown, and risk mitigation strategies, ensuring every detail is addressed clearly. Ideal for client proposals or internal planning, this template works seamlessly with PowerPoint, Keynote, and Google Slides.


6 slides
Closing Summary and Key Takeaway Presentation
End your presentation with clarity using this Closing Summary and Key Takeaways Presentation. The segmented half-circle design helps you highlight up to 5 final messages or calls to action. Each section is color-coded for visual emphasis and easy understanding. Ideal for wrap-up slides, final reflections, or summary overviews. Fully editable in PowerPoint, Keynote, Google Slides, and Canva.


5 slides
Corporate Office Life Illustration Scene Presentation
Bring your workplace concepts to life with this modern office scene illustration. Featuring a top-down view of diverse team members in a meeting, this slide is perfect for showcasing collaboration, brainstorming, or teamwork insights. Fully customizable and compatible with PowerPoint, Keynote, and Google Slides for seamless editing.


7 slides
Bowtie Risk Management Diagram Presentation
Visualize cause and consequence with a clean, symmetrical flow that simplifies complex risk scenarios. This presentation helps you illustrate threats, controls, and outcomes in one cohesive framework, making decision-making clear and impactful. Fully customizable and compatible with PowerPoint, Keynote, and Google Slides for professional risk analysis presentations.


6 slides
International Business Strategy World Map Presentation
Showcase your company’s global presence and strategic insights with this dynamic International Business Strategy World Map slide. Each marker corresponds to key business regions, linked to five customizable titles for region-specific data, objectives, or metrics. Clean design with a vertical legend layout keeps the focus on your insights. Fully editable and compatible with PowerPoint, Keynote, and Google Slides.


7 slides
Business Process Checklist
Simplify workflow tracking with this visual business process checklist slide. Featuring circular progress bars and bold letter labels (A–C), this template helps visualize task completion percentages for up to six steps. Perfect for audits, quality checks, or operational reviews. Fully customizable in PowerPoint, Keynote, and Google Slides.


26 slides
Professional Etiquette Presentation
Navigate the nuances of professional decorum through this tapestry of visuals that articulate the essence of workplace conduct. Against a palette of serene blues, each slide is a chapter in the unwritten manual of corporate finesse. Behold the tableau of contents, a compass that guides through topics from networking nuances to meeting mastery. Profile snapshots reveal the faces behind the expertise, their demeanors a blend of affability and authority. Charts ascend like ladders, each bar a rung towards proficiency, while infographics spiral into knowledge funnels, distilling broad concepts into digestible insights. In the realm of comparison, dichotomies transform into dialogues, contrasting ideas merging into a unified vision of etiquette. Venn diagrams interlock circles of skills, control, and success, illustrating the symbiotic relationship of competencies. Contact slides extend a virtual handshake, inviting engagement and fostering connections. This presentation is an homage to the unspoken - the grace of gratitude, the elegance of silence, and the power of a well-timed gesture - as it crafts an environment where professionalism is not just practiced, but lived.


10 slides
AIDA Model Explained with Graphics Presentation
Bring your message to life with a dynamic visual flow that guides viewers through each stage of your communication strategy in a clear, compelling way. This presentation breaks complex concepts into simple steps, helping audiences follow your narrative effortlessly. Fully customizable and compatible with PowerPoint, Keynote, and Google Slides.


26 slides
Shadowyn Brand Guidelines Proposal Presentation
Present your branding vision with a polished and professional template designed to capture the essence of your identity. This comprehensive set includes sections for brand values, identity components, and voice and tone, ensuring your message is consistent and memorable. Showcase essential details like color palettes, typography, and imagery with visually engaging slides. Communicate your market position, unique selling proposition, and brand strategy clearly to stakeholders. Dive into consumer personas and brand touchpoints for a deeper connection with your audience. Tailor each slide to align with your branding requirements. Perfect for use in PowerPoint, Google Slides, and Keynote, this template is ideal for creative professionals, marketing agencies, and business leaders aiming to make a lasting impression.


3 slides
Governance and Compliance Slide Presentation
Bring structure and clarity to complex corporate processes with this modern triangle-based presentation design. Ideal for showcasing governance principles, compliance strategies, and operational standards, it visually balances accountability and efficiency. Fully editable and compatible with PowerPoint, Keynote, and Google Slides for seamless professional customization.


10 slides
Creative Business Pitch Deck Presentation
Make your ideas stand out with a presentation that blends creativity and professionalism. Perfect for entrepreneurs and teams showcasing innovative business concepts, it helps structure your pitch with clarity and impact. Fully customizable and compatible with PowerPoint, Keynote, and Google Slides for seamless editing and polished results.


6 slides
Seven Factors for Business Success Presentation
Present key drivers of business success with this visually balanced 7-element diagram. Featuring Systems, Structure, Strategy, Skills, Staff, Style, and Shared Value, this slide is ideal for strategic planning and leadership presentations. Fully customizable in PowerPoint, Keynote, and Google Slides to match your branding and presentation objectives.


4 slides
Surface vs Depth Model Iceberg Presentation
Uncover the unseen with this Surface vs Depth Model Iceberg presentation. Designed to highlight the contrast between visible factors (15%) and underlying elements (85%), this layout is ideal for business analysis, user behavior, or strategic planning. Fully editable in Canva, PowerPoint, and Google Slides for seamless customization.