


Features
- 26 Unique slides
- Fully editable and easy to edit in Microsoft Powerpoint, Keynote and Google Slides
- 16:9 widescreen layout
- Clean and professional designs
- Export to JPG, PDF or send by email


Do you have any questions?
Recommend


20 slides
Venus Design Proposal Presentation
Present your design proposal with confidence using this sleek and professional layout! It includes everything from problem statements and proposed solutions to budget breakdowns, milestones, and team expertise, ensuring every detail is covered. Ideal for client presentations or internal project pitches, this template is fully compatible with PowerPoint, Keynote, and Google Slides.


5 slides
Key Business Question Breakdown Presentation
Present critical insights with this keyhole-themed layout, perfect for outlining strategic business questions or core decision points. The six-segment format allows you to break down complex topics into clear, actionable areas. Fully customizable in Canva, PowerPoint, or Google Slides—ideal for planning, workshops, or stakeholder presentations.
22 slides
Whirlwind Advertising Agency Proposal Presentation
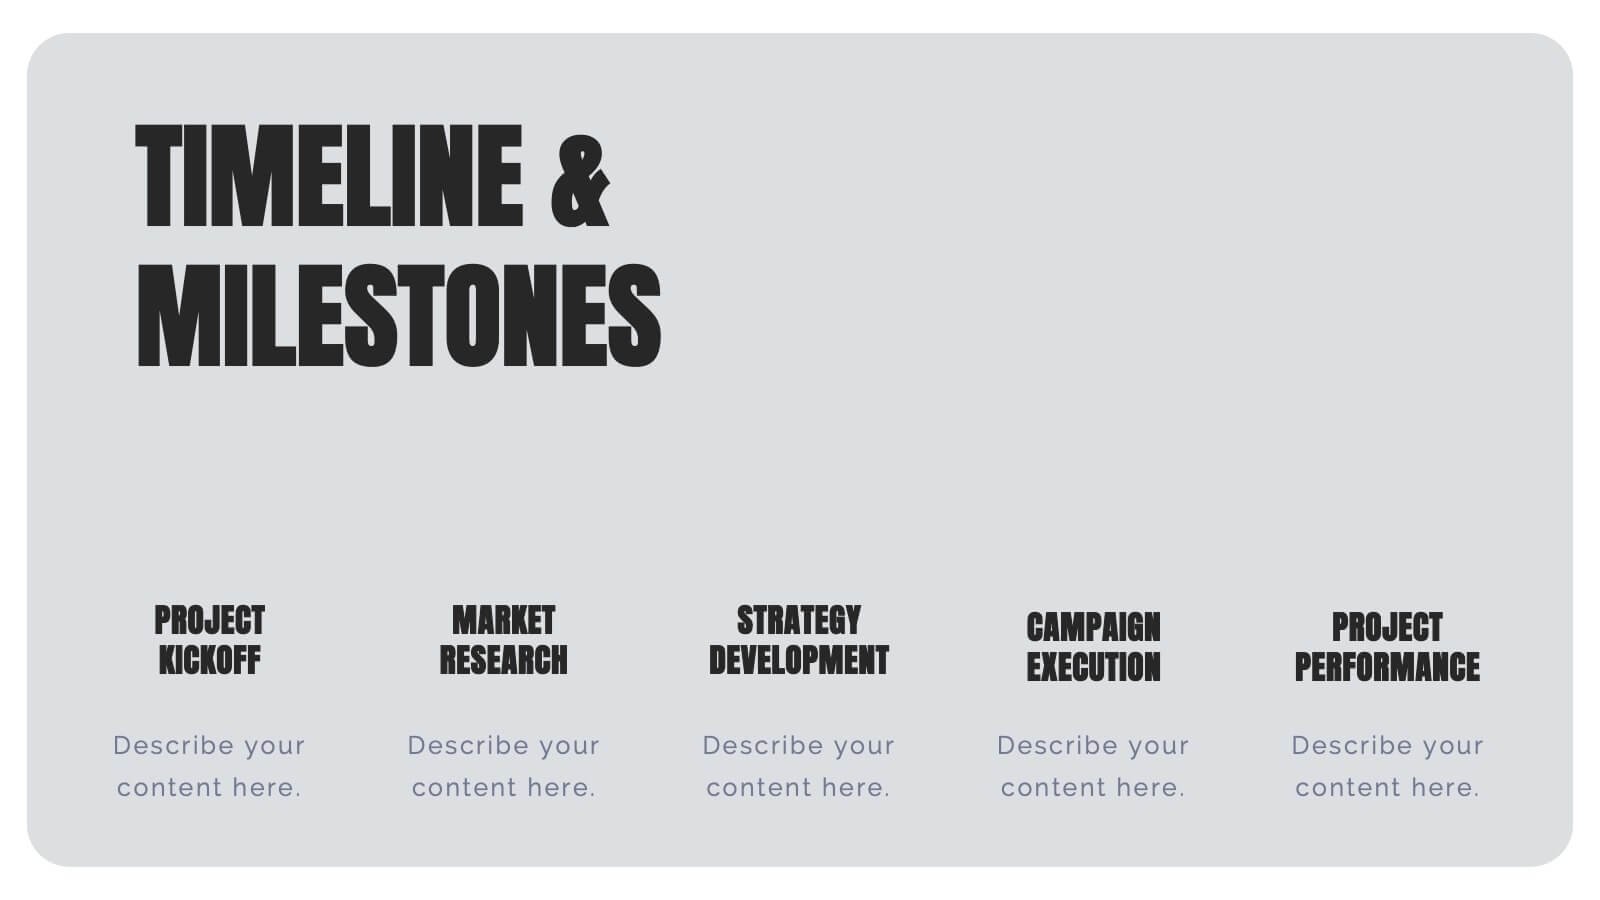
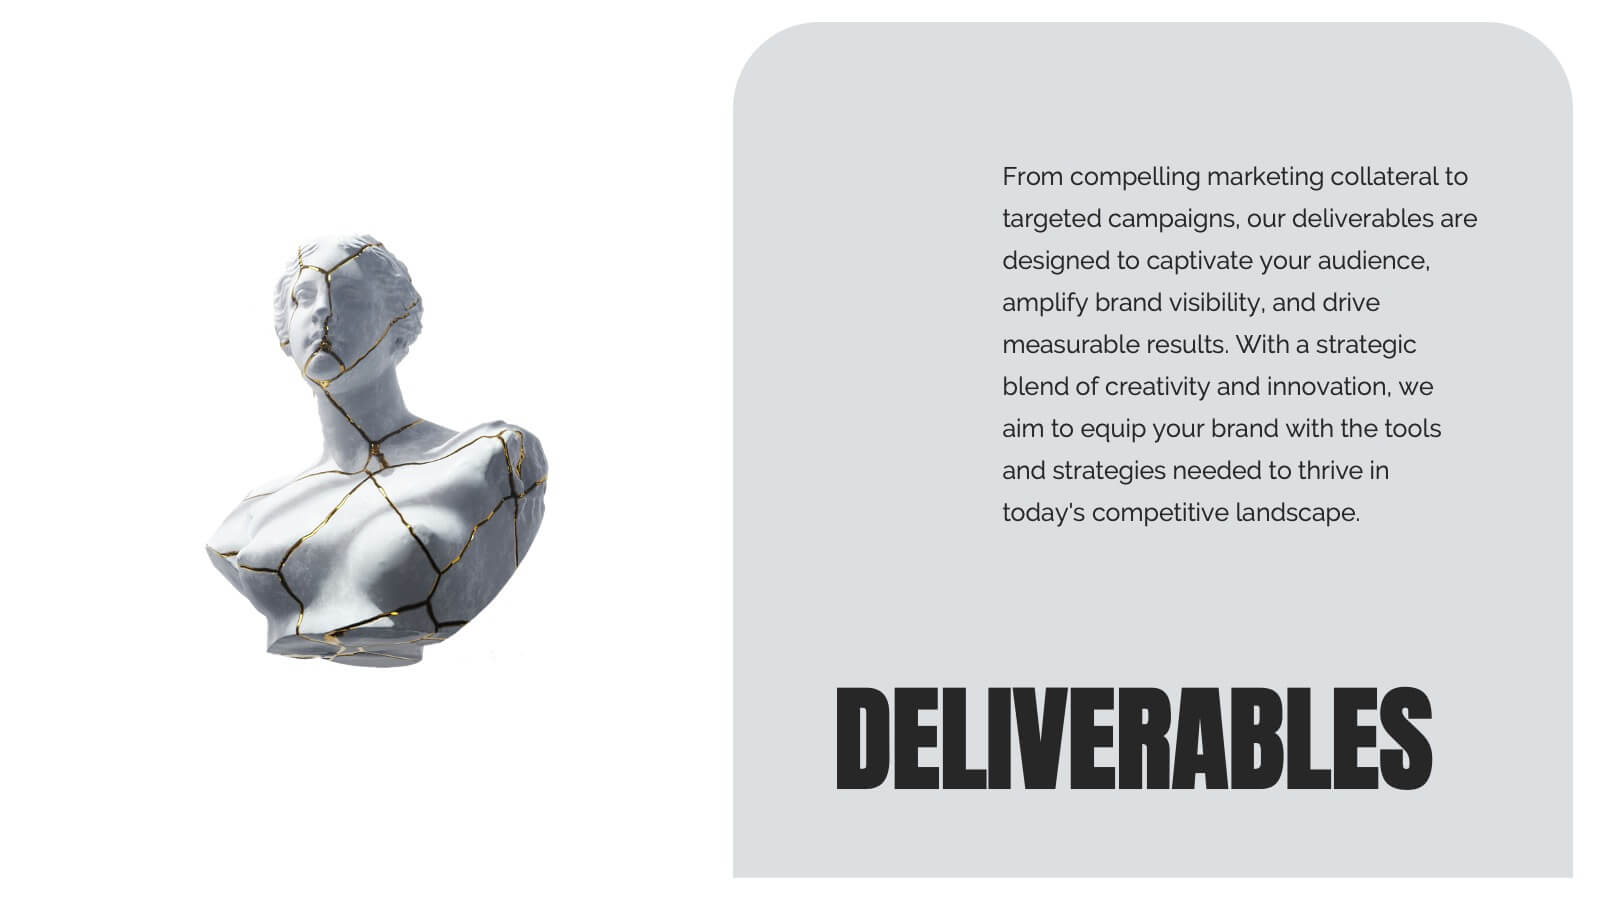
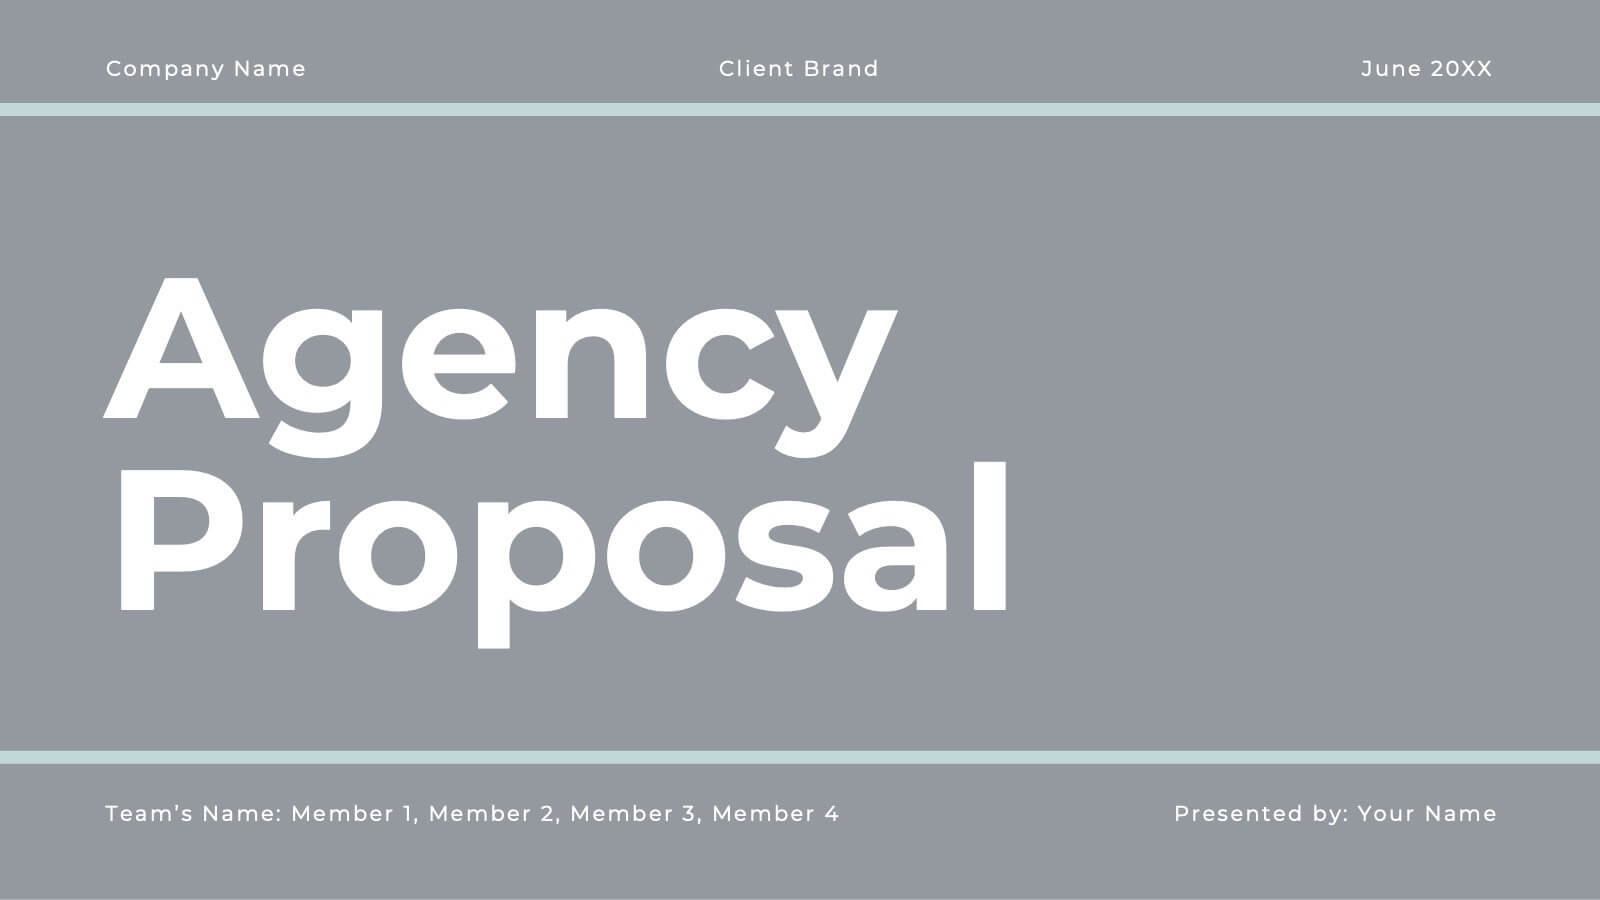
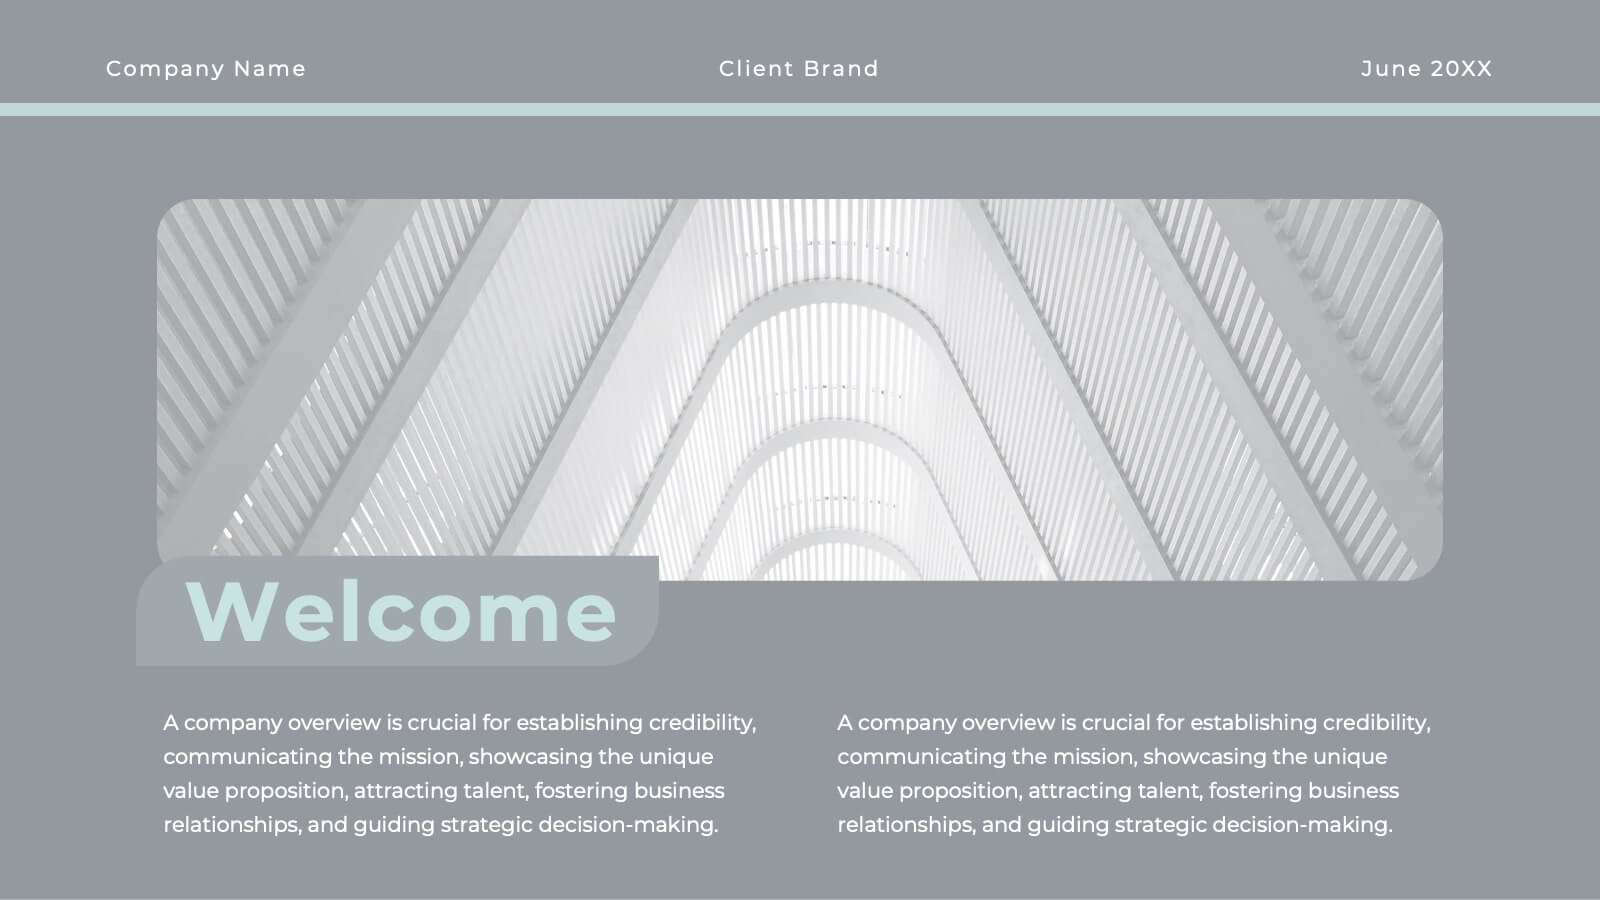
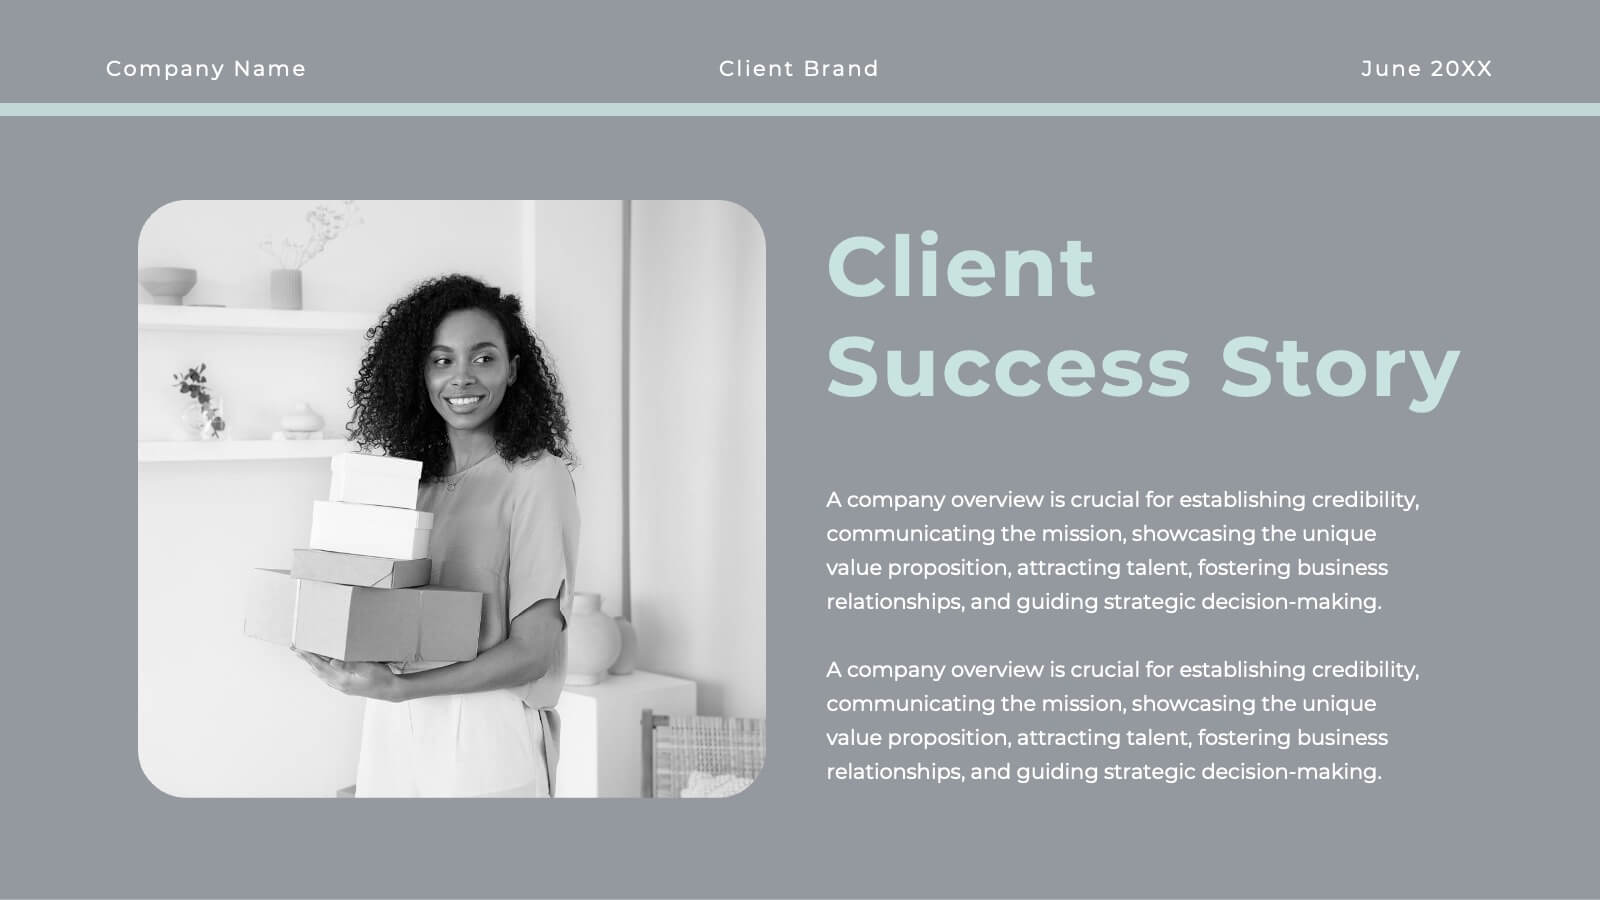
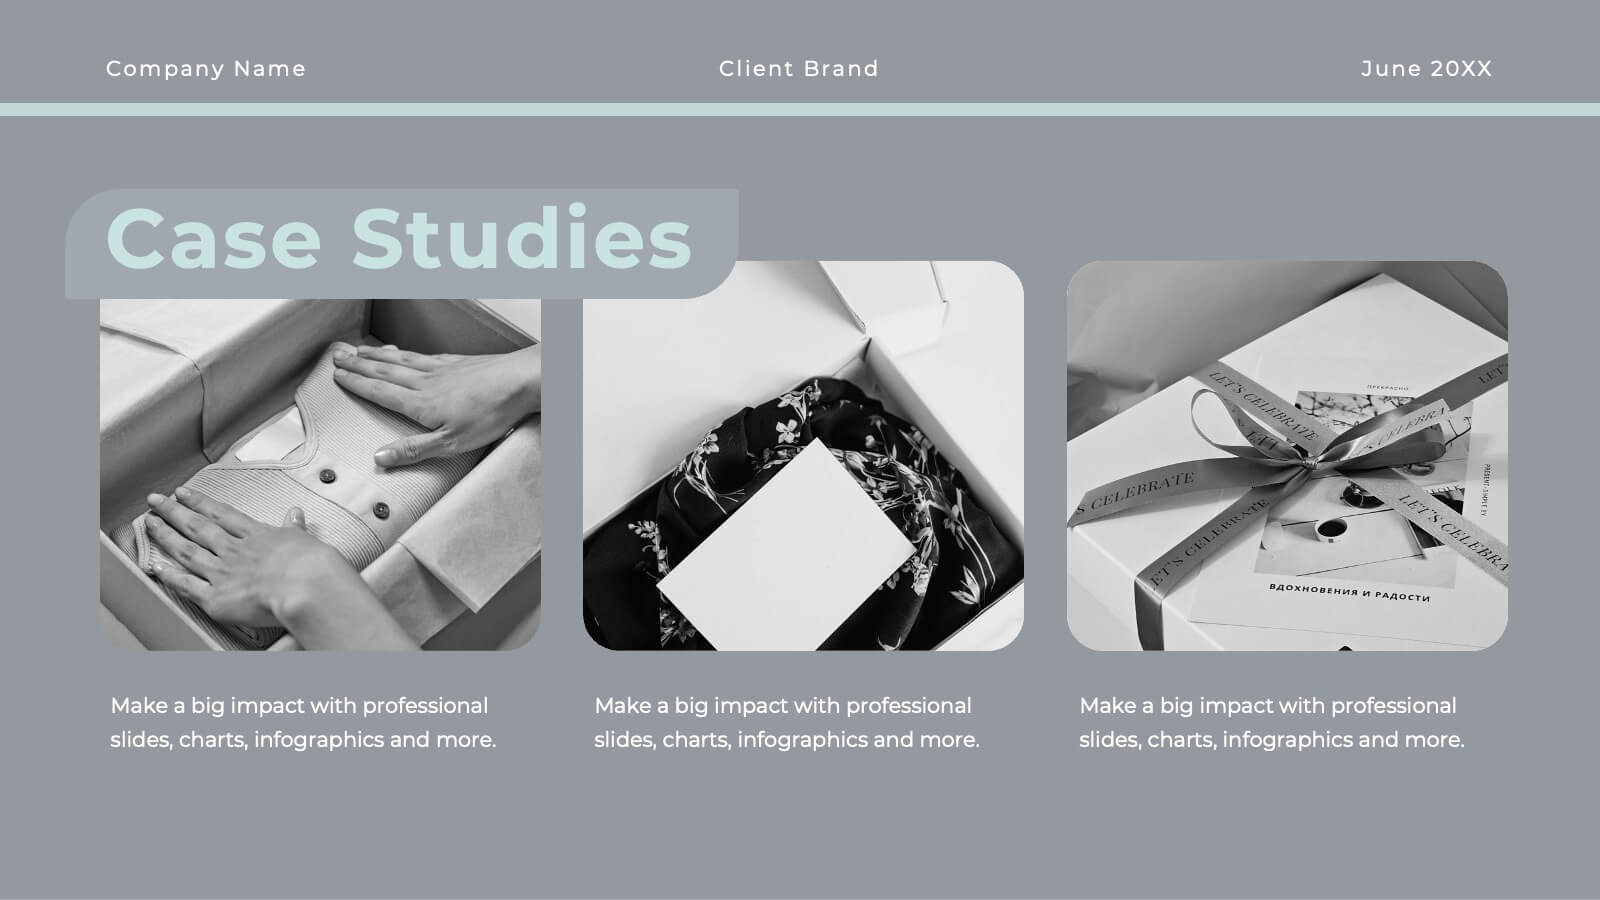
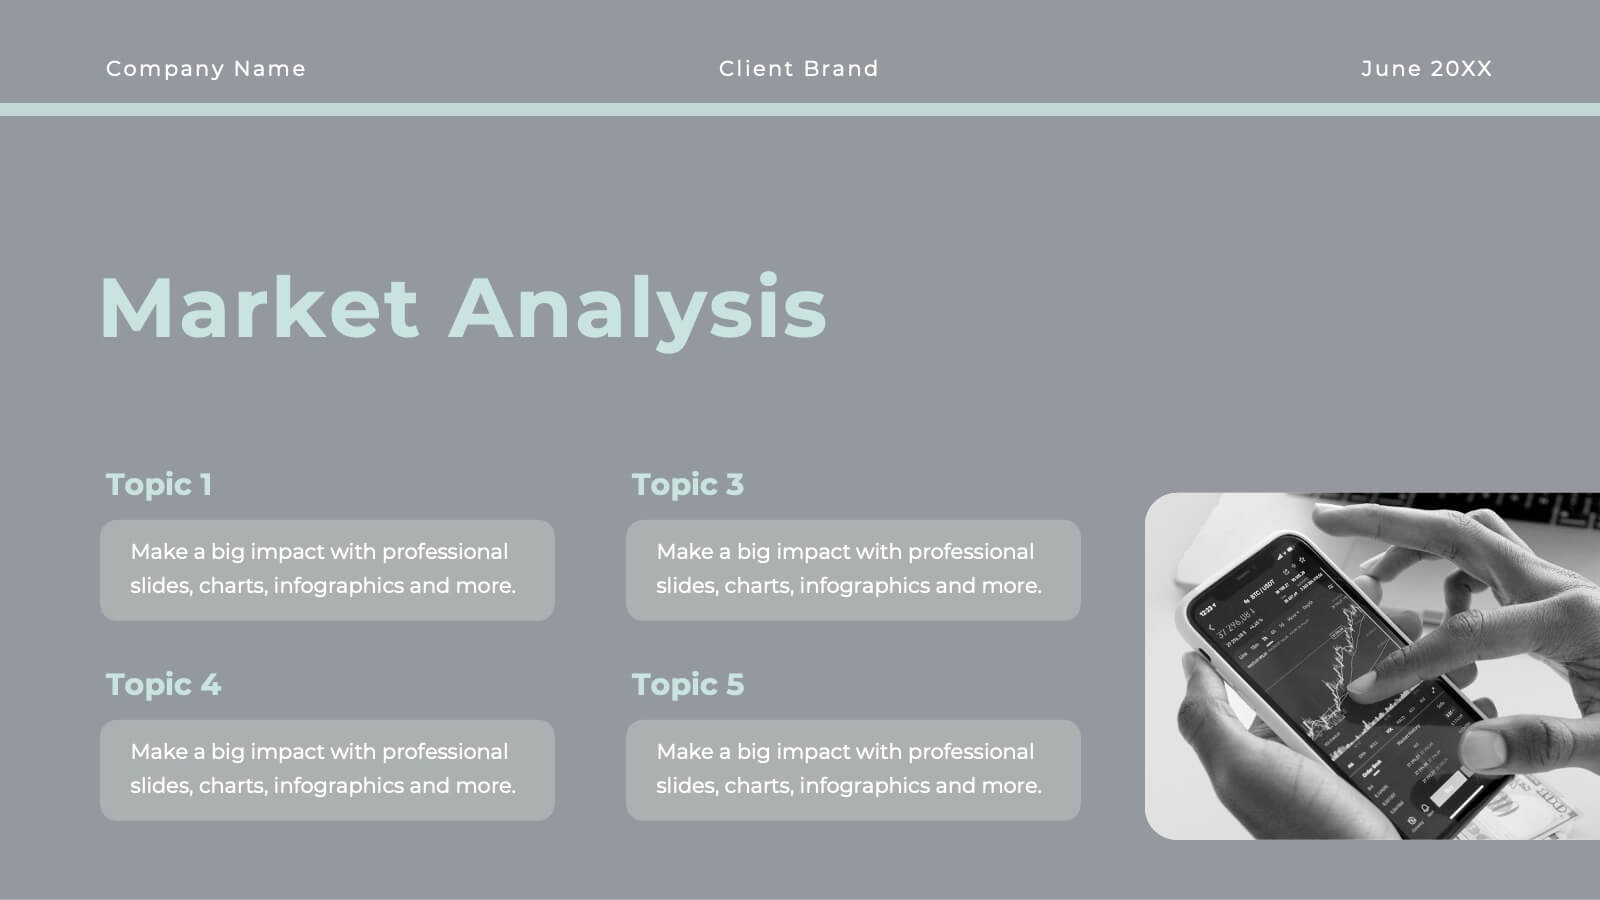
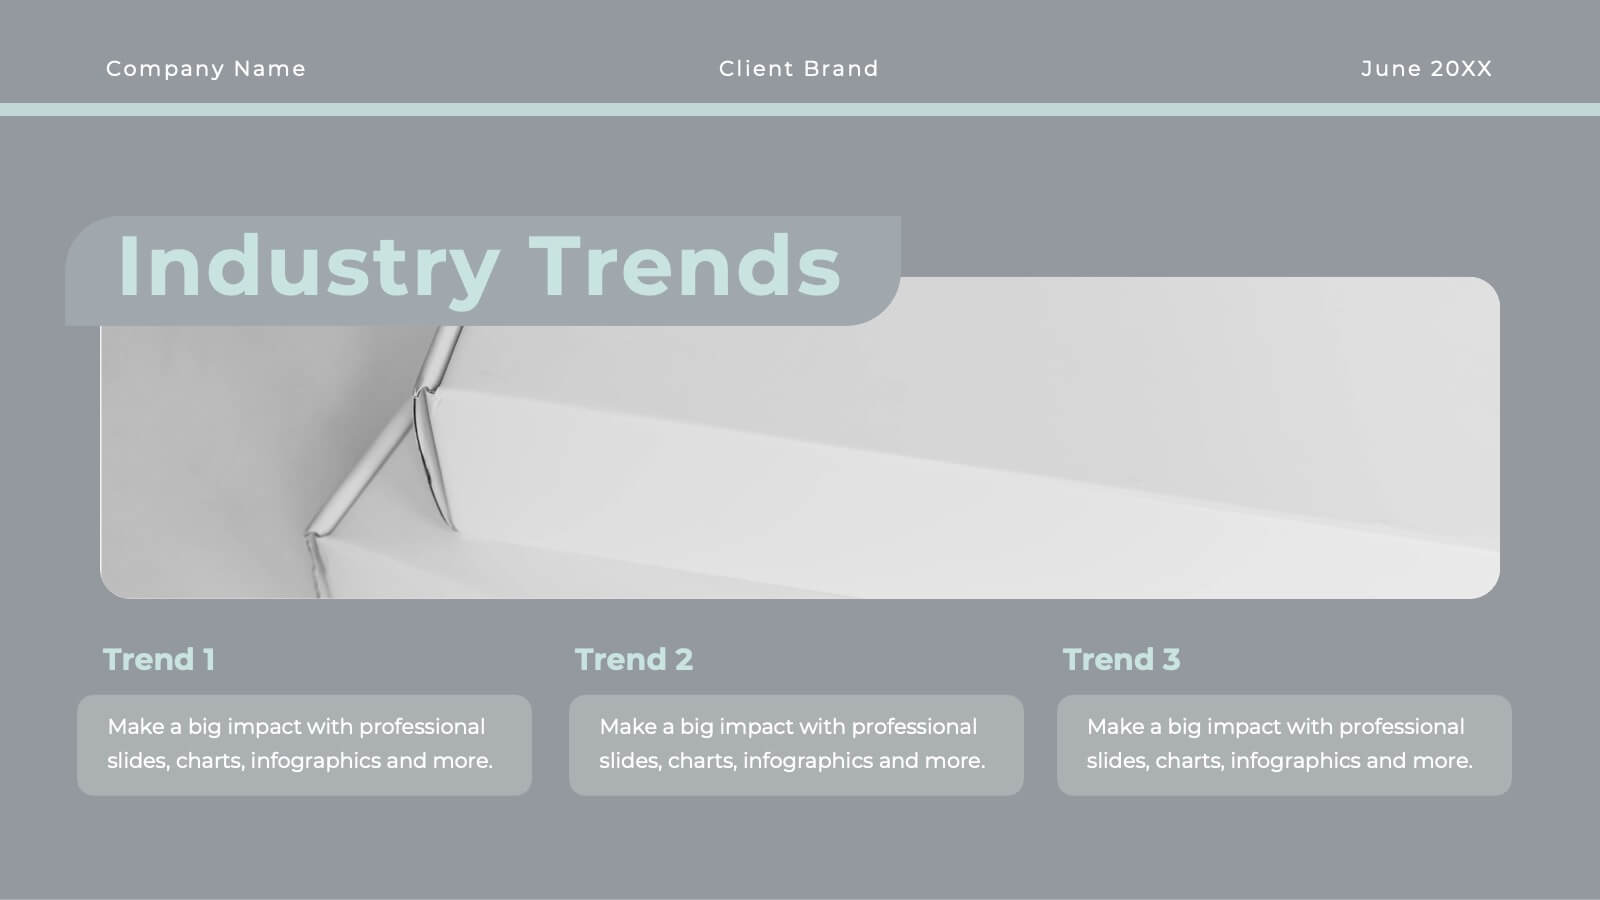
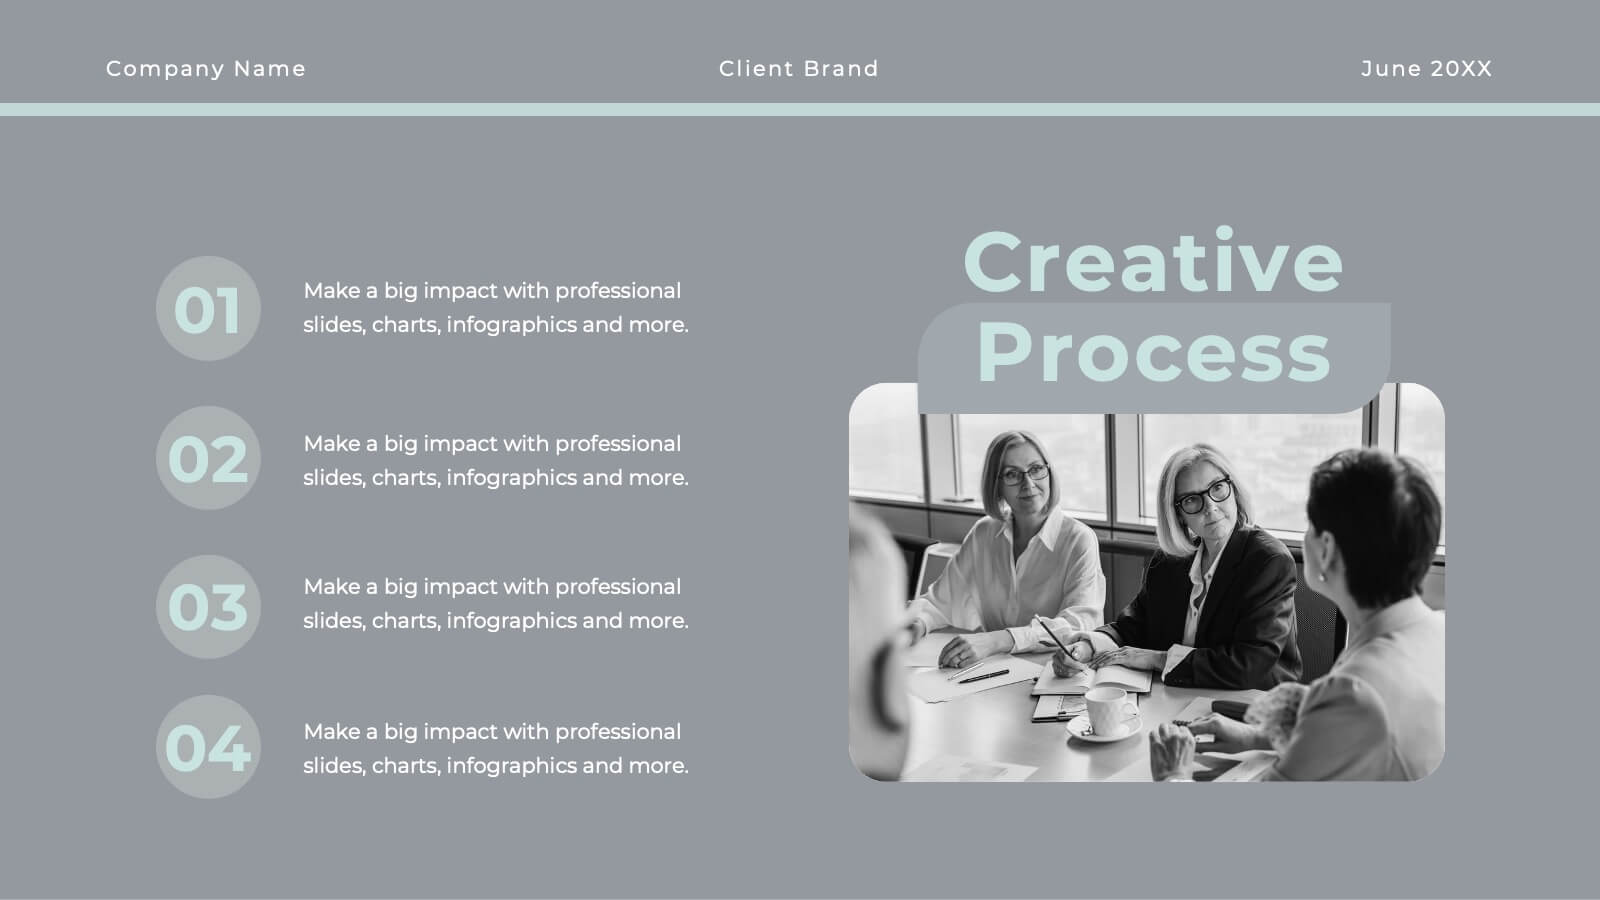
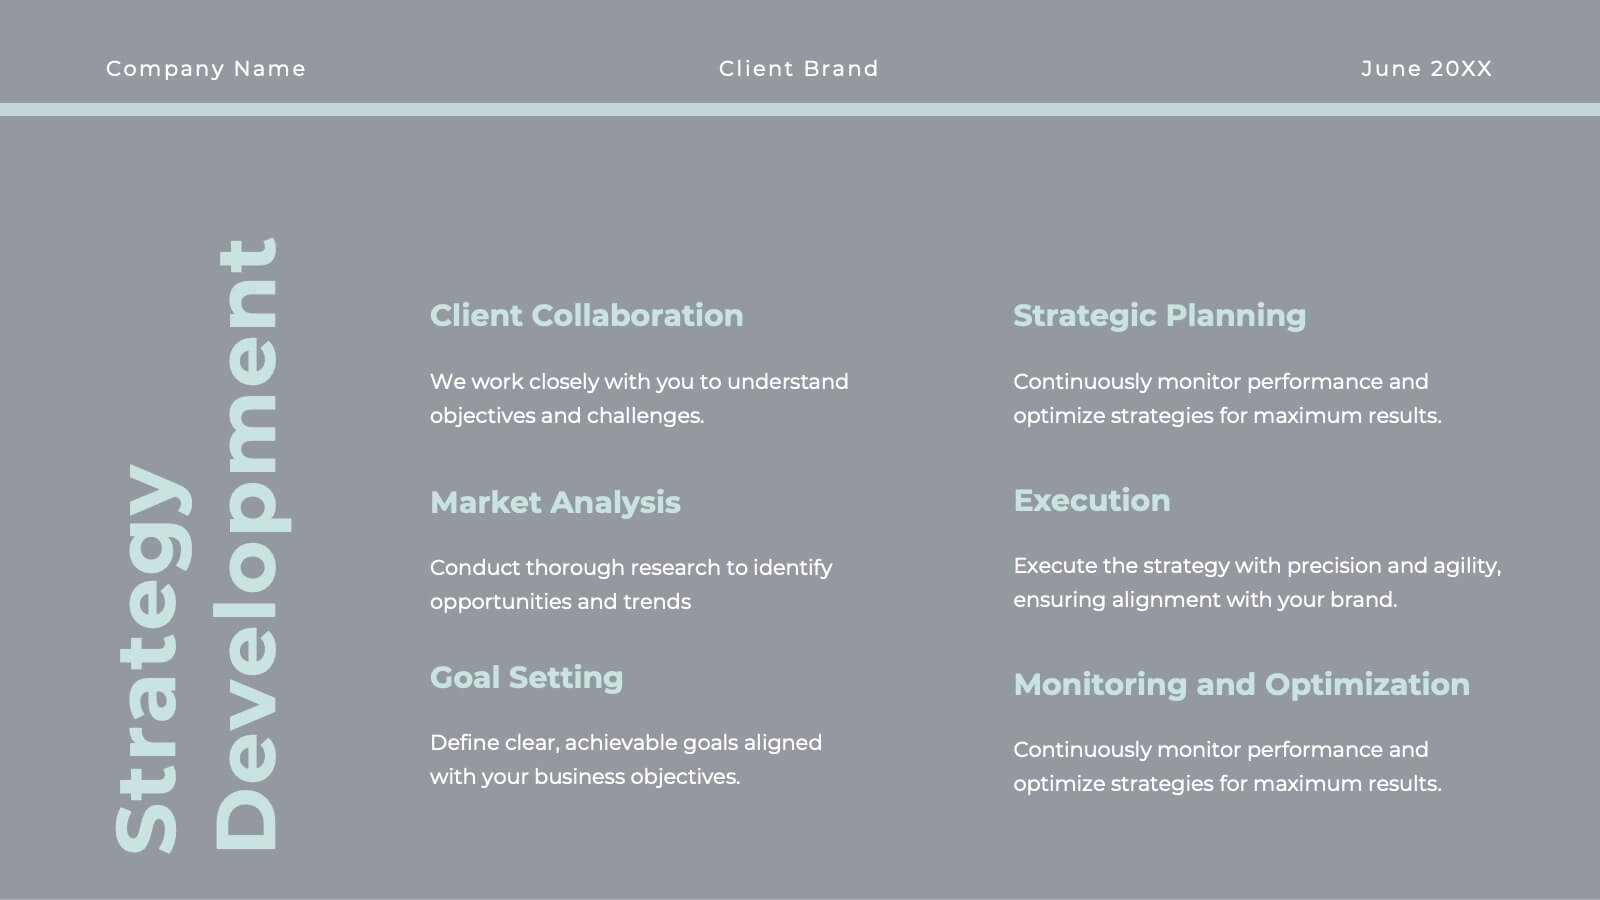
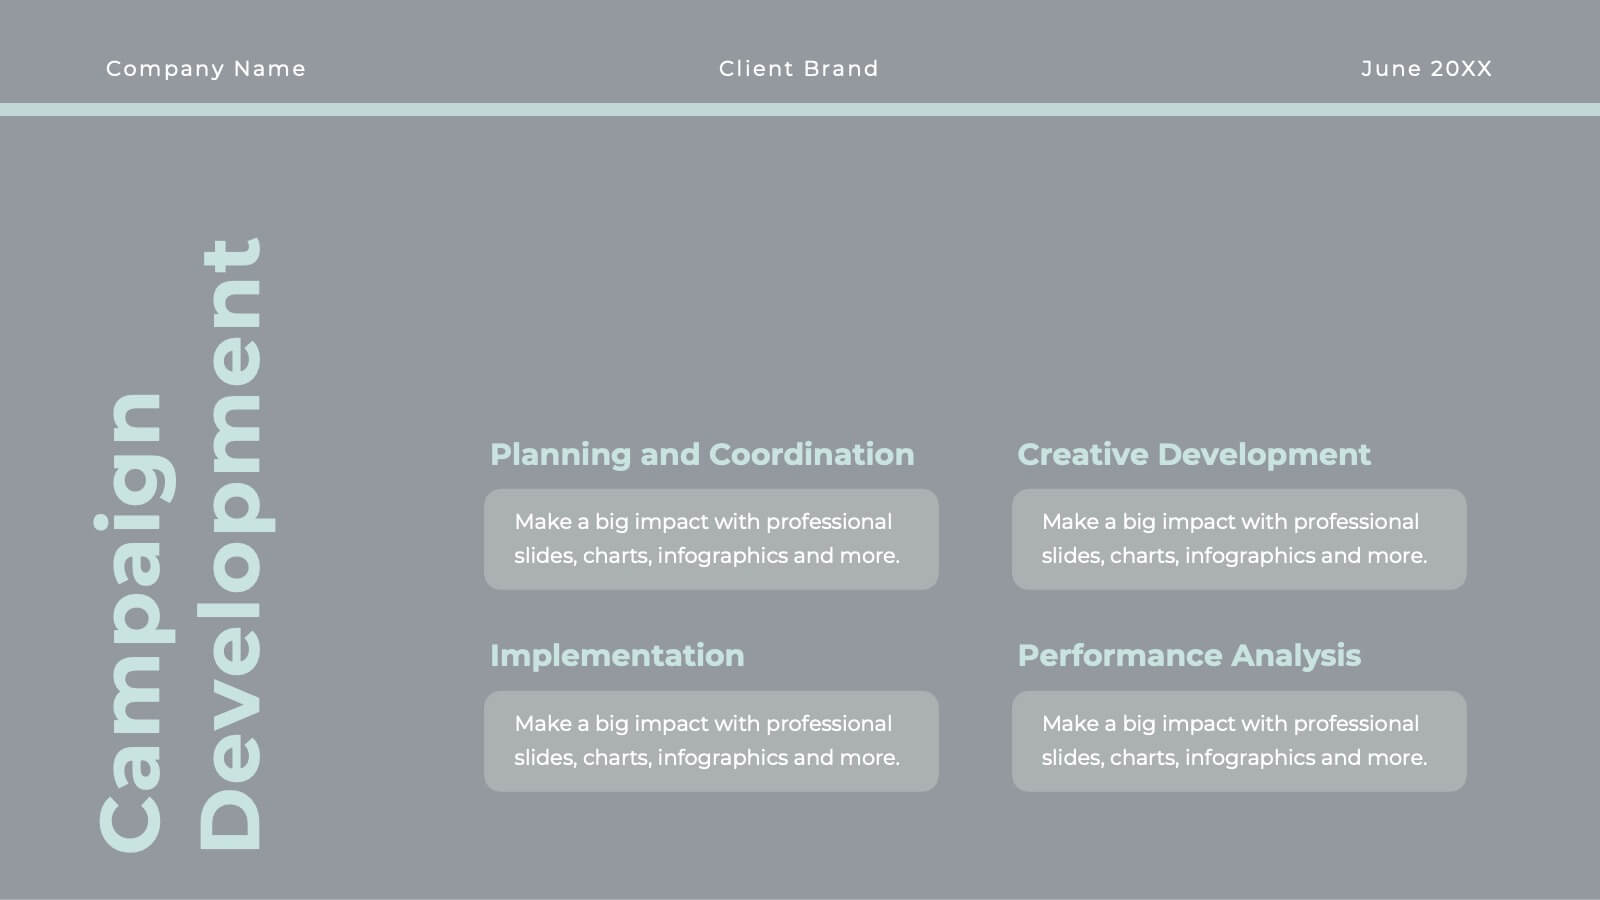
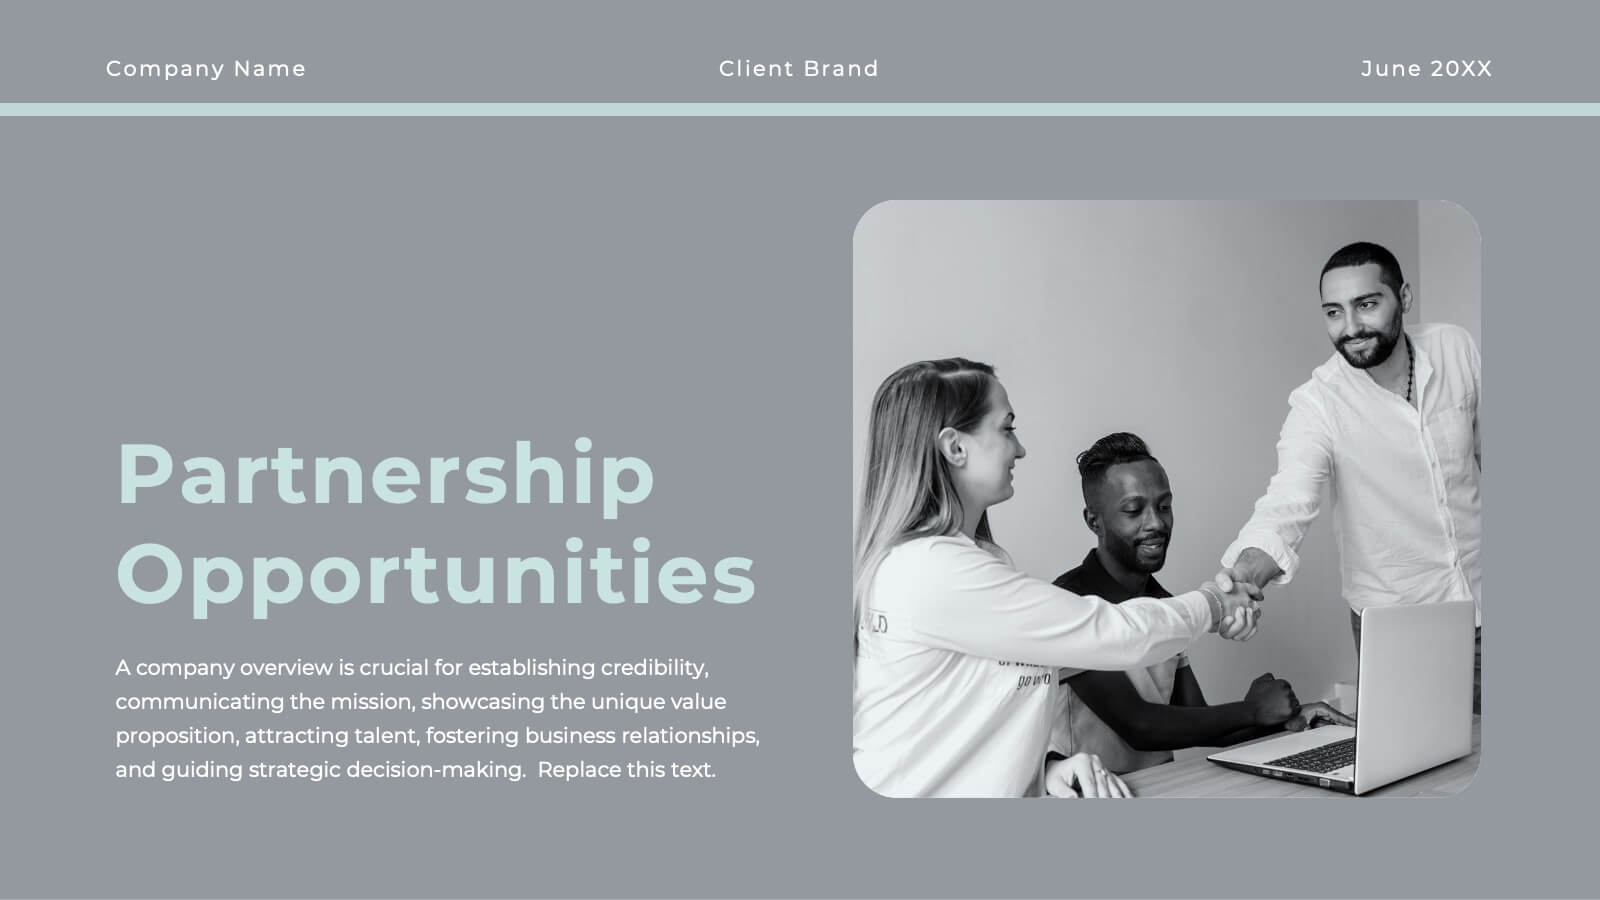
Get ready to elevate your agency’s game with a proposal template that’s as polished as your services! This sleek and sophisticated design is crafted to make a lasting impression on your clients and partners. From introducing your team’s expertise to showcasing successful case studies, every slide is meticulously designed to reflect professionalism and creativity. The clean, modern layout helps you present your market analysis, industry trends, and strategic approach with clarity and impact. With dedicated sections for client testimonials, campaign development, and partnership opportunities, this template ensures your agency’s value proposition is communicated with confidence and style. Perfectly adaptable to PowerPoint, Keynote, and Google Slides, this proposal template is your go-to tool for sealing deals and building lasting relationships. Your agency’s vision and mission will shine through in a presentation that’s both powerful and persuasive, making your proposals truly unforgettable!


6 slides
Business Logic Flow Chart
Streamline complex processes with the Business Logic Flow Chart Presentation. This modern, curved connector design helps you visually outline up to five sequential steps or logic paths, using colorful icons and editable text fields. Ideal for business workflows, strategic plans, or data flow maps. Fully compatible with PowerPoint, Keynote, and Google Slides.


4 slides
Event Planning and Calendar Timeline Presentation
Plan smarter, not harder! This sleek timeline infographic is perfect for keeping your event plans organized and on track. Whether you're managing a multi-day conference or a team schedule, this visual template makes deadlines and tasks crystal clear. Fully compatible with PowerPoint, Keynote, and Google Slides for seamless editing and presentation.


5 slides
Professional Business Proposal Presentation
Make your pitch stand out with a polished, minimal design that highlights every key stage of your business strategy. This clean visual layout is perfect for outlining project phases, services, or data-driven insights with clarity and impact. Fully compatible with PowerPoint, Keynote, and Google Slides for easy customization.


7 slides
Property Market Forecast and Trends Presentation
Present your real estate insights clearly with this Property Market Forecast and Trends Presentation. Featuring a central isometric house graphic surrounded by six editable segments, this layout is perfect for highlighting key indicators like market trends, pricing shifts, and investment zones. Use the icons and color-coded areas to enhance clarity. Ideal for housing reports and investor decks. Fully compatible with PowerPoint, Canva, Keynote, and Google Slides.


6 slides
Closing Summary and Key Takeaways Presentation
Wrap up your presentation with clarity using the Closing Summary and Key Takeaways Presentation. This slide features a semi-circular segmented layout, ideal for highlighting 3–5 final points, action steps, or reflections. Clean, modern, and easy to customize in PowerPoint, Keynote, Google Slides, or Canva—perfect for impactful conclusions.


6 slides
Modern Treatment Plans in Medicine Presentation
Highlight six key elements of your healthcare strategy with the Modern Treatment Plans in Medicine Presentation. This clean, grid-style layout uses pill-shaped icons and vibrant colors to present treatments, initiatives, or categories. Ideal for breaking down complex medical plans. Fully customizable in Canva, PowerPoint, Keynote, and Google Slides.


5 slides
Business and Personal Goal Planning Presentation
Align your vision with action using the Business and Personal Goal Planning slide. This clean, professional layout helps break down up to four key objectives using flag-themed visuals, customizable text blocks, and supportive icons. Perfect for comparing business goals with personal development targets in a single view. Fully editable in PowerPoint, Keynote, and Google Slides—ideal for team meetings, coaching sessions, or strategic planning.


5 slides
Business Activity Rotation Cycle Presentation
Showcase continuous workflows with the Business Activity Rotation Cycle Presentation. Ideal for operations, planning, and strategy meetings, this template visualizes multi-phase cycles with clean, editable layouts. Use it to outline repeated business functions, processes, or initiatives. Compatible with PowerPoint, Keynote, and Google Slides—perfect for consultants, teams, and business professionals.


20 slides
Pegasus Sales Forecast Presentation
This bold sales forecast template combines powerful visuals with a sleek design to highlight key performance metrics, competitive analysis, and pricing strategy. With sections for service overview, testimonials, promotions, and next steps, it’s ideal for impactful presentations. Compatible with PowerPoint, Keynote, and Google Slides, delivering your message has never been easier.


6 slides
Multiple Business Solutions Options Slide Presentation
Explore diverse strategies with the Multiple Business Solutions Options Slide Presentation. Featuring a vertical stack of labeled briefcases (A–F), this slide is designed to compare and communicate multiple business ideas, solutions, or pathways in a clear, structured layout. Ideal for pitching product variations, workflow choices, or market entry tactics. Each option is paired with customizable text fields for added clarity. Compatible with PowerPoint, Keynote, and Google Slides for easy editing and integration into your existing decks.


21 slides
Oneiros Project Timeline Presentation
Effectively communicate your project's progress, goals, and milestones with this professional timeline presentation. Cover key areas such as objectives, resource allocation, stakeholder analysis, and risk management to keep your team aligned. Fully customizable and compatible with PowerPoint, Keynote, and Google Slides.


21 slides
Kelpie Project Timeline Presentation
This sleek project plan template is perfect for outlining deliverables, timeline, budget breakdown, and risk management. Its modern design ensures clarity and professionalism, making it ideal for team or business presentations. Compatible with PowerPoint, Keynote, and Google Slides, it offers flexibility and ease for showcasing your project's key elements.


5 slides
Modern Home Layout Slides Presentation
Give your design ideas a modern edge with this clean, architectural presentation. Perfect for showcasing home layouts, interior concepts, or real estate projects, it combines structure and creativity to keep viewers engaged. Fully customizable and compatible with PowerPoint, Keynote, and Google Slides for effortless editing and professional delivery.


22 slides
Nebulark Advertising Agency Proposal Presentation
An engaging proposal template designed for advertising agencies to showcase services, strategy, and client success stories. Features sections for mission, market analysis, creative processes, and partnership opportunities. Fully customizable and compatible with PowerPoint, Keynote, and Google Slides to craft compelling pitches and win over potential clients.