


Features
- 6 Unique slides
- Fully editable and easy to edit in Microsoft Powerpoint, Keynote and Google Slides
- 16:9 widescreen layout
- Clean and professional designs
- Export to JPG, PDF or send by email


Do you have any questions?
Recommend


7 slides
Annual Summary Infographic
Revitalize your year-end reports with our expertly designed Infographic Templates! Tailored for professionals keen on showcasing annual achievements and insights, this collection offers a dynamic array of layouts that cater to varied presentation needs. From streamlined bar graphs and intricate circle diagrams to engaging icon lists, these templates are engineered to translate complex annual data into digestible, visually appealing content. Customize colors, fonts, and text to mirror your organization’s branding, ensuring a consistent and professional appearance across all communications. Compatible with PowerPoint, Google Slides, and Keynote, our templates simplify the creation of presentations that not only inform but inspire. Ideal for executives, team leaders, and marketers, these templates are indispensable tools for illustrating yearly progress, highlighting significant outcomes, and strategizing for future success. Enhance your professional presentations and make your annual summary not just seen, but remembered.


10 slides
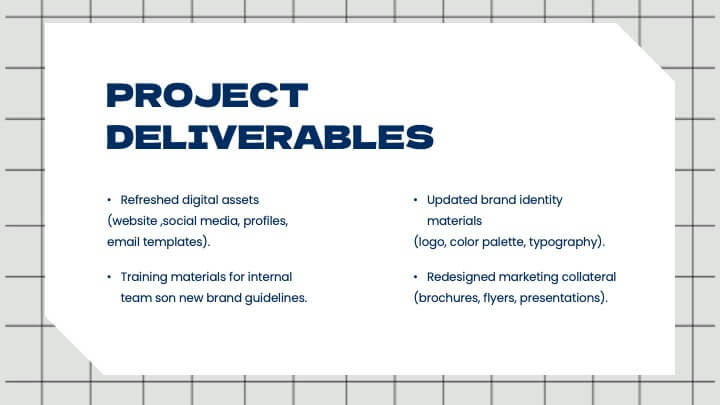
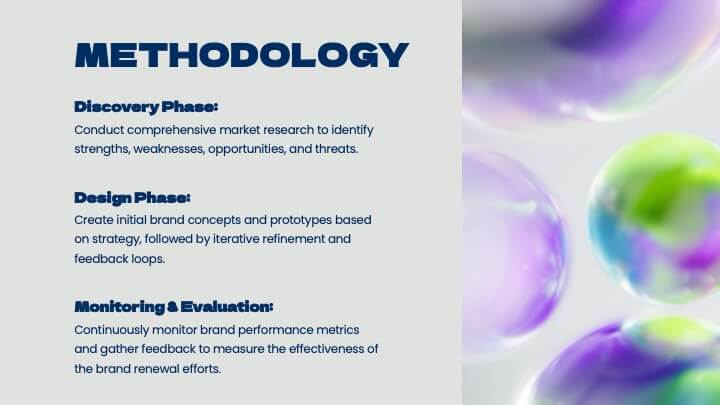
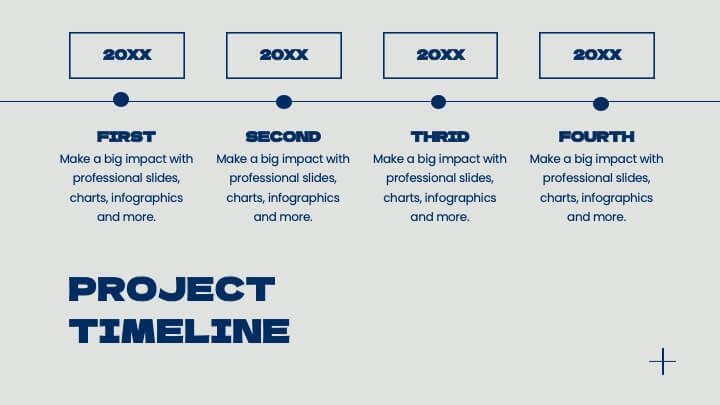
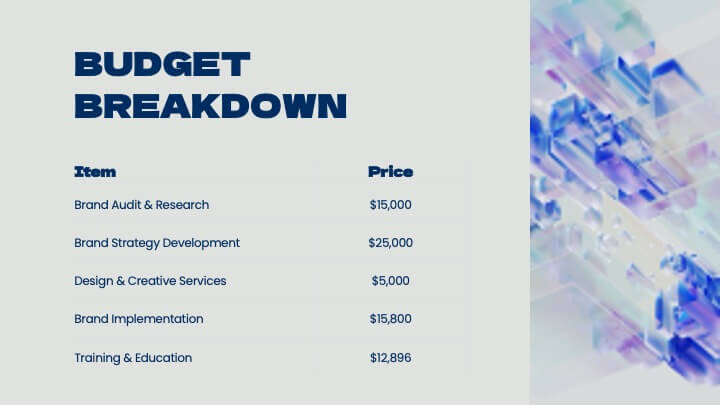
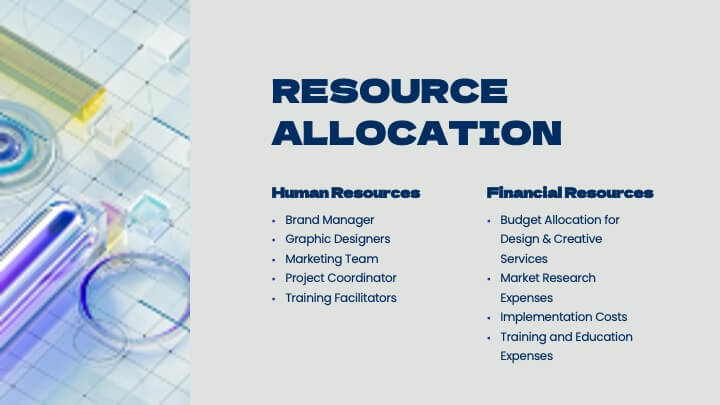
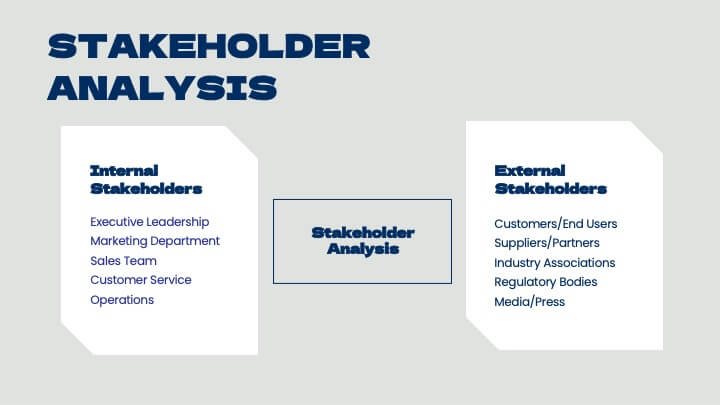
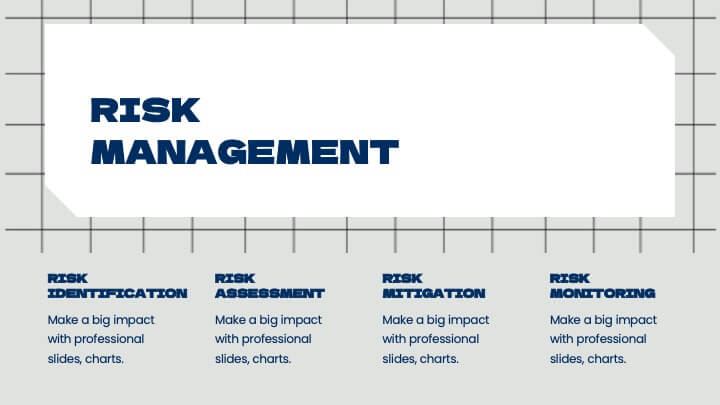
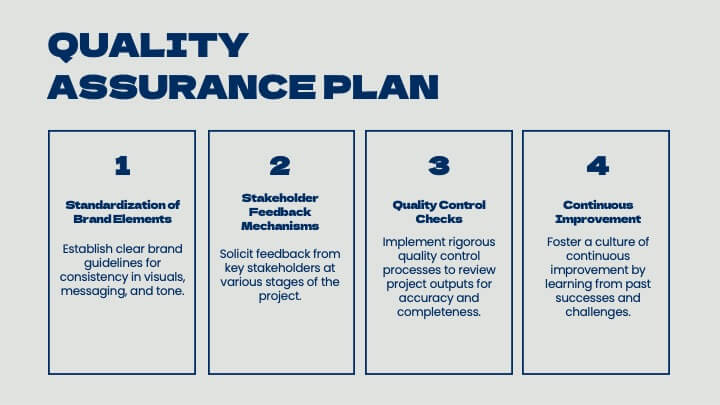
Brand Loyalty and Customer Retention Presentation
Strengthen your brand’s relationship with your audience using the "Brand Loyalty and Customer Retention" presentation template. This design effectively illustrates how strong branding strategies enhance customer loyalty and retention rates. Ideal for marketers and business strategists, this template is fully compatible with PowerPoint, Keynote, and Google Slides, making it perfect for presentations aimed at improving customer engagement and business growth.


7 slides
PESTEL Analysis Marketing Infographic
PESTEL Analysis, often referred to as PESTLE Analysis, is a strategic management tool used to analyze and evaluate external macro-environmental factors that can impact an organization. This infographic template is a comprehensive and visually captivating template that unravels the strategic insights derived from the PESTEL analysis in the realm of marketing. Explore the critical external factors that influence your marketing strategy and steer your business towards success. Compatible with Powerpoint, Keynote, and Google Slides. Empower your marketing strategies with our PESTEL Analysis Marketing Infographic!


8 slides
Training and Development Onboarding Presentation
Streamline the training and development process for new hires with a structured onboarding funnel. This Training and Development Onboarding template provides a clear, step-by-step visualization of how employees progress through the learning process. Perfect for HR managers, trainers, and corporate educators. Fully editable and compatible with PowerPoint, Keynote, and Google Slides for easy customization.


7 slides
Matrix System Diagram Infographic
A matrix diagram is a visual representation of data in a matrix format, commonly used to analyze the relationships between two or more sets of items. This infographic template is a valuable tool in various fields including business, project management, quality management, and decision-making processes. Compatible with Powerpoint, Keynote, and Google Slides. This is designed to help you present intricate relationships, structures, and data in a clear and visually engaging way. Whether you're illustrating business strategies, decision matrices, or organizational hierarchies, this template simplifies complexity.


5 slides
Digital Marketing Plan Presentation
Build momentum for your online strategy with a clean, structured layout that turns complex ideas into clear, stackable steps. This presentation helps outline goals, channels, and campaign actions in a visual flow that’s easy to follow and adapt. Fully customizable for PowerPoint, Keynote, and Google Slides.


4 slides
Customer Persona Slide Presentation
Bring your audience closer to your ideal customer with this clean, visual layout designed for clarity and storytelling. Perfect for marketing, branding, and strategy presentations, it helps you highlight key traits, motivations, and insights with ease. Fully compatible with PowerPoint, Keynote, and Google Slides for effortless customization.


7 slides
6 Steps Circle Diagram
Streamline complex processes with our "6 Steps Circle Diagram" template. This visually appealing infographic elegantly organizes interconnected stages in a circular layout, ideal for outlining workflows, development cycles, or project phases. Each segment is color-coded and provides ample space for detailed descriptions, enhancing the clarity and effectiveness of presentations. This format allows viewers to easily grasp relationships and dependencies, improving comprehension and retention. Perfect for educators, project managers, and business analysts, this template ensures that all stages are interconnected and clearly communicated. Compatible with PowerPoint, Keynote, and Google Slides, it's a versatile tool for professional and educational environments.


7 slides
Buyer Infographic
Discover the power of visual storytelling with our dynamic Infographic Template, designed to bring the buyer's journey to life in full color and engaging detail! Each slide is a palette of opportunity, with bold hues and intuitive layouts that transform standard data into a compelling narrative. This template is a marketer’s dream, perfect for delineating complex buyer behaviors, demographics, and decision processes in an easily digestible format. It leverages striking graphics and concise text to illuminate key insights that drive consumer actions, making it indispensable for presentations, reports, or online content. Customize to your heart’s content, adjusting colors, fonts, and layouts to align perfectly with your branding. Whether you're detailing market trends, consumer feedback, or purchase patterns, this template ensures your data not only informs but also inspires. Ideal for strategists, sales teams, and marketers, it's your secret weapon in crafting stories that not only tell but also sell.


7 slides
Tables of Content Samples Infographic Presentation
A Table of Content is an essential tool that improves the accessibility and organization of a document or book, and enhances its overall professionalism. This table of contents template is an excellent way to organize your information. This template is fully editable, which allows you to easily change colors and fonts, and add or delete components from the design. The slides are designed to be easily updated with new information, allowing you to keep the presentation fresh and up-to-date. Each template has a high quality design that is compatible with powerpoint, Keynote and Google Slides.


26 slides
Haeleigh Presentation Template
The Haeleigh Powerpoint Template is a 26 modern slide template that is perfect for any presentation. With a clean classy aesthetic and easy to read text, this template is ideal for reading content and looking professional. The use of nude colors helps keep the look clean and easy to read. The theme comes packed with features to target your audience and help you get your message across. The charts, graphics, timelines included are easy to edit. This template is also perfect for businesses seeking to make an impression on their audience. Haeleigh is mobile friendly and easy to navigate.


3 slides
Agile Workflow and Team Roles Presentation
Visualize team roles, responsibilities, and task flow using this agile loop diagram. Ideal for Scrum teams, project managers, and product owners. Clearly outline percentages, priorities, and stages in the process. Fully editable in PowerPoint, Keynote, and Google Slides—perfect for training, team updates, or workflow overviews.


5 slides
Body System Overview Presentation
Visually explain key human body systems with this clean and modern slide. Each section highlights a different organ with labeled points (A–D) for easy reference. Ideal for health education, medical briefings, or anatomy lessons. Fully editable in PowerPoint, Keynote, or Google Slides to suit any professional or academic need.


2 slides
Target Audience and Persona Development Presentation
Bring your audience straight into the heart of your ideal customer with a vibrant, story-focused slide that highlights goals, motivations, data insights, and key pain points. This presentation makes it easy to communicate who you’re targeting and why it matters. Fully compatible with PowerPoint, Keynote, and Google Slides.


7 slides
Thank You Card Infographic
Celebrate the art of gratitude with this sophisticated collection, perfectly blending contemporary design with a personal touch. Each layout is crafted with aesthetic finesse, featuring subtle color palettes, elegant typography, and thoughtful placement of visual elements that enhance the warmth of your message. Offering a variety of designs from minimalist to richly textured backgrounds, this collection provides a unique backdrop for expressing thanks. Customize these cards for any occasion, whether it's professional gratitude towards colleagues and clients, or personal appreciation for friends and family. Ideal for both digital expressions and printed notes, this set ensures your message of thanks is received with the sentiment it’s intended. It’s a wonderful way to convey appreciation and leave a memorable impression on its recipients.


21 slides
Minoan Project Timeline Presentation
Step back in time with this beautifully crafted Minoan-inspired presentation, perfect for outlining your project timeline! With an elegant design and clear structure, this template helps you showcase key milestones, deadlines, and deliverables in a visually stunning way. Keep your project on track. Compatible with PowerPoint, Keynote, and Google Slides.


7 slides
Cause and Consequence Bowtie Model Presentation
Turn complex risks into clear, visual logic with a balanced, intuitive diagram that connects causes to consequences. This presentation is perfect for showcasing preventive and corrective actions in business or project management. Fully customizable and compatible with PowerPoint, Keynote, and Google Slides for a professional, data-driven approach.