


Features
- 6 Unique slides
- Fully editable and easy to edit in Microsoft Powerpoint, Keynote and Google Slides
- 16:9 widescreen layout
- Clean and professional designs
- Export to JPG, PDF or send by email


Do you have any questions?
Recommend


7 slides
Cyber Security Infographic Presentation Template
Cybersecurity helps protect your business from cybercrime and unauthorized access to data. It is a crucial step to safeguard your business from malicious attacks that can lead to confidential data being stolen, as well as loss of revenue through fraudulent transactions. With this template you can ensure that you and your business are well informed on the importance of cybersecurity. This template will provide you with a good starting point to create a cybersecurity strategy. This template includes illustrations on goals, benefits, limitations and recommendations based on your audience's needs.


4 slides
Property Listing and Comparison Presentation
A sleek, modern way to spotlight property details comes to life in this clean presentation design, making comparisons feel effortless and engaging. It clearly organizes features, differences, and key selling points so audiences can make informed decisions fast. Fully editable and easy to use, this presentation works seamlessly in PowerPoint, Keynote, and Google Slides.


21 slides
Ionforge Startup Pitch Deck Presentation
Impress investors and showcase your startup's potential with this structured pitch deck! It covers key areas like market analysis, business model, value proposition, and financial overview, ensuring a complete story of your growth plan. Perfect for startup presentations and funding pitches, this template is fully compatible with PowerPoint, Keynote, and Google Slides.


10 slides
SEO and Social Media Marketing Presentation
Shine a spotlight on your brand’s digital growth with this bold and professional layout designed to showcase analytics, engagement, and SEO strategies. Ideal for marketers, strategists, and agencies, it transforms data into visuals that persuade and inform. Fully compatible with PowerPoint, Keynote, and Google Slides for easy editing.


20 slides
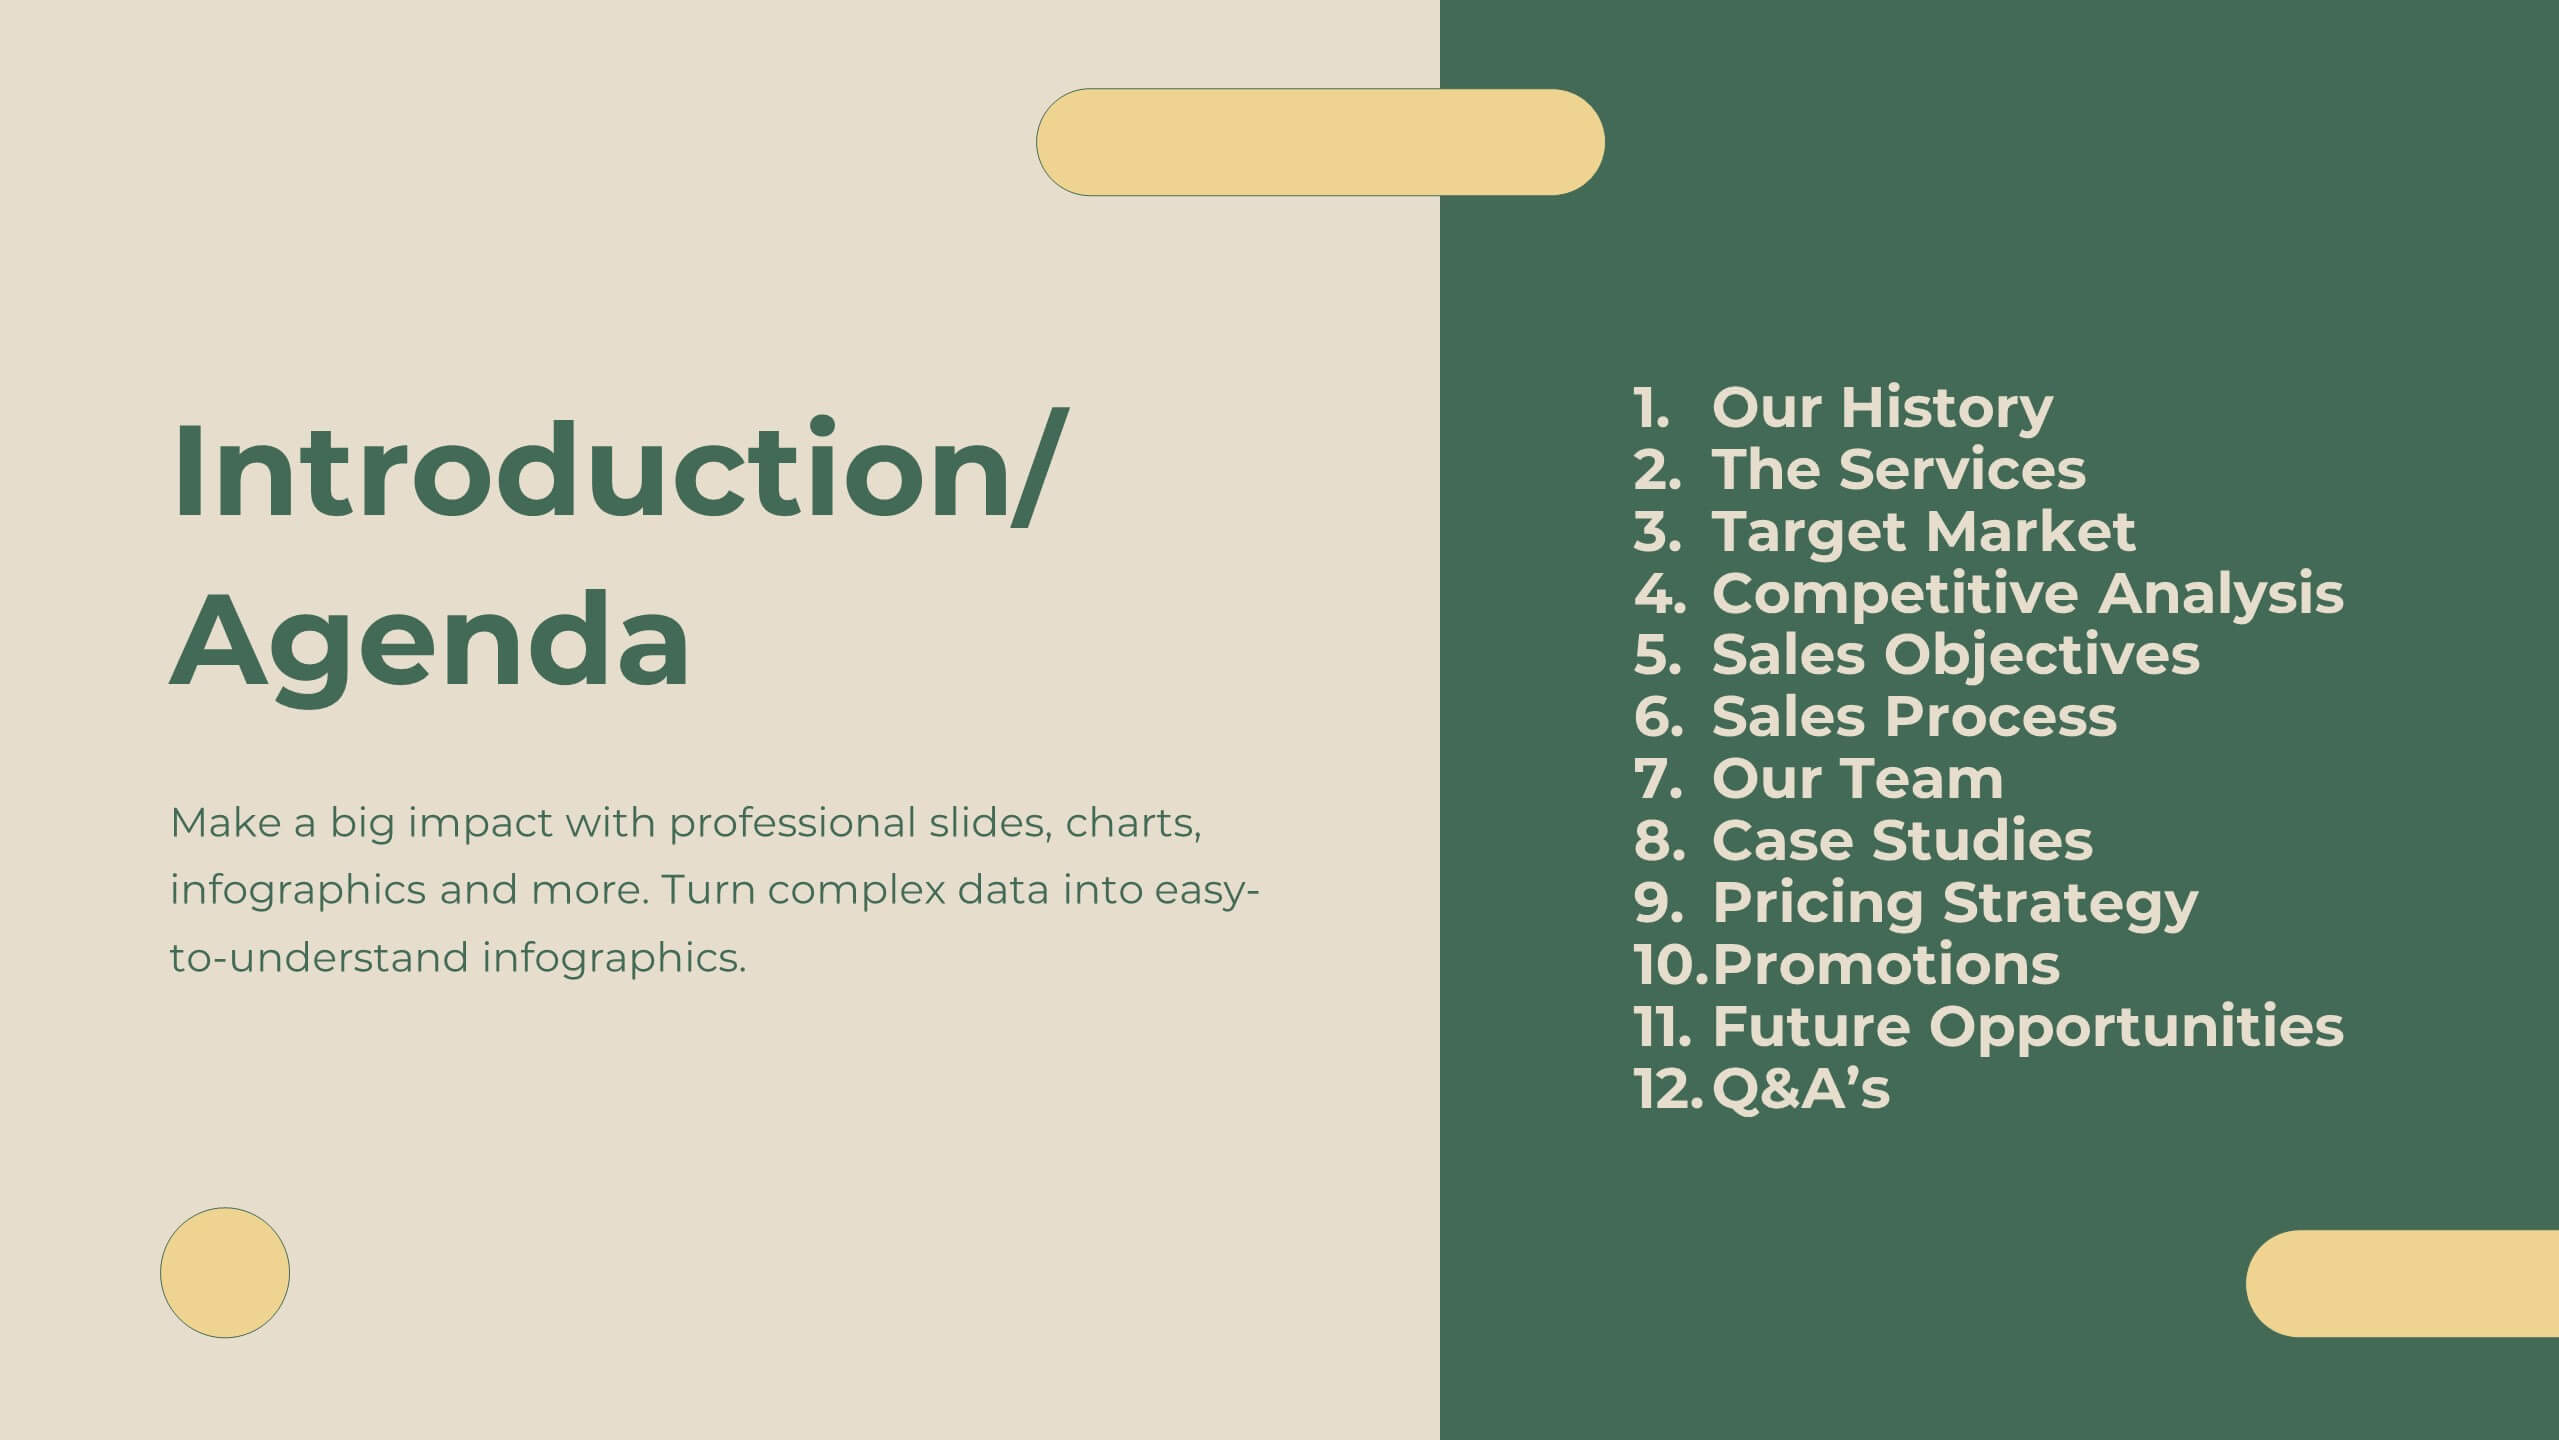
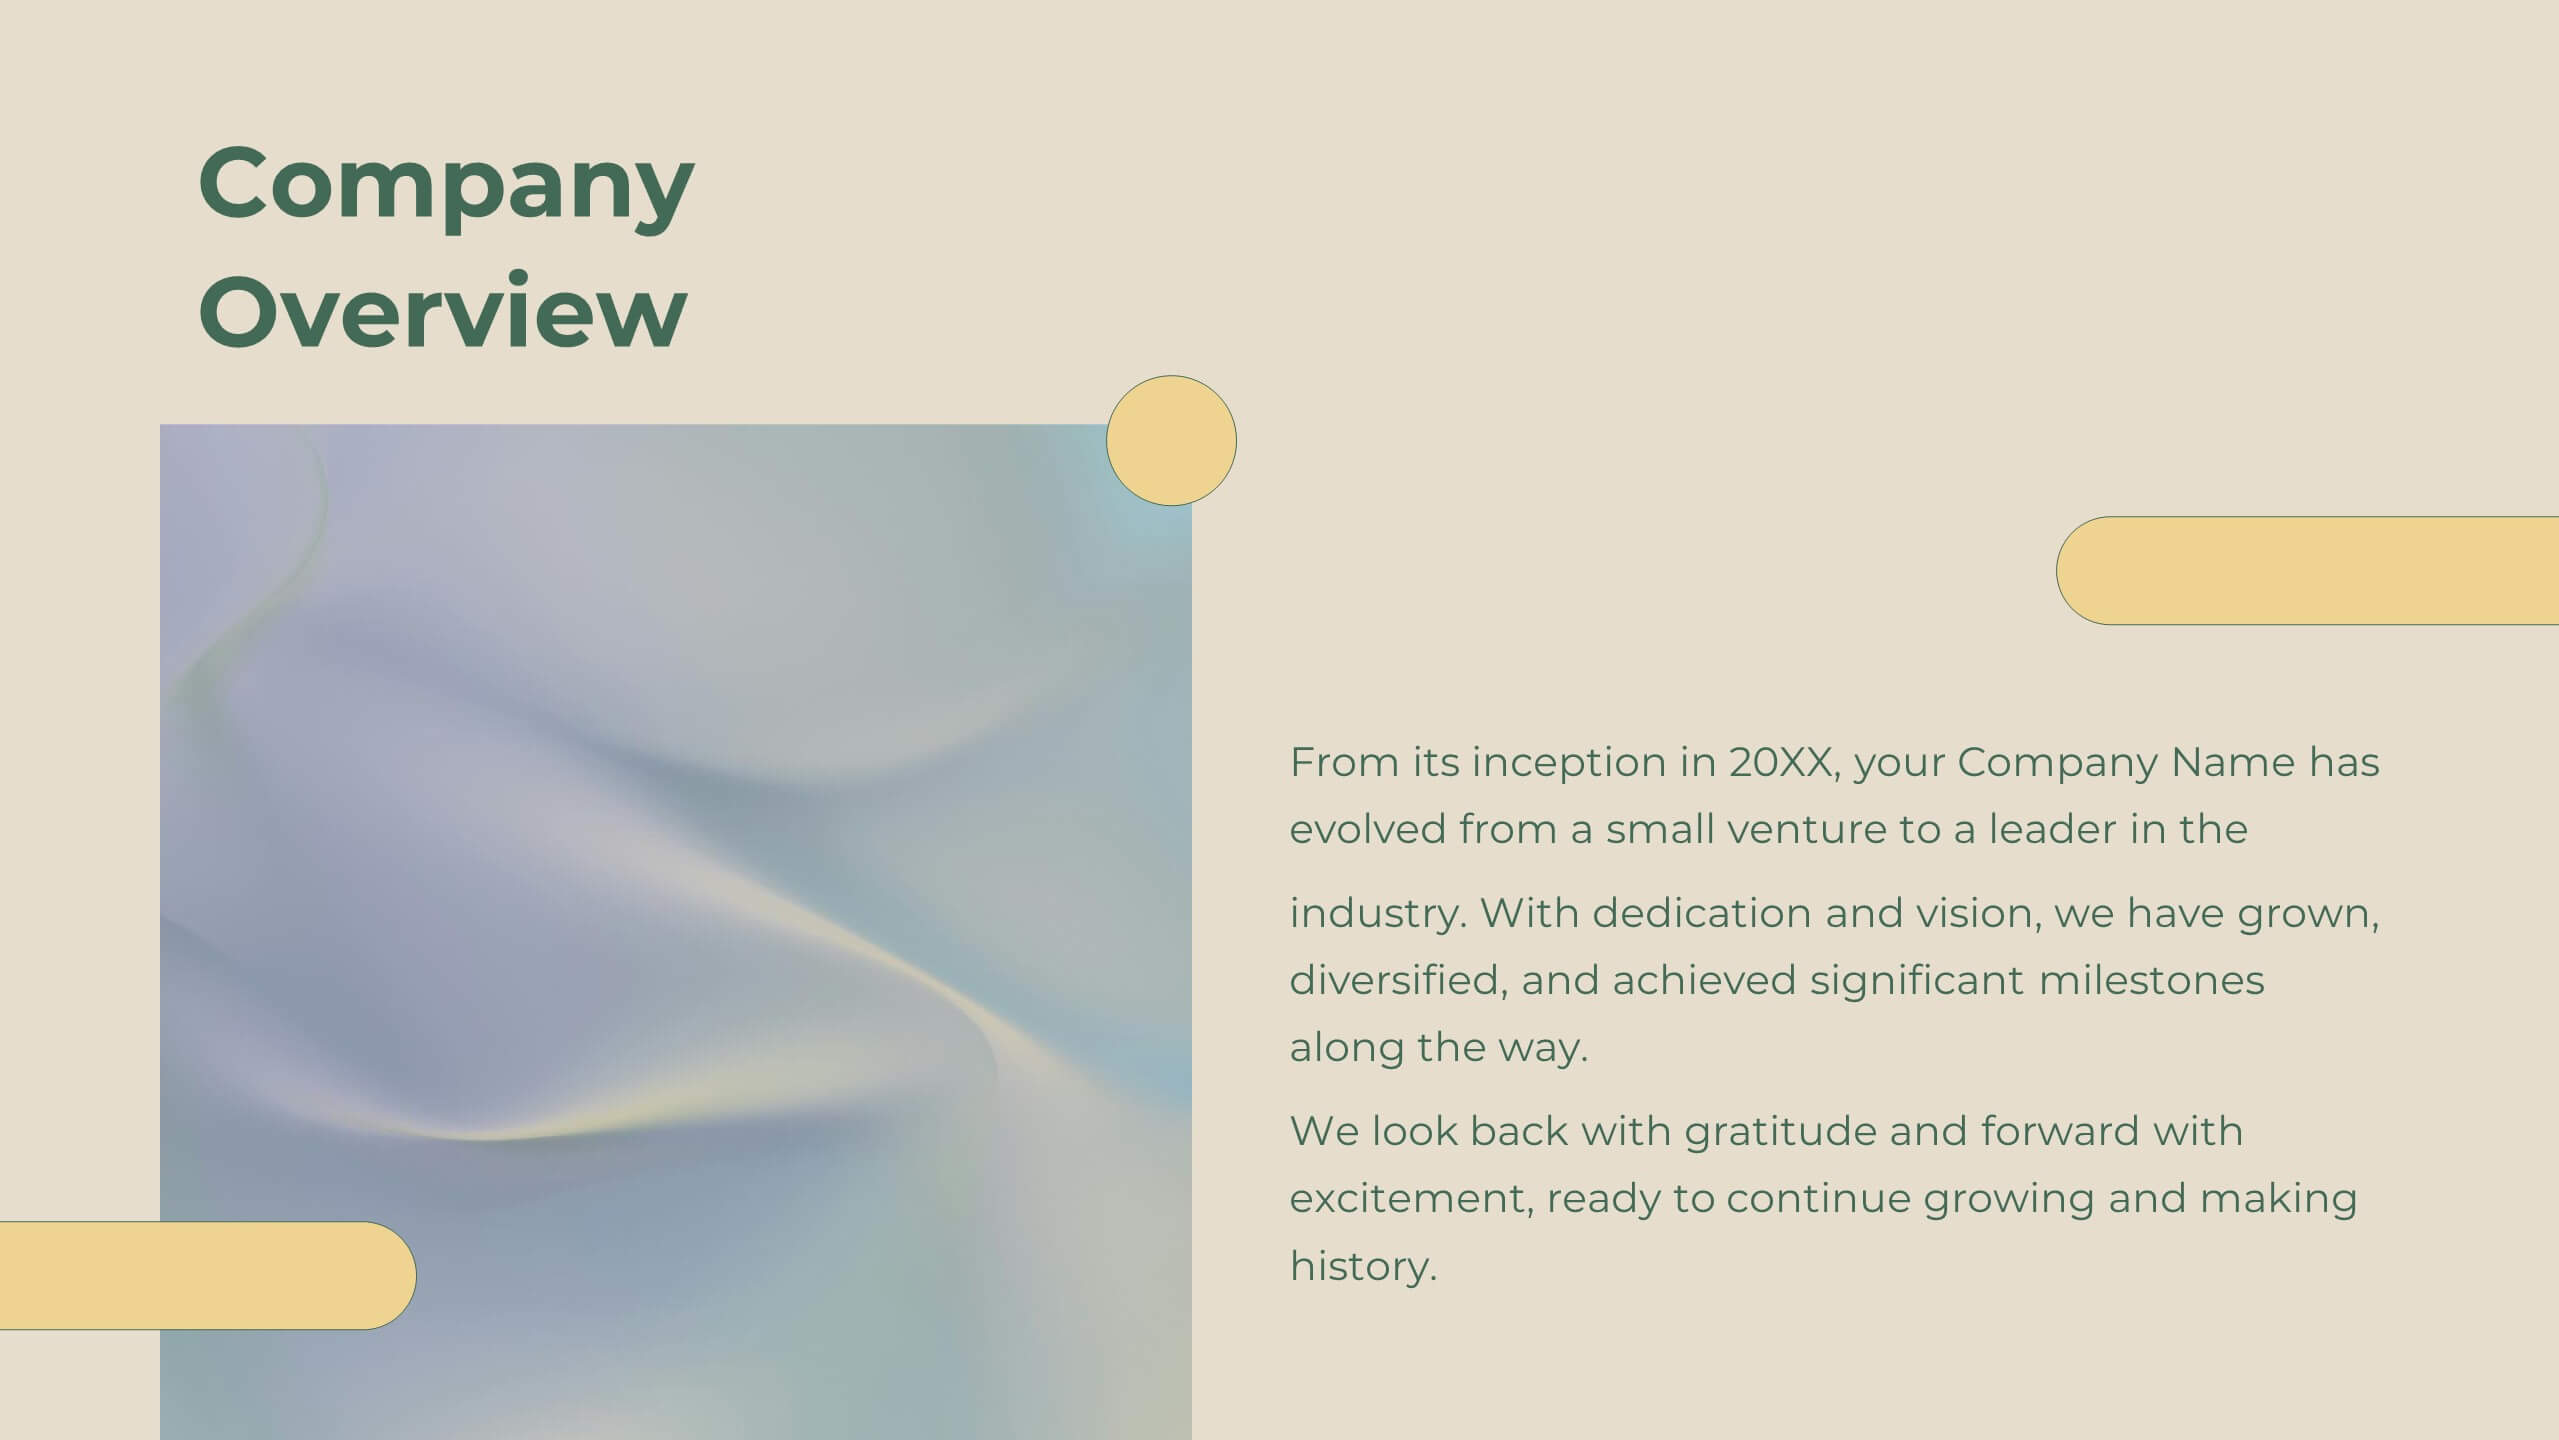
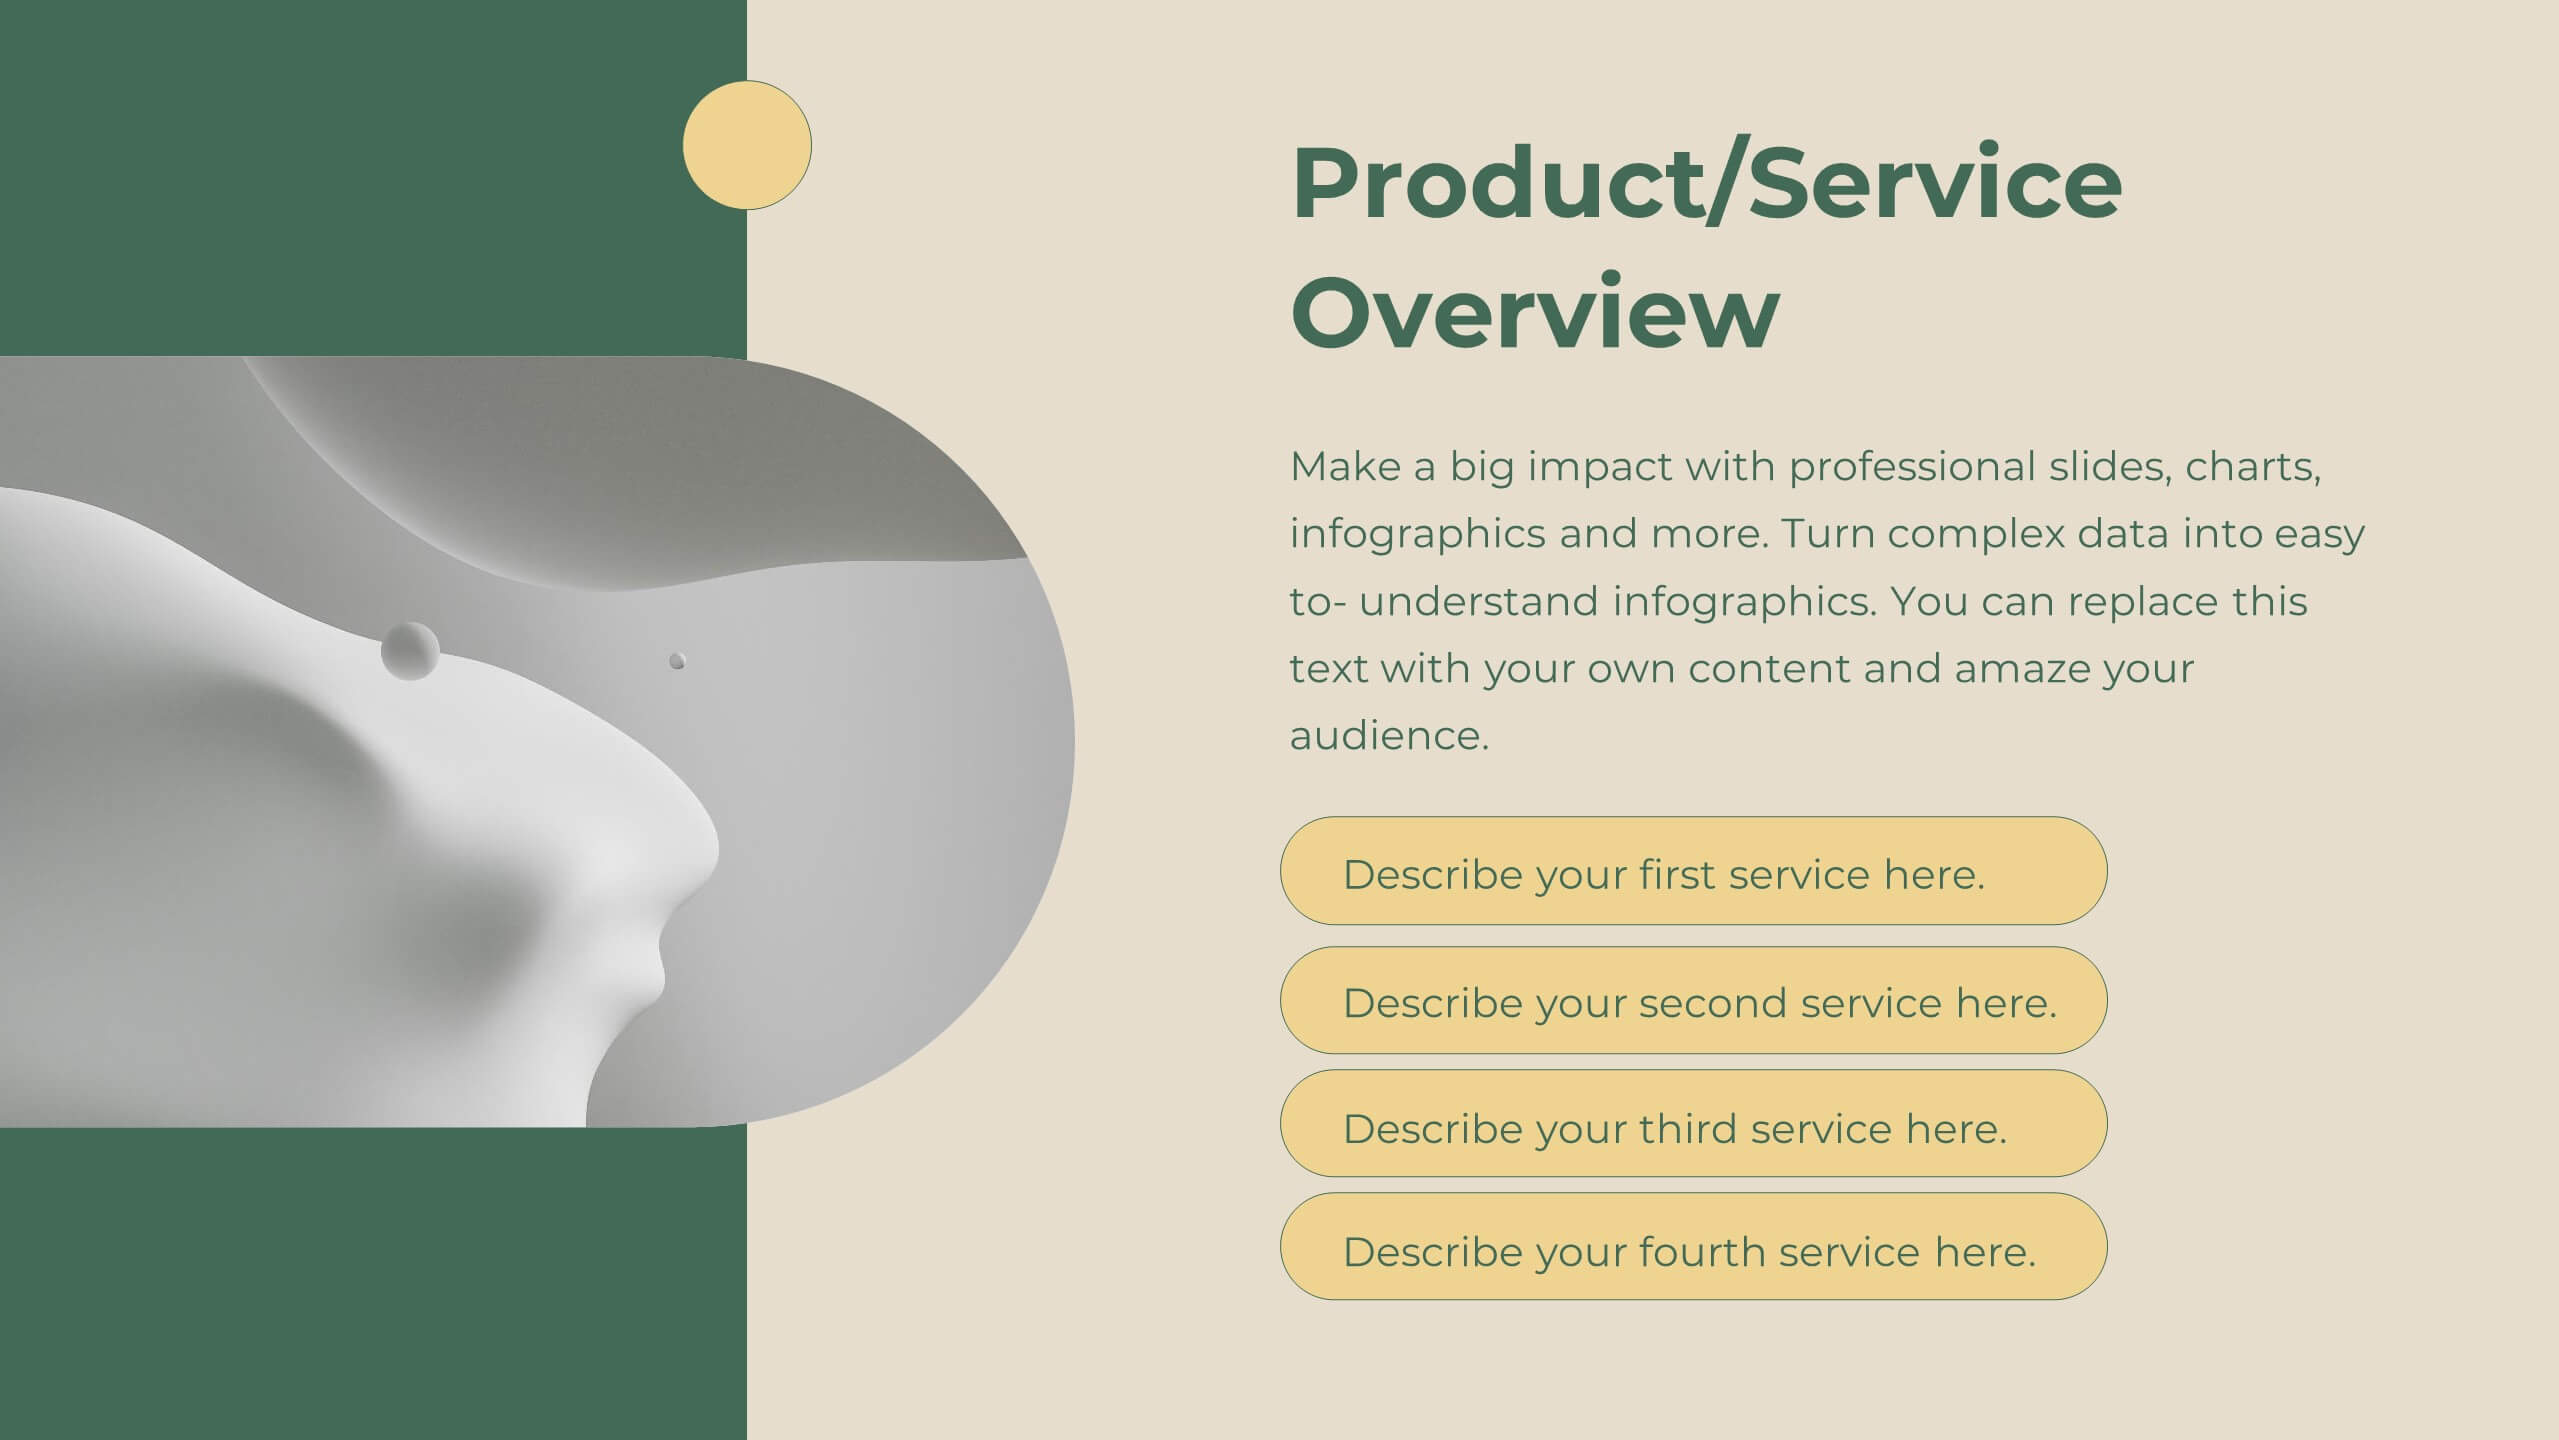
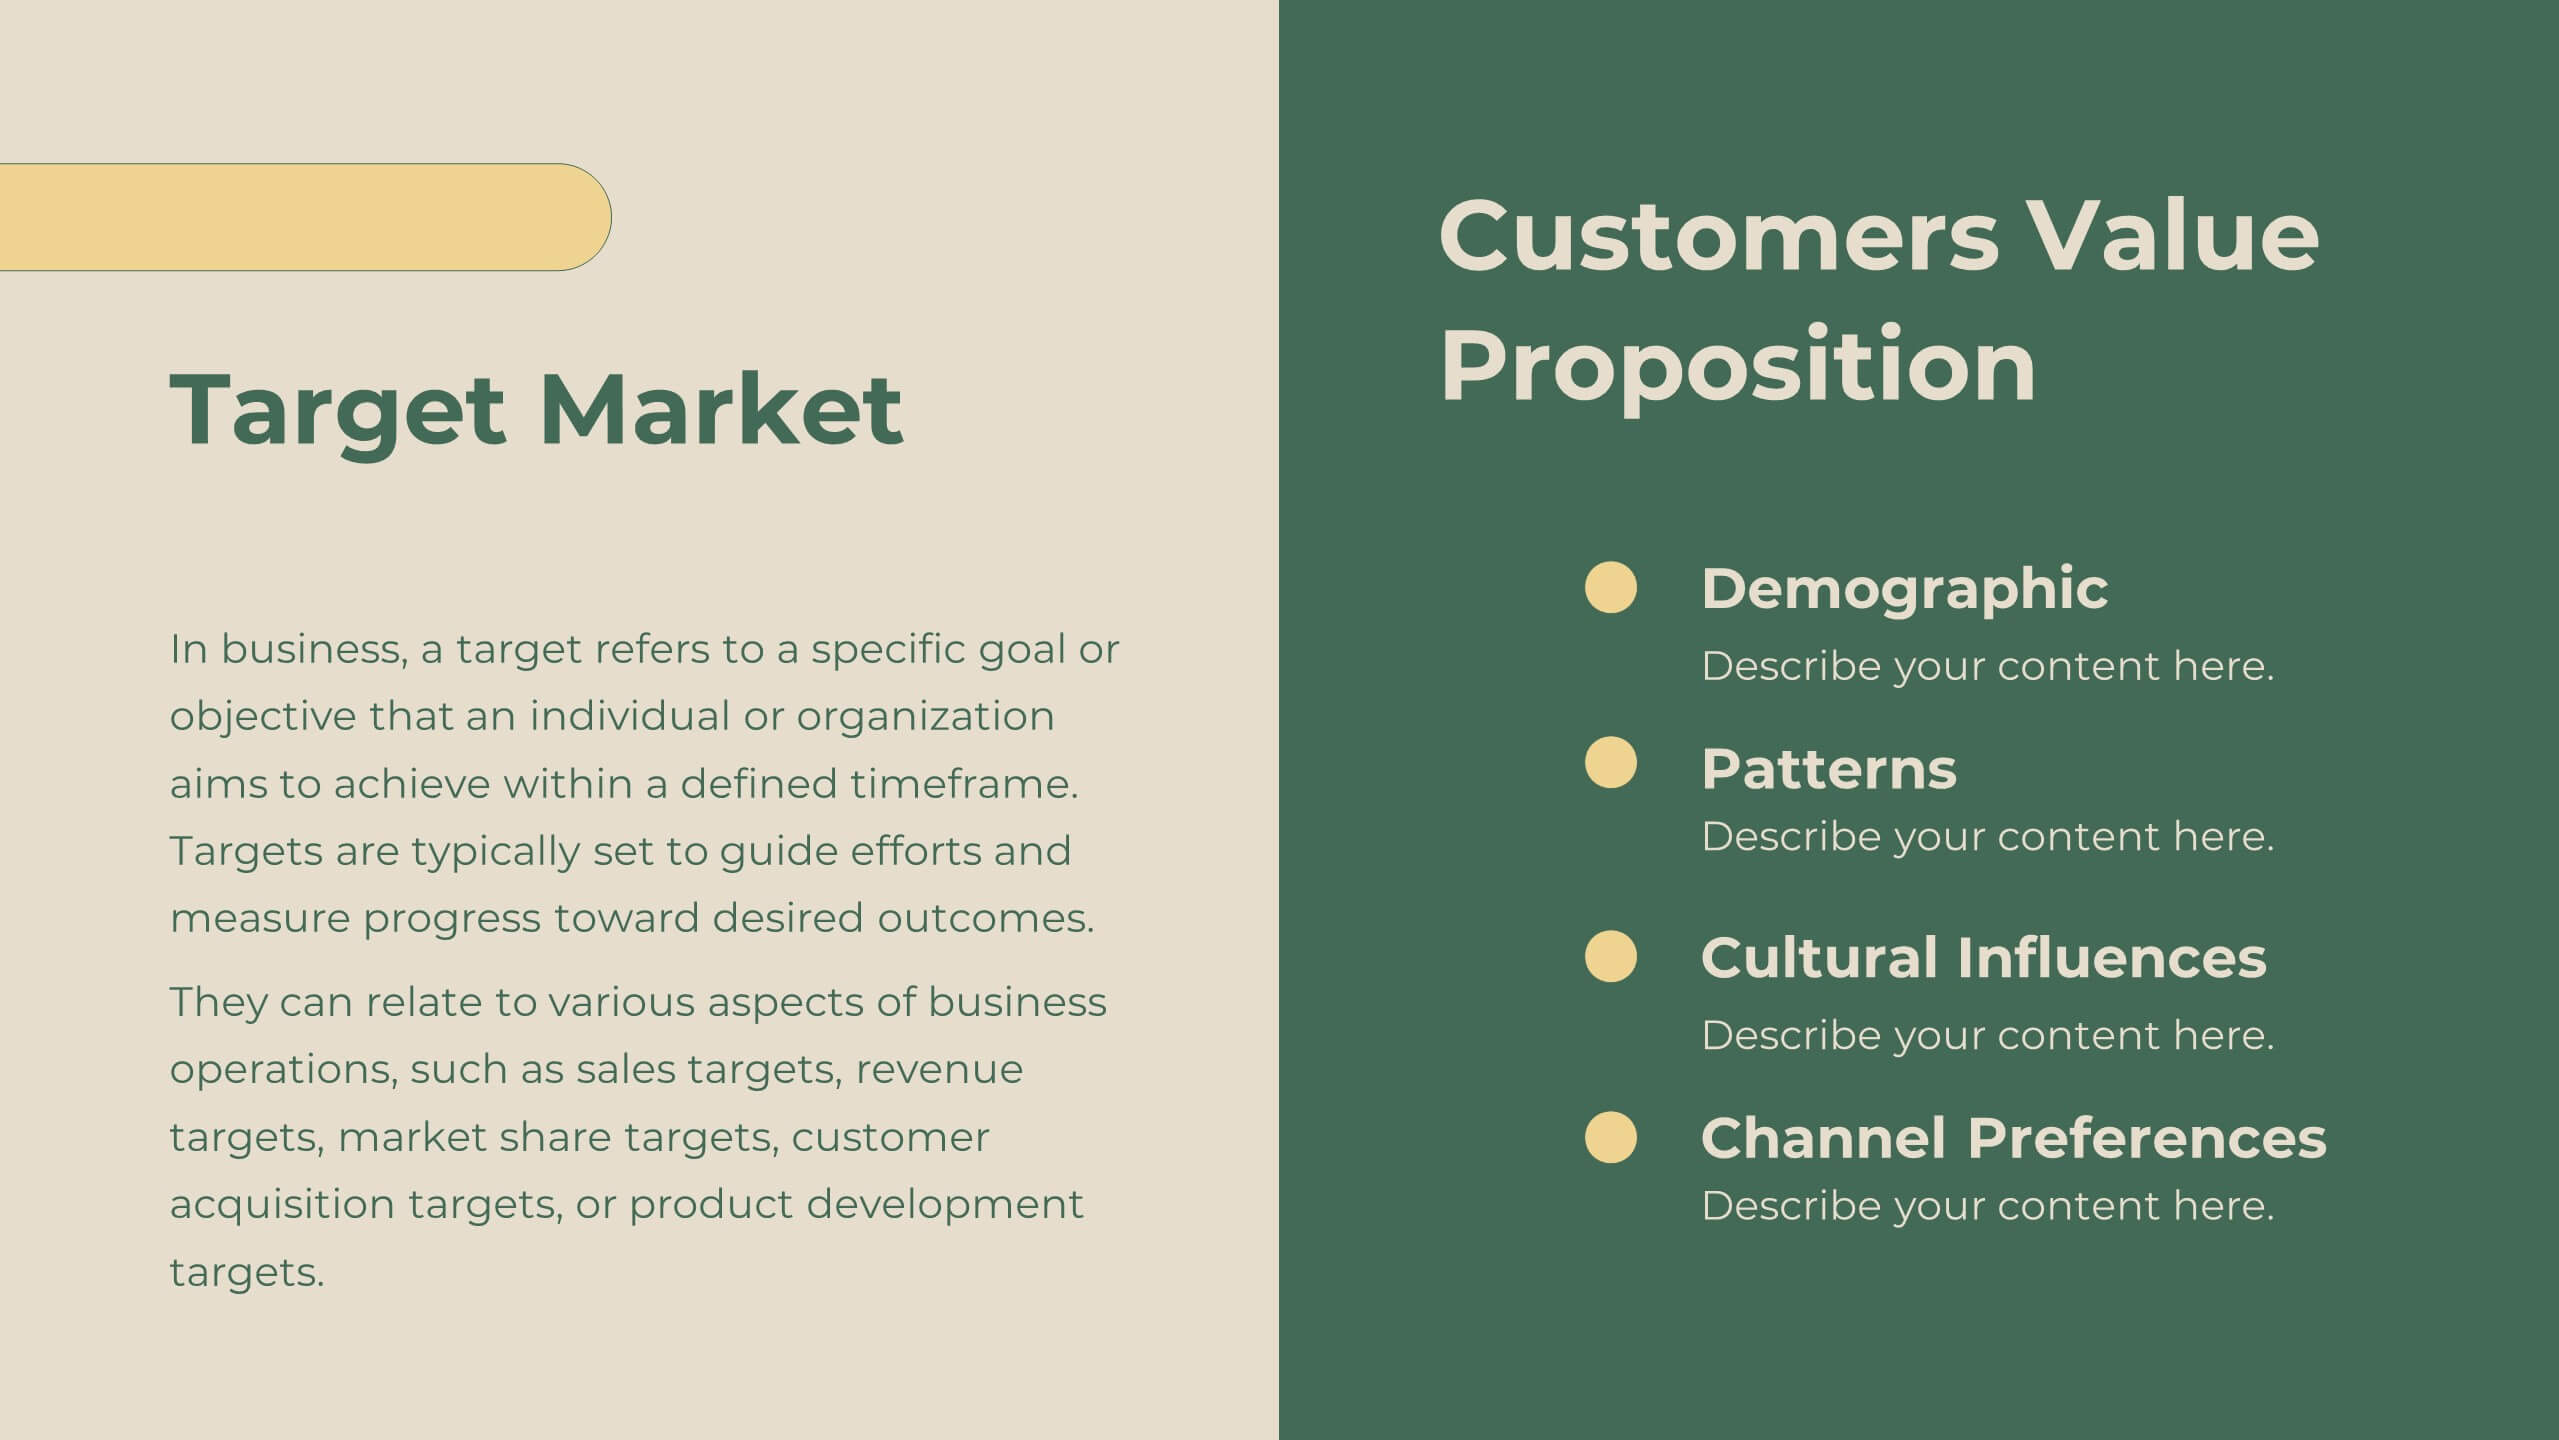
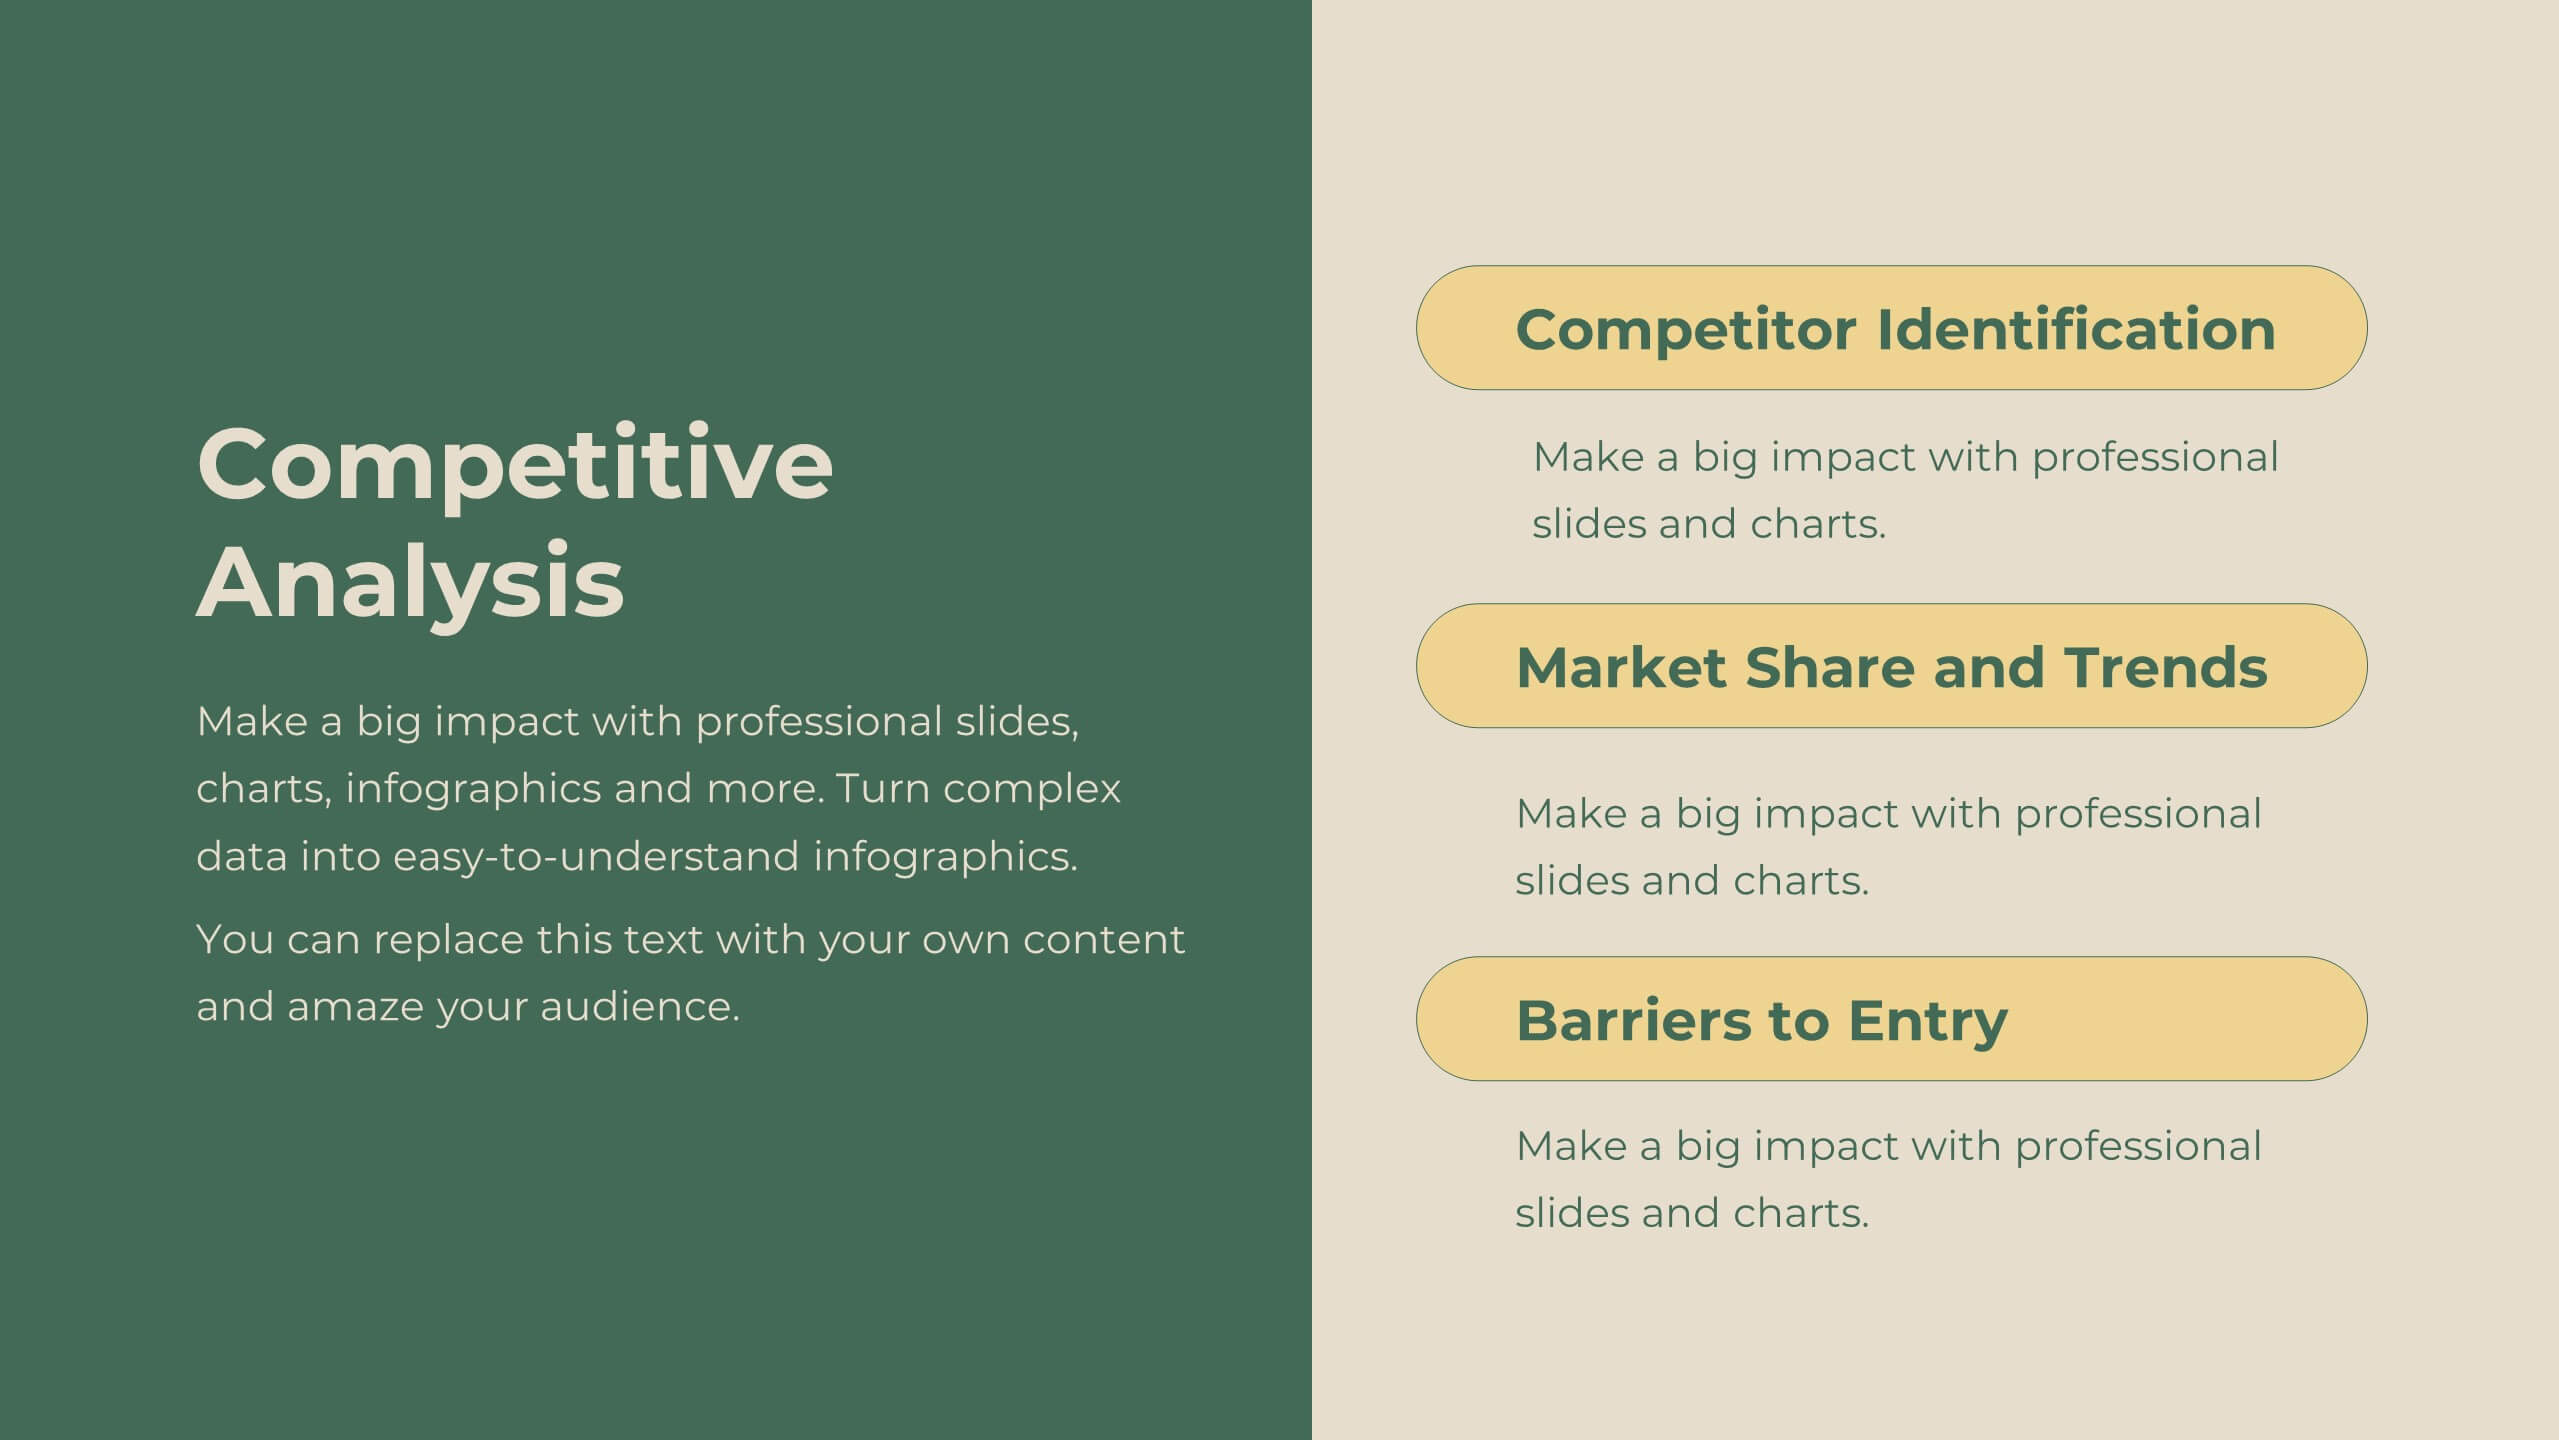
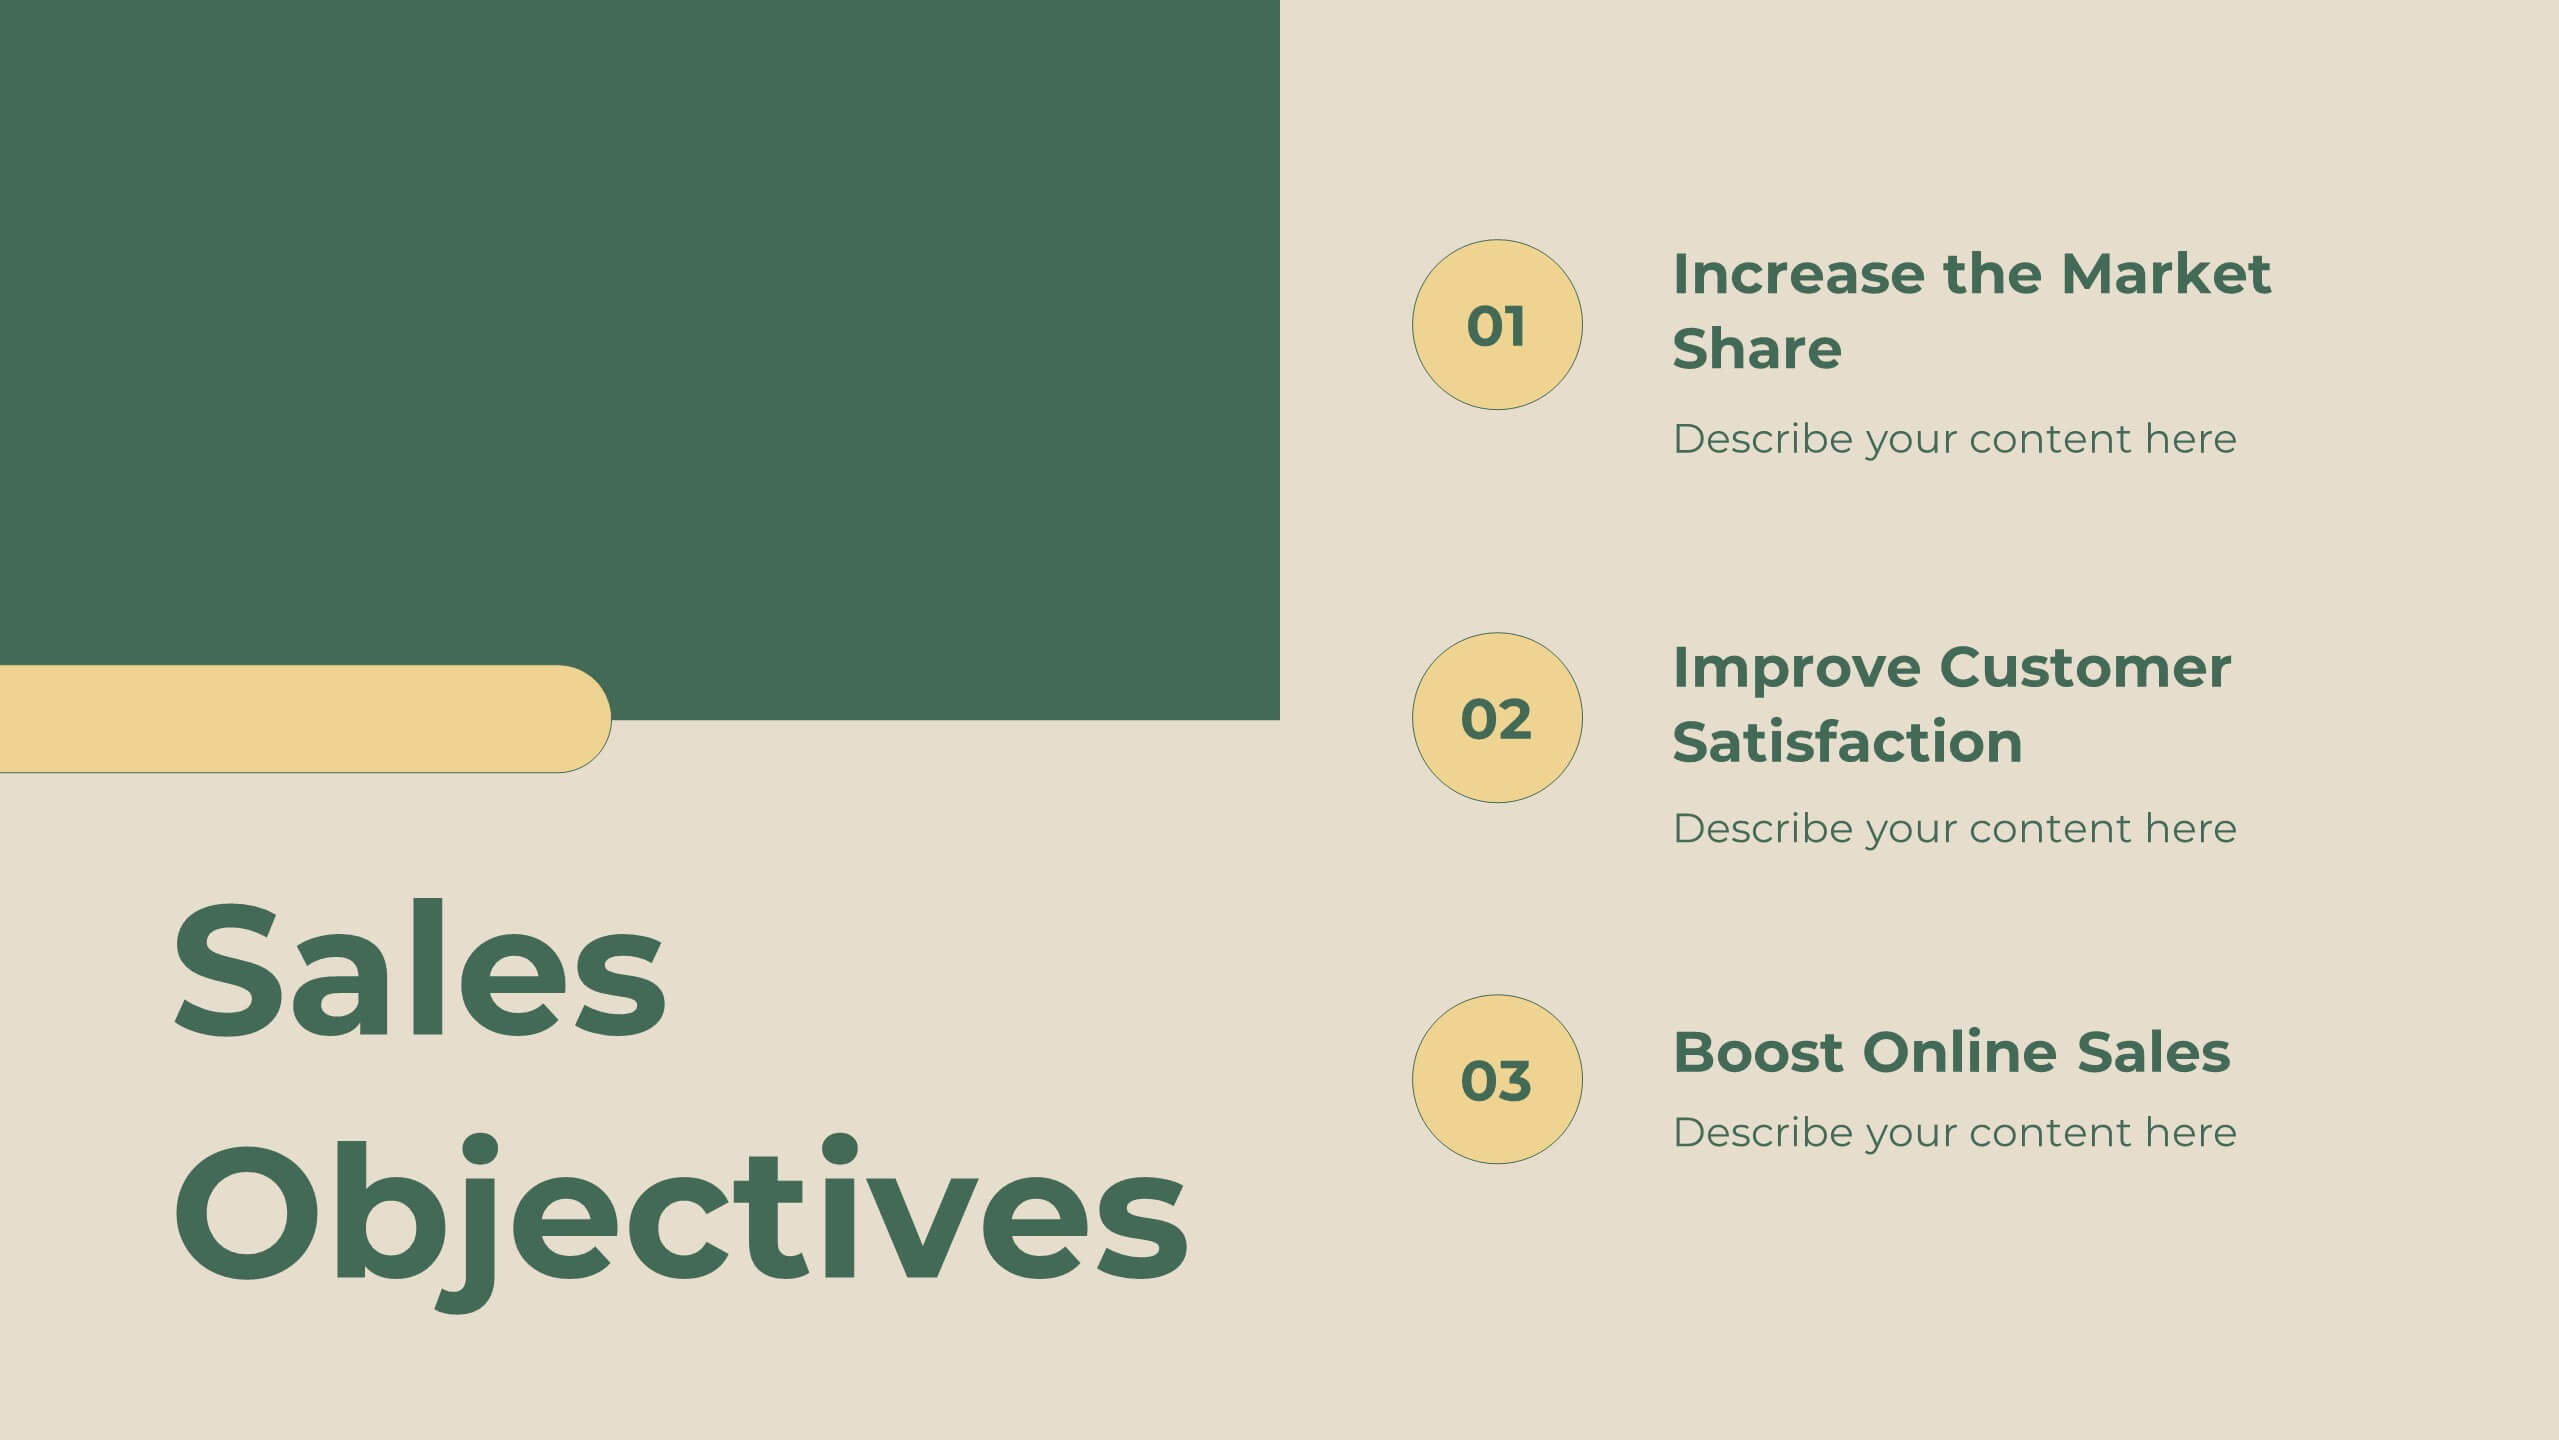
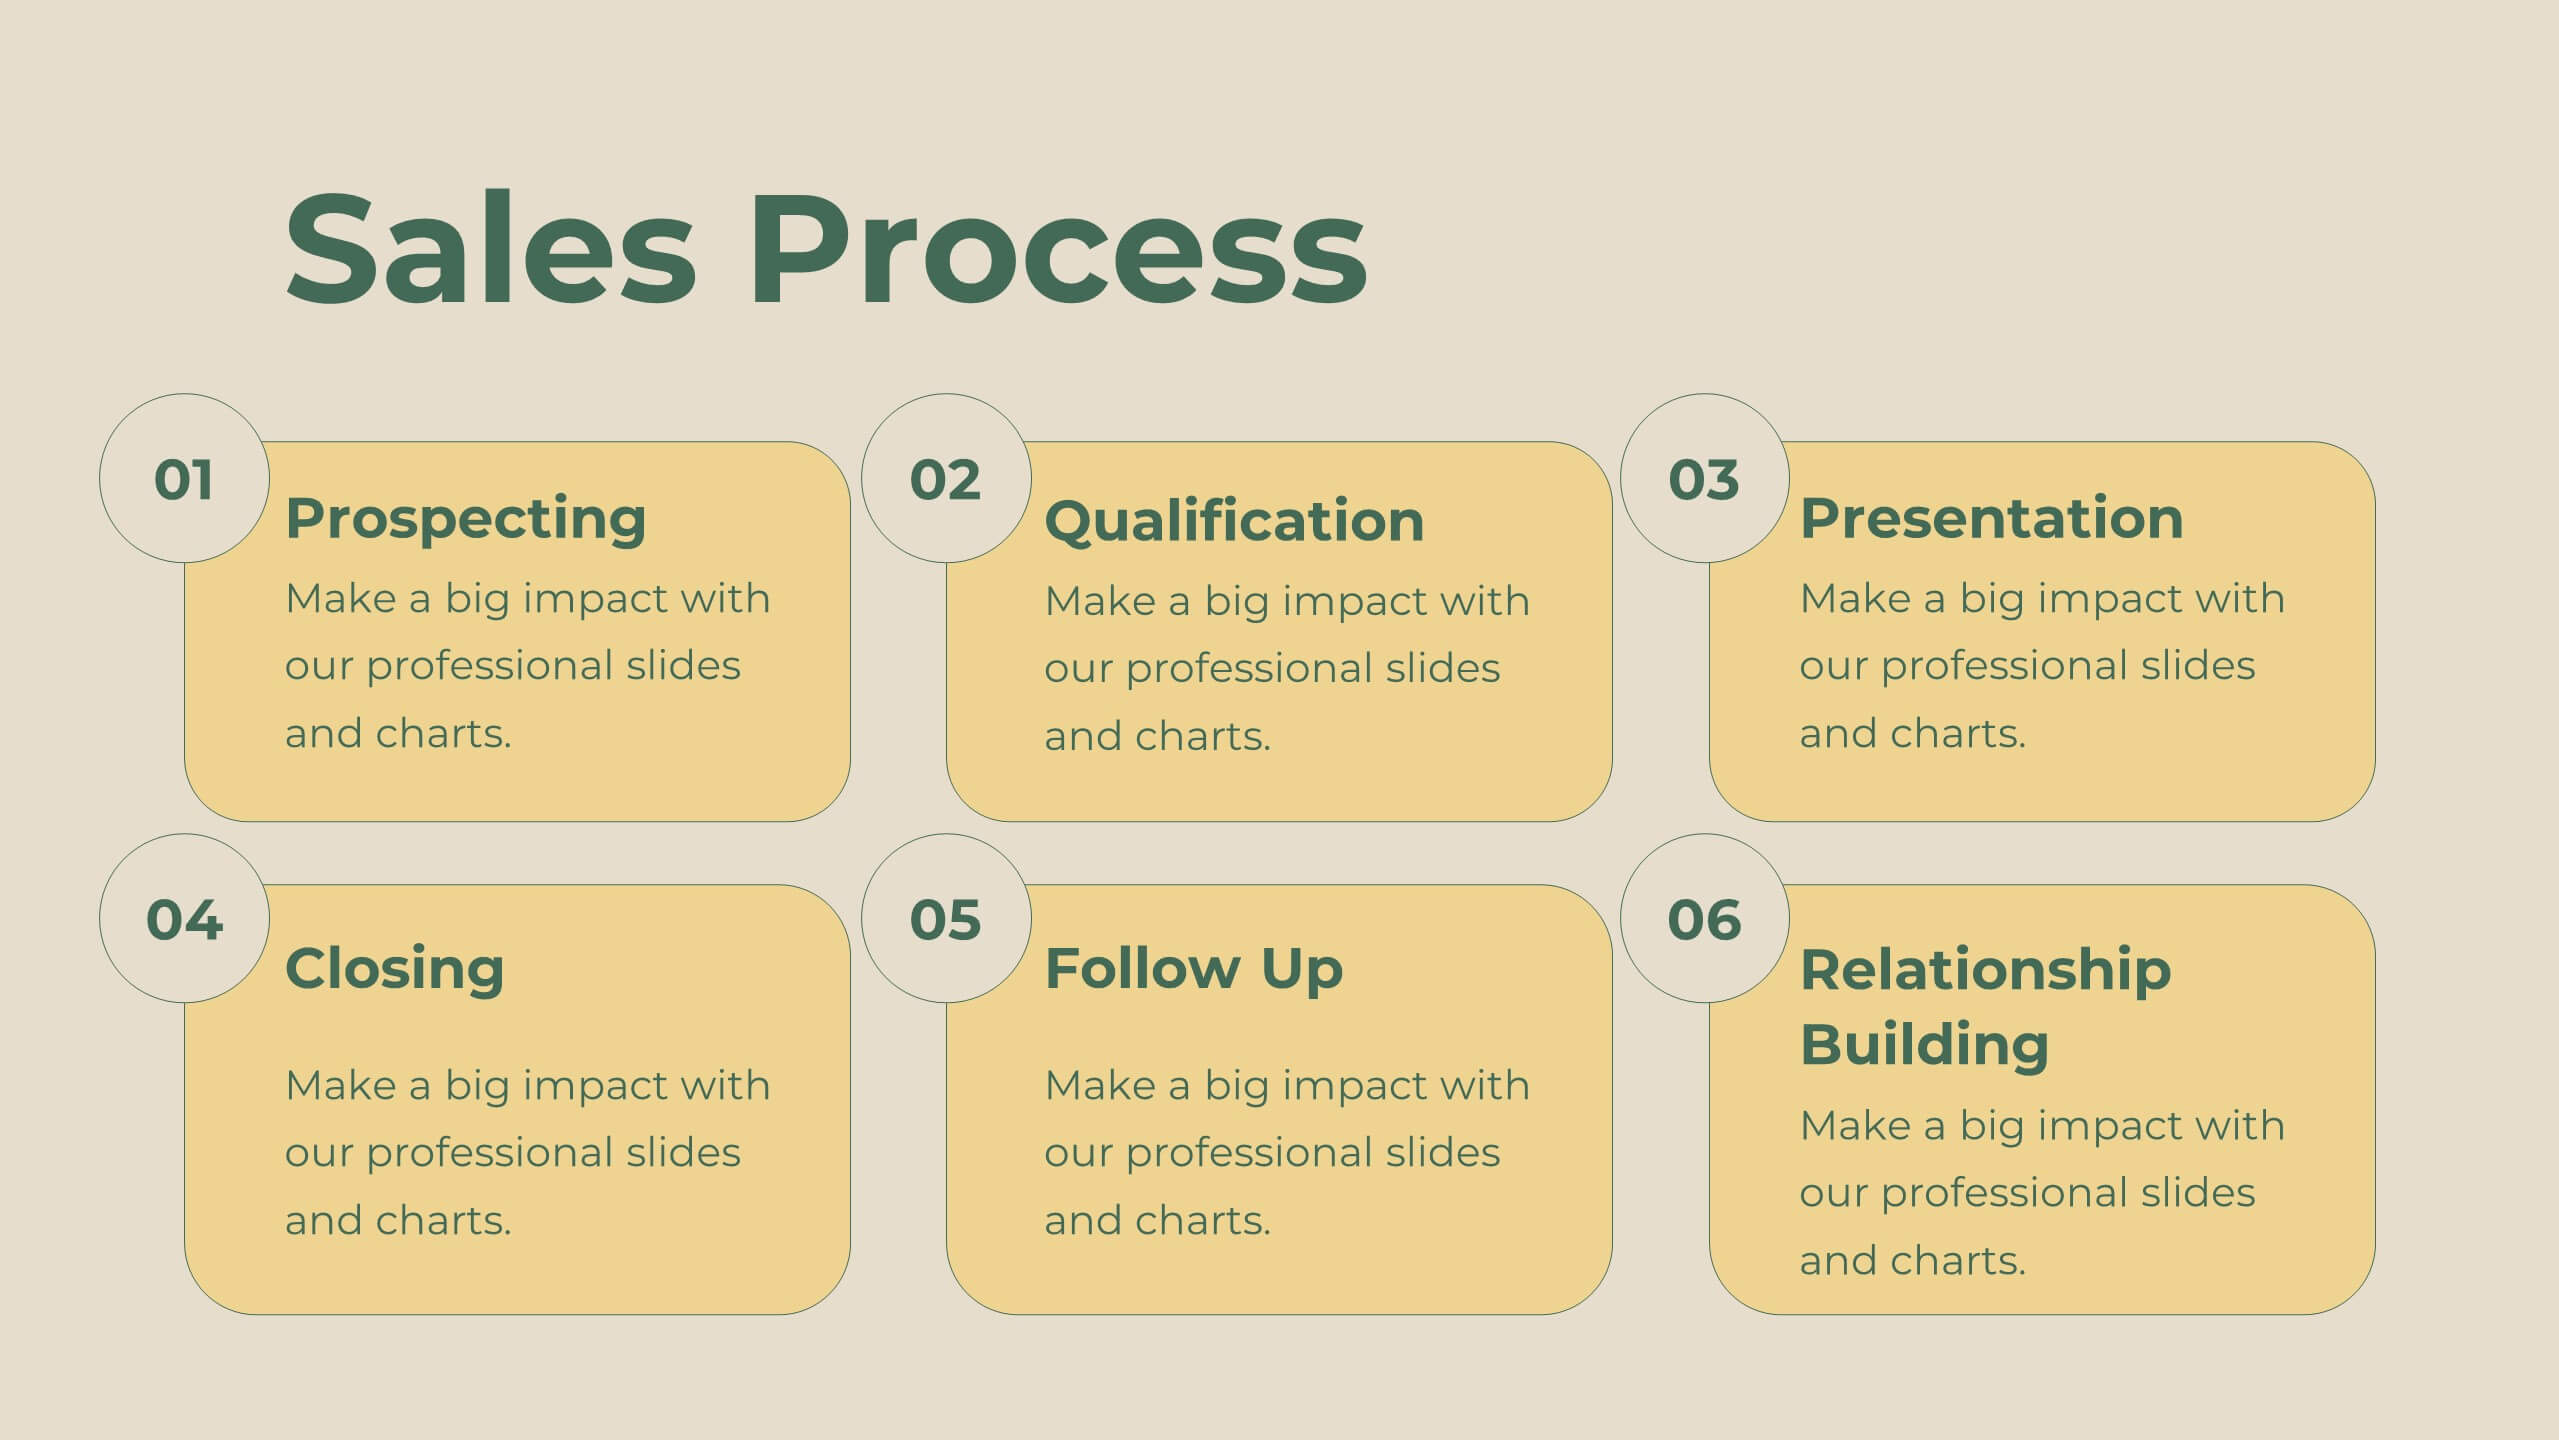
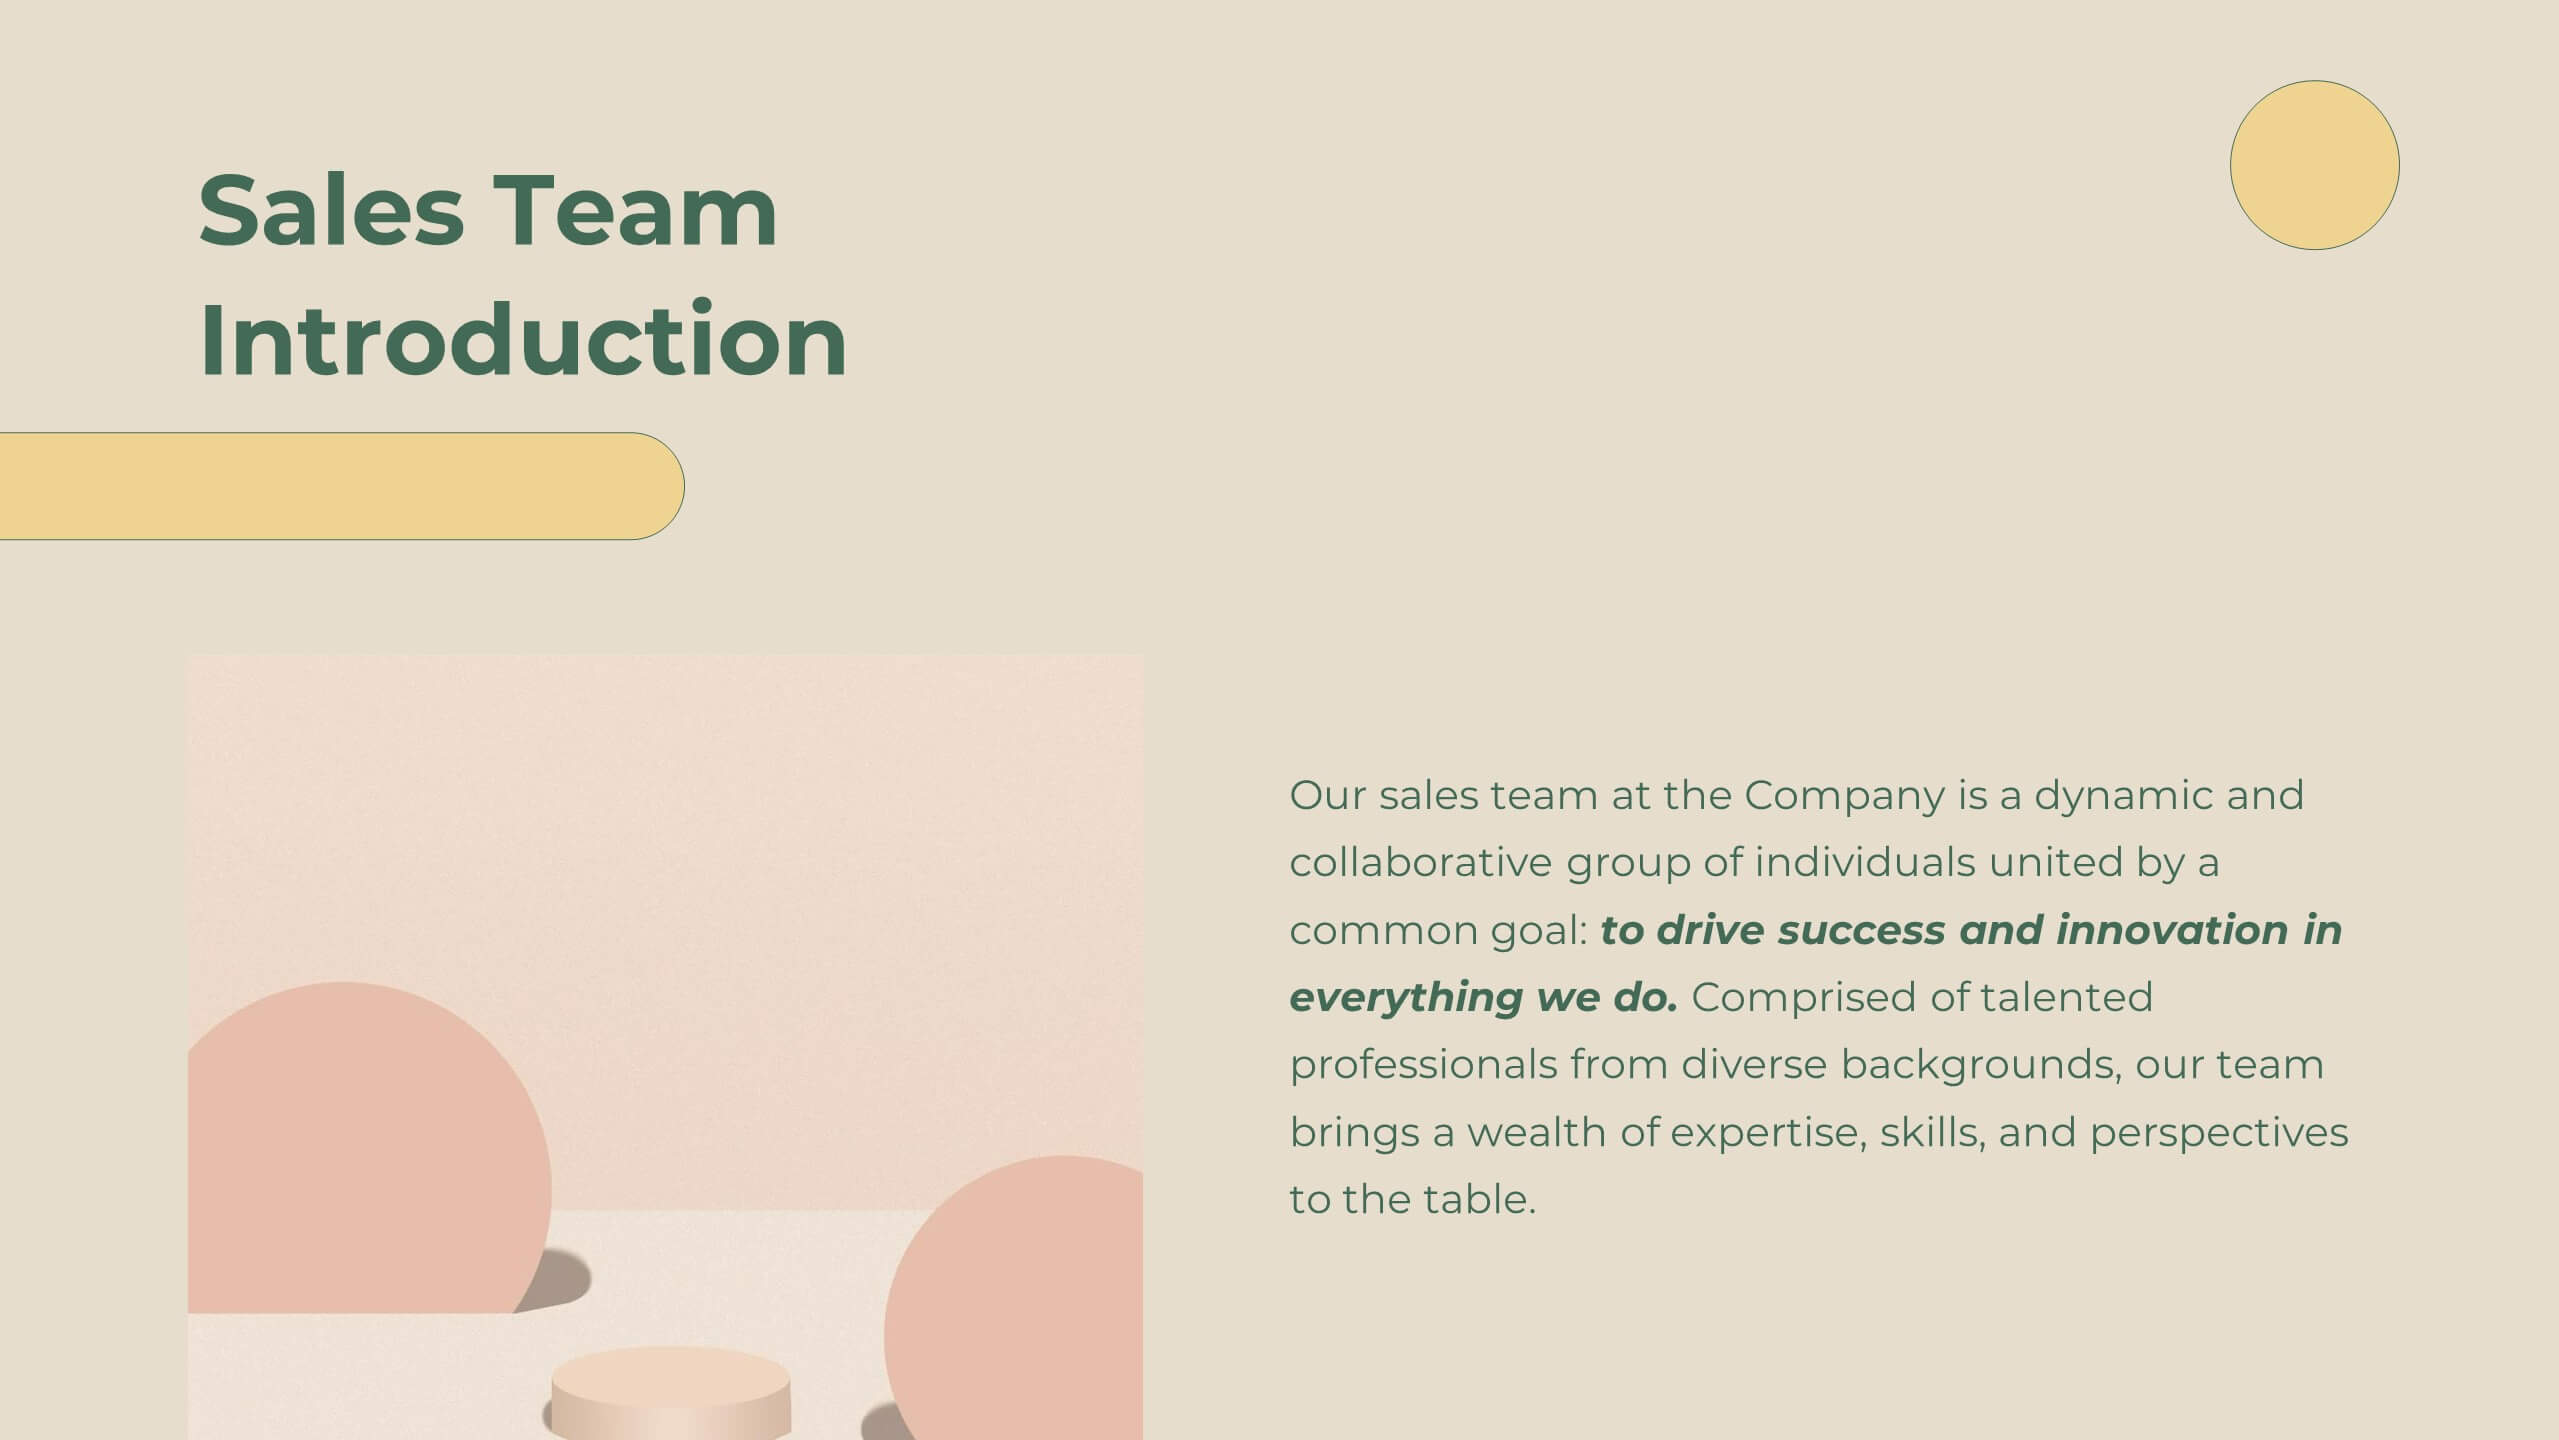
Legacy Sales Strategy Presentation
Boost your sales presentations with this modern template! It features sections for objectives, process, team introduction, customer testimonials, and performance metrics. Ideal for outlining strategies, opportunities, and pricing. Engage your audience with a professional, clean design. Compatible with PowerPoint, Keynote, and Google Slides for seamless integration. Make your sales strategy stand out!


8 slides
Workforce Skills Gap Analysis Presentation
Identify and Bridge Workforce Skill Gaps! This Workforce Skills Gap Analysis template provides a structured approach to assess, compare, and close competency gaps within an organization. Designed with interactive bar chart visuals, it enables HR professionals, managers, and training specialists to track employee skill levels, identify gaps, and align workforce development strategies. Fully customizable in PowerPoint, Keynote, and Google Slides, this template ensures a clear and data-driven approach to workforce planning and professional growth.


6 slides
Social Psychology Infographic
Social psychology is a branch of psychology that focuses on how individuals' thoughts, feelings, and behaviors are influenced by their social interactions and the social environment. These infographics explore various concepts and principles of social psychology. This template is designed to provide a comprehensive overview of the fascinating field of social psychology and its relevance to understanding human behavior in social contexts. The template provides practical tips and strategies based on social psychology research for improving social interactions, communication skills, and building positive relationships.


4 slides
School Curriculum Overview Presentation
Present your academic plan with this creative curriculum overview layout. Featuring intersecting pencil graphics, it visually organizes four key subjects or areas of focus. Perfect for teachers, school administrators, or education consultants. Fully customizable in PowerPoint, Keynote, and Google Slides to match any educational level or institutional branding.


21 slides
Frost Design Proposal Presentation
Present your design proposal with sophistication and clarity using this elegant template! Perfect for outlining your project summary, objectives, and proposed solutions, this template covers everything from scope of work and budget breakdowns to deliverables and team expertise. Fully compatible with PowerPoint, Keynote, and Google Slides, it's designed for seamless, professional presentations.


5 slides
Market Segmentation by Demographics Presentation
The "Market Segmentation by Demographics" presentation template showcases a circular infographic that effectively visualizes market segments as distinct demographic groups. Each colored section of the circle corresponds to a different demographic characteristic, such as age, income, or location, and is accompanied by key insights or data points in adjacent text placeholders. This format allows for an intuitive comparison of how each segment contributes to the market, facilitating a clear understanding of the audience composition. This visual arrangement is especially useful for presentations that need to highlight demographic data succinctly to support market analysis or strategic marketing decisions.


5 slides
Cloud Security and Data Storage Presentation
Visually explain your cloud architecture and data protection strategy with this sleek horizontal diagram. Each layered icon represents different aspects of storage, access, and security control—perfect for IT audits, cloud infrastructure briefs, and risk management reports. Fully editable in PowerPoint, Keynote, and Google Slides.


5 slides
Healthcare Facts Infographics
Healthcare facts help promote health literacy, empower individuals to make informed decisions, and contribute to improved healthcare outcomes for individuals and communities. These infographic templates are designed to present key healthcare facts and statistics in a clear and concise manner. These are perfect for creating educational materials, presenting research findings, or raising awareness about healthcare issues, this template will help you effectively communicate important information. Compatible with Powerpoint, Keynote, and Google Slides you can ensures that your healthcare infographics are visually compelling and impactful.


7 slides
Service Finance Infographic
Service finance refers to the management of financial resources, transactions, and strategies within the service industry. This infographic template ensures that the services provided are financially sustainable, meet customer needs, and contribute to the overall growth and success of the organization. Fully customizable and compatible with Powerpoint, Keynote, and Google Slides. Showcase the dynamics that drive the financial world, uncovering the core elements of the ecosystem. This infographic will encourage action and invite your audience to embrace a financial renaissance, soaring towards their prosperous future.


5 slides
Team Role Distribution Matrix Presentation
Clarify responsibilities and improve collaboration with the Team Role Distribution Matrix Presentation. This RACI-style slide helps visualize team accountability across multiple tasks, making it ideal for project management, cross-functional teams, or workflow planning. Each layout option includes clearly labeled roles and color-coded responsibilities: Responsible, Accountable, Consulted, and Informed. Fully editable in Canva, PowerPoint, Keynote, and Google Slides.


5 slides
Tech Stack and IT Infrastructure Presentation
Visualize your systems with this Tech Stack and IT Infrastructure Presentation. Featuring a vertical ribbon layout with five clearly defined segments, it's perfect for illustrating architecture layers, development pipelines, or infrastructure components. Easily editable in Canva, PowerPoint, or Google Slides to match your brand and IT strategy.


6 slides
Investment Property Infographics
Step into the world of real estate with enthusiasm! This infographic opens doors to a wealth of opportunities. From the allure of rental income to the tax advantages that can boost your financial gains, we unveil the secrets that make investment properties a wise choice. Becoming a successful investor requires knowing the terrain. Dive into the nuances of property location, type, and market conditions. Gain insights into financing options, from traditional mortgages to innovative strategies. Uncover the art of property valuation, where location, condition, and appreciation potential hold the keys to your success. With this engaging infographic compatible with PowerPoint, Keynote, and Google Slides, sharing your real estate wisdom has never been easier. Empower yourself with the knowledge to unlock the potential of investment properties and set sail on a journey towards financial freedom.


22 slides
Garnet Qualitative Research Findings Presentation
This qualitative research findings presentation template provides a structured layout for sharing in-depth insights from your study. It includes sections for objectives, methodology, data analysis, key findings, and future directions, offering a clear flow for presenting research in a professional format. Perfect for researchers, it’s fully customizable in PowerPoint, Keynote, and Google Slides.