


Features
- 4 Unique slides
- Fully editable and easy to edit in Microsoft Powerpoint, Keynote and Google Slides
- 16:9 widescreen layout
- Clean and professional designs
- Export to JPG, PDF or send by email


Do you have any questions?
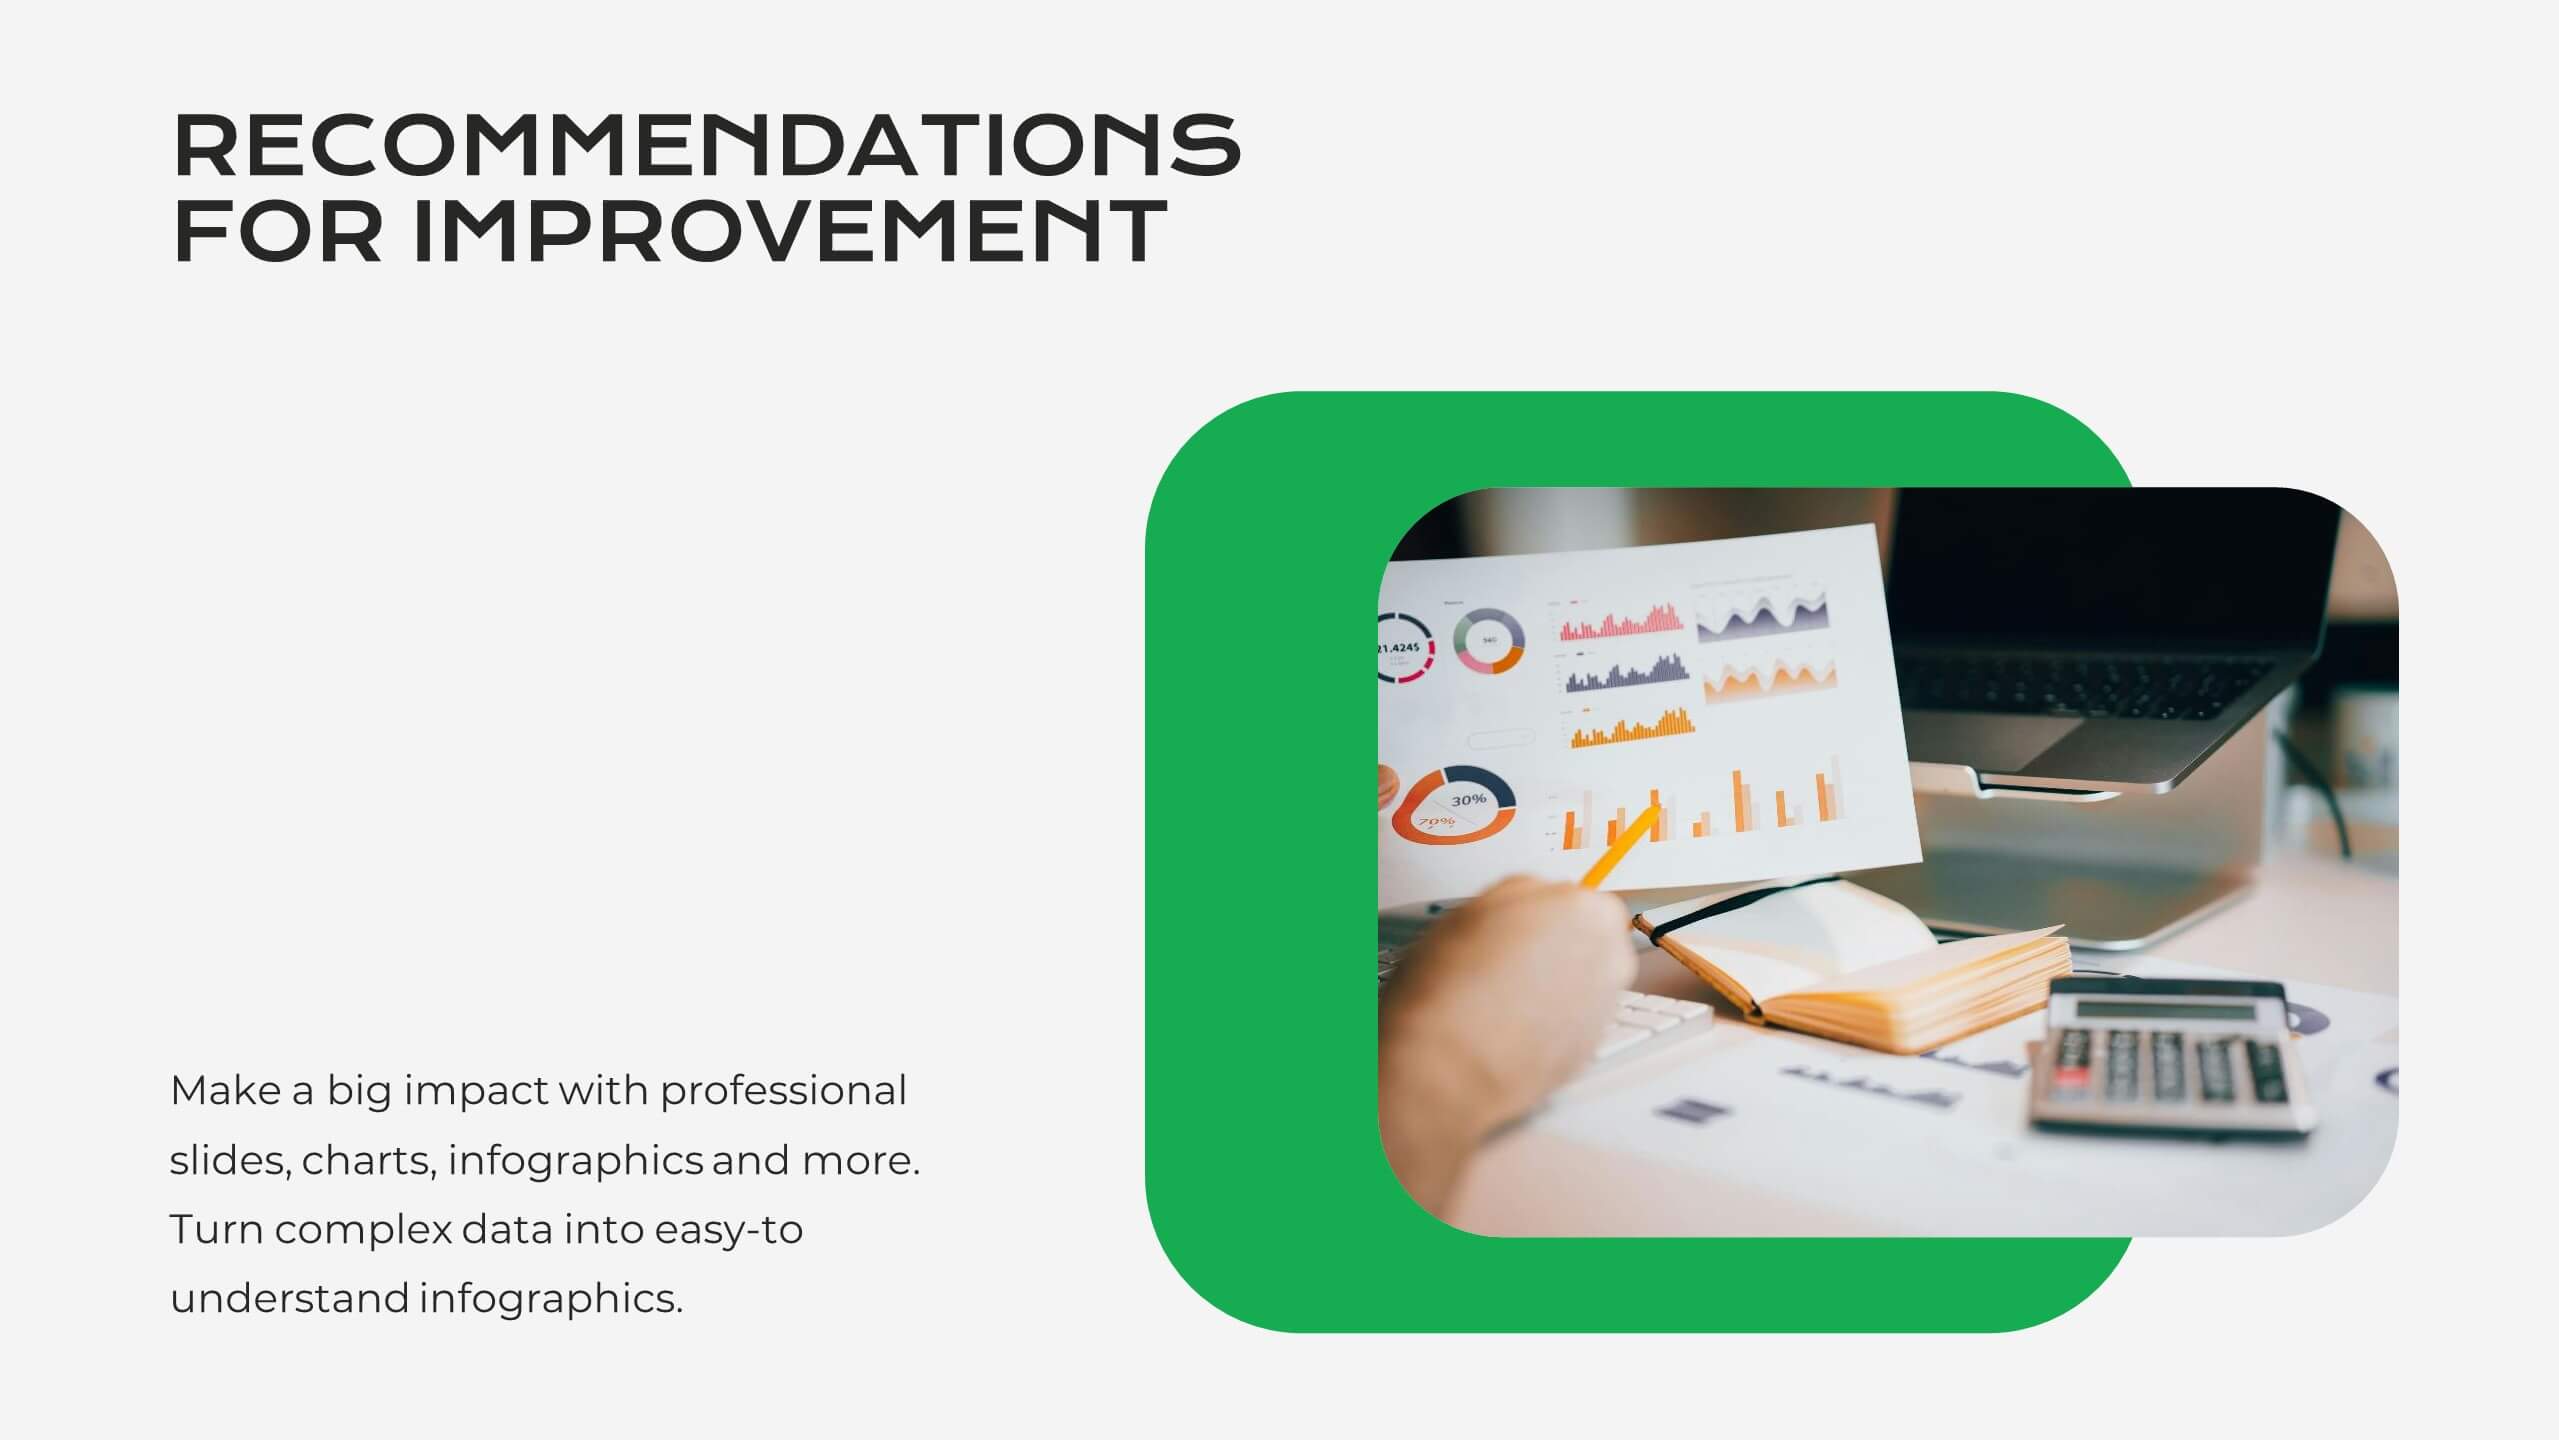
Recommend


8 slides
Large-Scale Data Processing Tools Presentation
Simplify the complexity of data processing with this sleek and modern template for mapping large-scale tools and systems. Ideal for tech teams, data analysts, and IT professionals, this slide helps you explain how data flows through cloud-based infrastructures. Fully customizable and compatible with PowerPoint, Keynote, and Google Slides.


6 slides
International Breast Cancer Day Infographics
Celebrate International Breast Cancer Day with our customizable infographic template, designed to raise awareness and share vital information about breast cancer. This template is fully compatible with popular presentation software such as PowerPoint, Keynote, and Google Slides, allowing you to easily personalize it to convey your unique message. The International Breast Cancer Day infographic template serves as a versatile canvas for displaying facts, statistics, prevention methods, and support resources related to breast cancer. Whether you're a healthcare professional, advocate, or someone passionate about promoting breast health, this template offers a user-friendly platform to create informative presentations and awareness materials. Make an impact with this SEO-optimized International Breast Cancer Day infographic template, meticulously crafted for clarity and ease of use. Customize it to share stories of survivors, highlight the importance of early detection, and spread the message of hope and support. Start creating your personalized infographic to contribute to the cause today!


6 slides
Budget Planning Spreadsheet Slide Presentation
Visualize your spending strategy with a clean, circular layout that turns complex financial data into simple, engaging visuals. This modern design helps you outline expenses, track categories, and showcase progress effectively in meetings or reports. Fully editable and compatible with PowerPoint, Keynote, and Google Slides for effortless customization.


6 slides
Amortization Schedule Infographic
An amortization schedule is a detailed table that outlines the repayment of a loan over time. This infographic can be a helpful way to visually explain the repayment schedule of a loan or mortgage. Divide it into sections, including an introduction, explanation of terms, example calculations, and key takeaways. Compatible with Powerpoint, Keynote, and Google Slides. Use icons or visuals to represent loan-related concepts, such as a house for mortgages, a money bag for payments, or a graph for interest rates. The line graphs included can show the decreasing principal balance over time, with interest and principal portions highlighted.


7 slides
Financial Forecasting with Statistics Presentation
Unlock your financial future with the "Financial Forecasting with Statistics" presentation templates. These slides are designed to clearly present growth forecasts, trends, and statistics, empowering you to make informed decisions. Ideal for financial analysts and corporate strategists, these templates are fully compatible with PowerPoint, Keynote, and Google Slides.


21 slides
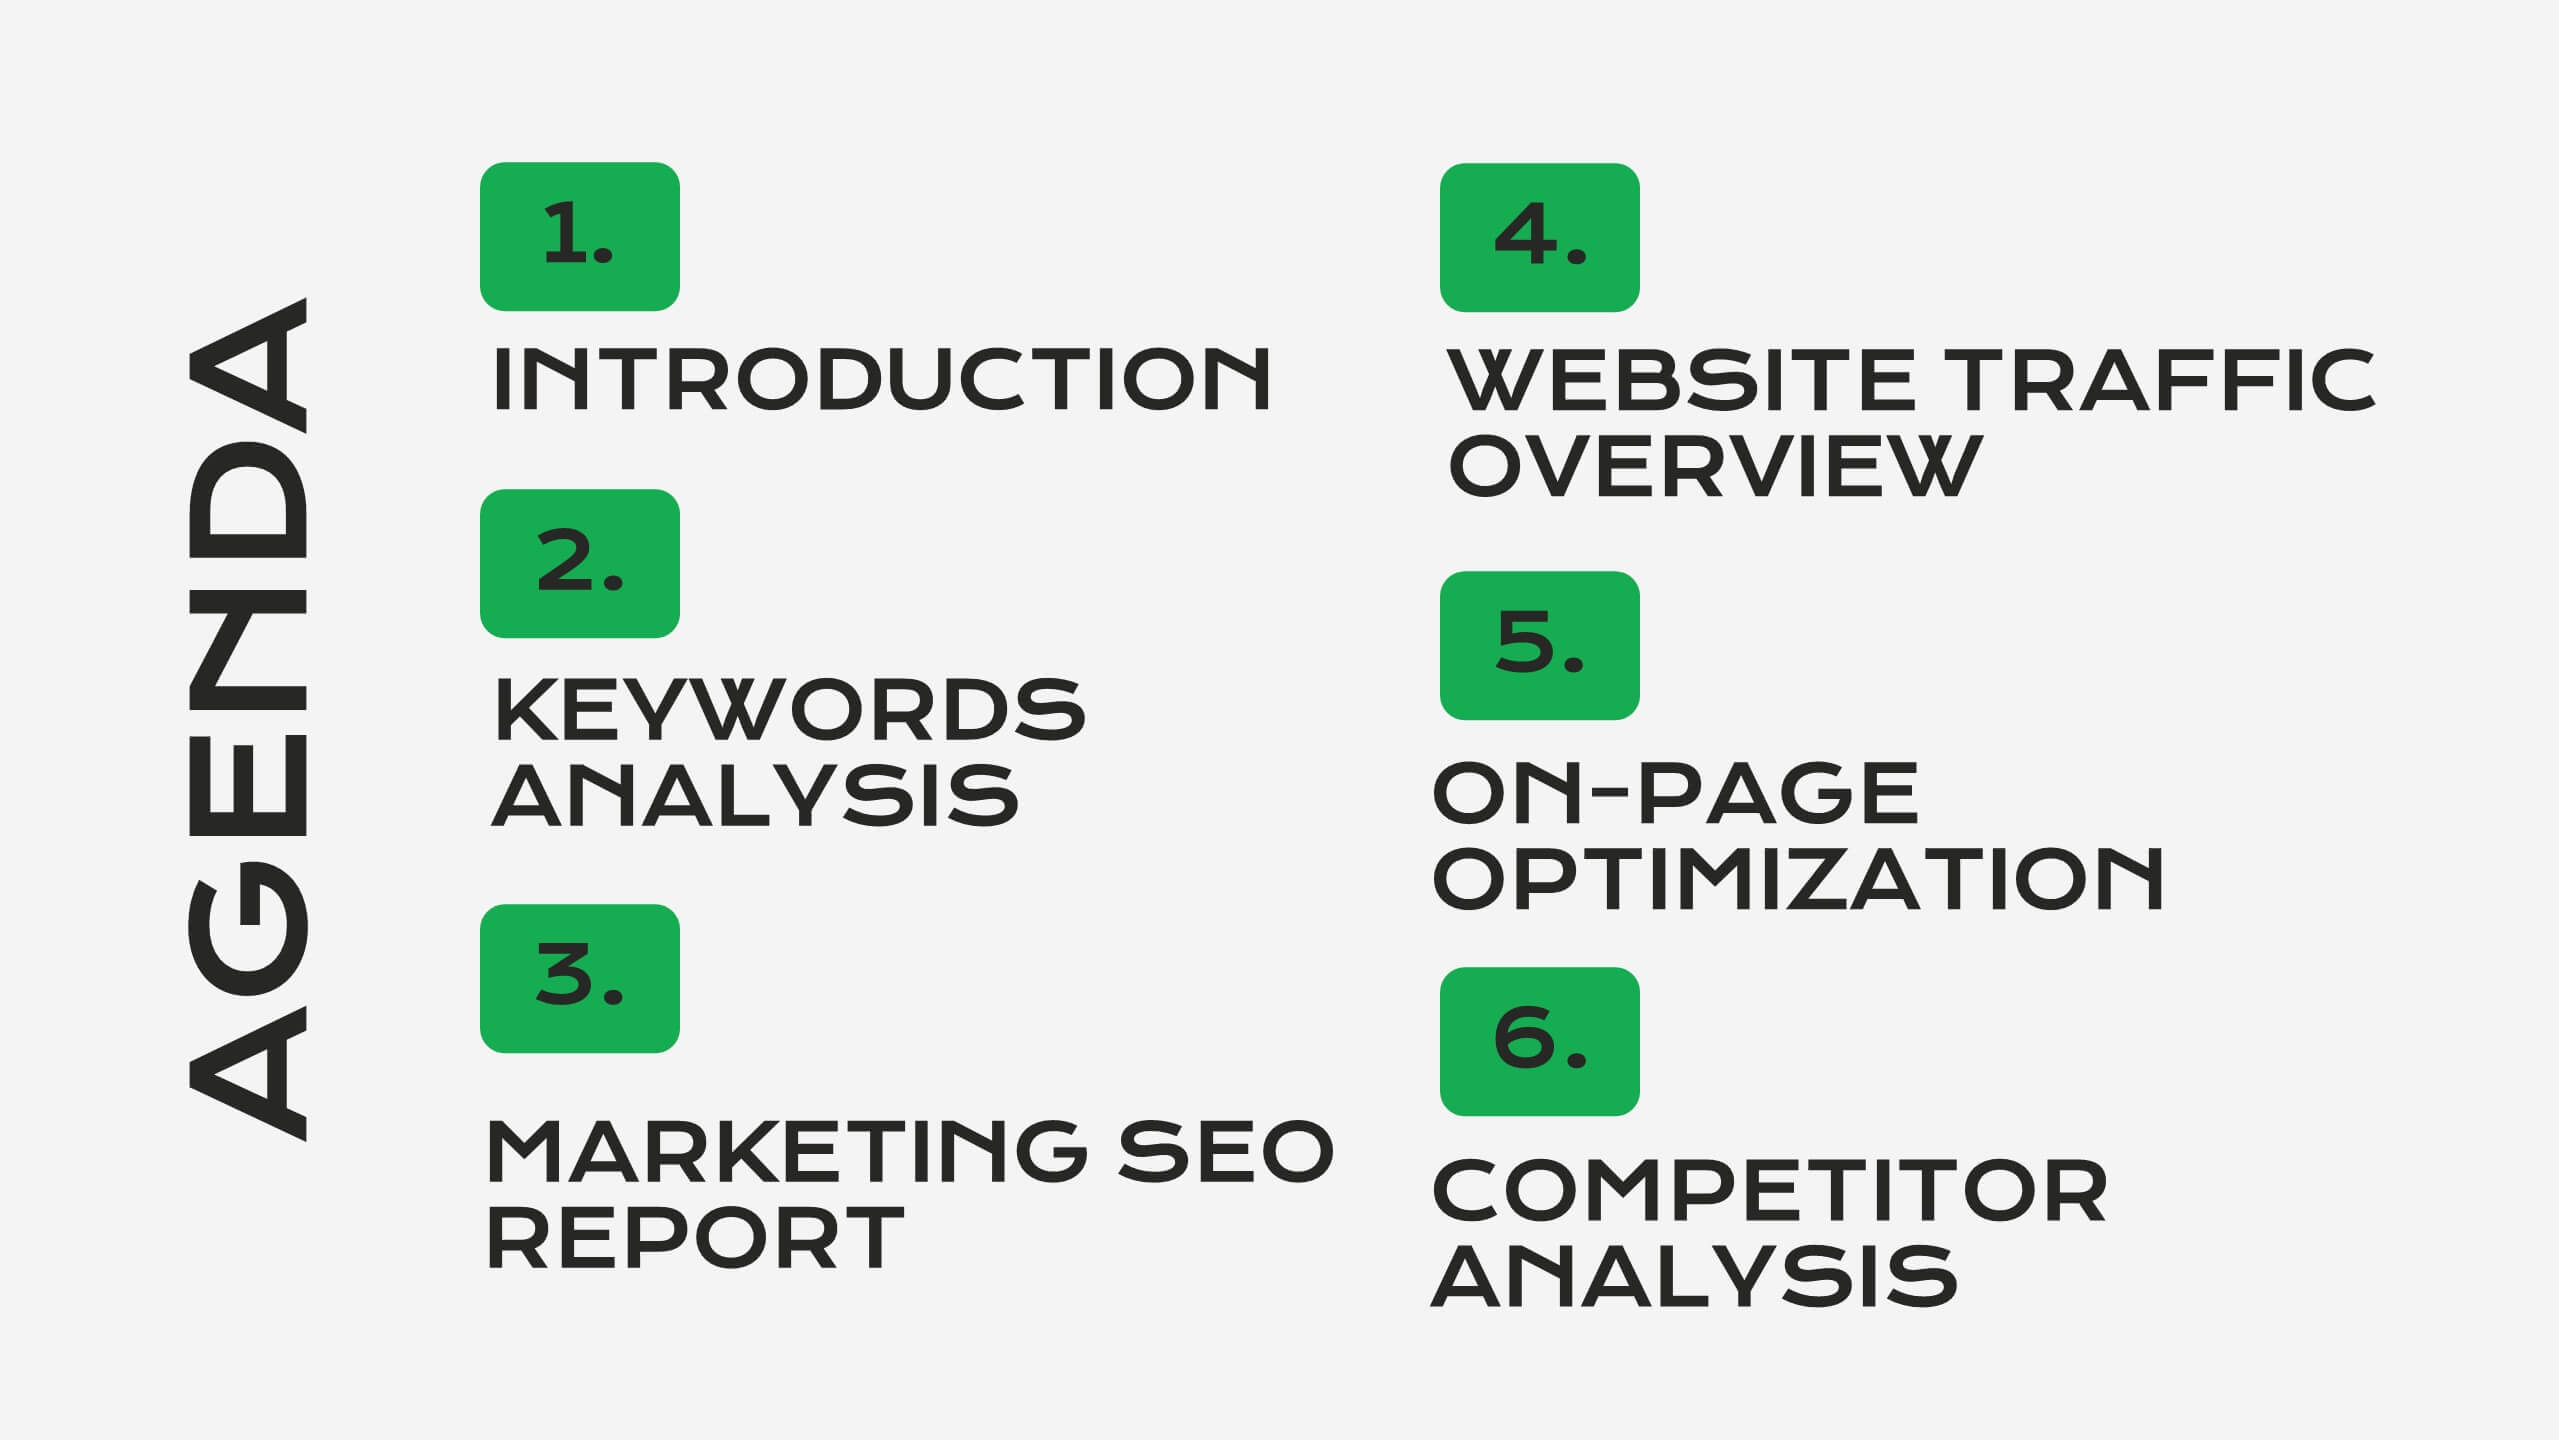
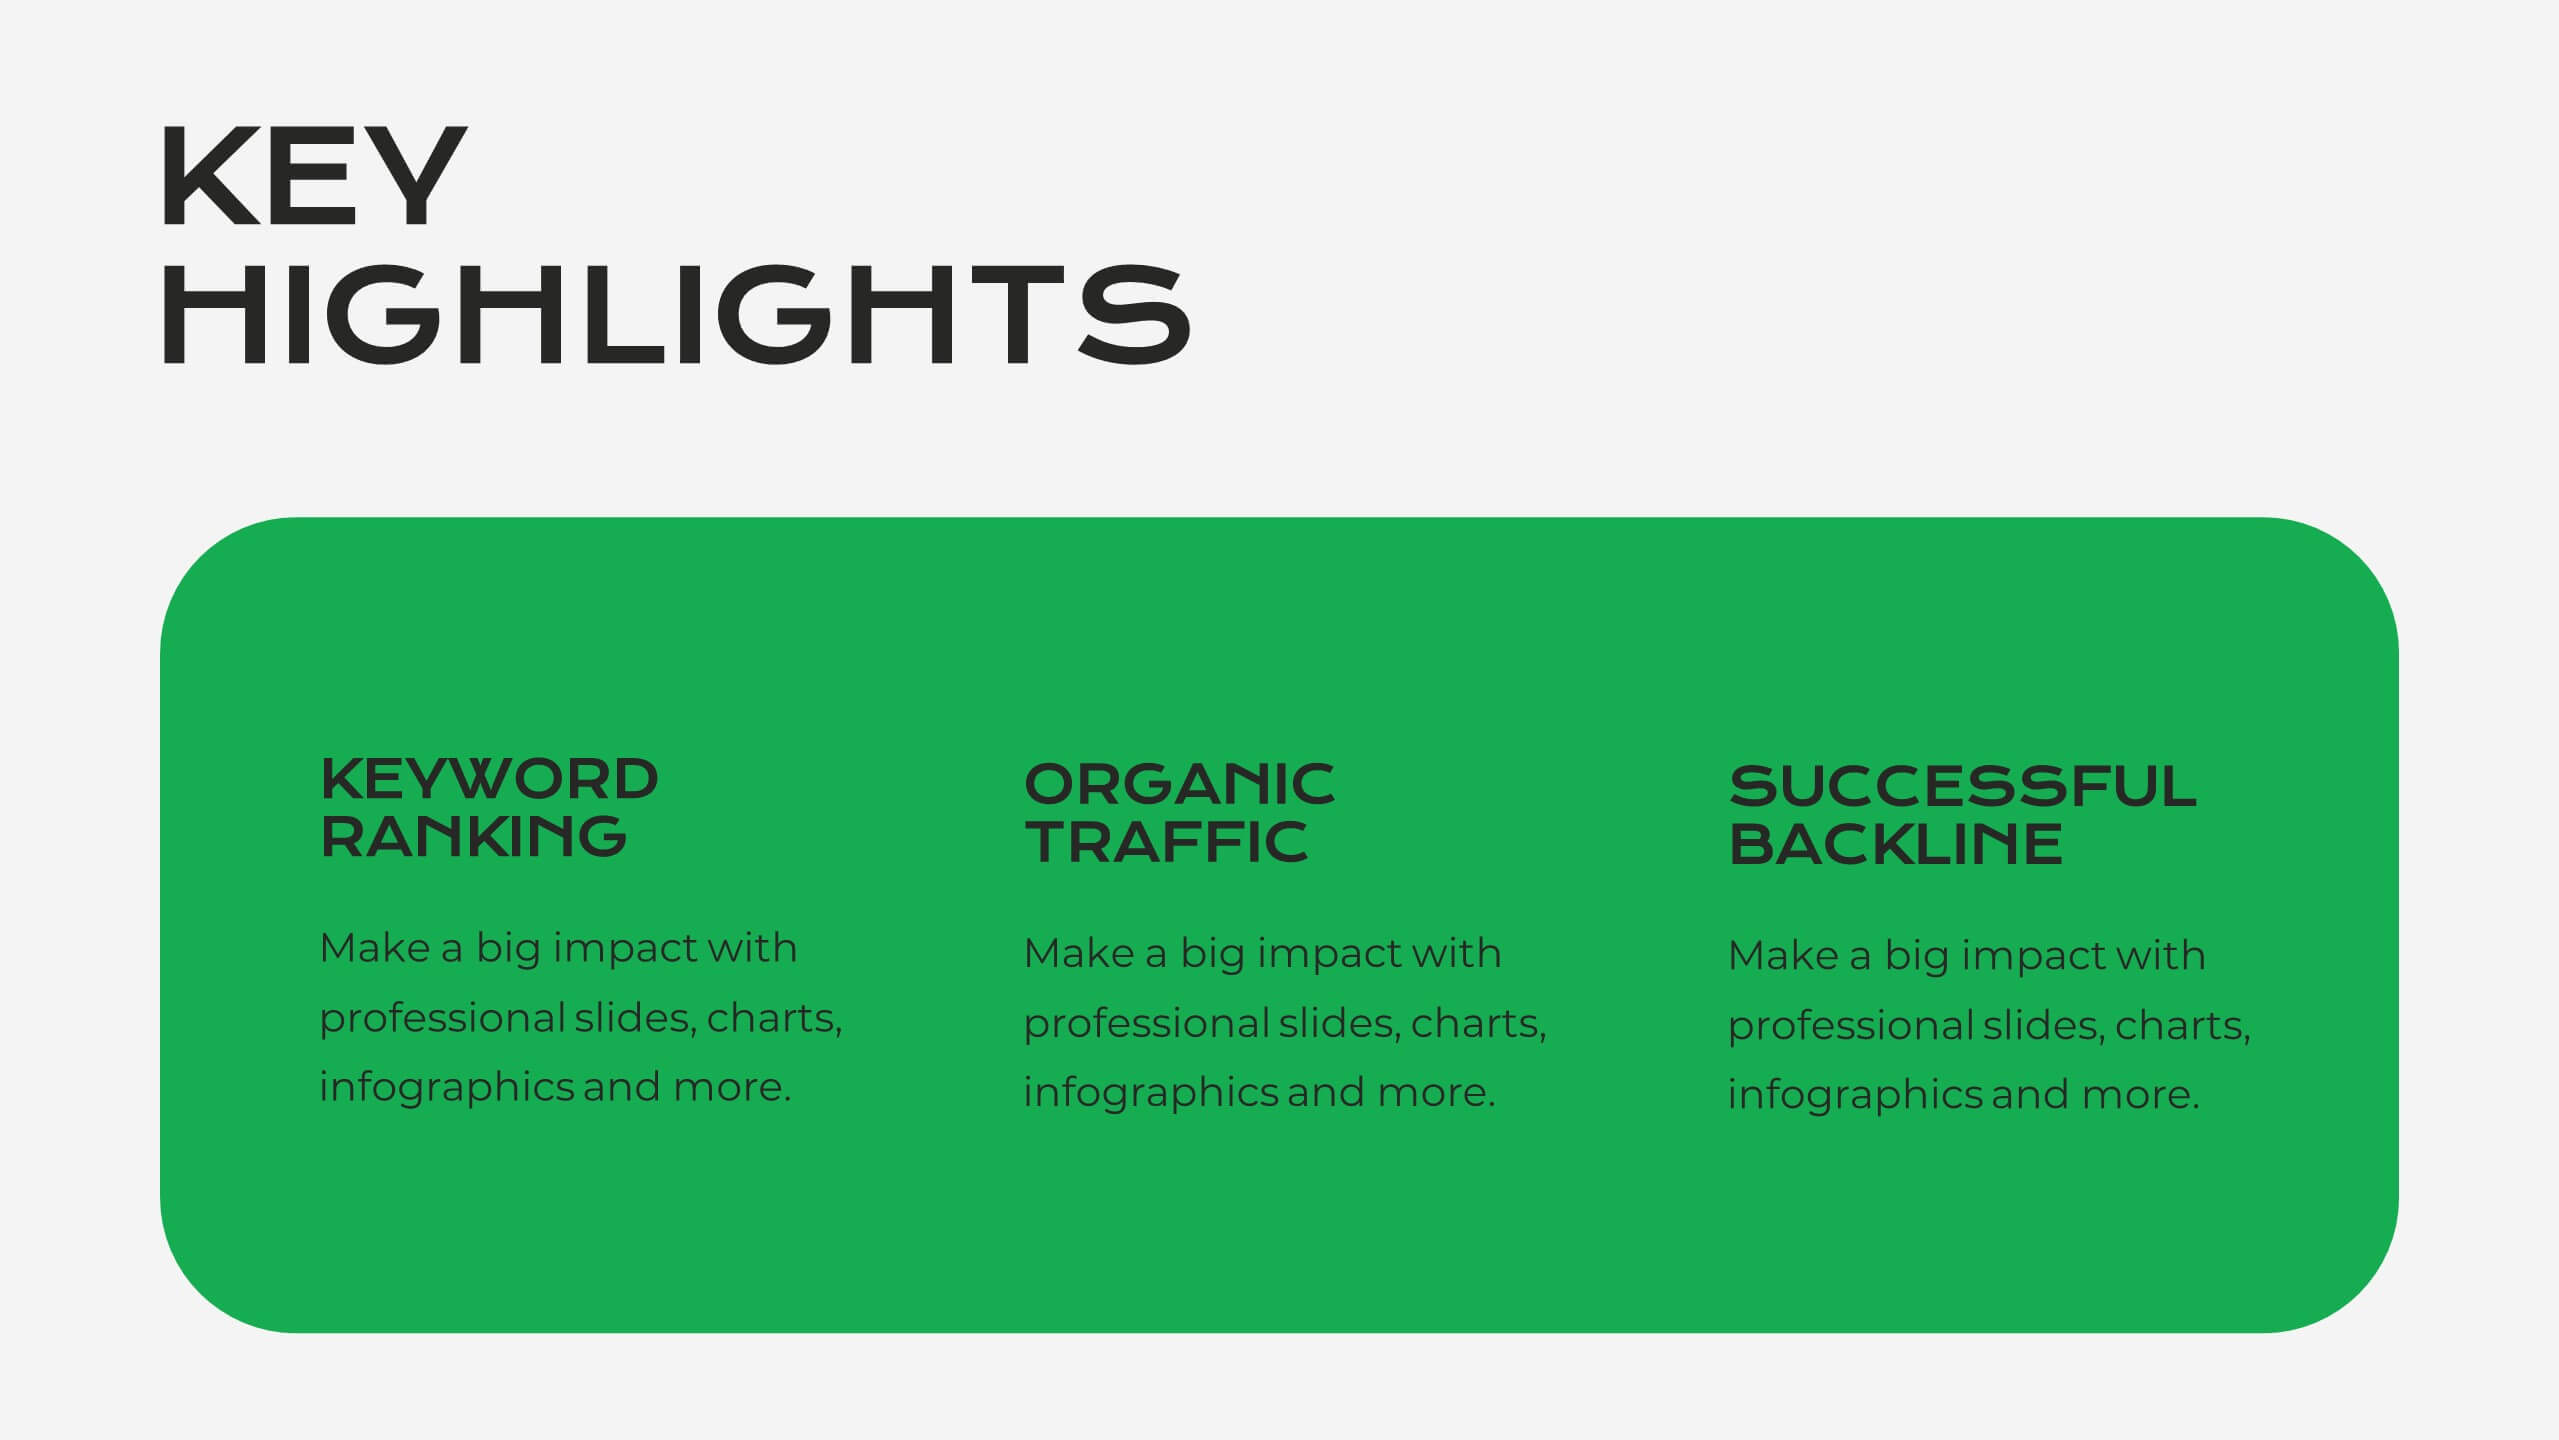
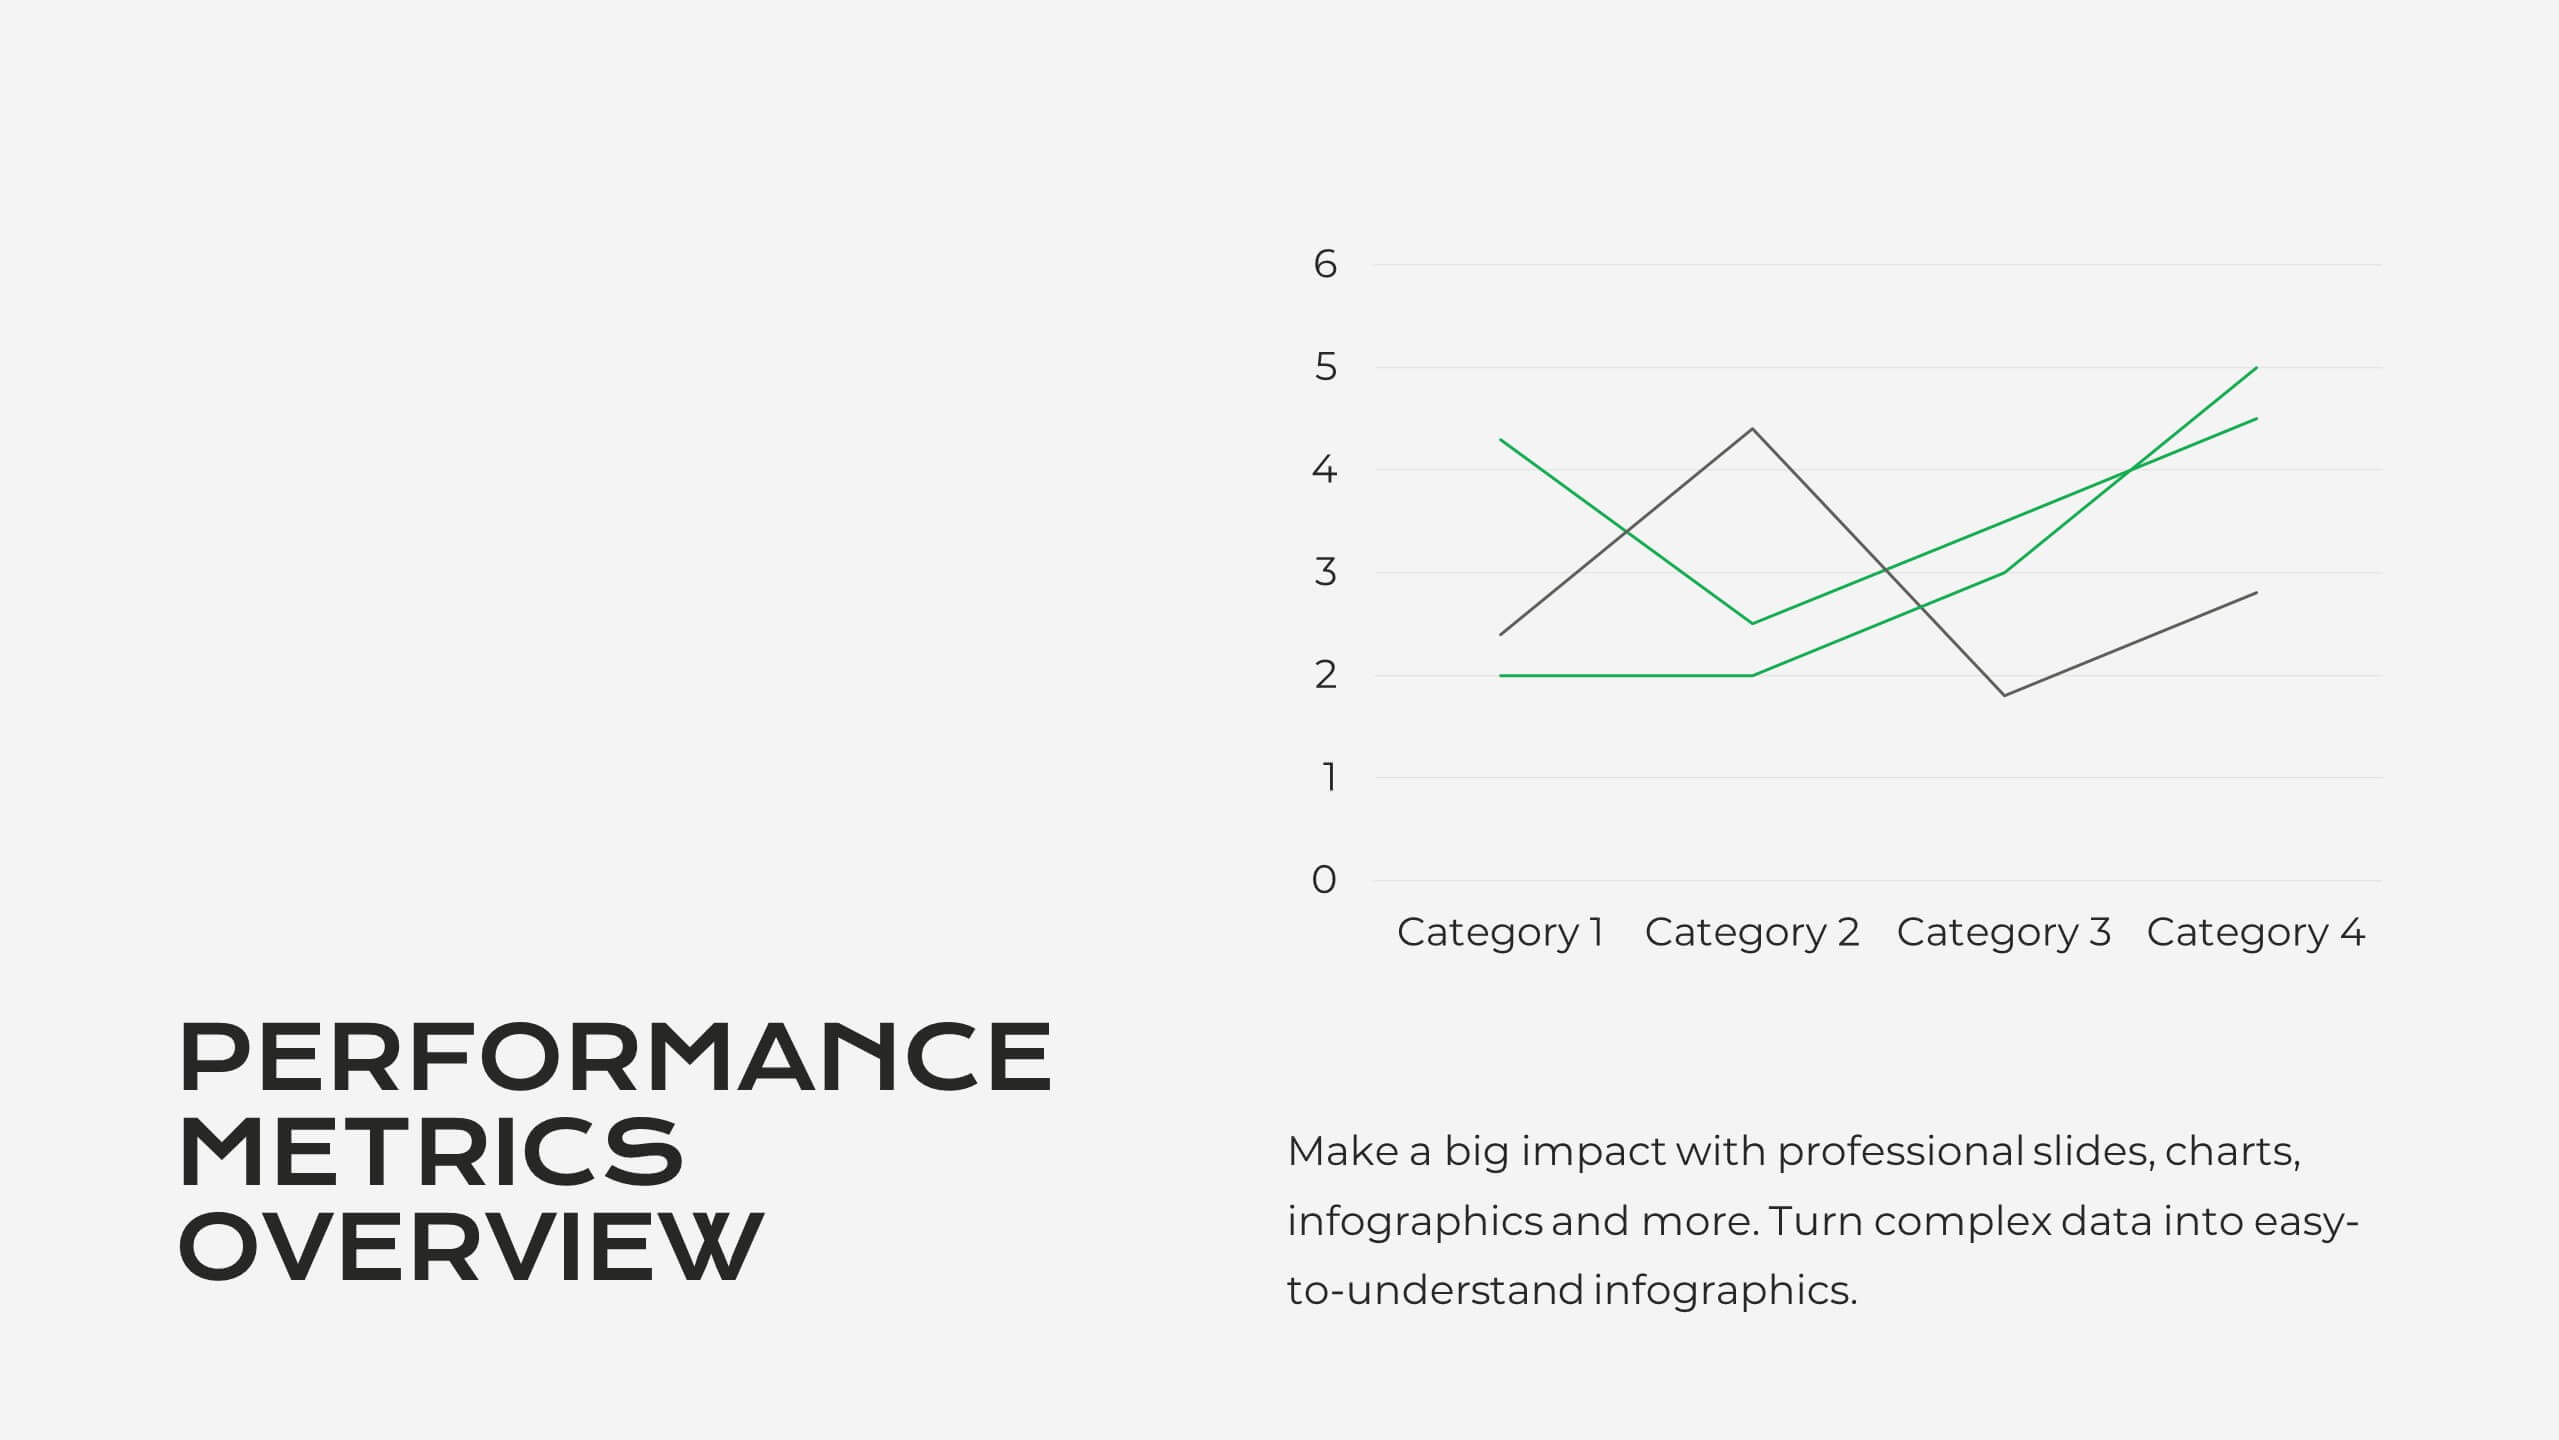
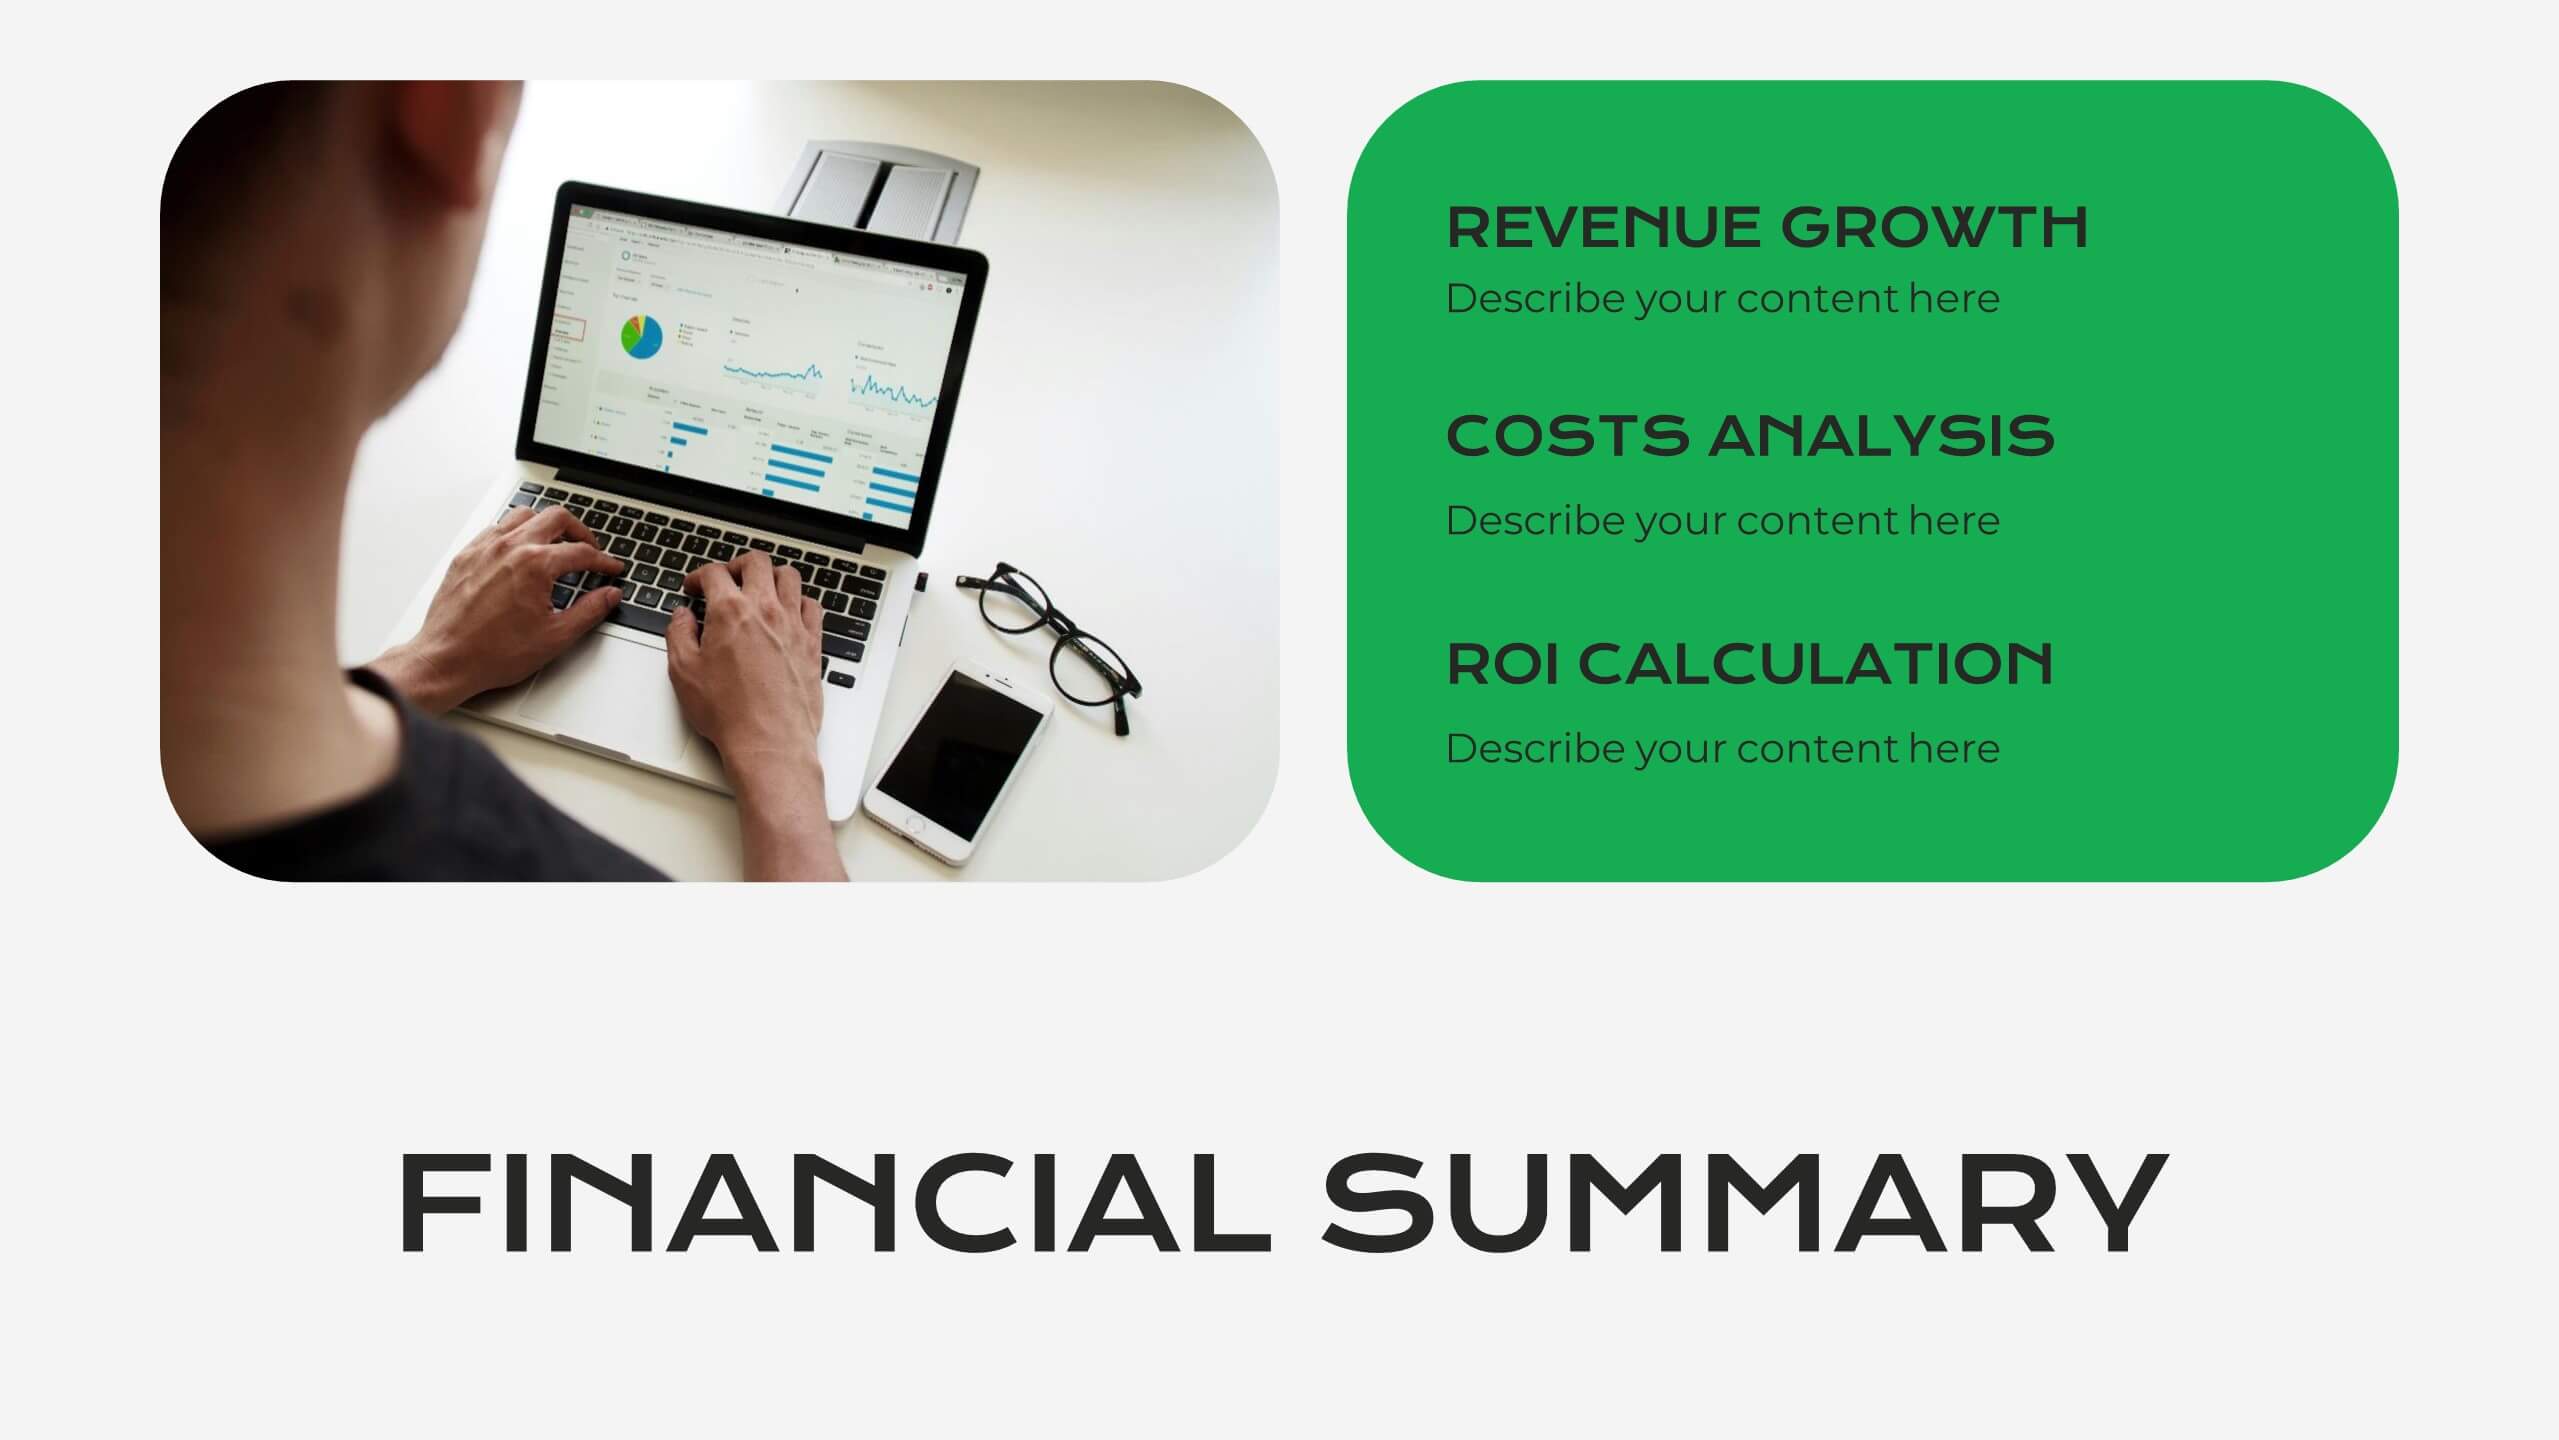
Serene Market Analysis Report Presentation
This modern and clean Market Analysis Report template is designed to help you present key data and insights with clarity and impact. Ideal for business professionals and analysts, it includes slides for key highlights, performance metrics, financial summaries, competitor insights, and strategic initiatives. The template's sleek layout ensures that your data is easy to understand and visually appealing, making it perfect for internal reports or client presentations. Customize it effortlessly in PowerPoint, Keynote, or Google Slides, and impress your audience with a polished and professional report.


23 slides
Dragonveil Product Launch Pitch Deck Presentation
The Product Launch Pitch Deck Presentation Template features 23 fully customizable slides designed to outline key aspects such as market opportunity, revenue model, and sales strategy. Ideal for startups and businesses launching new products, it ensures a compelling pitch. Compatible with PowerPoint, Keynote, and Google Slides.


4 slides
Corporate Company Profile Overview Presentation
Present your business story with clarity and impact using this sleek company profile layout. Designed for corporate overviews, it highlights key points alongside a modern visual backdrop. Ideal for executive summaries, strategy decks, or investor briefings—fully editable in PowerPoint, Keynote, and Google Slides for effortless customization and professional results.


10 slides
Process Flow Chart Presentation
Visualize your process with clarity using the Process Flow Chart Presentation. Featuring a central hexagon design branching out into four sequential steps, this layout is perfect for showcasing workflows, procedures, or business strategies. Color-coded options and dark/light theme variations add versatility. Fully customizable in PowerPoint, Keynote, and Google Slides.


7 slides
Consecutive Numbers Infographic
Dive into the world of mathematics with our Consecutive Numbers Infographic! Employing an array of serene blues and greens, this visually appealing tool breaks down the concept of consecutive numbers in a fun and comprehensible manner. It's an educator's dream, designed to captivate and engage, making the topic accessible for students of various age groups. Beyond the classroom, it's a handy reference for professionals and enthusiasts alike. With compatibility spanning PowerPoint, Keynote, and Google Slides, this infographic is poised to elevate any presentation, workshop, or lecture it graces.


6 slides
Roadmap Milestones Infographic
Chart your project's progress with our Roadmap Milestones Infographic, optimized for Powerpoint, Google Slides, and Keynote. This infographic is expertly designed to visualize the journey of your project from conception to completion. The roadmap's layout is intuitive and user-friendly, making it simple to customize with your specific project stages, timeframes, and critical tasks. Whether you're outlining a new business initiative, or planning an event, this template helps you lay out a path to success that your team can follow. With this Roadmap infographic, you can keep stakeholders informed and your team aligned on the project's goals and progress.


7 slides
Tables of Content Infographic Presentation Template
A table of contents infographic can serve as a visual representation of the content outline and help to convey the overall structure and organization of the information. This template displays the headings and subheadings of the document, along with the page numbers or slide numbers, in an easy-to-follow format. The purpose of our table of contents infographic template is to provide an overview of the content and help you navigate the presentation more efficiently. It is often used in academic papers, reports, magazines, and books, and can also be used in digital documents and presentations.


8 slides
Workforce Engagement Strategy Presentation
Visualize employee engagement plans with the Workforce Engagement Strategy Presentation. This template includes timeline-style layouts to communicate team initiatives, motivation tactics, and HR strategies effectively. Ideal for team leads, HR managers, and consultants. Fully customizable in PowerPoint, Keynote, and Google Slides to suit your brand and communication goals.


3 slides
Profitability and Cost Analysis Presentation
Evaluate financial efficiency with this profitability and cost analysis template. Designed for business strategists and financial planners, it helps compare costs against revenue to determine profit potential. The visual balance scale enhances clarity, making complex data easier to digest. Fully customizable and compatible with PowerPoint, Keynote, and Google Slides for seamless editing.


5 slides
Business KPI Performance Presentation
Bring your business results to life with a clear, modern layout designed to showcase key metrics and performance goals. Perfect for tracking growth, progress, and success indicators, this visual design helps make data easy to understand and engaging. Fully editable in PowerPoint, Keynote, and Google Slides.


10 slides
Strategic Idea Clustering Bubble Map
Visualize and organize your concepts with the Strategic Idea Clustering Bubble Map Presentation. This dynamic bubble diagram is ideal for brainstorming sessions, strategic planning, and idea grouping. Each node highlights key points around a central concept. Fully customizable in PowerPoint, Keynote, and Google Slides—perfect for teams, consultants, and innovators.


10 slides
Checklist and Action Plan List Presentation
Stay organized and achieve goals efficiently with this checklist and action plan template. Designed for task tracking, project management, and strategic planning, it provides a clear visual structure for prioritizing tasks. Perfect for professionals and teams aiming for productivity. Compatible with PowerPoint, Keynote, and Google Slides for seamless editing and presentation.