


Features
- 7 Unique slides
- Fully editable and easy to edit in Microsoft Powerpoint, Keynote and Google Slides
- 16:9 widescreen layout
- Clean and professional designs
- Export to JPG, PDF or send by email.


Do you have any questions?
Recommend


6 slides
Business Growth Metrics Butterfly Chart Presentation
Track growth and risk side by side with this butterfly chart template. Ideal for business performance analysis, it visually compares positive and negative metrics across six categories. Fully editable in PowerPoint, Keynote, or Google Slides, this layout makes it easy to highlight trends, evaluate risks, and support data-driven decisions.


3 slides
Stock Market Performance Overview Presentation
Showcase financial growth like a pro with this clean, data-driven layout designed to visualize performance, market activity, and business progress over time. Ideal for professionals presenting key financial trends, metrics, or strategies. Fully compatible with PowerPoint, Keynote, and Google Slides for easy customization and professional presentation results.


20 slides
Obscuran Sales Performance Report Presentation
Take your sales analysis to the next level with this sleek and professional presentation template. Designed to highlight key areas such as sales objectives, process, performance metrics, competitive analysis, pricing strategy, and future opportunities. This modern layout ensures clarity and impact, making it perfect for sales teams, managers, and stakeholders. Fully customizable and compatible with PowerPoint, Keynote, and Google Slides.


6 slides
Business Gap Analysis Slide Presentation
Bright and clear from the very first glance, this slide turns complex performance gaps into a simple visual journey your audience can follow instantly. It helps you compare current and ideal outcomes, highlight weaknesses, and guide improvement decisions with clarity. Fully compatible with PowerPoint, Keynote, and Google Slides.


7 slides
Business Pricing Table Slides Infographic
Streamline your product offerings with our Business Pricing Infographic, designed to clearly present pricing tiers and package options. This infographic is essential for sales teams, marketing professionals, and business owners to communicate value propositions to potential customers. Our Business Pricing Infographic allows for a clean, comparative view of different pricing plans, showcasing features, benefits, and cost-effectiveness at a glance. It includes customizable sections for various packages, making it easy to distinguish between basic, standard, and premium options. With this tool, you can highlight key differences and unique selling points of each package, aiding customers in making informed purchasing decisions. This SEO-friendly infographic is crafted to attract and educate potential buyers, providing them with transparent pricing information. Adopt this infographic in your marketing materials to facilitate a straightforward shopping experience, helping customers choose the right product that fits their needs and budget.


5 slides
Professional Business Proposal Presentation
Make your pitch stand out with a polished, minimal design that highlights every key stage of your business strategy. This clean visual layout is perfect for outlining project phases, services, or data-driven insights with clarity and impact. Fully compatible with PowerPoint, Keynote, and Google Slides for easy customization.


6 slides
Managing Transition in Business Presentation
Make your next strategy session visually unforgettable with this clean, step-by-step layout. Designed to help explain transitional phases in business, this infographic template simplifies complex change processes into digestible segments. Ideal for professionals presenting transformation strategies. Fully editable and compatible with PowerPoint, Keynote, and Google Slides for easy use.


6 slides
Project Governance Plan Presentation
Bring clarity and energy to your workflow with this engaging presentation that visually breaks down key steps, responsibilities, and milestones in a structured process. Its clean layout helps audiences quickly understand project priorities and decision paths. Perfect for strategy meetings and stakeholder updates. Fully compatible with PowerPoint, Keynote, and Google Slides.


10 slides
Project Lifecycle Planning Overview Presentation
Guide your team through every project stage with the Project Lifecycle Planning Overview Presentation. Featuring a four-phase circular flow layout, this template helps visualize key milestones—from initiation to completion. Ideal for project managers, consultants, and strategic teams. Fully customizable and compatible with PowerPoint, Keynote, Google Slides, and Canva.


20 slides
Falcon Digital Marketing Strategy Plan Presentation
Develop a winning marketing strategy with this dynamic template. Dive into current trends, consumer behavior, and innovative techniques. Perfect for social media, influencer marketing, and data-driven campaigns. Fully compatible with PowerPoint, Keynote, and Google Slides.


6 slides
Talent Acquisition and Recruitment Presentation
Showcase your hiring process with clarity using this Talent Acquisition and Recruitment slide. Designed with a stack of resumes and a 5-step vertical layout, it's perfect for outlining stages such as job posting, candidate sourcing, interviews, and selection. Each section includes icons and editable titles to match your specific recruitment flow. Compatible with PowerPoint, Keynote, and Google Slides for easy customization.


5 slides
IT Service Operations Strategy Presentation
Streamline your IT presentations with the IT Service Operations Strategy Presentation template. This structured layout is designed to showcase key service operation metrics, strategies, and performance indicators in a visually engaging format. Ideal for IT teams, service managers, and business analysts, this slide helps simplify complex IT processes with clear data points and percentages. Fully customizable in PowerPoint, Keynote, and Google Slides for effortless adaptation to your needs.


23 slides
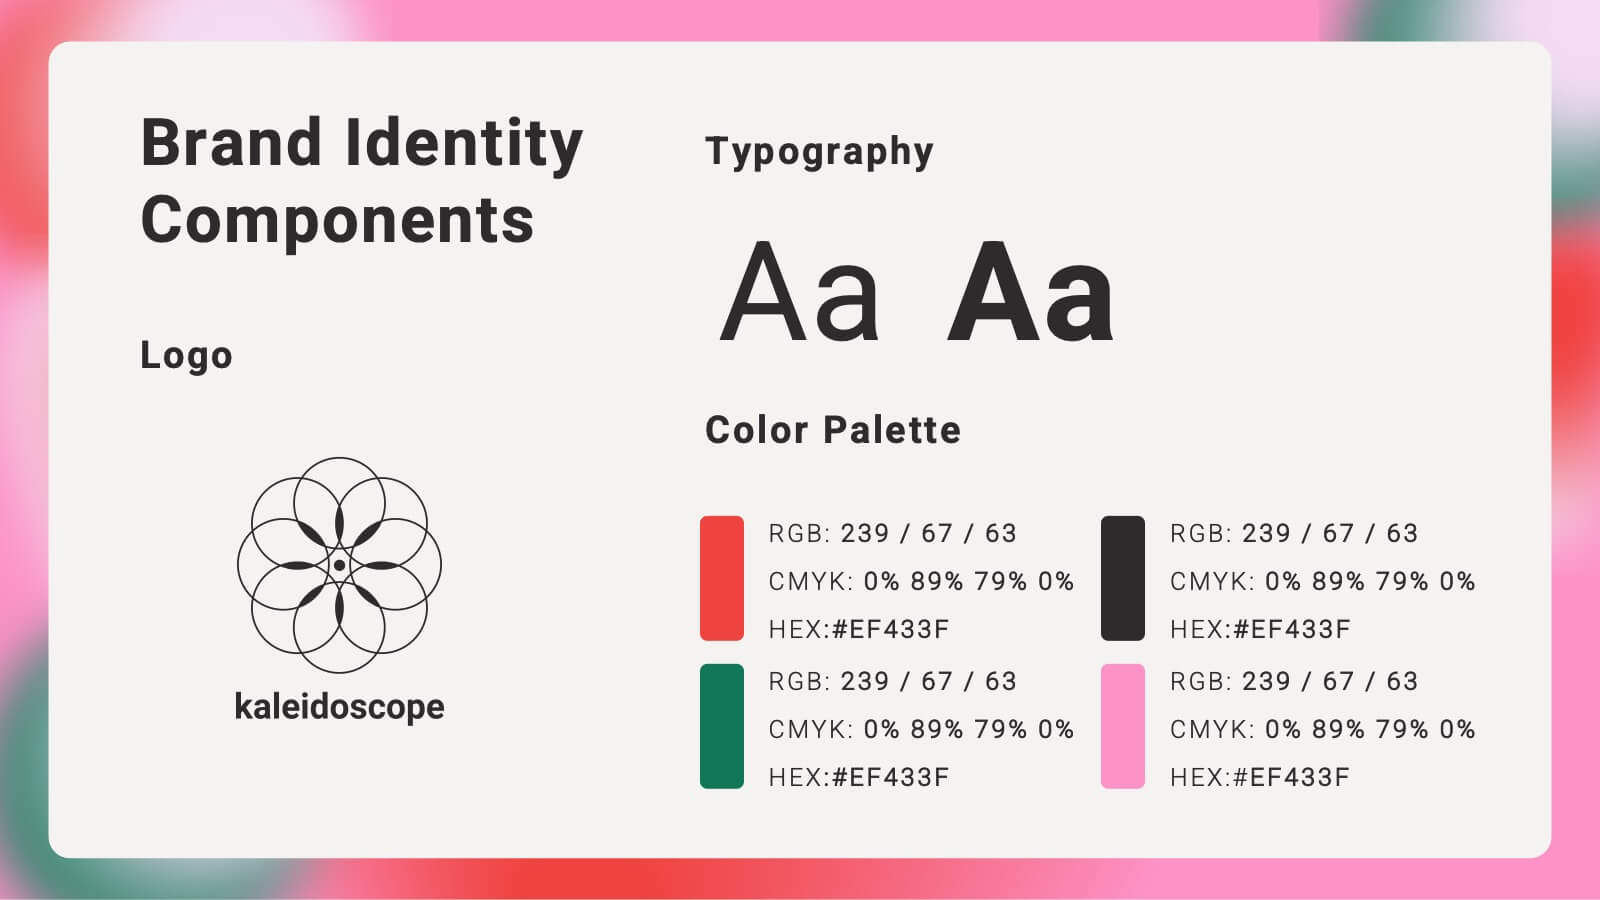
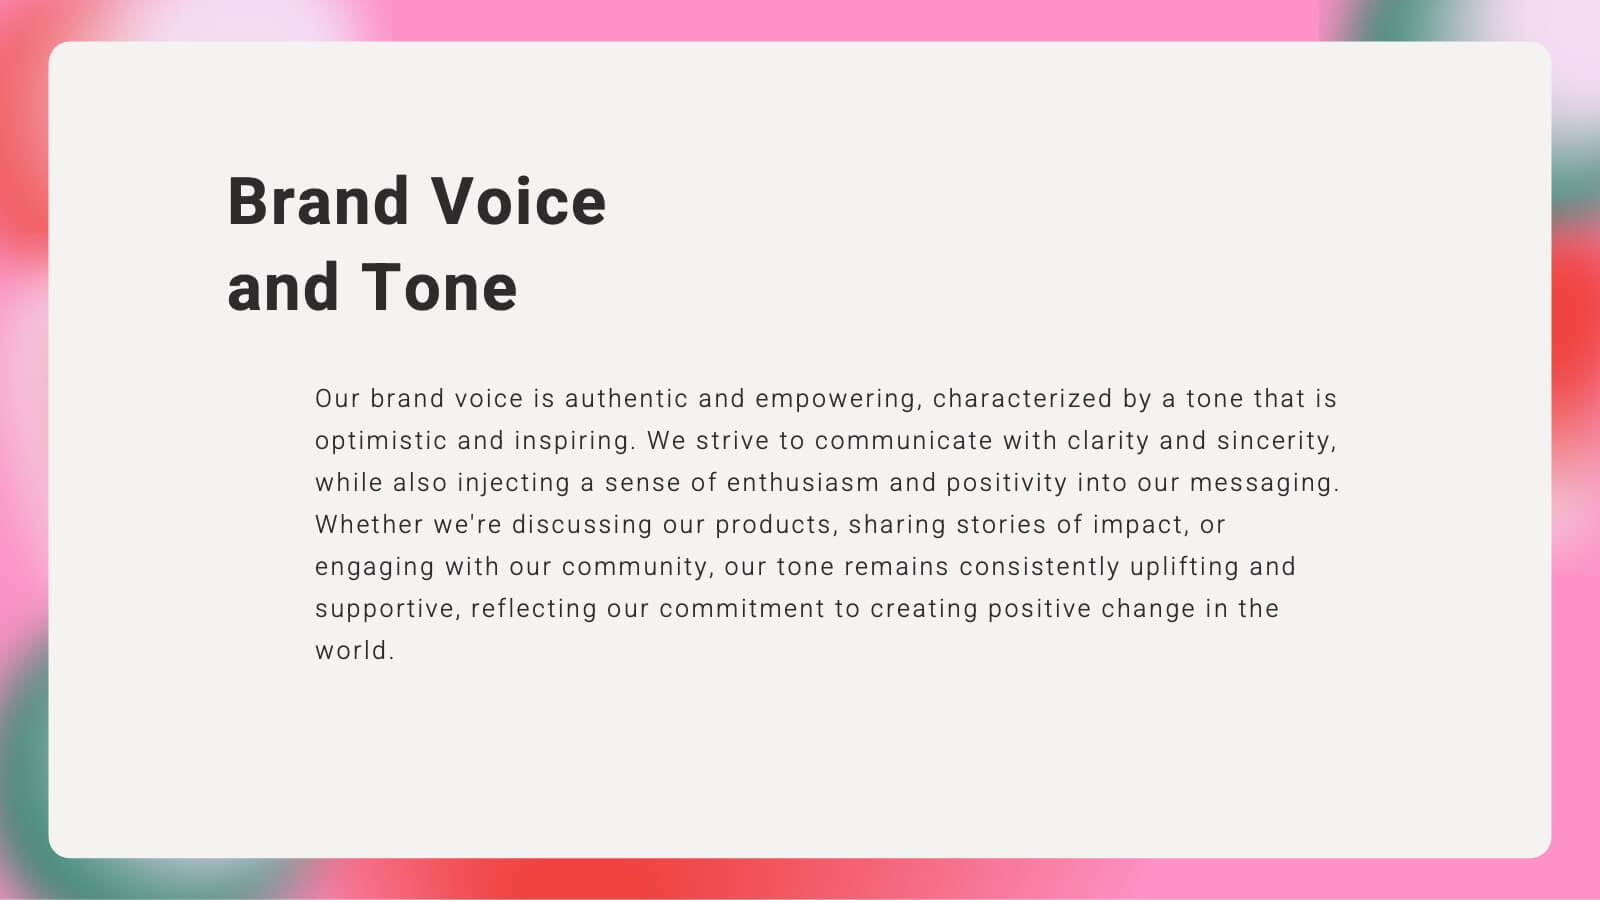
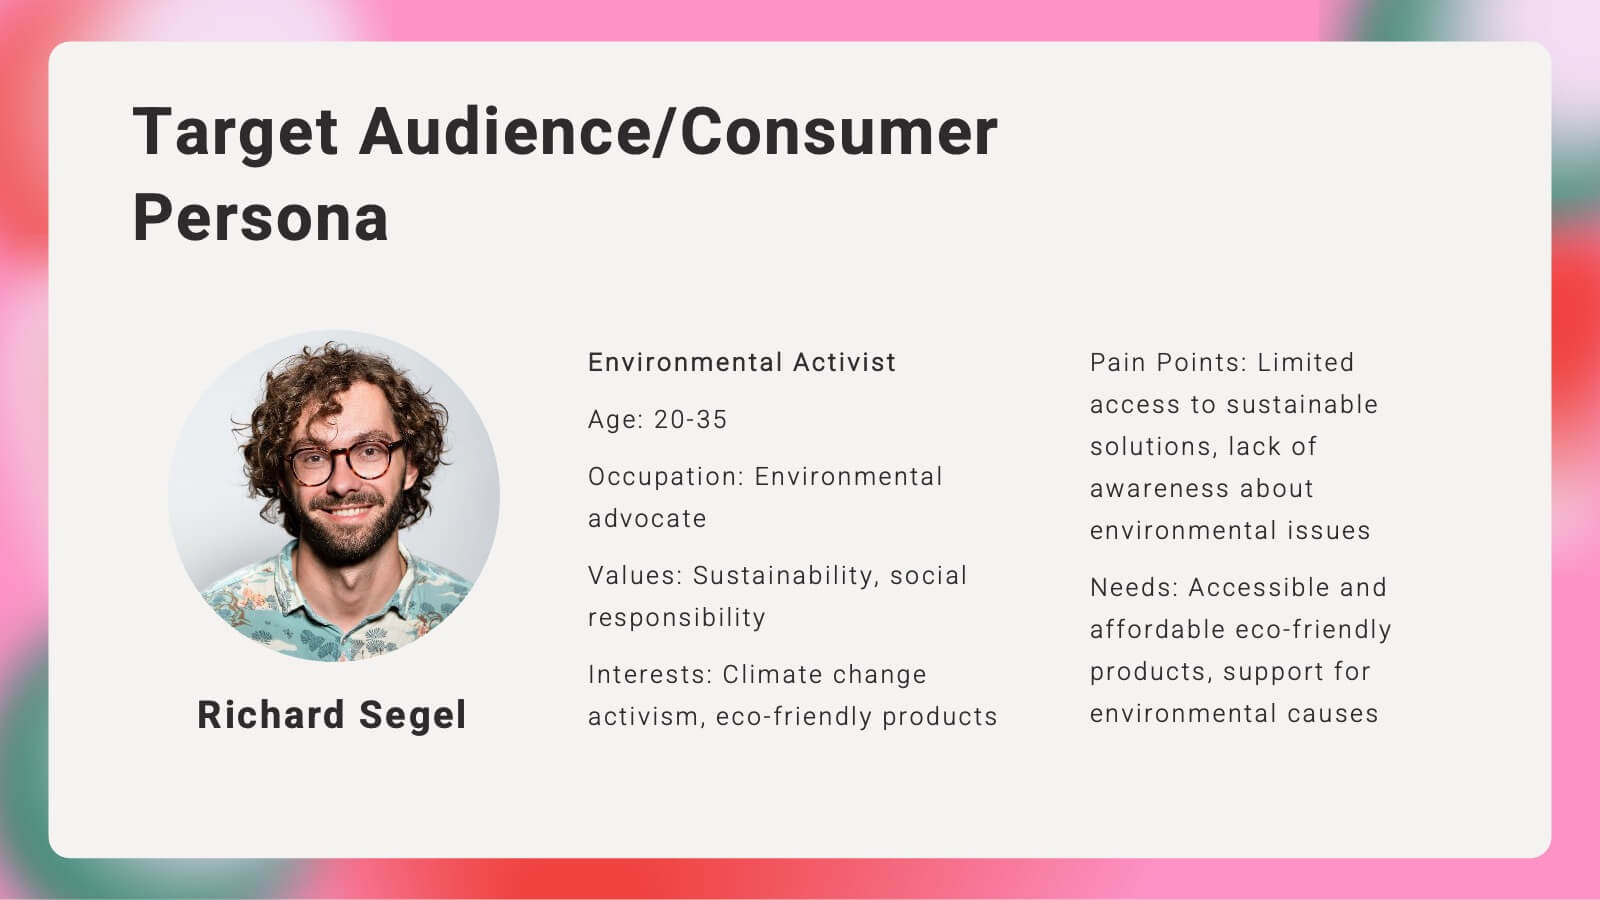
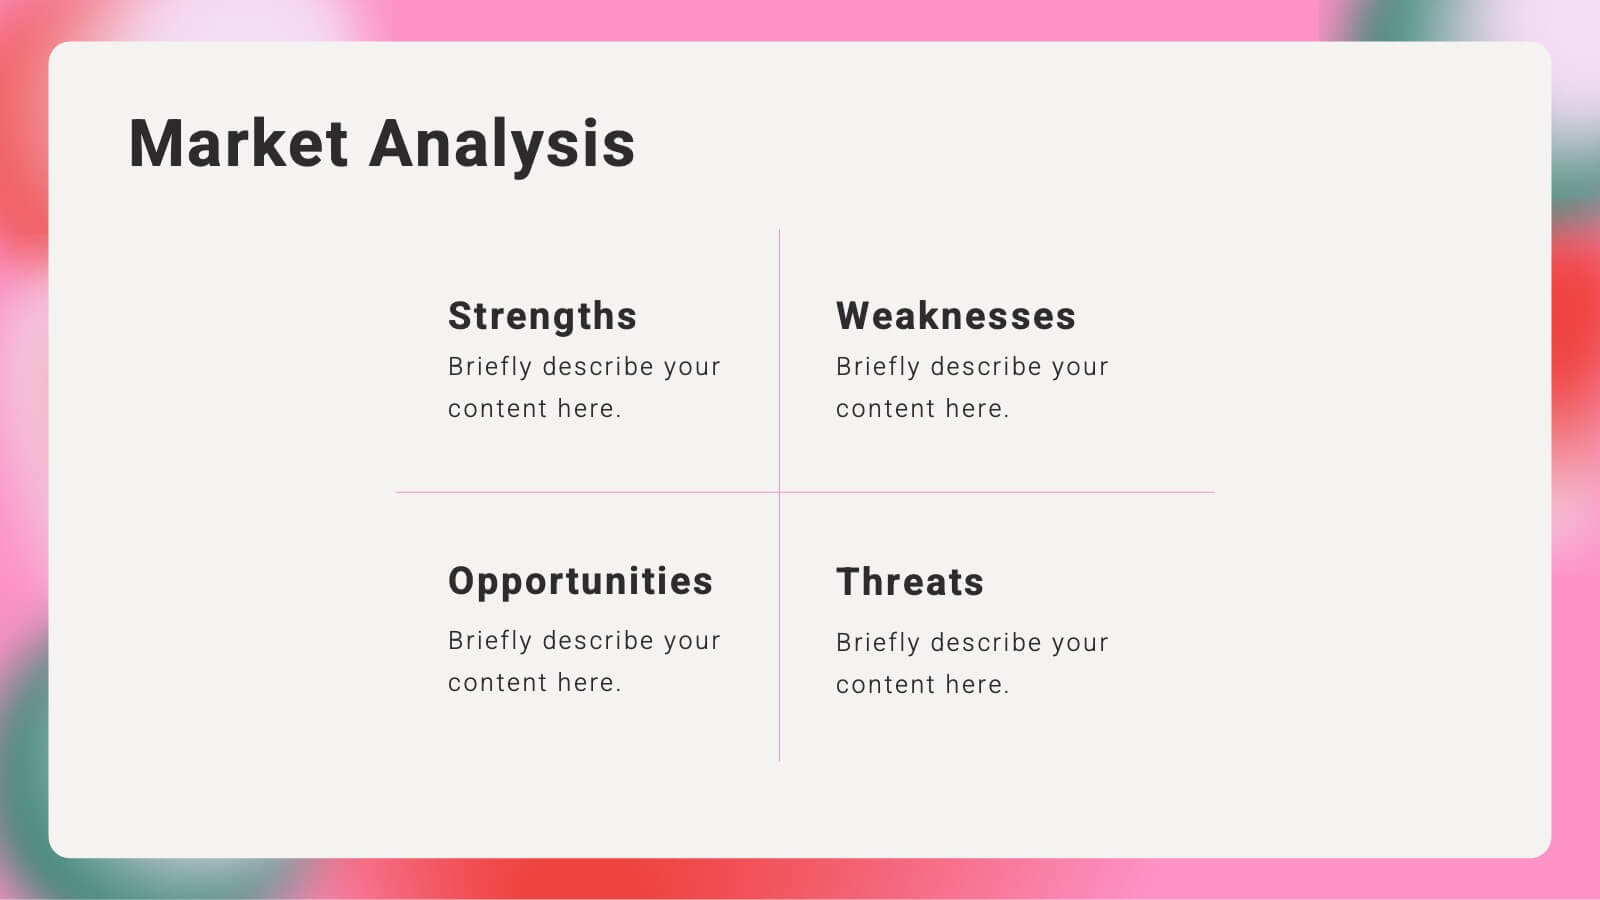
Kaleidoscope Brand Strategy Report Presentation
Craft a compelling narrative for your brand with this vibrant brand strategy presentation template. Designed to cover every facet of brand development, from vision and mission to market analysis and consumer personas, this template is an essential tool for businesses looking to establish a strong brand identity. It incorporates visually engaging slides that outline brand voice, values, and touchpoints, facilitating a thorough understanding of strategic branding. Compatible with platforms like PowerPoint, Google Slides, and Keynote, it is accessible across various devices, making it perfect for collaborative planning and presentations.


6 slides
Organizational Mind Mapping Slide Presentation
Bright ideas deserve a space to grow, and this presentation turns complex thoughts into a clean, organized visual map. It helps teams outline processes, connect concepts, and structure information with clarity and flow. Perfect for planning or strategy sessions. Fully compatible with PowerPoint, Keynote, and Google Slides.


4 slides
Strategic Business Plan Presentation
Bring your long-term vision to life with a clean, modern presentation that turns complex planning into an easy-to-follow growth path. This layout helps you explain goals, strategies, and key steps with clarity and confidence. Fully editable and compatible with PowerPoint, Keynote, and Google Slides.


10 slides
Step-by-Step Customer Lifecycle
Clearly outline each phase of your customer journey with the Step-by-Step Customer Lifecycle Presentation. This slide template features a circular flow layout with five distinct stages, making it ideal for showcasing onboarding, engagement, retention, and loyalty strategies. Customize the icons, titles, and descriptions to match your brand message. Fully editable in PowerPoint, Keynote, and Google Slides.


7 slides
Financial Health and Budget Planning Presentation
Present your budgeting journey with clarity using the Financial Health and Budget Planning Presentation. This slide features a horizontal flow diagram with six editable steps—perfect for outlining savings strategies, expense tracking, or financial goals. Each icon-based block helps highlight key actions. Fully customizable in PowerPoint, Canva, and Google Slides.