


Features
- 5 Unique slides
- Fully editable and easy to edit in Microsoft Powerpoint, Keynote and Google Slides
- 16:9 widescreen layout
- Clean and professional designs
- Export to JPG, PDF or send by email


Do you have any questions?
Recommend


7 slides
Corporate Training Infographic
Enhance your corporate training program with our engaging Infographic, designed to succinctly communicate the key elements of effective employee development. Ideal for HR managers and corporate trainers, this Infographic provides a visual summary of training strategies and success metrics. Our Corporate Training Infographic includes sections on training goals, interactive learning approaches, progress tracking, and feedback collection. It's crafted to facilitate quick comprehension and retention of corporate training concepts, making it a perfect tool for internal communication and team meetings. The customizable layout allows you to highlight specific training outcomes, participant engagement, and the benefits of ongoing professional development. This SEO-friendly Infographic is tailored to attract professionals focused on boosting their team's performance and skills. Implement our Infographic to streamline your training processes and showcase the value of learning and development within your organization.


5 slides
Project Management Framework
Guide your team through every project phase with this step-by-step framework presentation. Designed with a five-stage visual flow, this layout helps clearly communicate key milestones, tasks, and deliverables. Each stage is color-coded for easy tracking and includes editable text and icons. Perfect for planning, strategy, and agile workflows. Fully compatible with PowerPoint, Keynote, and Google Slides.


26 slides
E-commerce Presentation
Venture into the digital marketplace with a presentation template that embodies the innovative spirit of e-commerce. This template, with its vibrant colors and modern design elements, is tailored to highlight the fast-paced world of online retail. The slides offer a digital storefront for your ideas, from introducing the creative minds behind the operation to showcasing the latest trends in online shopping. Utilize engaging layouts to compare products, outline sales strategies, or highlight consumer behavior with clear, concise infographics. With promotional slide options to announce special deals and a design that captures the convenience and excitement of shopping with a click, this collection is an essential tool for marketers, online retailers, and startups. It’s optimized for conveying complex data in a user-friendly format, ensuring your audience stays engaged and informed. Compatible with PowerPoint, Keynote, and Google Slides, it’s the perfect cart to carry your message in the bustling online marketplace.


7 slides
Process Explorer Infographic
Delve deep into workflow intricacies with our process explorer infographic. Set on a spotless white backdrop, amplified by the energy of orange, the clarity of yellow, the evolution of green, the depth of blue, and the foundation of grey, this template meticulously illustrates the multifaceted dimensions of processes. Garnished with sharp infographics, symbolic icons, and fitting image placeholders, it navigates through the pathways of methodological implementations. Perfectly crafted for Powerpoint, Keynote, or Google Slides. A treasure for operations managers, workflow analysts, project supervisors, or any entity intent on process optimization.

20 slides
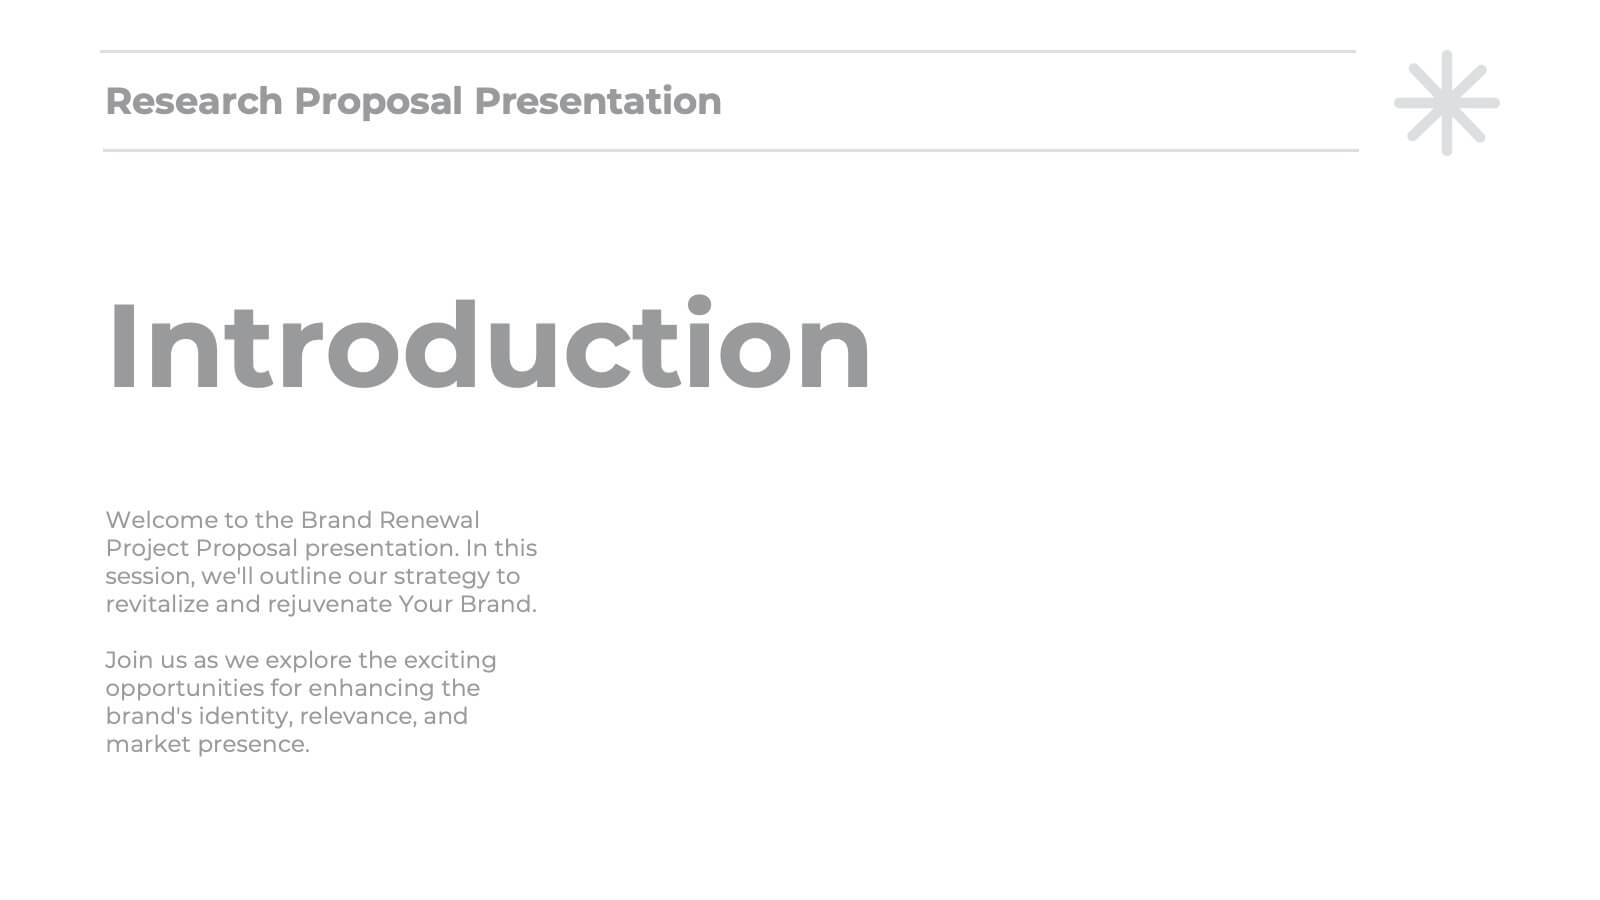
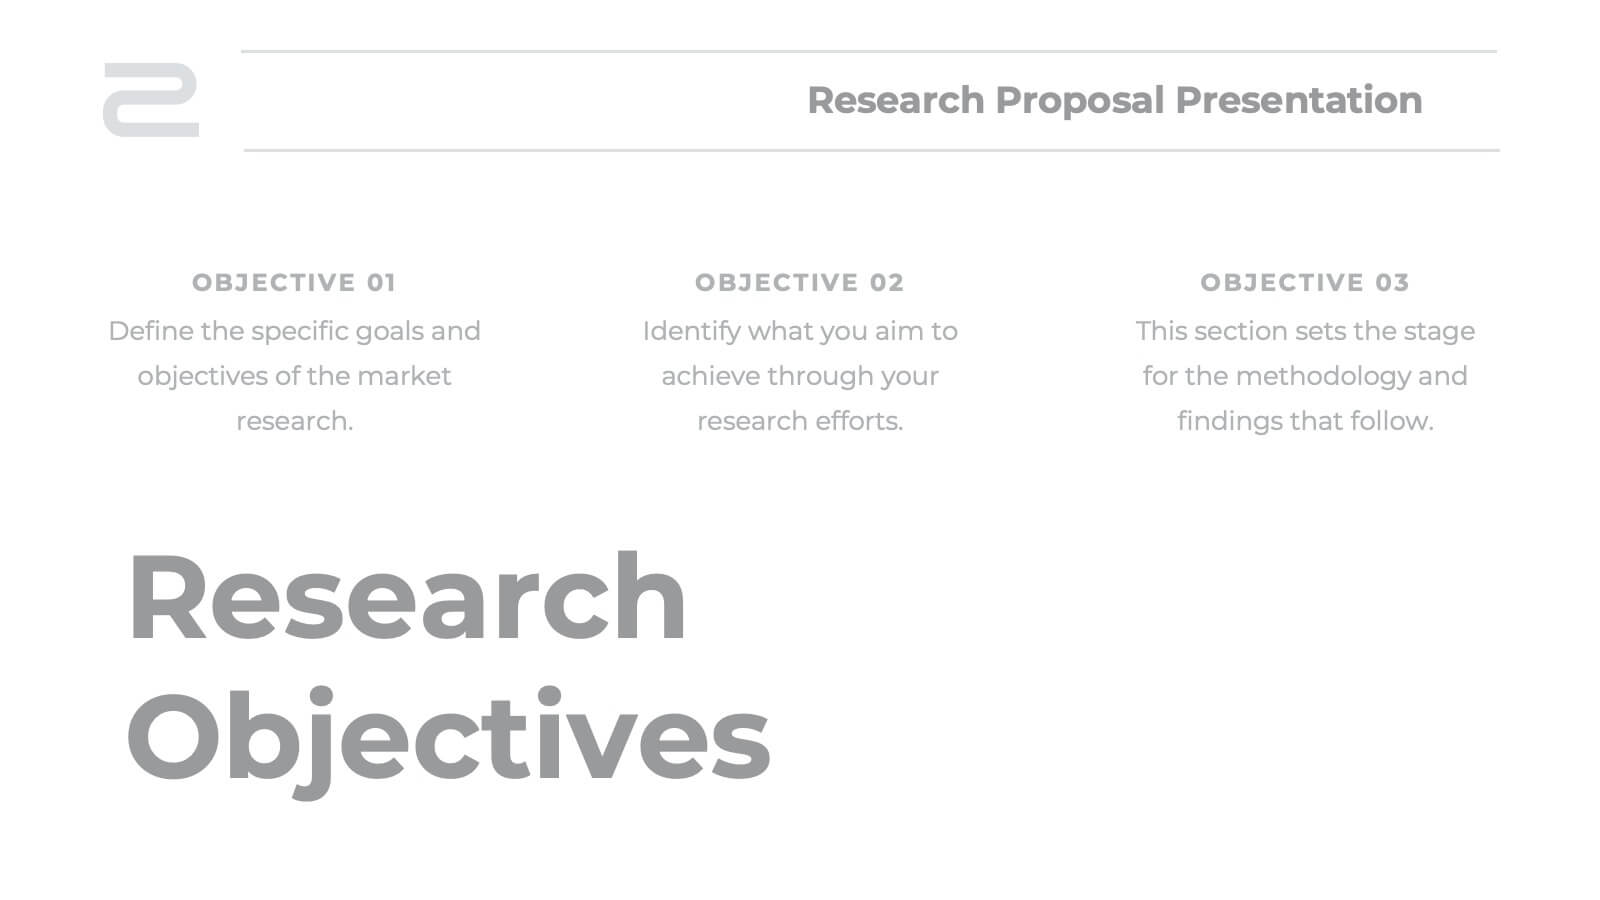
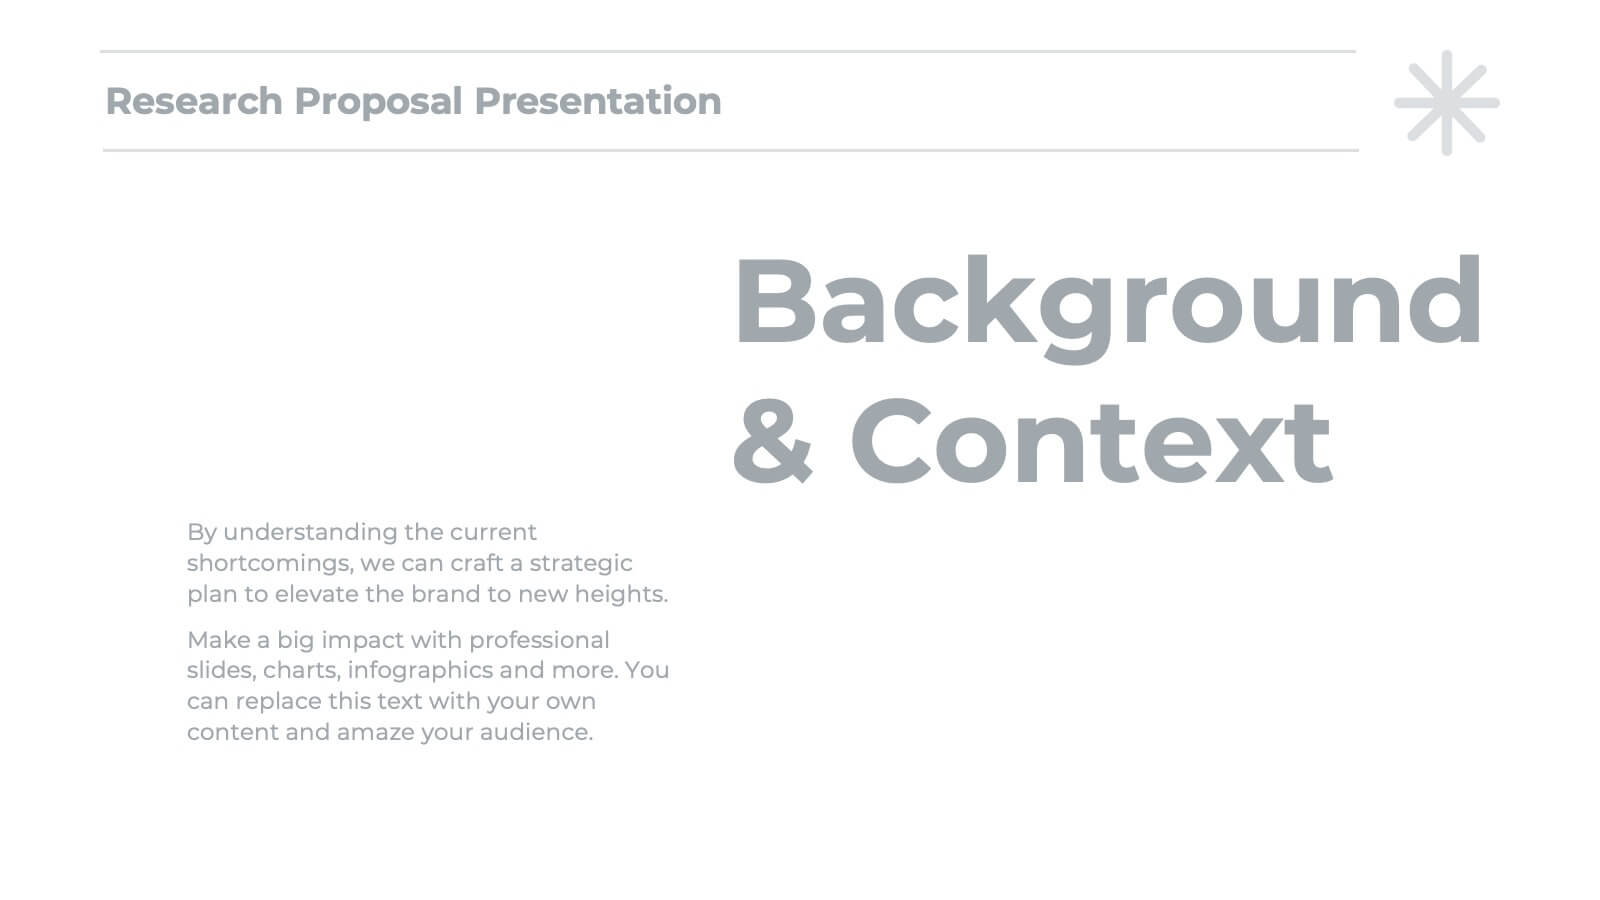
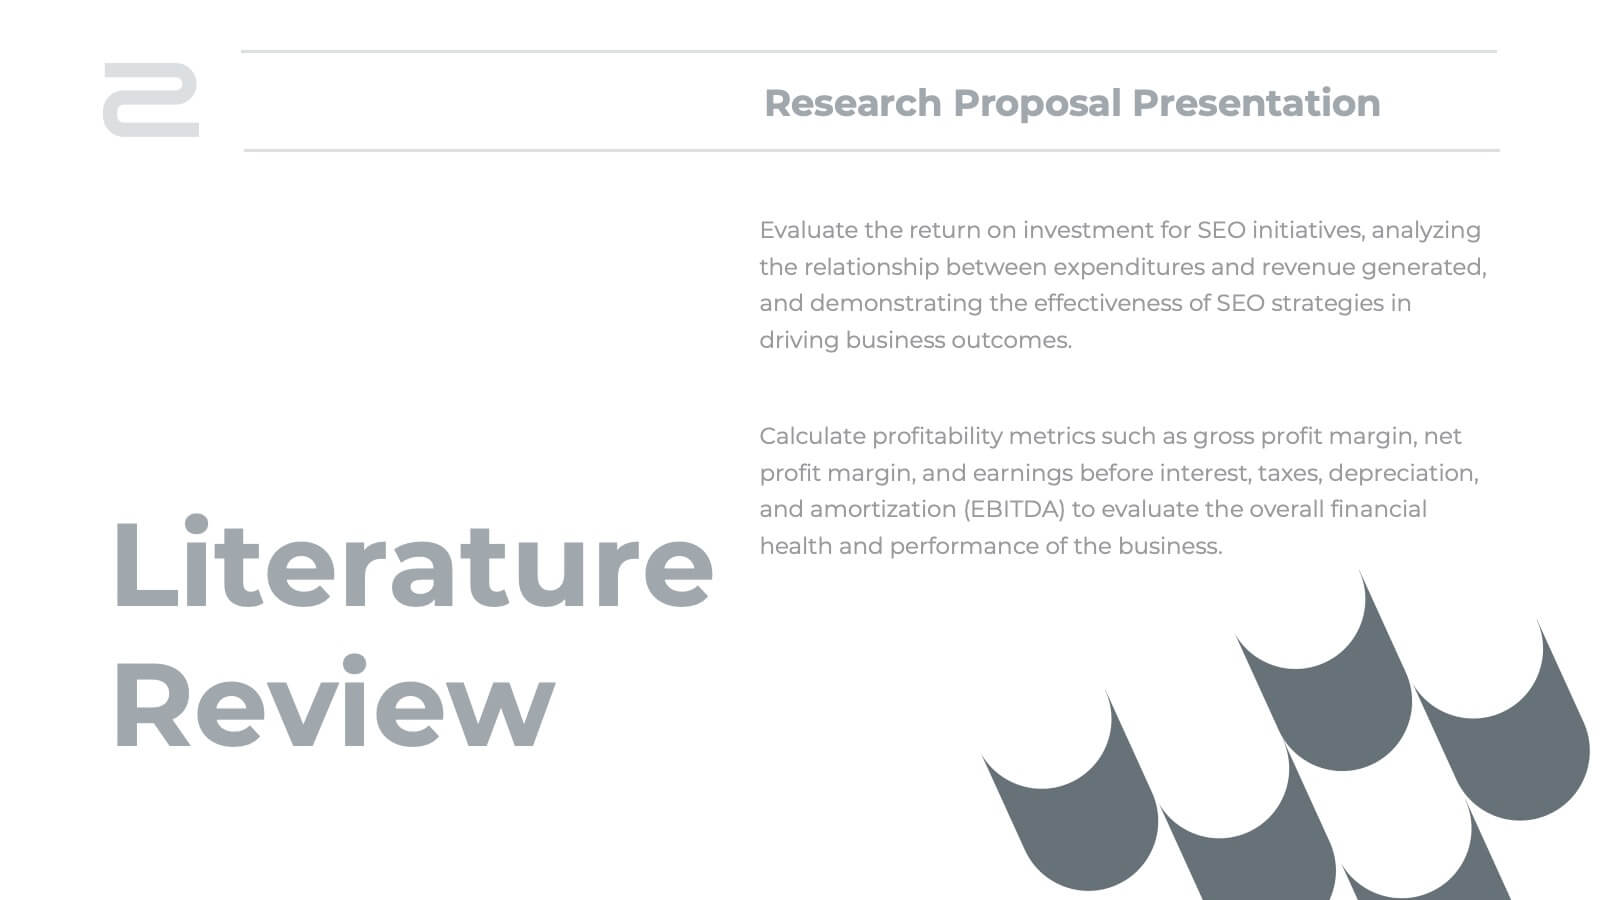
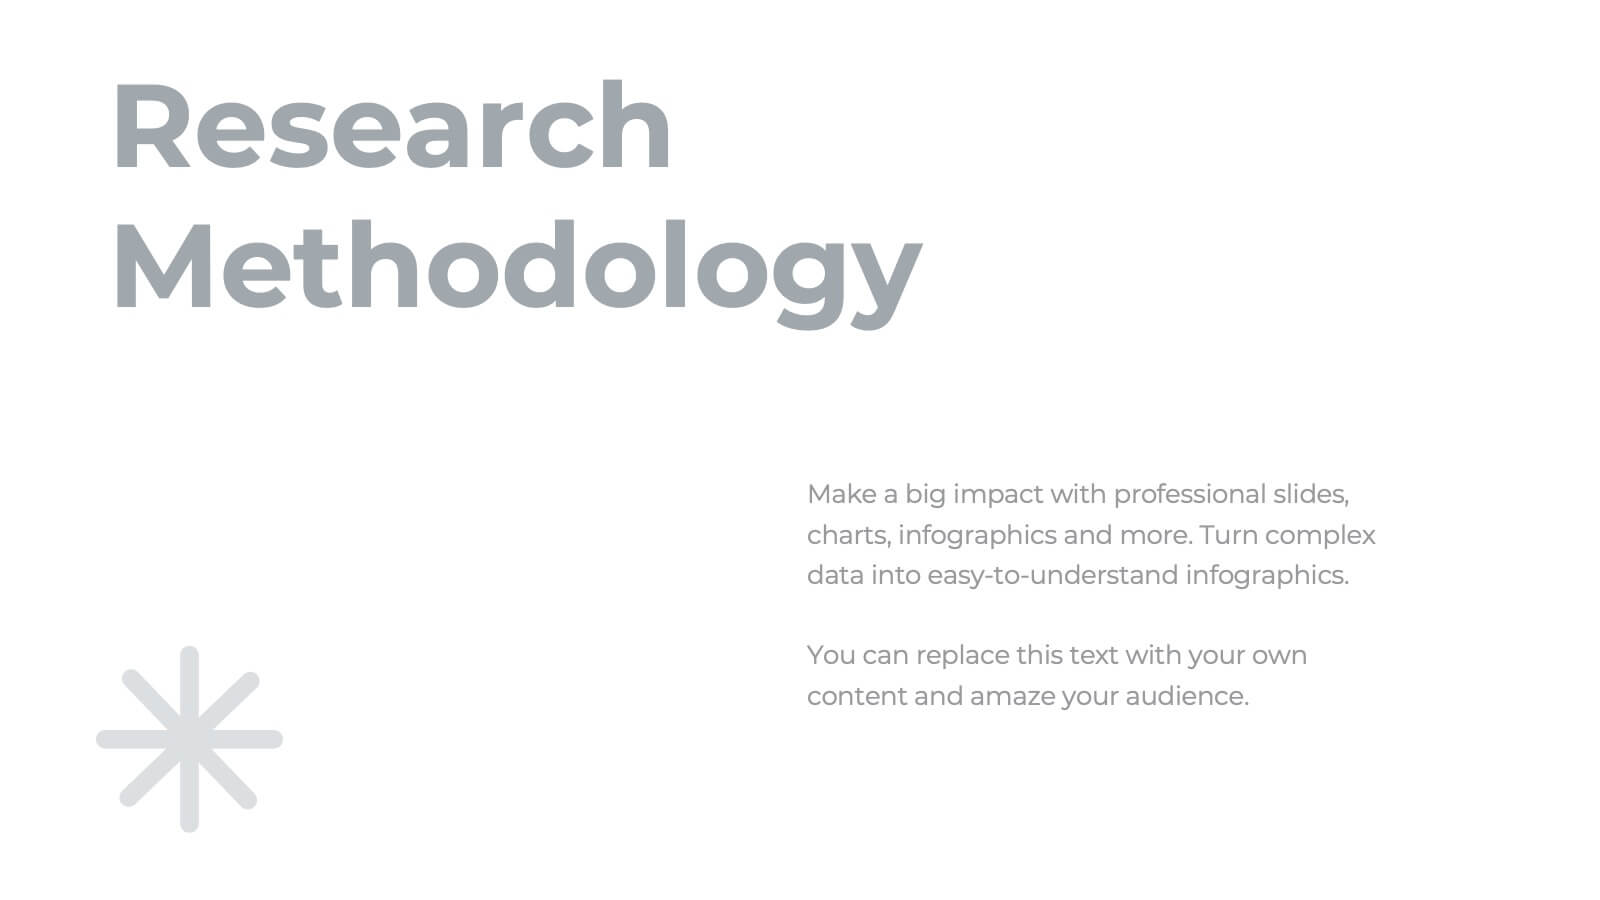
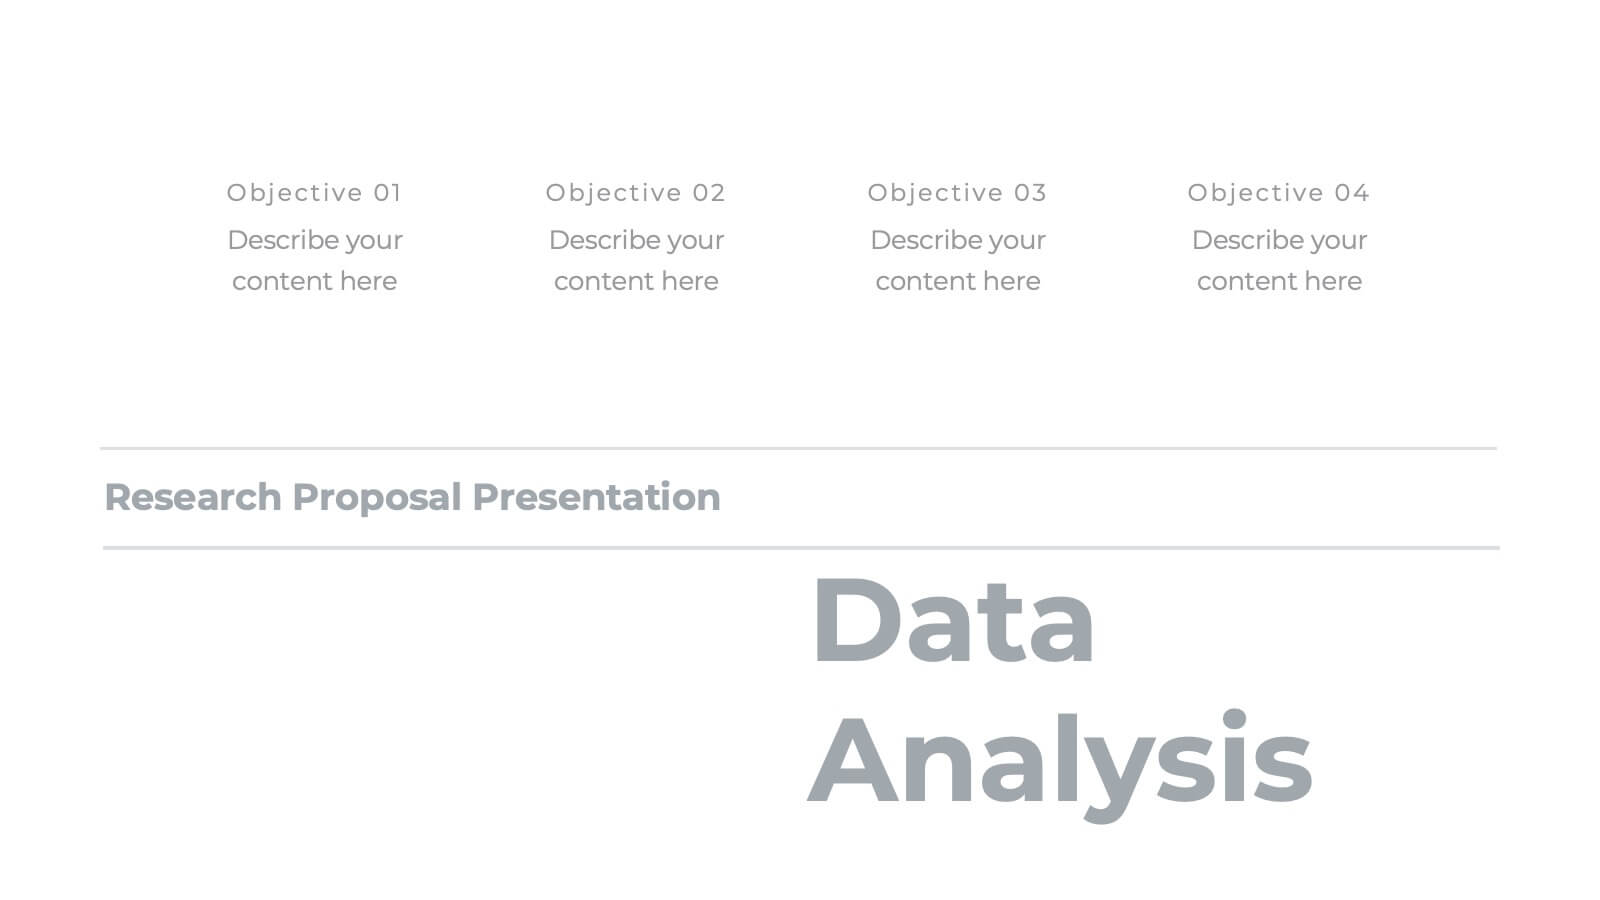
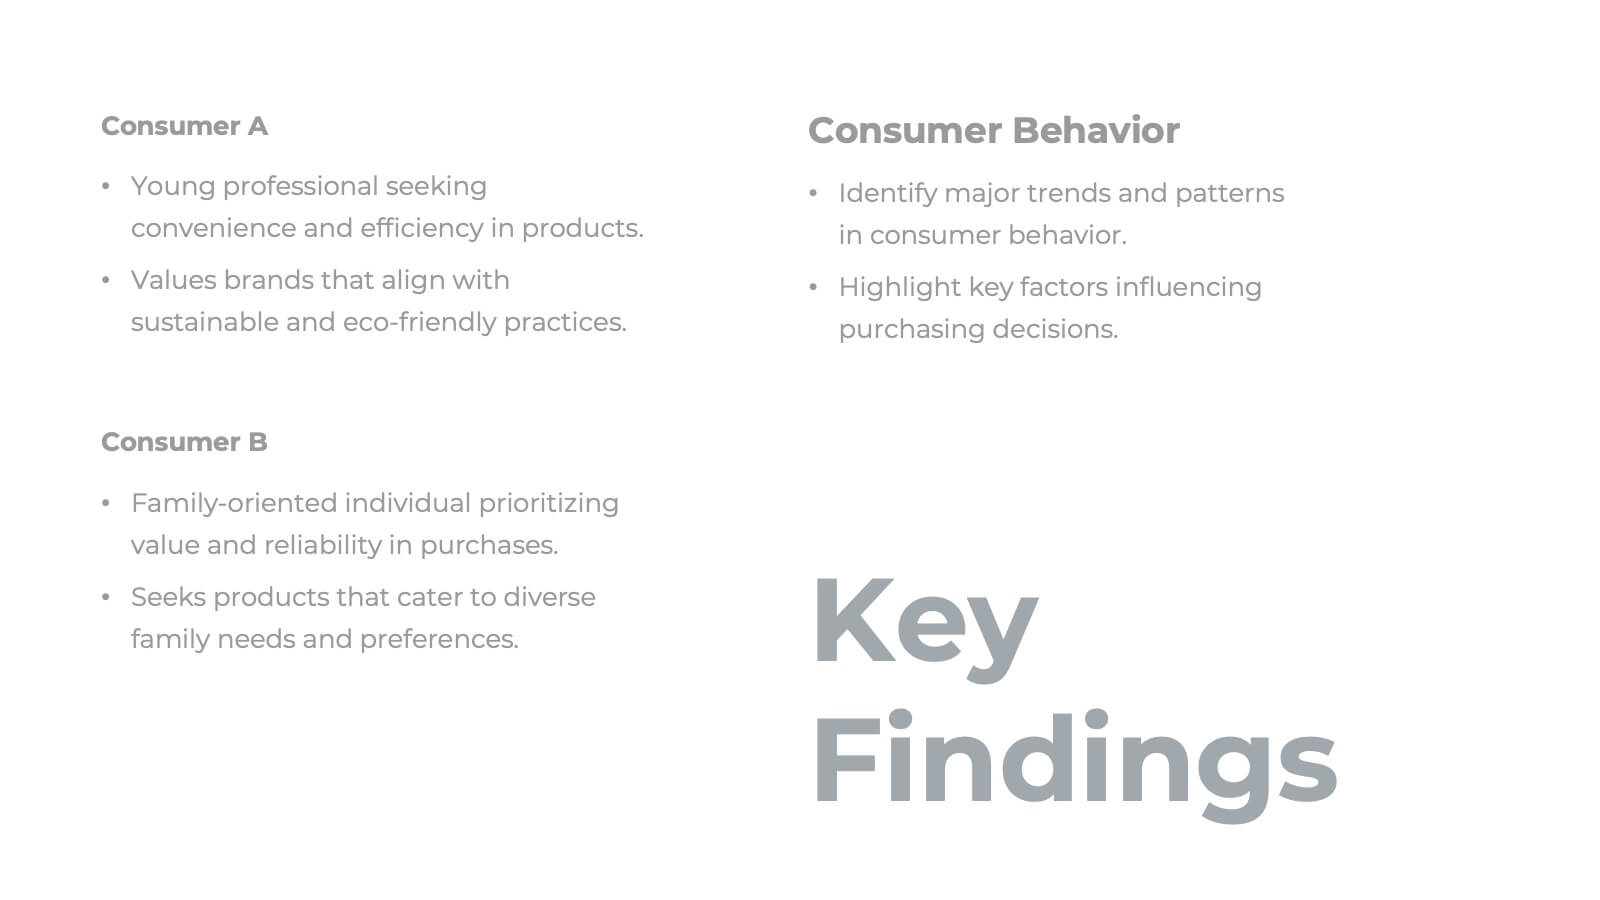
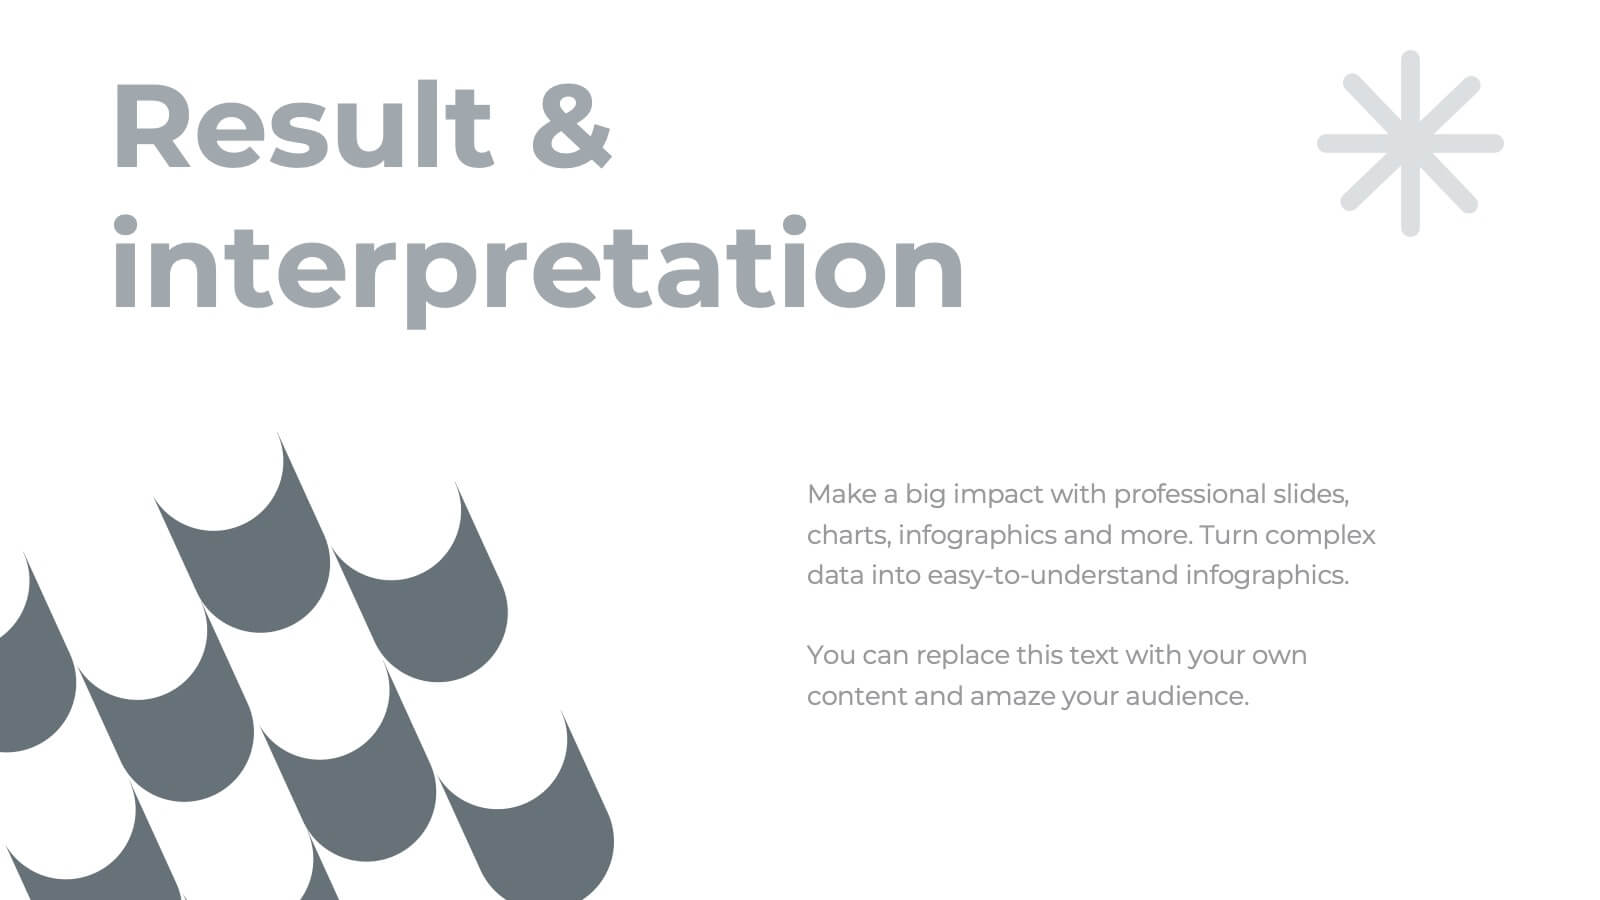
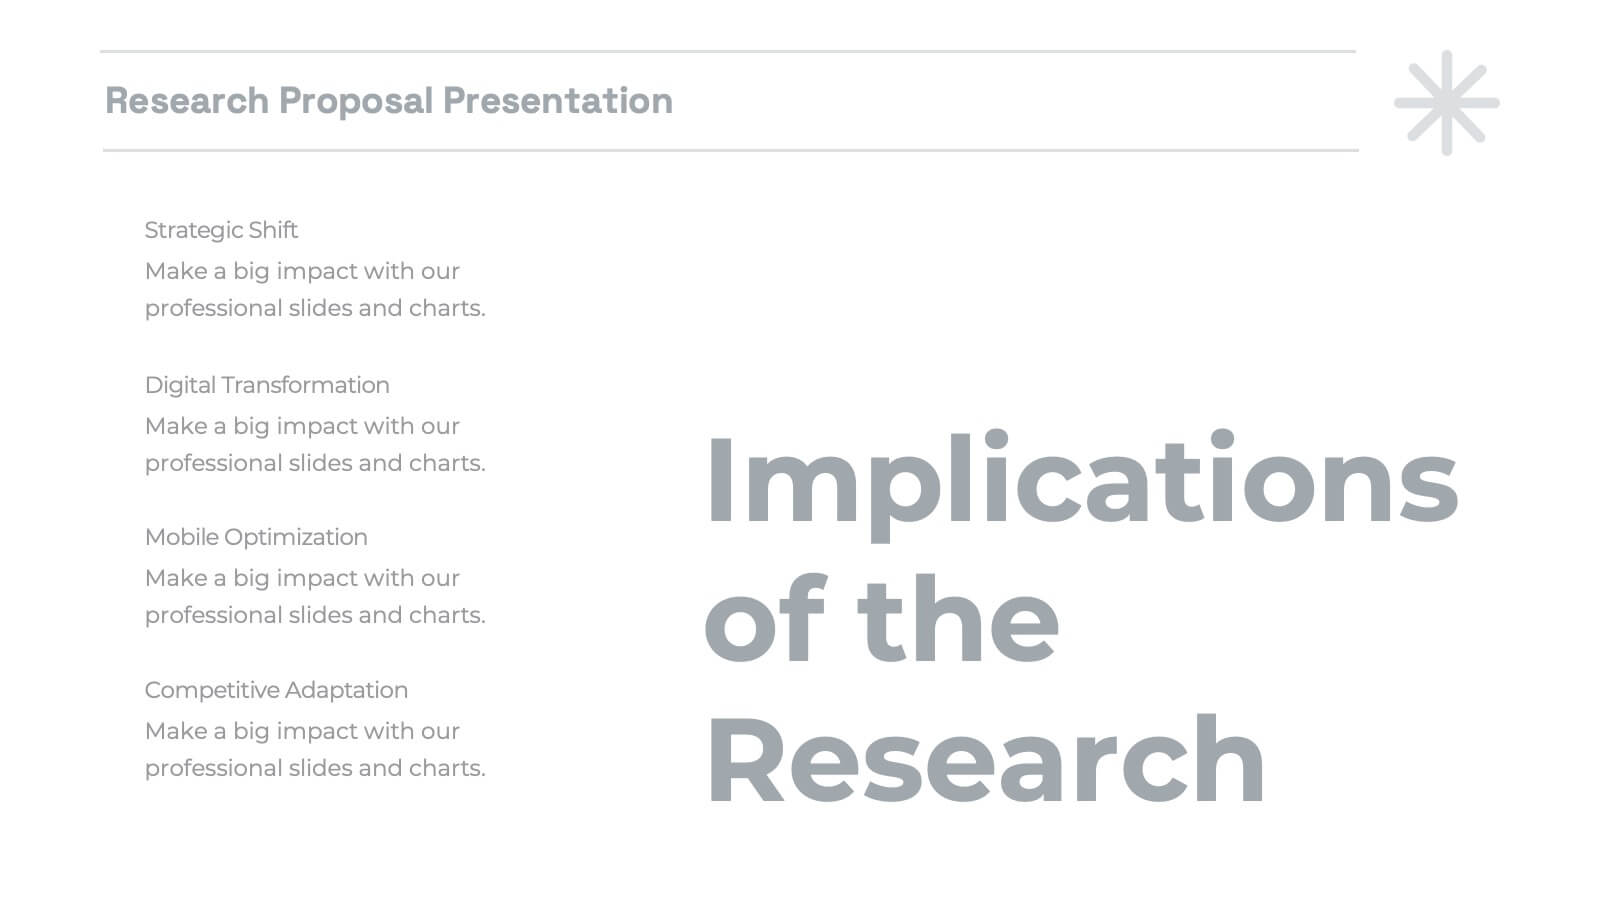
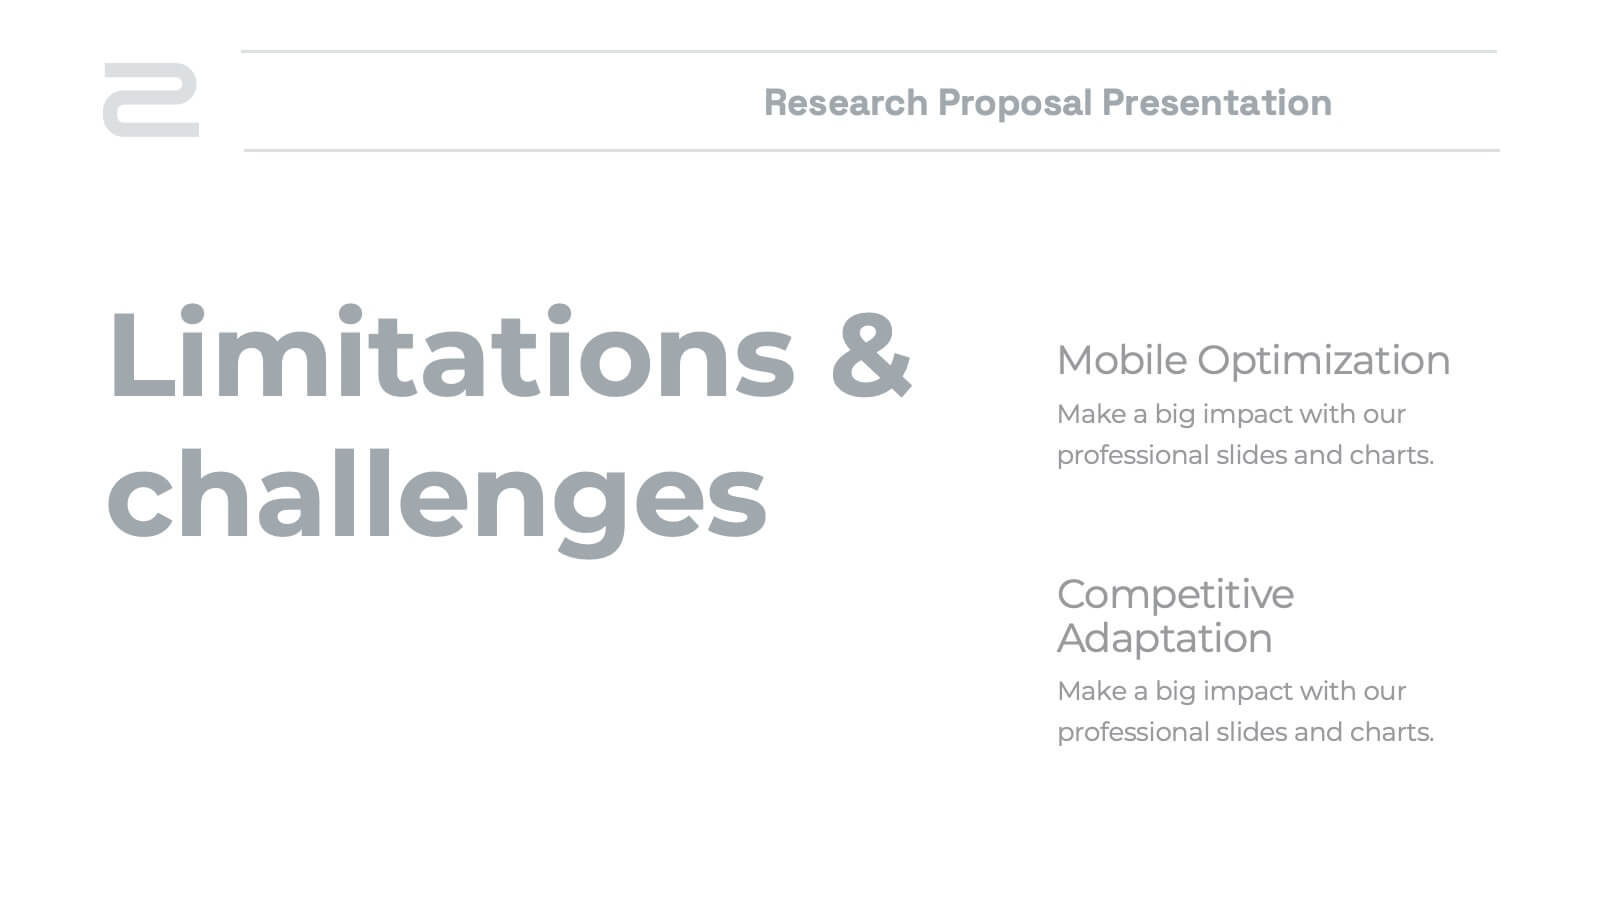
Malachite Research Proposal Presentation
Present your research findings with clarity and professionalism using this structured research presentation template! Covering all essential elements, from research objectives and methodology to key findings and implications, this template ensures your work is communicated effectively. It's perfect for academic, corporate, or scientific presentations. Compatible with PowerPoint, Keynote, and Google Slides, it's versatile and ready for your next project.


5 slides
Problem-Solving and Risk Navigation Presentation
Navigate uncertainty with clarity using the Problem-Solving and Risk Navigation presentation. This slide features a winding, color-coded path that visually represents each step in a complex decision-making process—from initial analysis to final action. Each of the five stages is marked with an arrow and an icon for intuitive storytelling. Ideal for strategy meetings, risk management workshops, or project reviews. Fully editable in PowerPoint, Keynote, and Google Slides.


20 slides
Sphene Sales Proposal Presentation
Take your sales pitch to the next level with this elegant and structured presentation template! Featuring sections on sales objectives, process, pricing strategies, and performance metrics, this template is ideal for impressing potential clients and closing deals. It’s easy to customize and works seamlessly with PowerPoint, Keynote, and Google Slides for hassle-free presentation creation.


5 slides
Target Market and Audience Segmentation Presentation
Identify and engage your ideal audience with the Target Market and Audience Segmentation presentation. This clear, timeline-style infographic uses a bullseye layout to highlight key market segments and their progression. Ideal for marketing strategies, customer profiling, and campaign planning. Fully customizable in Canva, PowerPoint, and Google Slides.


6 slides
International Business Operations Layout Presentation
Showcase your company’s global workflow with this international operations map. Featuring a step-by-step arrow layout and matching location markers, it’s perfect for visualizing supply chains, regional tasks, or expansion strategies. Easily customizable and ideal for executive briefings, logistics updates, and global strategy decks. Compatible with PowerPoint, Keynote, and Google Slides.


5 slides
Political Campaign Marketing Infographics
A political campaign is a strategic effort undertaken by individuals, political parties, or interest groups to influence public opinion and win the support of voters during elections or on specific policy issues. These vertical infographics are designed to assist political candidates, campaign managers, and political organizations in effectively conveying their messages and strategies to the public. This template is ideal for political campaigns seeking to engage voters, raise awareness about their platform, and showcase their marketing efforts. The template utilizes eye-catching infographics to present campaign statistics, polling data, and performance metrics.


24 slides
Catalyst Strategic Planning Report Presentation
Unleash your strategic vision with the Catalyst Strategic Planning Report template! This vibrant and dynamic layout is designed to make your strategic planning presentations not only effective but also visually captivating. The template’s playful yet professional design elements, including bold color blocks and creative graphics, draw attention to key points, ensuring your message resonates with your audience. From SWOT analysis to market trends, and resource allocation to action plans, every slide is crafted to communicate your strategic objectives clearly and compellingly. Perfect for business reviews, strategic meetings, or investor presentations, this template allows you to present data-driven insights and actionable steps in an engaging manner. It’s fully customizable, making it easy to adapt to your brand’s colors and style. Whether you’re presenting to a team or stakeholders, the Catalyst template provides the perfect platform to articulate your vision. Compatible with PowerPoint, Keynote, and Google Slides, it’s your go-to tool for impactful strategic presentations!


2 slides
Mobile and Laptop Mockup Devices Presentation
Showcase your designs with the Mobile and Laptop Mockup Devices presentation template. Featuring clean and modern device frames, this slide helps you present responsive web designs, app interfaces, or digital content seamlessly. Ideal for designers, marketers, and tech presentations. Fully editable and compatible with PowerPoint, Keynote, and Google Slides.


6 slides
Project Status Dashboard Infographic
"Project status" refers to the current state or progress of a project at a specific point in time. This infographic template provides an overview of the project's accomplishments, milestones achieved, and any potential issues or challenges that may have arisen during its execution. This well-designed project status infographic serves as a quick reference guide for your audience to understand a project's overall health, progress, and potential challenges. Compatible with Powerpoint, Keynote, and Google Slides. The use of icons, images, and graphics help enhance engagement. The incorporation of charts and graphs present quantitative information.


6 slides
RAPID Roles and Responsibilities Slide Presentation
Make teamwork crystal clear with a structured chart that defines who does what and when. This organized layout helps map decision-making roles, streamline collaboration, and prevent confusion in complex projects. Easy to edit and ready to use, it’s fully compatible with PowerPoint, Keynote, and Google Slides for smooth customization.


5 slides
Climate Change Impacts Infographics
Climate Change refers to long-term shifts in temperature, precipitation patterns, wind patterns, and other aspects of the Earth's climate system. These infographic templates are perfect to educate and raise awareness about the impacts of climate change on our planet. These templates are suitable for environmental organizations, educators, or anyone seeking to convey the urgency and significance of addressing climate change. The compelling visuals, data-driven content, and clear messaging, in these templates aims to educate and inspire individuals to contribute to global efforts to address climate change and protect our planet's future.


10 slides
Customer Survey Feedback Insights Presentation
Highlight key takeaways from your reviews with the Customer Survey Feedback Insights Presentation. This sleek layout uses a vertical timeline with icons and star ratings to present customer input clearly and professionally. Ideal for showcasing survey results, testimonials, or product improvement insights. Fully editable in Canva, PowerPoint, Google Slides, and Keynote.


25 slides
The Power of HIIT Presentation
Supercharge your fitness routine with this high-energy presentation on the power of HIIT. Covering key benefits like fat burning, muscle endurance, metabolism boost, and time-efficient workouts, this template helps break down the science behind high-intensity interval training. Fully customizable and compatible with PowerPoint, Keynote, and Google Slides for a seamless presentation experience.