


Features
- 6 Unique slides
- Fully editable and easy to edit in Microsoft Powerpoint, Keynote and Google Slides
- 16:9 widescreen layout
- Clean and professional designs
- Export to JPG, PDF or send by email


Do you have any questions?
Recommend


5 slides
Investor Pitch Slide Deck Presentation
Captivate investors from the first slide with a clean, modern design that showcases your business idea, traction, and vision with clarity. This presentation helps you structure key points effectively for funding discussions. Fully customizable and compatible with PowerPoint, Keynote, and Google Slides for a seamless pitching experience.


7 slides
Marketing Team Infographic
This collection showcases a series of slides dedicated to optimizing marketing team operations and strategies. Each template is designed to cater to various facets of marketing planning and execution, featuring layouts that help articulate team roles, campaign timelines, budget allocations, and performance metrics. The slides incorporate diverse visual elements, such as hierarchical diagrams, flow charts, and graphs, to ensure complex information is accessible and engaging. Customizable color palettes and design elements allow for seamless integration into existing corporate branding, making these templates not only functional but also aesthetically aligned with company standards. Ideal for marketing strategy presentations, team meetings, and stakeholder briefings, these slides facilitate a comprehensive overview of marketing efforts, pinpointing achievements and areas for improvement. The adaptability of these templates makes them an essential tool for marketing professionals aiming to communicate effectively and drive results.


6 slides
Network Solution Infographic
Network Solution refers to a system of interconnected components or entities that work together to achieve a specific purpose, whether that's communication, collaboration, or something else. This infographic template can be a powerful way to visually represent various aspects of a network, whether it's a computer network, social network, or any interconnected system. This is fully customizable and compatible with Powerpoint, Keynote, and Google Slides. This allows you to keep the infographic visually appealing, informative, and easy to understand. The goal is to help your audience grasp complex network concepts at a glance.


20 slides
Venus Design Proposal Presentation
Present your design proposal with confidence using this sleek and professional layout! It includes everything from problem statements and proposed solutions to budget breakdowns, milestones, and team expertise, ensuring every detail is covered. Ideal for client presentations or internal project pitches, this template is fully compatible with PowerPoint, Keynote, and Google Slides.


6 slides
Agile Development Methodology Infographic
Discover a visually engaging way to present the Agile Development Methodology with our versatile infographic template. Perfect for Powerpoint, Google Slides, and Keynote users, this template breaks down complex Agile concepts into easy-to-understand visuals. Whether you're illustrating the cycle of sprints, the importance of daily scrums, or the process of backlog refinement and reviews, our infographic makes it simple. It’s ideal for project managers, agile coaches, scrum masters, and team members looking to communicate the flexibility and dynamics of Agile workflows. Adopt a clear, concise approach to explaining iterative development and foster a better understanding in your audience with this user-friendly template.


5 slides
Side-by-Side Features Comparison Presentation
Clearly compare product or service features with the Side-by-Side Feature Comparison Presentation. This layout is perfect for showcasing pros and cons, plan differences, or feature breakdowns across two options. With a clean visual structure and customizable labels, it's ideal for decision-making slides. Compatible with Canva, PowerPoint, Keynote, and Google Slides.


7 slides
Growth Challenges Infographic
Navigating the path to success often involves understanding both growth and challenges. The growth challenge infographic, adorned in refreshing shades of green, white, and blue, provides an intuitive representation of these dual trajectories. Whether you're a startup striving for market traction or an established entity mapping out expansion strategies, this template crystallizes your journey. Business analysts, strategy consultants, and team leads will find this tool invaluable for driving insights and fostering discussions. Enhanced for compatibility with PowerPoint, Keynote, and Google Slides, this infographic is your visual ally in narrating business tales.


7 slides
Roadmap Infographic Presentation Template
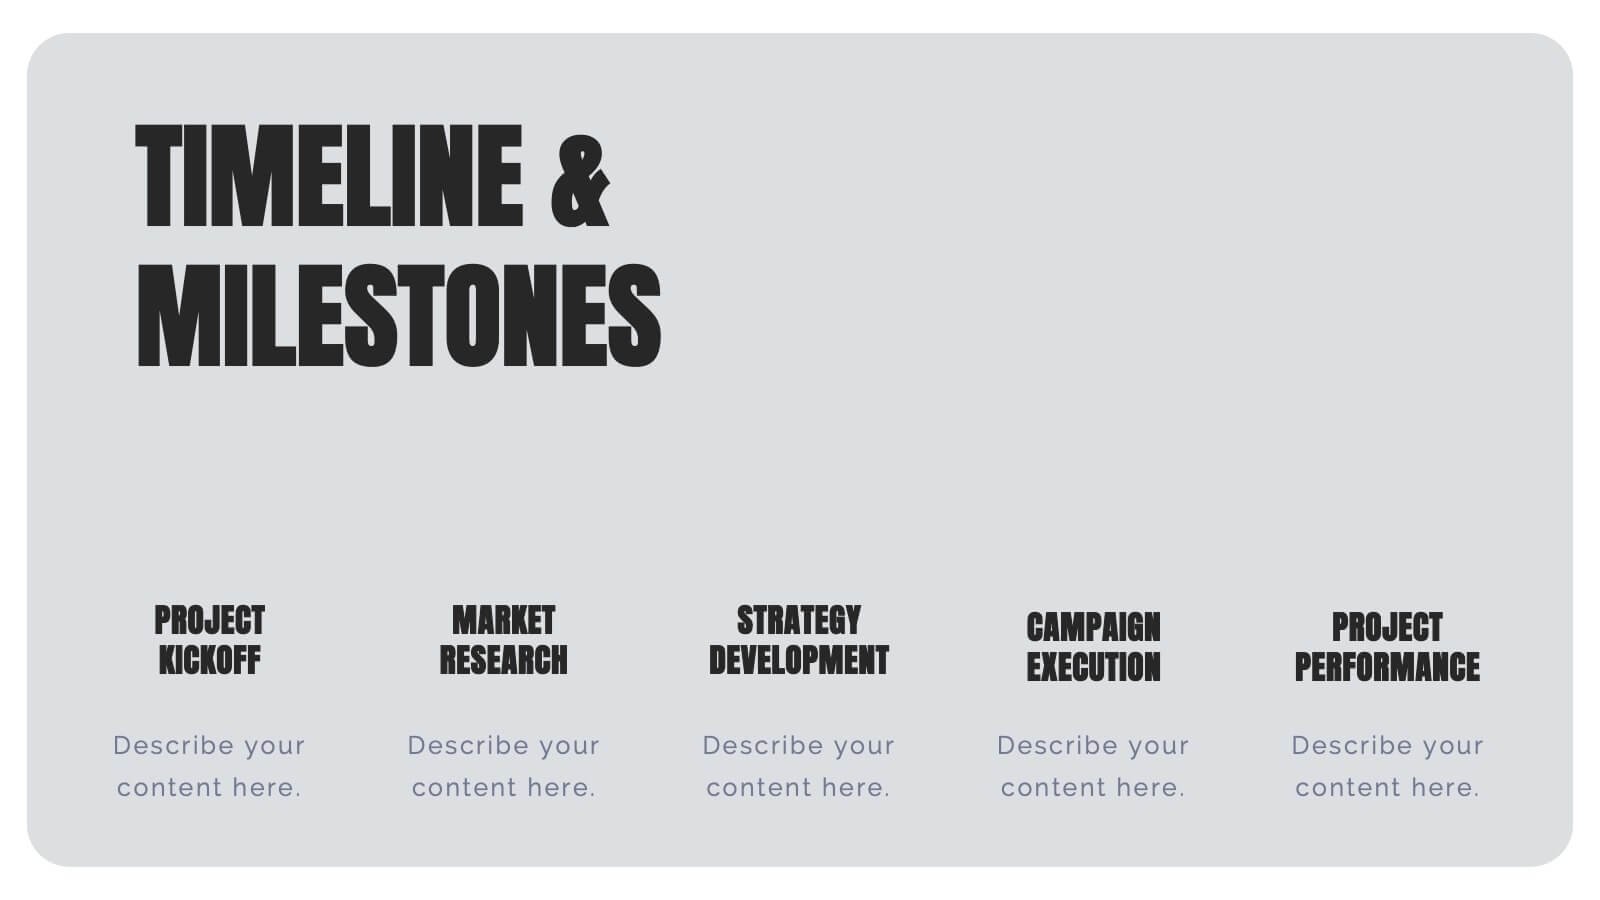
A Roadmap Infographic is a visual representation of a plan or strategy for achieving a specific goal or set of goals. It includes a timeline and a series of steps or milestones that need to be accomplished in order to reach the final destination. This template is perfect for showing your plan or strategy in a fun and interactive way. This template includes lots of photo layouts and different types of charts that you can customize with your own information. Use this roadmap infographic template to show the progress of a project, the steps in a process, or the timeline for a product launch.


4 slides
Market Research Survey Insights Presentation
Showcase key data from your latest research with this bold, megaphone-themed survey slide. Ideal for presenting percentages and key findings side-by-side, this layout draws attention to market trends, consumer feedback, or audience segmentation. Fully editable in PowerPoint, Keynote, and Google Slides.


7 slides
6 Steps Circle Diagram
Streamline complex processes with our "6 Steps Circle Diagram" template. This visually appealing infographic elegantly organizes interconnected stages in a circular layout, ideal for outlining workflows, development cycles, or project phases. Each segment is color-coded and provides ample space for detailed descriptions, enhancing the clarity and effectiveness of presentations. This format allows viewers to easily grasp relationships and dependencies, improving comprehension and retention. Perfect for educators, project managers, and business analysts, this template ensures that all stages are interconnected and clearly communicated. Compatible with PowerPoint, Keynote, and Google Slides, it's a versatile tool for professional and educational environments.


4 slides
Breakthroughs in Scientific Discovery Presentation
Highlight research milestones with this Breakthroughs in Scientific Discovery Presentation Template. Designed with a lab flask graphic that fills up with percentages, this layout is perfect for showcasing progress, success metrics, or phased experimentation. Ideal for researchers, science communicators, and biotech presentations. Fully editable in PowerPoint, Keynote, and Google Slides.


5 slides
Executive Leadership Development Plan
Showcase leadership growth with the Executive Leadership Development Plan Presentation. Designed to visualize a clear progression of skills or initiatives, this four-stage layout uses diagonal segments and icons to represent each development milestone. Ideal for HR, executive coaching, or talent management presentations. Compatible with PowerPoint, Keynote, and Google Slides.


4 slides
Product Launch Schedule Timeline Presentation
Showcase your product rollout with this vertical rocket-themed timeline. Ideal for startups, marketing teams, or product managers, it highlights four key stages with icons and editable text. The cloud-based design adds visual flair while maintaining clarity. Fully customizable in PowerPoint, Keynote, and Google Slides to suit your launch plan.


4 slides
Funding & Investor Startup Presentation
Present your investment strategy with clarity and impact using this triangle diagram slide. Ideal for showcasing the relationship between key funding stages, investor types, or business milestones, this layout offers a clean structure with labeled nodes (A, B, C) and supporting icons. Fully editable in PowerPoint, Keynote, and Google Slides for seamless customization.


16 slides
Professional Presentation
Streamline your project presentations with our Professional Template, meticulously designed to bring your content to life. This template is ideal for professionals looking to present a structured and detailed overview of their projects. Starting with a compelling cover slide, it guides you through defining your problem statement, setting clear objectives, and laying out comprehensive strategies and recommendations. The slides are curated to facilitate a logical flow from an introduction of your project to a detailed implementation plan, visual graphics, and outcome analysis. The key objectives slide is engineered to present your goals with impact, while the strategies and implementation plan slides help articulate the steps towards achieving success. The template concludes with a neat summary slide, a cordial 'Thank You' slide with contact information, and a credits section for source attribution. Fully compatible with PowerPoint, Keynote, and Google Slides, this template is a reliable choice for professionals seeking to convey their message with clarity and confidence.


10 slides
Business Expansion and Growth Path Presentation
Illustrate your company’s strategic milestones with the Business Expansion and Growth Path Presentation. This step-by-step layout is perfect for showcasing phases of development, scaling goals, or startup growth trajectories. Fully customizable in PowerPoint, Keynote, and Google Slides—ideal for business plans, pitch decks, and strategic reviews.


7 slides
Creative Timeline Infographic Presentation Template
A Timeline is an essential tool to illustrate the chronology of events; it also provides a method for organizing and summarizing material. With the timelines provided in this template you will be able to visualize the passage of time, so that you can better understand how influences from the past still impact your life today. This template is designed to assist you with crafting your timeline so that it can be easily understood. The color-coding makes it easy to see daily progress. Use the timelines in this template to create useful visualization, and convey the growth of your business or brand.