


Features
- 5 Unique slides
- Fully editable and easy to edit in Microsoft Powerpoint, Keynote and Google Slides
- 16:9 widescreen layout
- Clean and professional designs
- Export to JPG, PDF or send by email


Do you have any questions?
Recommend


6 slides
Sustainabilitiy Management Goals and Metrics Presentation
Make your sustainability story shine with a clean, modern presentation that highlights environmental goals, measurable results, and ongoing progress. Perfect for communicating corporate impact and performance data with clarity and purpose. Fully customizable and compatible with PowerPoint, Keynote, and Google Slides for a professional and visually engaging delivery.

20 slides
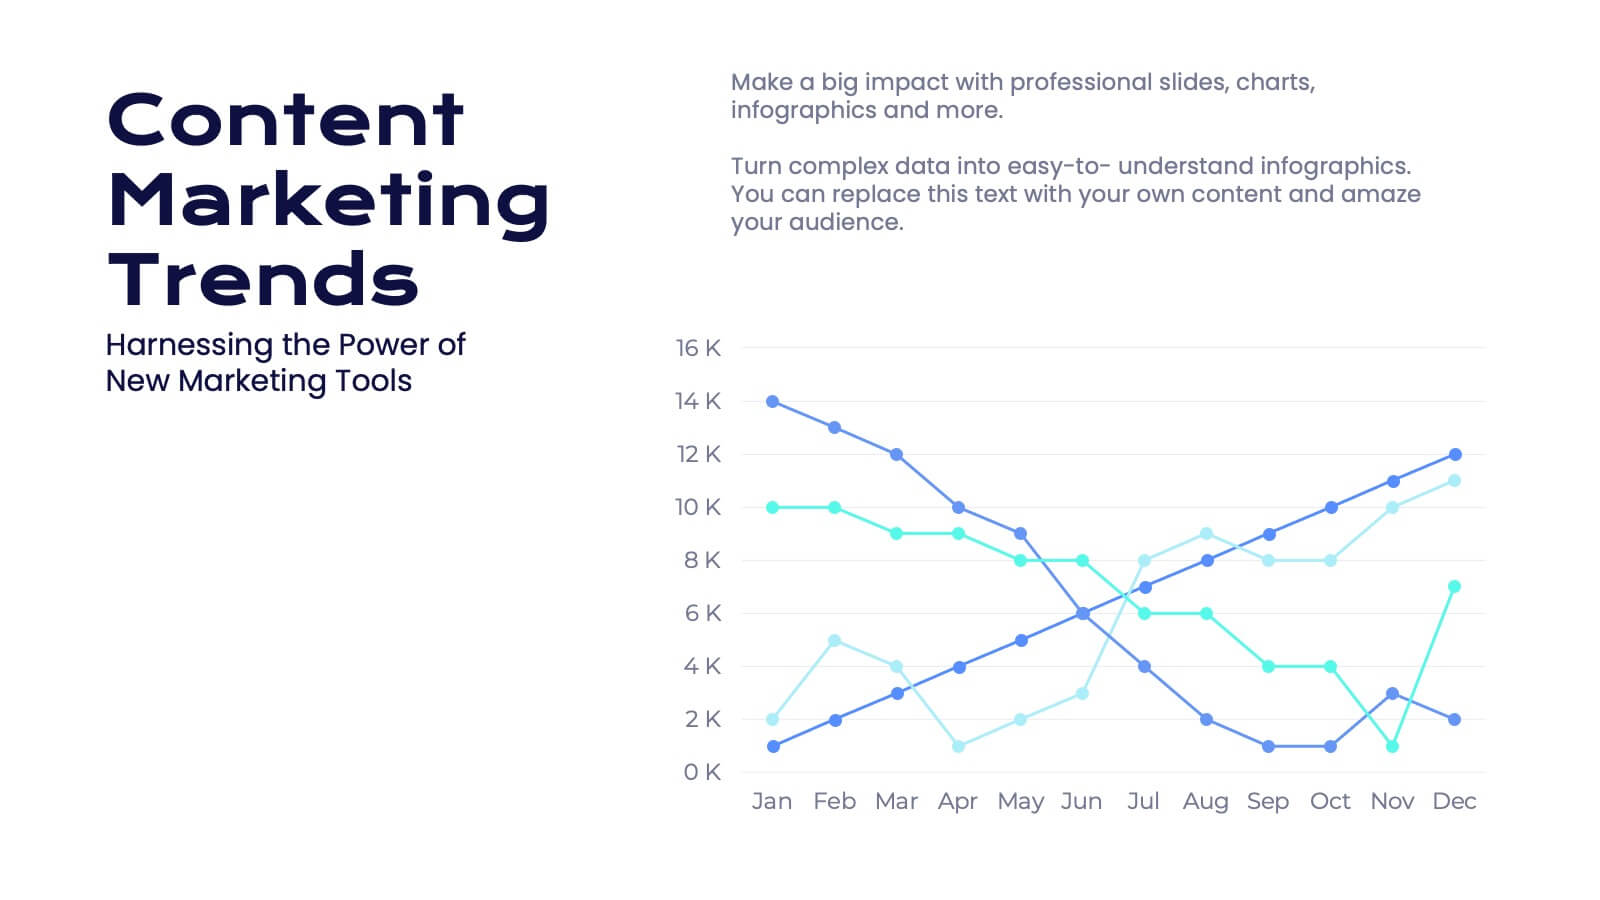
Faerie Digital Marketing Strategy Plan Presentation
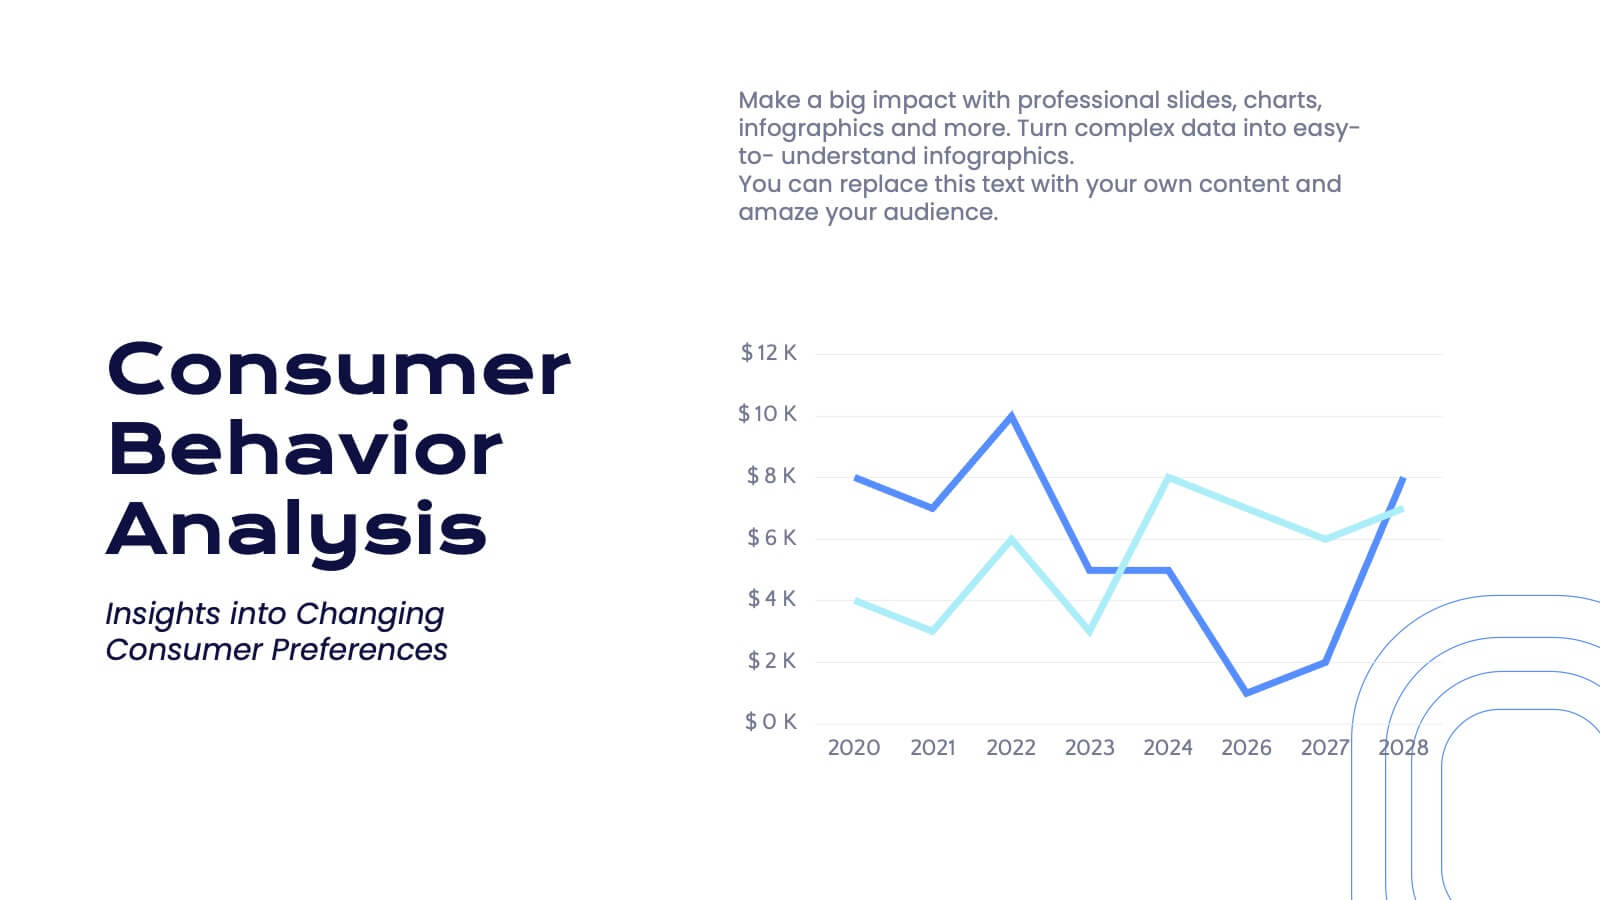
Create a compelling marketing strategy with this sleek, modern template! It covers key topics like consumer behavior, social media strategies, and emerging trends. Perfect for showcasing insights in a clear, data-driven format. Fully customizable, it works seamlessly with PowerPoint, Keynote, and Google Slides for effective presentations.


4 slides
Task List and To-Do Management Presentation
Boost productivity with this engaging task management template. Designed for clear visualization, it helps organize priorities, track progress, and streamline workflows efficiently. Featuring a structured layout, it's perfect for professionals managing daily to-dos, project timelines, or business strategies. Fully compatible with PowerPoint, Keynote, and Google Slides for seamless use.


5 slides
Data Distribution with Pie Chart Visuals Presentation
Visualize complex metrics with ease using the Data Distribution with Pie Chart Visuals Presentation. This slide design integrates a clean side-by-side layout of a colorful pie chart and a five-point legend, making it ideal for showcasing proportions, segments, or performance breakdowns. Each item features an icon and customizable text to clearly label your data points. Perfect for business analysts, marketers, and financial teams, the slide is editable in PowerPoint, Keynote, and Google Slides. It’s a great choice for delivering data-driven insights in a simple, visual format.


5 slides
Alcohol Effects Infographics
Alcohol can have various effects on the body and mind, depending on the amount consumed, the individual's tolerance, and other factors. These unique vertical Infographics provide information about the physical, psychological, and social effects of alcohol use. They are designed to educate people about the risks of drinking too much and the consequences of alcohol abuse. To help you present your data these include statistics, illustrations, and other visual aids to help your audience understand the impact of alcohol on their health. By providing information about the effects of alcohol, this helps people make informed decisions about alcohol use.


5 slides
AI Trends and Innovations Presentation
The "AI Trends and Innovations" presentation template is elegantly designed to help you convey the latest advancements and trends in artificial intelligence. Each slide focuses on different key points such as machine learning, neural networks, robotics, and data analytics, represented by interconnected icons that visually map the flow of information and ideas. This layout is perfect for professionals seeking to illustrate complex AI concepts in a digestible format, making it ideal for educational presentations, tech conferences, or internal company meetings focused on technological growth and innovation.


5 slides
Project Risk Management Framework Presentation
Visualize challenges before they arise with this dynamic framework designed to map, assess, and mitigate project risks efficiently. Its circular layout highlights every critical stage, helping you communicate strategies clearly and professionally. Fully editable and compatible with PowerPoint, Keynote, and Google Slides for effortless customization and presentation flexibility.


5 slides
DMAIC Six Sigma Framework
Visualize process improvement with this clear and structured DMAIC Six Sigma slide. Perfect for business analysts, quality teams, and project managers, it highlights each phase—Define, Measure, Analyze, Improve, and Control—in a streamlined format. Fully editable in PowerPoint, Keynote, and Google Slides.


5 slides
Easy Dinner Recipes Infographics
Easy Dinner Recipes offer a practical solution for busy individuals or those who are new to cooking. These infographic templates offer a practical resource for meal planning and preparation. Its visually appealing design, clear instructions, and organized layout make it easy to follow and implement. Whether for personal use or as a presentation tool in cooking classes this template simplifies the process of discovering and trying out delicious dinner recipes. Use these to provide a collection of quick and delicious dinner recipes. This is designed to make meal planning easier, providing step-by-step instructions, ingredient lists, and visuals.


4 slides
Value Creation Strategy Presentation
Develop impactful strategies with this Value Creation Strategy template. Designed to visualize key business components, it presents a structured approach to innovation, growth, and market positioning. Ideal for corporate planning and investor presentations, this template is fully compatible with PowerPoint, Keynote, and Google Slides for effortless customization.


5 slides
Human Resources Department Infographics
The Human Resources (HR) department is an integral part of an organization, responsible for managing and developing the organization's human capital. These informative infographics aim to provide a comprehensive overview of the functions, roles, and importance of the HR department in managing the organization's workforce. Whether used in HR conferences, employee orientations, or internal communications, this template helps convey crucial information in a visually appealing manner, enhancing understanding for the HR department's role in managing and developing the organization's most valuable asset - its people.


26 slides
Wilten Presentation Template
This template is a design foundation, and has been built with modern esthetic principles. The shapes are organic and earthy, with image place holders to allow customization. Designed for companies that have a strong connection to nature and the aesthetic, who wants to go beyond just being organic. Wilten template allows you to save time while getting the best result possible. A great clean modern template for creative agencies, business or branding deck. Enhance your presentations with this minimalistic design and impress your audience with smart ideas.

21 slides
Mermaid Corporate Strategy Proposal Presentation
Present your corporate strategy with confidence using this sleek, modern proposal template! It covers strategic objectives, market trends, SWOT analysis, and resource allocation, ensuring a comprehensive overview of your plan. Fully customizable and compatible with PowerPoint, Keynote, and Google Slides, this template is ideal for launching new initiatives and achieving business goals.


4 slides
3-Step Supply Chain and Logistics Planning Presentation
Bring your workflow to life with a clean three-stage visual that makes your process feel fast, simple, and smart. This slide helps explain planning steps, logistics timelines, and supply chain actions in a way that’s easy for any audience to follow. Fully compatible with PowerPoint, Keynote, and Google Slides.


3 slides
Workflow Improvement and Progress Chart Presentation
Folders aren't just for files—they’re perfect for ideas too. This visual chart maps out streamlined processes, making it easier to track progress and improve internal workflow. Great for managers and teams, this infographic presentation template is fully compatible with PowerPoint, Keynote, and Google Slides for effortless editing and sharing.


5 slides
Cognitive Psychology Framework Presentation
Unlock insights in the most visual way possible with this bold, brain-powered slide! This presentation template helps simplify complex ideas behind how we think, reason, and remember—perfect for research, education, or team workshops. Fully customizable and compatible with PowerPoint, Keynote, and Google Slides for seamless editing across platforms.


4 slides
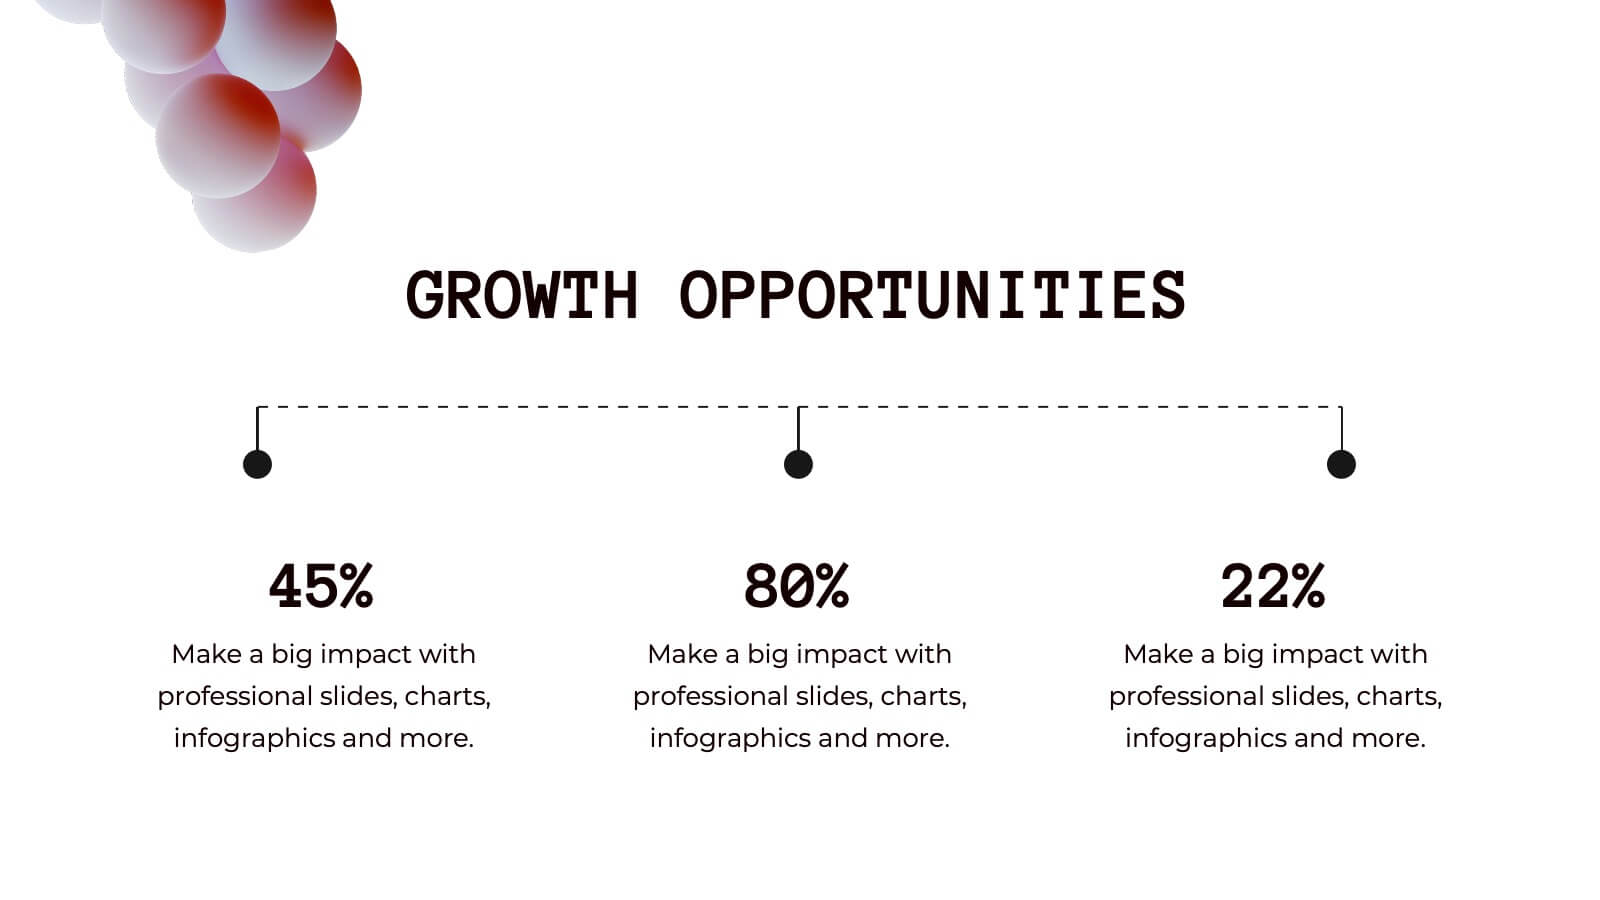
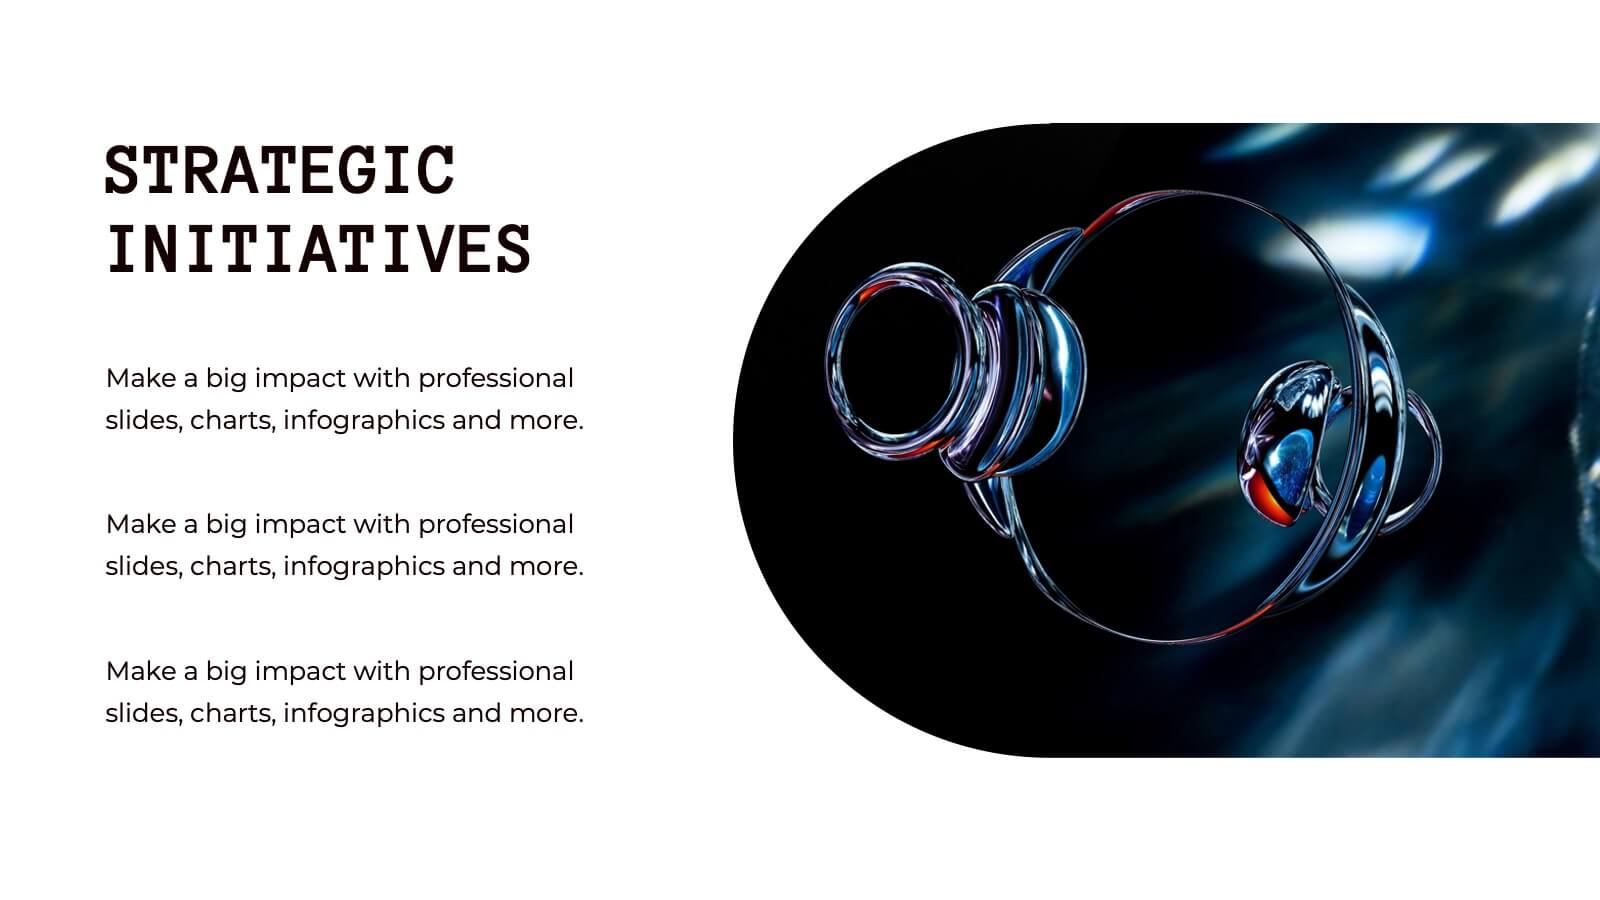
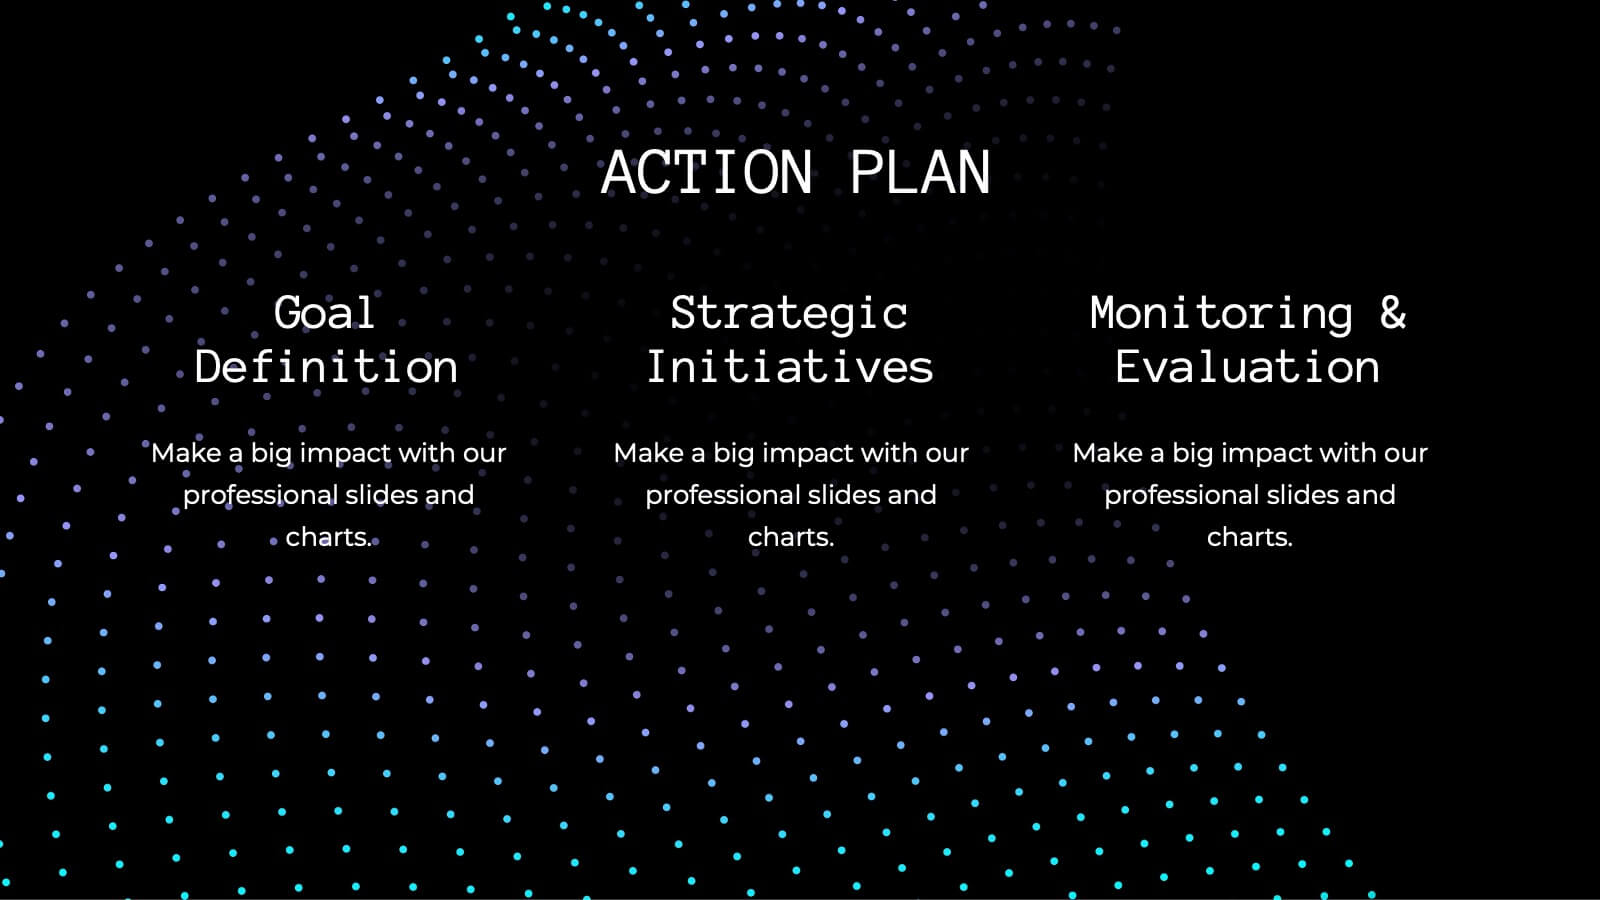
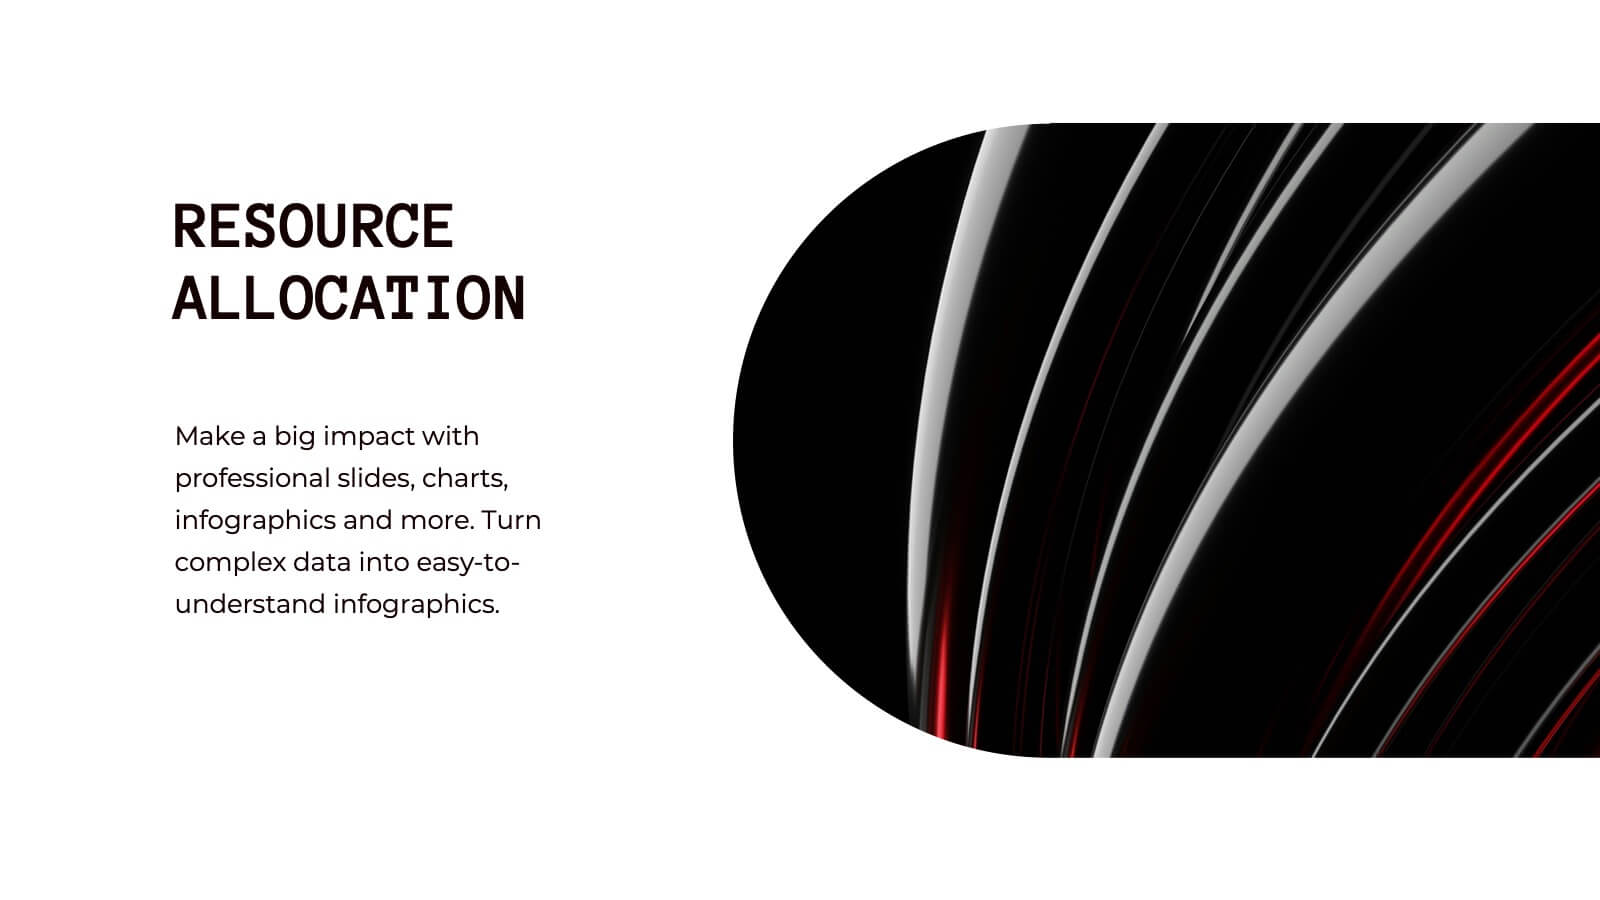
Business Growth and Strategy Plan Presentation
Showcase your company’s path forward with this Business Growth and Strategy Plan Presentation. Designed with a curved arrow layout, it visually maps out three key milestones or initiatives. Ideal for strategic roadmaps, planning sessions, or executive updates. Fully editable in Canva, PowerPoint, or Google Slides.