


Features
- 4 Unique slides
- Fully editable and easy to edit in Microsoft Powerpoint, Keynote and Google Slides
- 16:9 widescreen layout
- Clean and professional designs
- Export to JPG, PDF or send by email


Do you have any questions?
Recommend


21 slides
Nucleus Project Timeline Presentation
Plan with precision using this clean and modern Project Timeline Presentation Template. Highlight key phases, milestones, and deliverables with visually organized sections such as Project Overview, Objectives, Budget Breakdown, Resource Allocation, and Risk Management. Perfect for presenting timelines, evaluation criteria, and next steps to stakeholders. Fully customizable and compatible with PowerPoint, Keynote, and Google Slides.


2 slides
End Slide with Contact and Gratitude Message Presentation
Say goodbye with impact and leave a lasting impression! This clean, modern slide is perfect for ending presentations with a clear contact section and a heartfelt thank-you message. Ideal for client decks, proposals, or reports. Fully compatible with PowerPoint, Keynote, and Google Slides for easy editing and customization.


6 slides
Vision Statement Development Guide
Craft a powerful company vision with this eye-catching layout—literally. Centered around a bold visual icon, this slide helps you organize six core ideas or values that shape your future direction. It’s perfect for strategy workshops, leadership meetings, or branding sessions. Fully compatible with PowerPoint, Keynote, and Google Slides.


5 slides
End-to-End Value Chain Map Presentation
Bring clarity to complex operations with a smooth, visual flow that makes every stage of your process easy to follow. This presentation maps activities from start to finish, helping teams understand dependencies, improve efficiency, and spot opportunities for optimization. Fully compatible with PowerPoint, Keynote, and Google Slides.


6 slides
Natural Food Infographics
The "Natural Food" infographic template is a fresh and appealing visual tool, meticulously designed for PowerPoint, Keynote, and Google Slides. This template is an excellent resource for nutritionists, food bloggers, and organic food marketers looking to present the benefits, sources, and variety of natural foods in an engaging manner. This template vividly showcases the spectrum of natural foods, including fruits, vegetables, grains, and proteins, emphasizing their health benefits, nutritional values, and sustainable sourcing. Its layout is perfect for educating audiences about healthy eating habits, organic farming, and the positive environmental impact of choosing natural foods. The design is as refreshing as the topic it represents, with a color scheme that is vibrant and earthy. This not only makes the presentation visually enticing but also resonates with the themes of health, vitality, and environmental consciousness. Whether used in a workshop, a marketing campaign, or an educational seminar, this template ensures that the wholesome goodness of "Natural Food" is presented in a visually stunning, informative, and appetizing manner.


8 slides
Machine Learning Overview Presentation
The "Machine Learning Overview" presentation template features a central circular design that effectively illustrates the interconnectedness of various components in machine learning processes. Each segment of the circle is dedicated to a key area such as data acquisition, algorithm development, model training, validation, and deployment, which are critical to understanding and executing machine learning projects. This visual arrangement makes it easy to follow and is ideal for educational environments or professional settings where clarity and concise information delivery are essential.


7 slides
South America Infographic Presentation Template
South America is the fourth largest continent in size and the fifth largest in population. It is located primarily in the southern hemisphere, situated between the Pacific and Atlantic Oceans, with mostly colonies on other continents. South America is a continent entirely in the Western Hemisphere, mostly in the Southern Hemisphere. This South America map template is a great base for lesson plans, reference guides and much more. This map template is fully editable and can be easily customized to suit your presentation needs, add multiple layers of text, pictures and various other features.


6 slides
Cyber Security Architect Infographic
Cybersecurity refers to the practice of protecting computer systems, networks, and data from unauthorized access, use, disclosure, disruption, modification, or destruction. This infographic template provides an overview of the role and responsibilities of a cyber security architect. This template is designed to showcase the key skills, expertise, and activities involved in the field of cyber security architecture. The infographic features a modern and professional design that immediately grabs attention. The infographic includes practical tips and best practices for individuals interested in pursuing a career as a cyber security architect.


22 slides
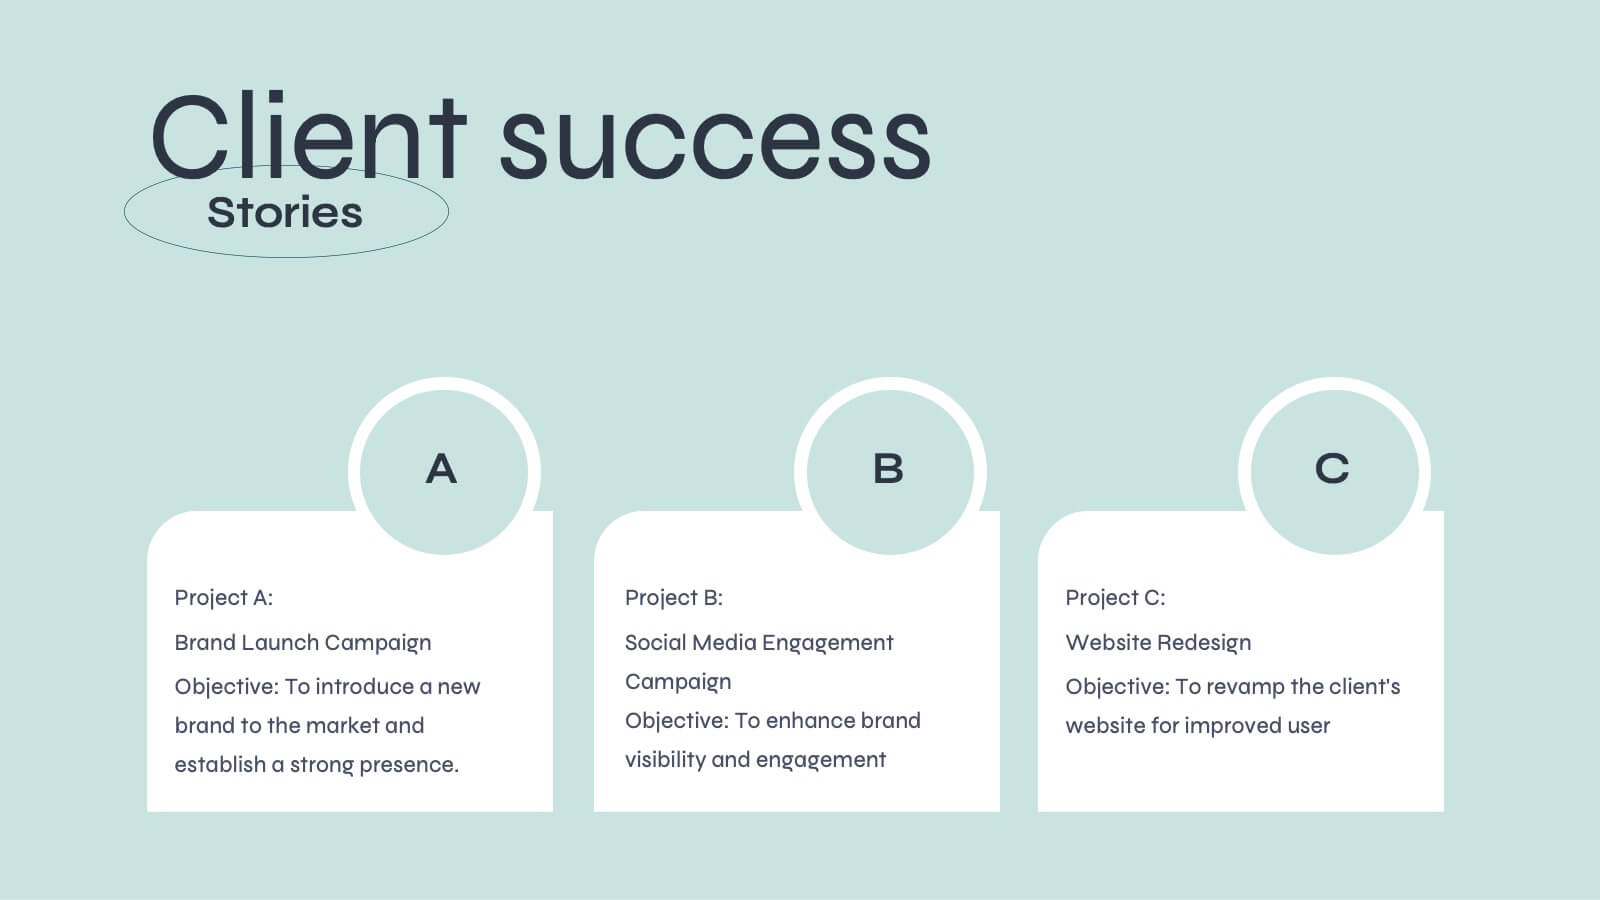
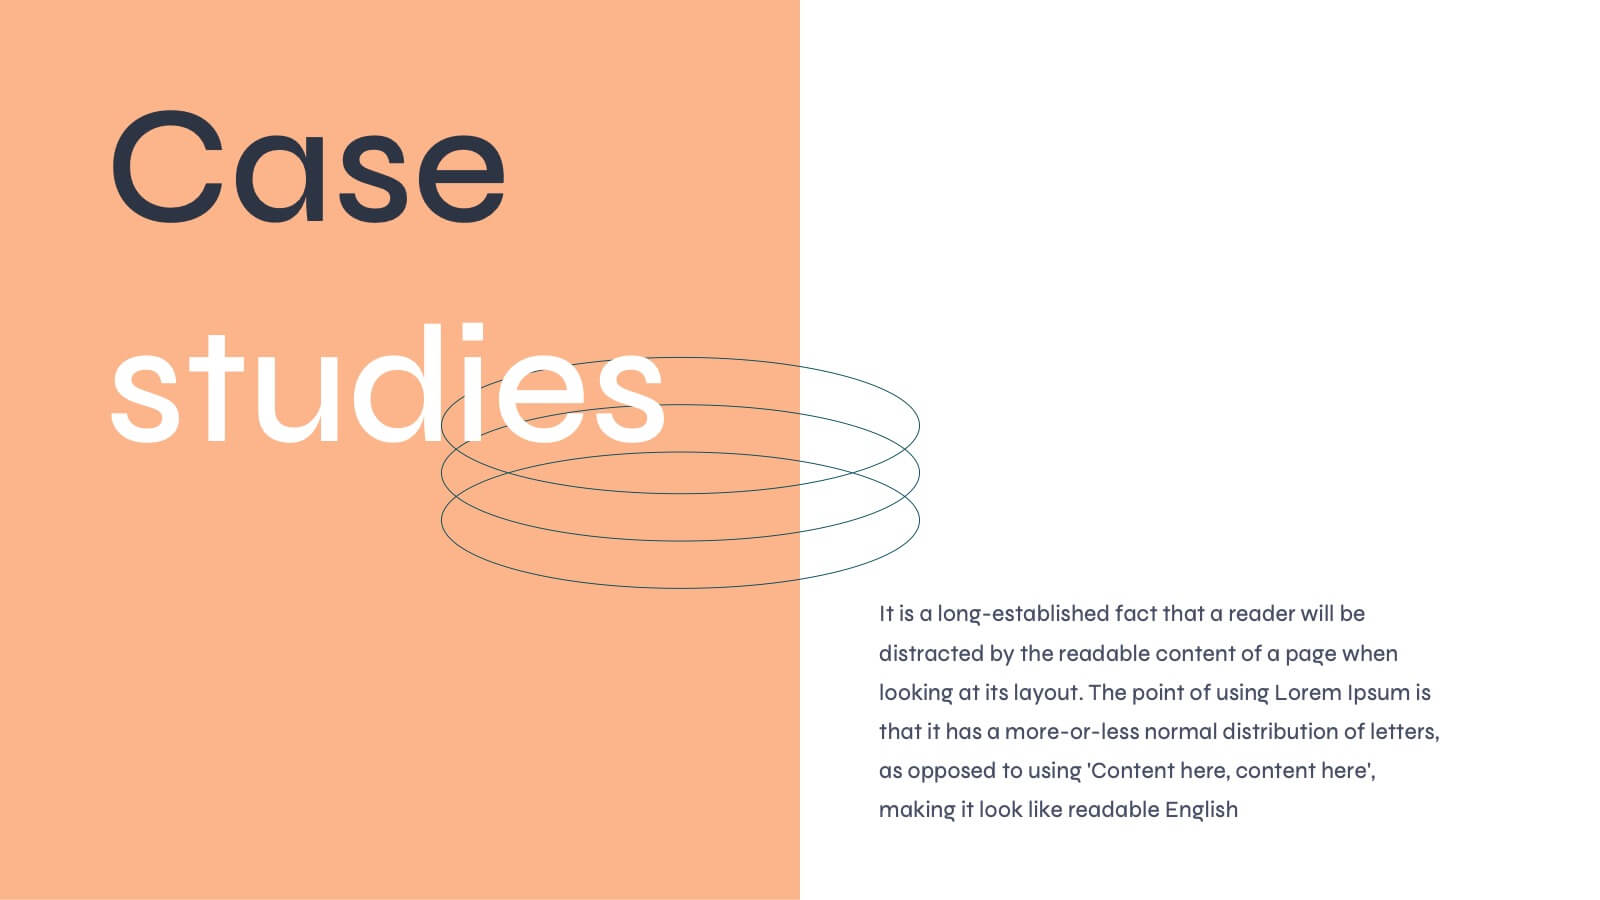
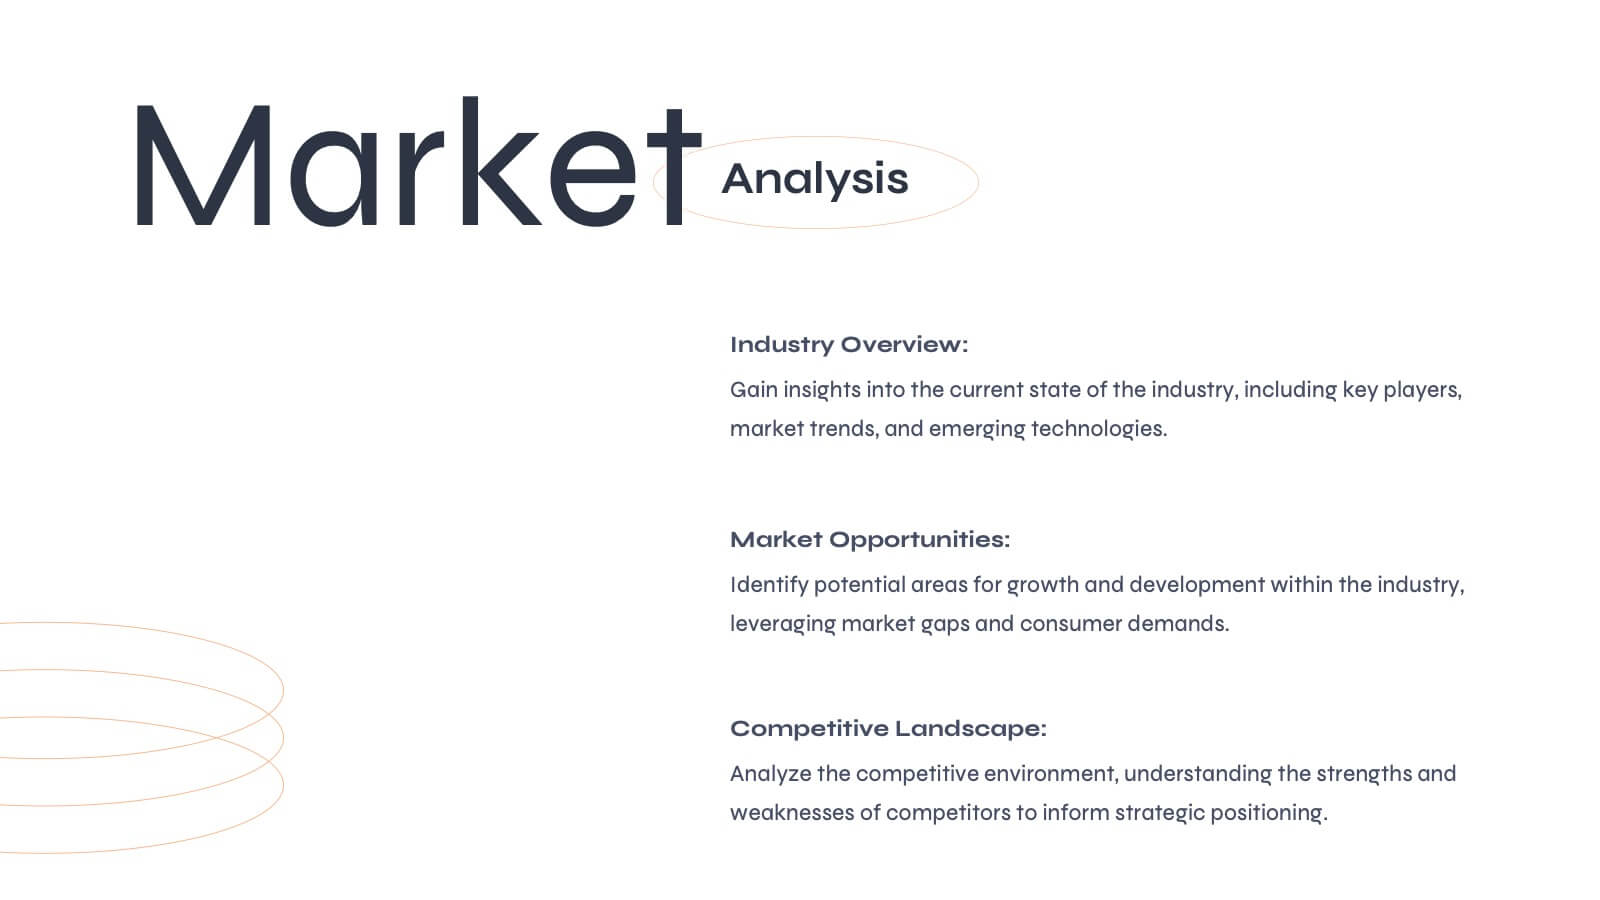
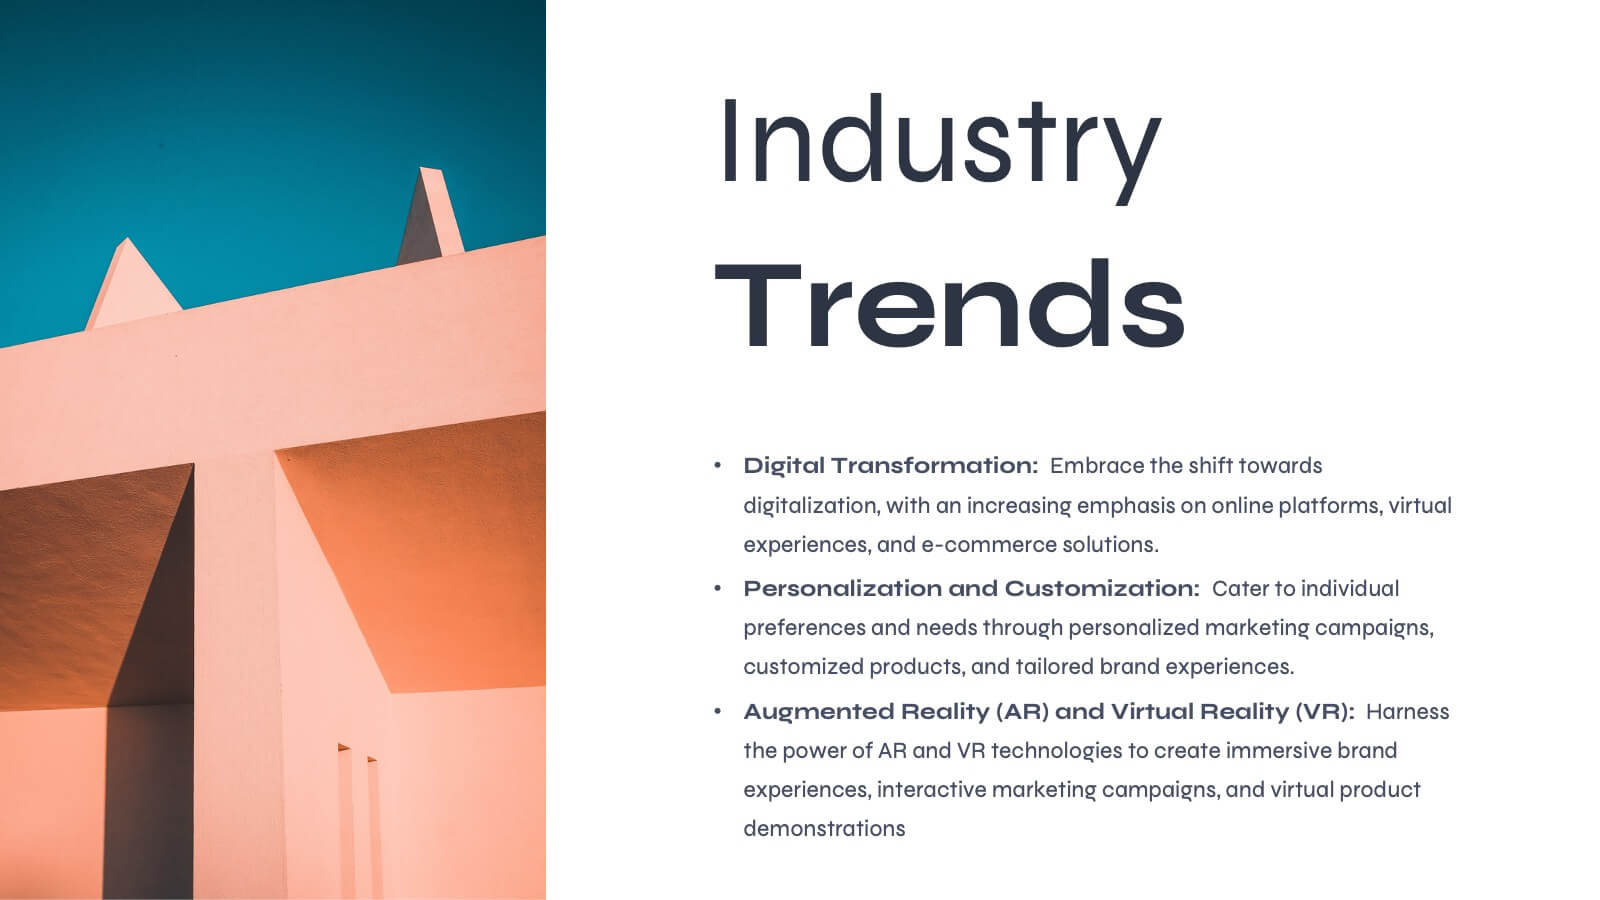
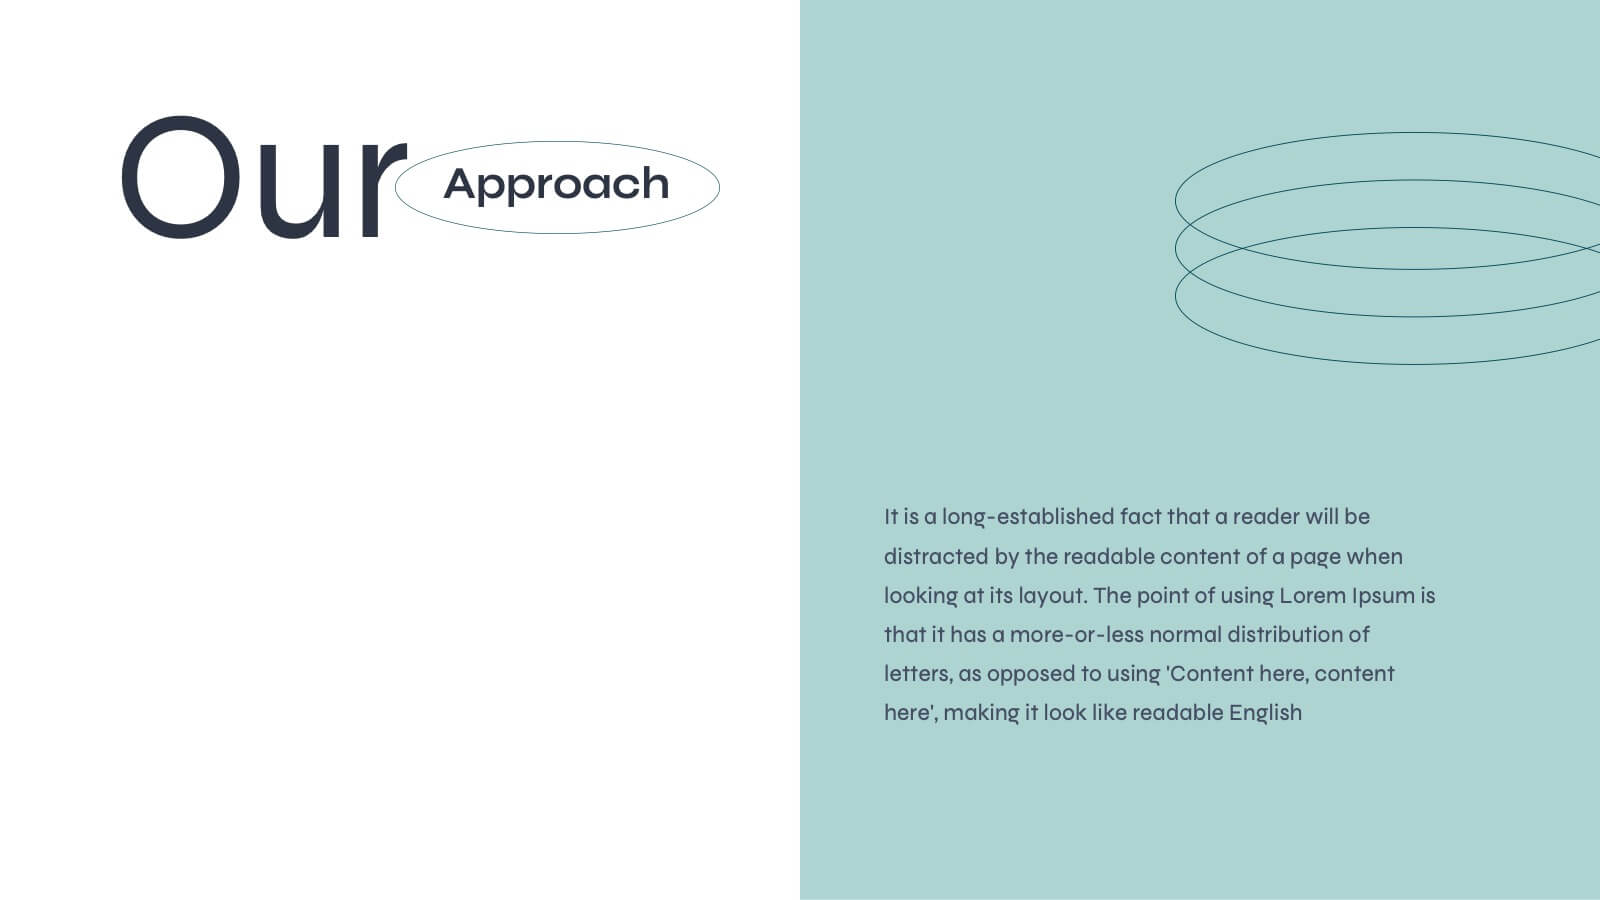
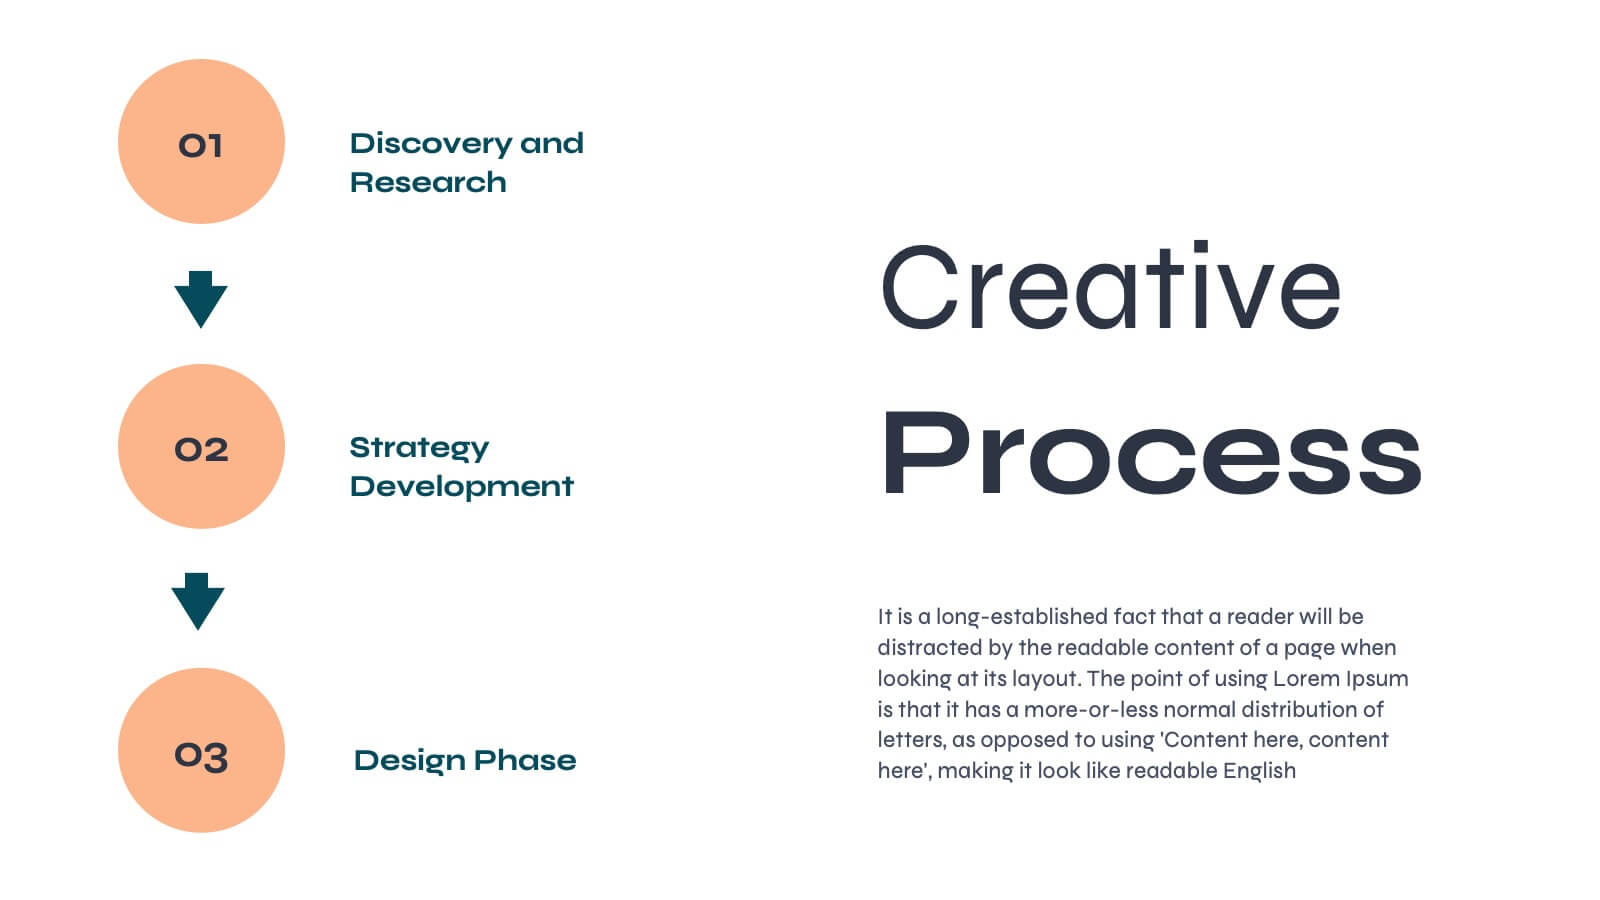
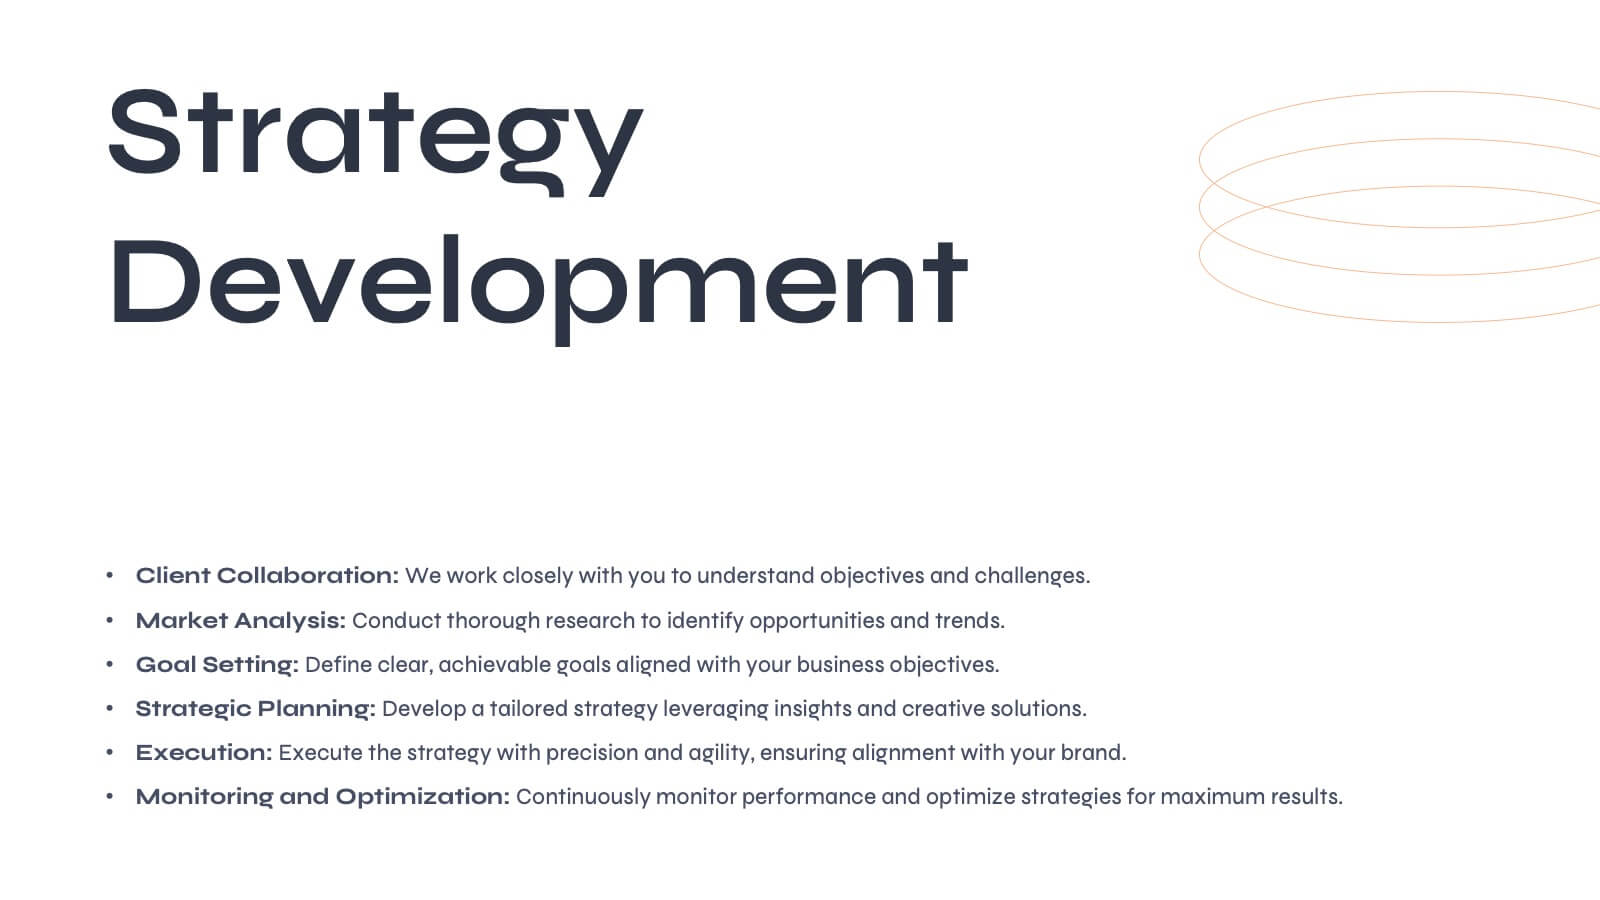
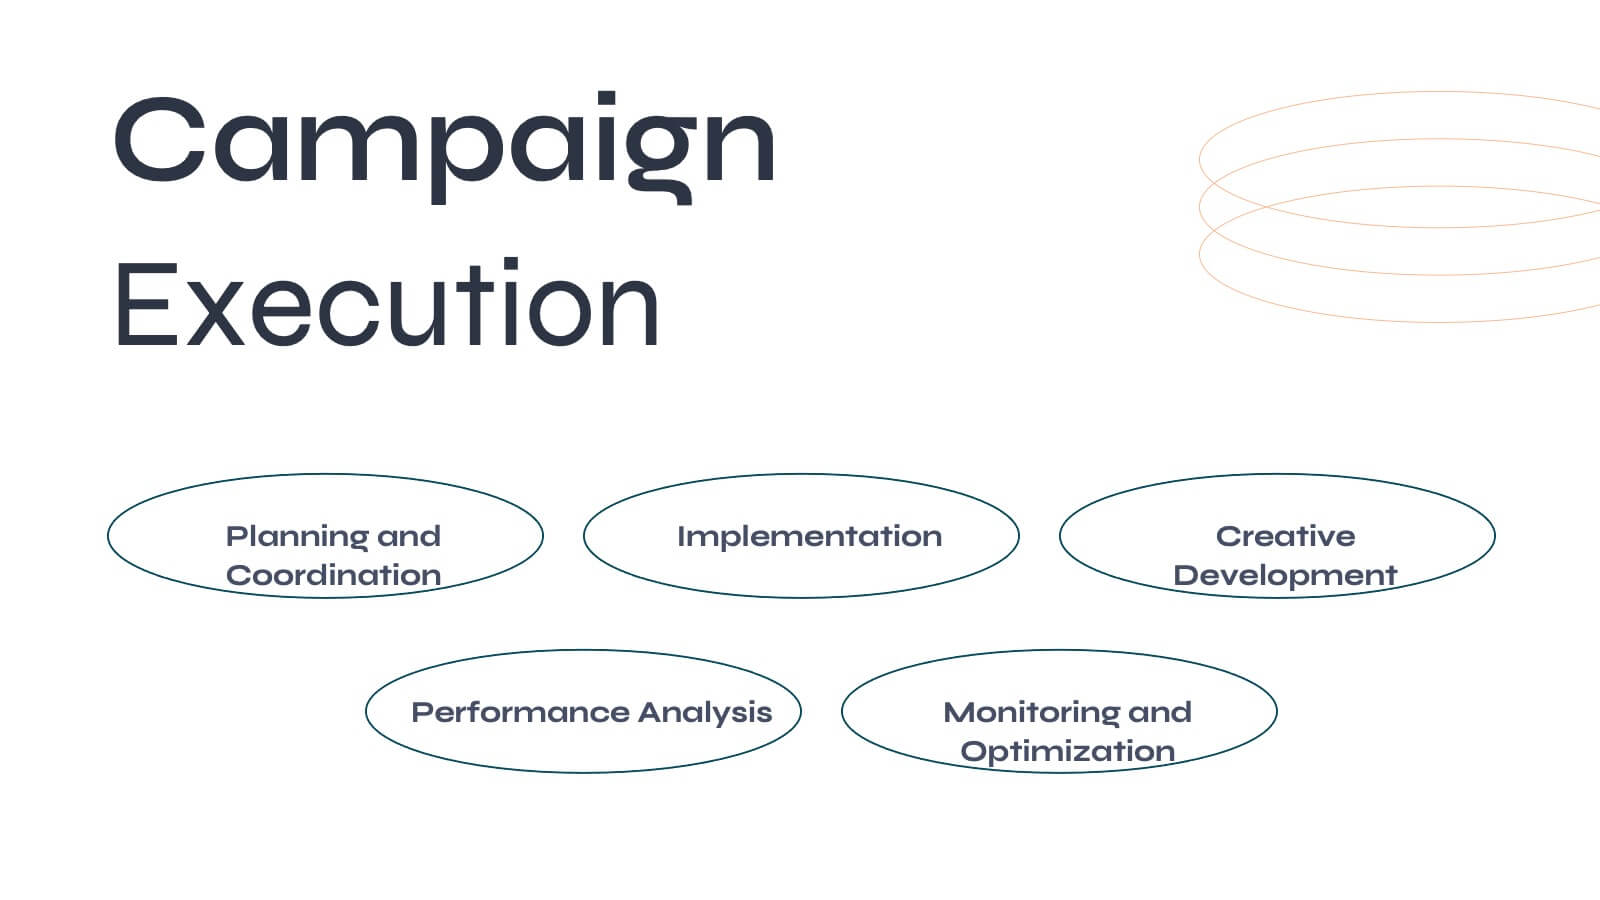
Aurora Agency Portfolio Presentation
Showcase your agency's strengths with this polished, modern presentation template. Perfect for presenting market analysis, client success stories, and creative processes, it features a clean and professional design. Highlight your team's expertise and strategic approach to impress potential clients. Compatible with PowerPoint, Keynote, and Google Slides, it ensures seamless presentations on any platform.


7 slides
Asia Map Overview Infographic
Dive into the vast and varied landscape of Asia with our collection of infographic slides designed to provide an insightful overview of the continent. These templates are ideal for educators, business professionals, and researchers looking to present data on Asia’s geography, demographics, economic status, and more. Each slide is meticulously crafted to display information clearly and attractively, using maps, charts, and icons to represent statistical data and trends across Asia. The different shades and colors used in the maps distinguish between countries, regions, or data points, making it easy for audiences to grasp complex information at a glance. These templates are fully customizable, enabling you to highlight specific areas or data according to your presentation needs. Whether discussing population growth, economic development, or environmental concerns, these slides are an excellent resource for conveying detailed information in a visually engaging format.


5 slides
Human Capital Planning Overview Presentation
Streamline workforce strategies with the Human Capital Planning Overview Presentation. This structured template helps visualize talent development, succession planning, and HR workflows in clear, step-by-step layouts. Perfect for HR leaders, consultants, and executives. Fully editable in PowerPoint, Keynote, and Google Slides for seamless customization to match your team or organization.


5 slides
Strategic Planning with Foundational Pillars Presentation
Define the structure behind your strategic vision with the Strategic Planning with Foundational Pillars presentation. This template showcases four strong pillars beneath a classical pediment, symbolizing the stability and balance of your business strategy. Each pillar represents a core principle—perfect for themes like leadership, values, operations, or goals. Clean, modern, and entirely editable in PowerPoint, Keynote, and Google Slides, this visual works great for executive briefings, annual plans, or business consulting pitches.


26 slides
Raoul Presentation Template
Are you looking for business presentation template with a powerful framework that allows you to present and promote your latest ideas? Raoul is a sleek and clean, bold business presentation template. It's perfect for sharing your ideas, brand identity and how you want to be perceived with the world, in an appealing way. Raoul is great presentation for big or small businesses, company owners, reporters or managers. This template is all about simplicity and style. You will gain authority and convince others with this masterfully crafted professional presentation design.


26 slides
Austin Presentation Template
Sports photography captures the essence of sports and its participants by conveying a strong image. The photographer needs to carefully plan the timing of taking these photos. The Austin Template is perfect for displaying information about your products and services. Vivid and bold colors draw your audience's attention, while the creative sections provide all the relevant details. With an appealing layout and stylish design, you can present yourself in the best light possible. This template will give your site the professional look it deserves, and be sure to stand out to your clients.


5 slides
Financial Growth and Spending Overview Presentation
Visualize financial progress with this clean, step-based diagram. Each stage highlights growth or spending insights using stacked icons and upward arrows for easy interpretation. Perfect for reports, planning, or forecasts. Fully editable in Canva, PowerPoint, and Google Slides, it brings structure and clarity to your financial storytelling.


7 slides
Big Data Tools Infographic
Big Data refers to large volumes of data, both structured and unstructured, that inundate a business or organization on a day-to-day basis. This infographic template is designed to captivate, educate, and empower, providing a bold and clear representation of the sheer magnitude and impact of big data. Compatible with Powerpoint, Keynote, and Google Slides. This template involves processing and analyzing Big Data to extract meaningful insights, patterns, and trends. These insights can be used for business intelligence, decision-making, research, and various other applications across different domains and industries.


4 slides
AIDA Marketing Model Presentation
Optimize your marketing strategy with this AIDA Marketing Model Presentation template. Featuring a visually appealing funnel diagram, this template clearly outlines the Attention, Interest, Desire, and Action stages of customer engagement. Ideal for marketers, sales professionals, and business analysts. Fully customizable and compatible with PowerPoint, Keynote, and Google Slides.