


Features
- 5 Unique slides
- Fully editable and easy to edit in Microsoft Powerpoint, Keynote and Google Slides
- 16:9 widescreen layout
- Clean and professional designs
- Export to JPG, PDF or send by email


Do you have any questions?
Recommend


10 slides
Watercolor Texture Infographic
Watercolor texture refers to the visual and tactile effect created by the application of watercolor paint on paper or any other porous surface. This infographic template is a creative representation that incorporates watercolor textures and elements to convey information or data. This infographic is designed to engage viewers with its artistic and unique aesthetic while effectively presenting complex information in a simplified manner. This infographic features a white with watercolor background that sets the tone for the entire design. The soft, flowing, and colorful watercolor patterns create a visually appealing backdrop for the content.


5 slides
Banking Services Infographics
Banking Services refer to the financial and investment services provided by banks to individuals, businesses, and other organizations. These Infographics are visual representations of information about different types of banking services provided by various financial institutions. This infographic provides an overview of the key features, benefits, and drawbacks of each service, such as checking/saving accounts, credit cards, and online banking. Included are statistics, charts, and other visual aids to convey data more effectively. The aim is to help individuals make informed decisions about the right banking services for their needs.


7 slides
Customer Journey Infographic Presentation Template
A Customer Journey Infographic is an illustration of the different stages a customer goes through when interacting with a business or organization. It is a way to show the customer's experience with the business or organization, from the initial contact to the post-purchase follow-up. This template is perfect for showing how people interact with your business, the emotions and feedback of your customer at each stage. This template includes lots of photo layouts, charts, and timelines that you can customize to show the different stages a customer goes through on their journey with your business.


5 slides
Risk Mitigation Strategies
Visualize your risk response plan with this layered diagram that highlights five strategic levels of mitigation. Each tier features bold directional arrows guiding the viewer from risk source to solution, perfect for decision-makers, auditors, or risk managers. Fully editable and easy to adapt to any industry. Compatible with PowerPoint, Keynote, and Google Slides.


12 slides
Tourism Trends and Destination Analytics Presentation
Visualize travel patterns and insights effortlessly with this Tourism Trends and Destination Analytics Presentation. Featuring a suitcase-themed layout with icon blocks, this template is ideal for travel analysts, tourism boards, and destination marketers. Use it to highlight travel behaviors, key locations, or seasonal preferences. Fully customizable in PowerPoint, Keynote, and Google Slides.


24 slides
Minerva UX Design Presentation
Elevate your UX design presentations with this comprehensive template, featuring sections for project overview, user research, wireframes, prototyping, and usability testing. Showcase design systems, branding guidelines, and accessibility considerations with ease. Perfect for demonstrating a user-centered approach. Compatible with PowerPoint, Keynote, and Google Slides for seamless customization.


6 slides
Travel Tips Infographic
By following travel tips, you can enhance your travel experience, mitigate potential challenges, and make the most of your adventures. This infographic template is designed to provide travelers with essential tips and guidelines for a successful and enjoyable trip. Whether you're planning a vacation, business trip, or backpacking adventure, this infographic offers valuable information to help you make the most out of your travel experience. This template is a valuable tool for enhancing travel experiences and ensuring a smooth and memorable trip. Compatible with Powerpoint, Keynote, and Google Slides.
22 slides
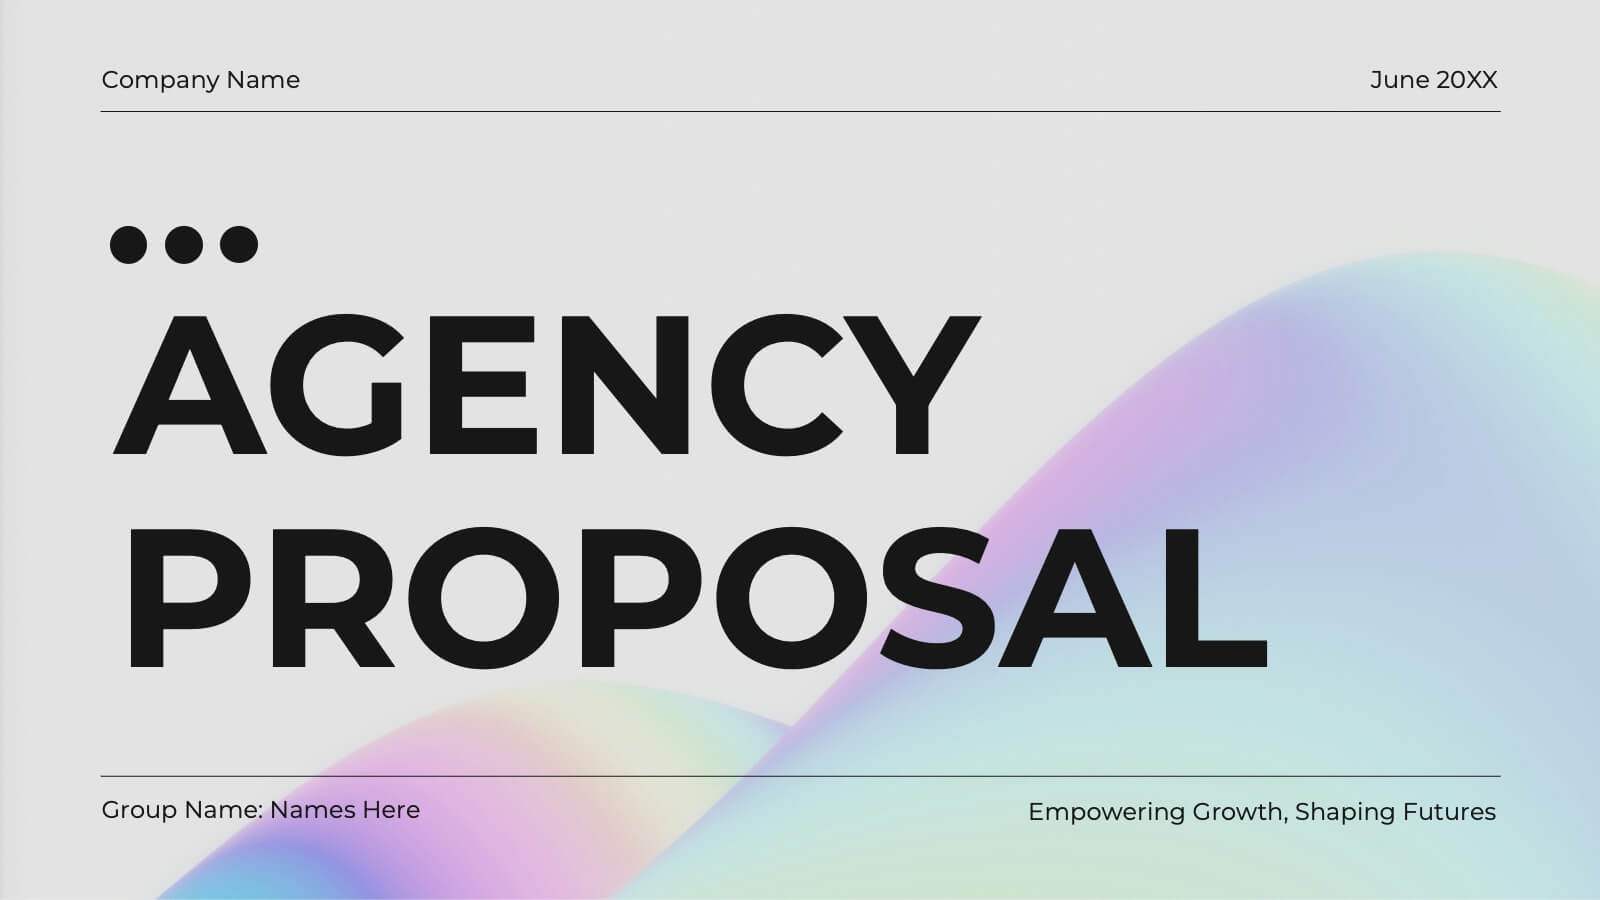
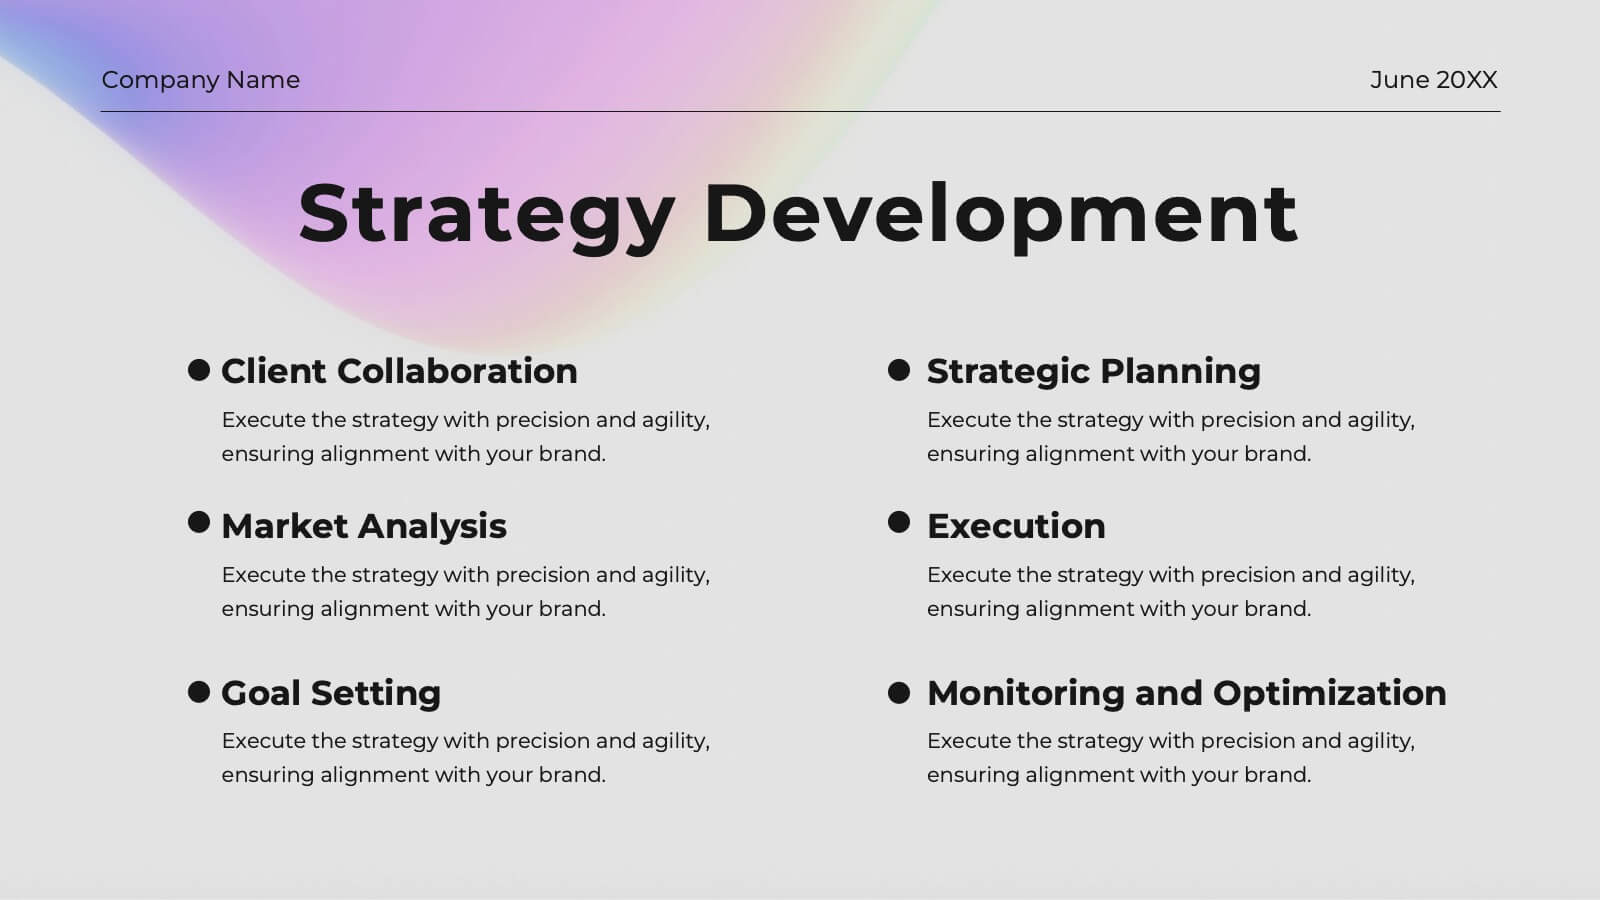
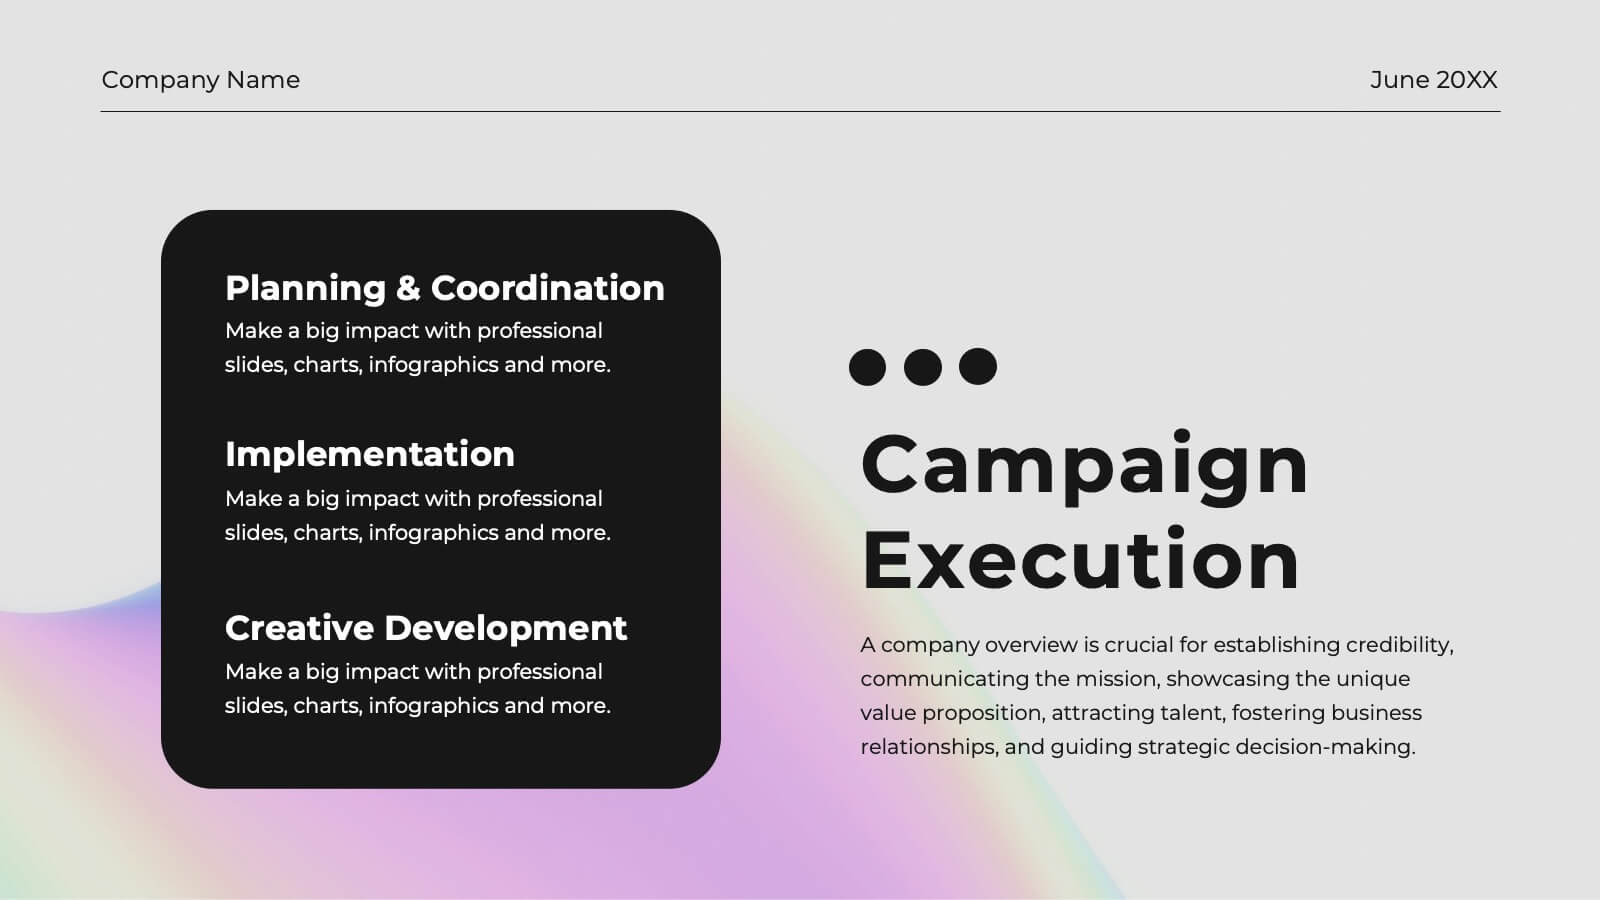
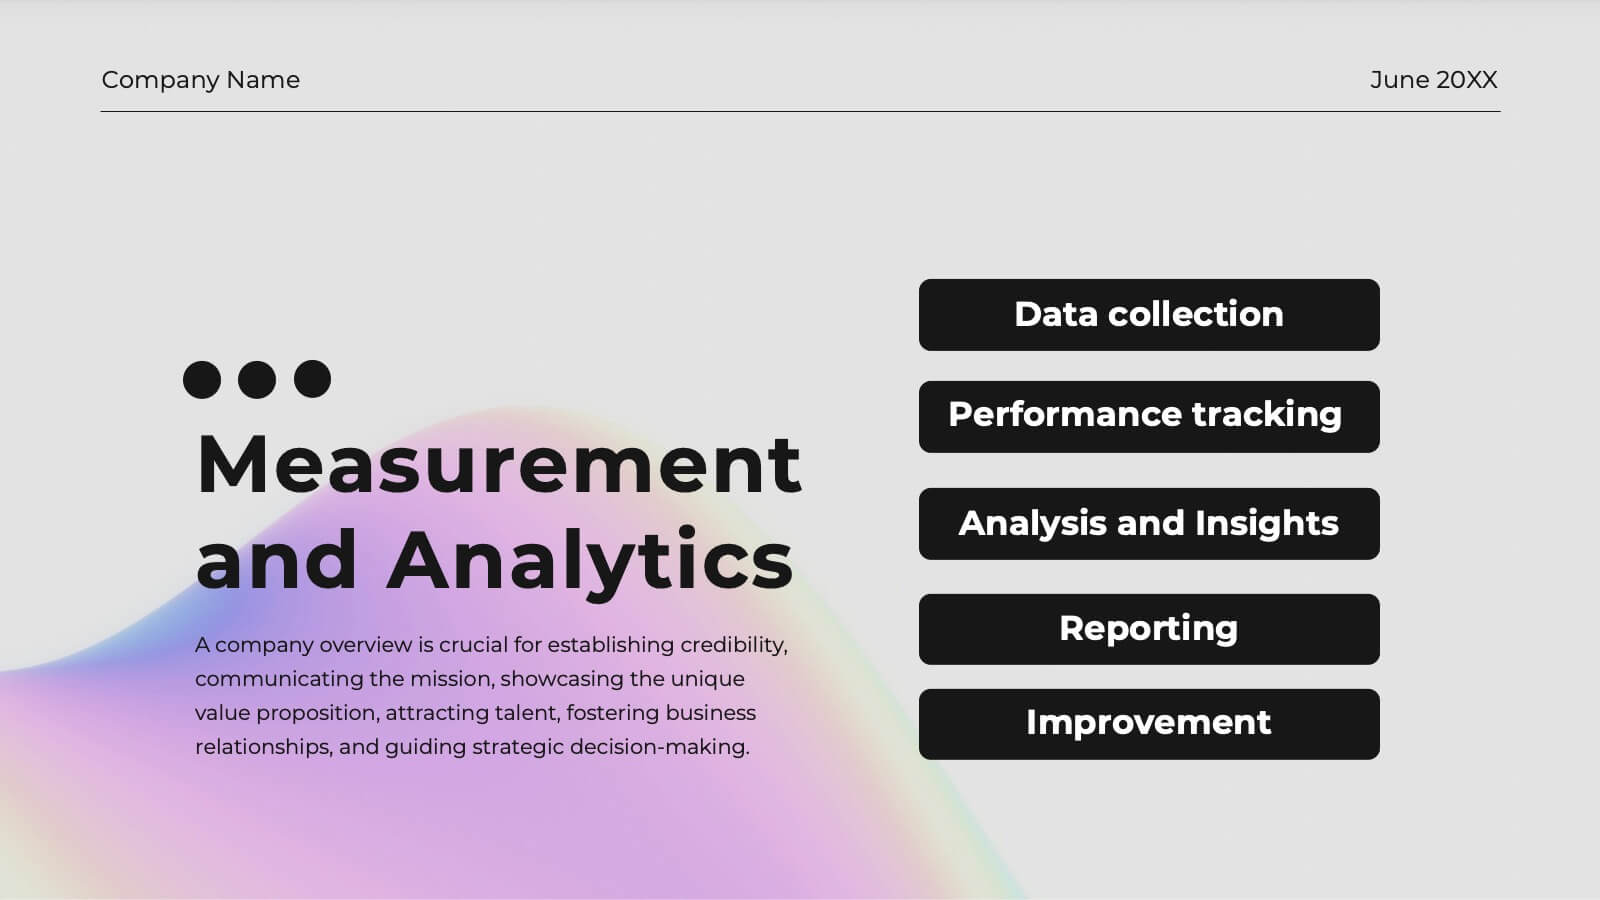
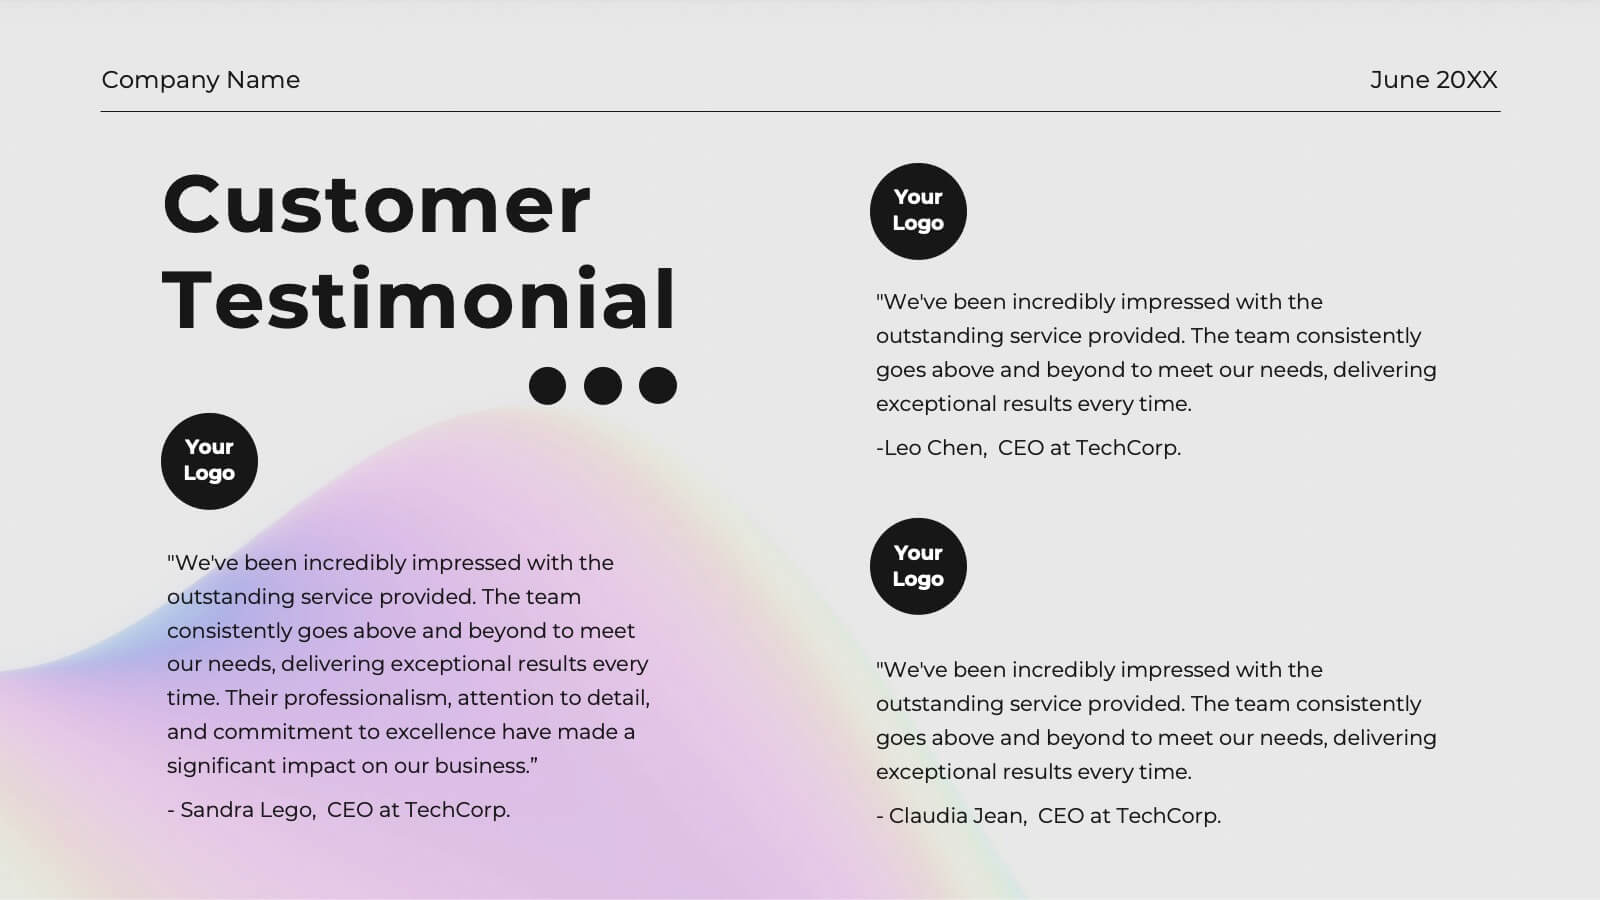
Frost Advertising Agency Proposal Presentation
Dazzle your clients with this radiant agency proposal template! Perfect for presenting your mission, services, and market analysis, it includes slides for case studies, strategy development, and campaign execution. Impress stakeholders with vibrant visuals and detailed content. Compatible with PowerPoint, Keynote, and Google Slides for seamless presentations on any platform.


6 slides
Cryptocurrency Exchange Infographic
A cryptocurrency exchange is a platform that allows users to buy, sell, and trade cryptocurrencies. This infographic template illustrates the key aspects of cryptocurrency exchanges, providing an overview of how these platforms work, their benefits, and the steps involved in trading cryptocurrencies. This infographic aims to educate and inform individuals about cryptocurrency exchanges and make the process of trading digital assets more accessible. This template aims to simplify complex concepts and provide a clear overview of the steps involved in using cryptocurrency exchanges, encouraging more people to participate in the growing digital asset market.


7 slides
Medical Insurance Infographic
The Medical Insurance Infographic provides a clear and concise visualization of insurance policy features, coverage details, and benefits. Ideal for insurance companies, healthcare professionals, and policyholders, this infographic simplifies complex insurance information into digestible segments. With a clean and professional design, the infographic outlines key insurance concepts such as premium rates, deductibles, copayments, and coverage limits. It also offers a visual comparison of different plans, aiding customers in making informed decisions regarding their healthcare coverage. Customizable for different audiences, this SEO-optimized infographic can be used on websites, in marketing materials, or during consultations to enhance understanding of medical insurance options. Employ our Medical Insurance Infographic to effectively communicate the value of insurance plans and help individuals navigate their healthcare needs with confidence.


6 slides
Team Work Benefits Infographics
The "Team Work Benefits" infographic template is a dynamic and motivating visual tool, carefully designed for PowerPoint, Keynote, and Google Slides. This template is an excellent asset for team leaders, HR professionals, and corporate trainers looking to highlight the value of collaboration, synergy, and collective problem-solving in a professional setting. This template vividly illustrates the multitude of benefits arising from effective teamwork, including enhanced communication, diversified skills, increased creativity, and improved productivity. It's structured to emphasize the importance of team dynamics, mutual support, and shared goals, making it a powerful resource for team-building sessions, leadership workshops, and organizational development programs. The design is as collaborative as the concept it embodies, with a color scheme that is both vibrant and harmonious. This not only makes the presentation visually appealing but also symbolizes the unity, energy, and diversity inherent in successful teamwork. Whether used in a boardroom, a training session, or a team retreat, this template ensures that the invaluable "Benefits of Team Work" are presented in a clear, engaging, and visually compelling manner.


7 slides
Break Even Sales Infographic
Break-even analysis is a financial tool used by businesses to determine the point at which total revenue equals total costs, resulting in neither profit nor loss. This infographic template breaks down the intricacies of break-even analysis, providing a powerful visual aid to understand when your venture turns profitable. Compatible with Powerpoint, Keynote, and Google Slides. Designed to illuminate the journey from cost recovery to profitability with clarity and boldness. This template showcases the break-even point graphically, representing the stage where total revenue equals total costs, and the venture moves from loss to gain.


4 slides
Empathy Mapping for Product Development Presentation
Strengthen user understanding with the Empathy Mapping for Product Development Presentation. This template helps teams visualize what users think, feel, say, and do—essential for creating intuitive products and experiences. Ideal for design sprints, UX workshops, and product planning sessions. Fully editable in PowerPoint, Keynote, Canva, and Google Slides.


6 slides
Product and Service Options
Clearly compare your offerings with this side-by-side product vs. service infographic. Perfect for illustrating feature breakdowns, pros and cons, or key differentiators between two business models. With six customizable points and modern icons, this layout is ideal for sales decks, marketing pitches, or strategy presentations. Fully editable in PowerPoint, Keynote, and Google Slides.


6 slides
Network Security Infographics
Strengthen your understanding of Network Security with our customizable infographic template. This template is fully compatible with popular presentation software like PowerPoint, Keynote, and Google Slides, allowing you to easily customize it to illustrate and communicate various aspects of network security. The Network Security infographic template offers a visually engaging platform to explore and explain the importance of protecting digital information, securing networks, and preventing cyber threats. Whether you're an IT professional, business owner, or simply interested in cybersecurity, this template provides a user-friendly canvas to create informative presentations and educational materials. Enhance your knowledge of Network Security with this SEO-optimized infographic template, thoughtfully designed for clarity and ease of use. Customize it to highlight key concepts, security measures, best practices, and the evolving landscape of cybersecurity, ensuring that your audience gains valuable insights into this critical field. Start crafting your personalized infographic today to fortify your understanding of Network Security.


5 slides
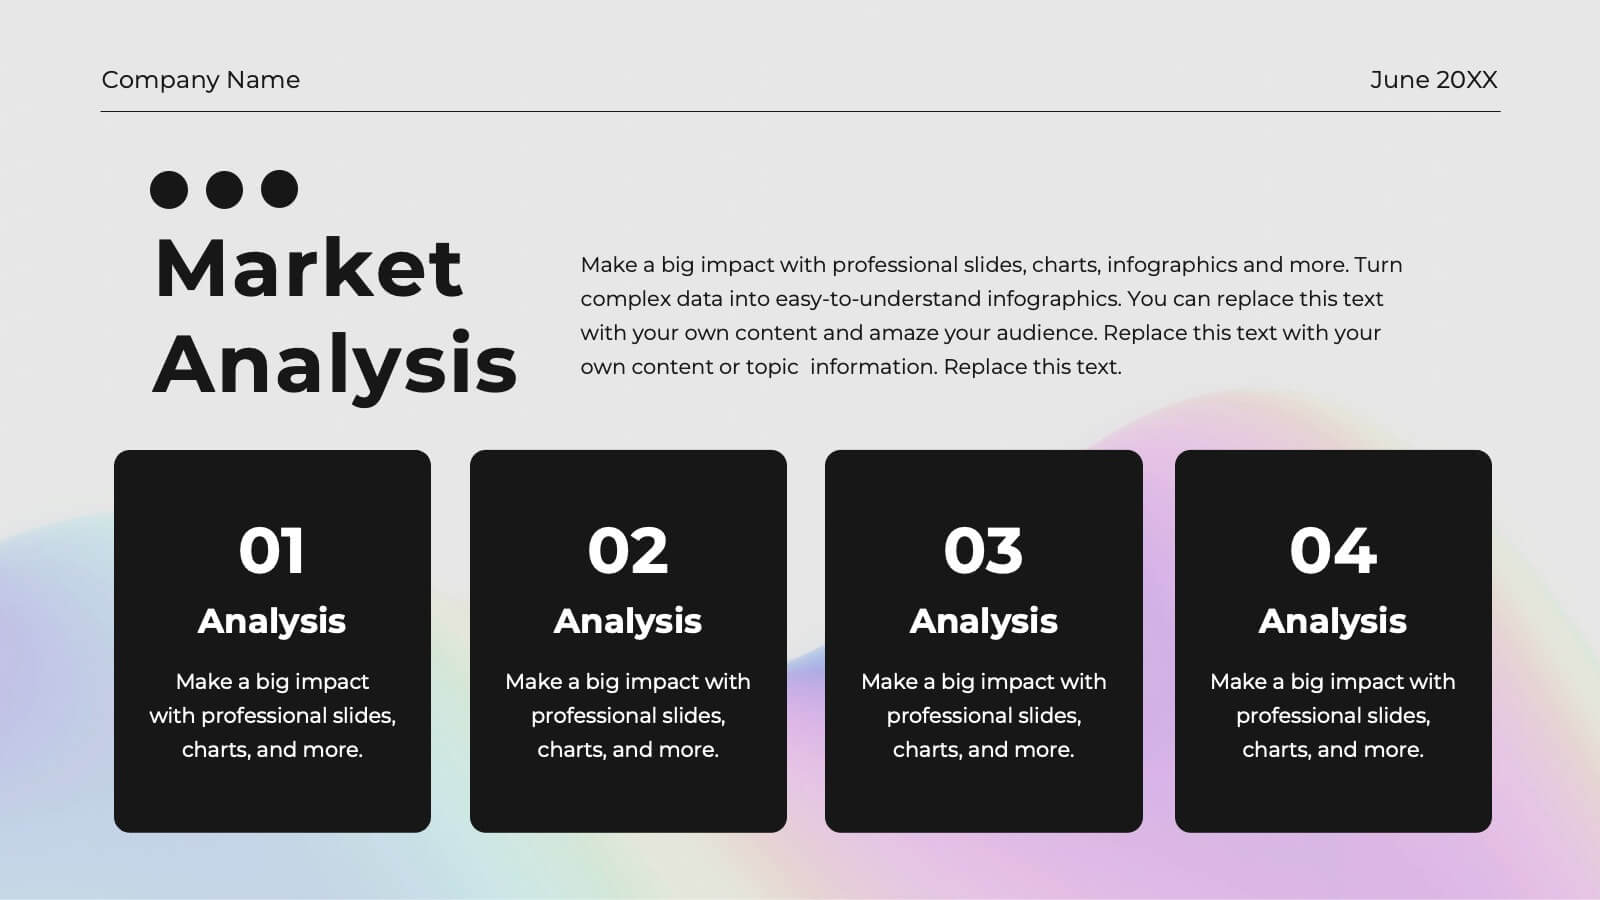
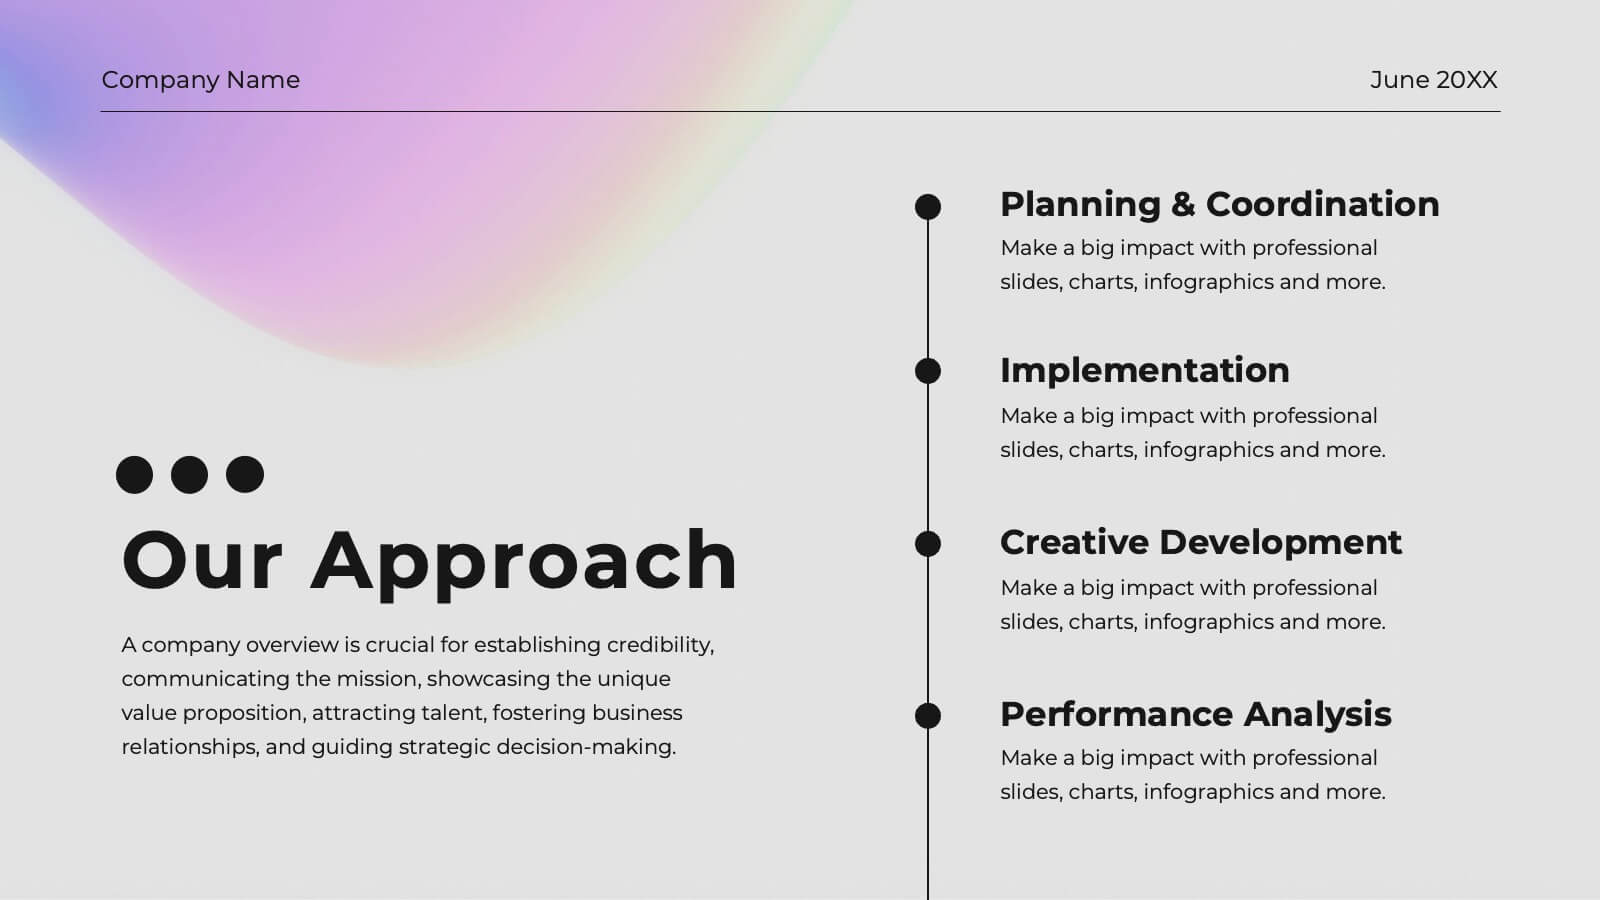
Future Planning and Next Steps Strategy Presentation
Map out your goals with clarity using the Future Planning and Next Steps Strategy Presentation. This slide features a sleek four-step curved timeline with editable icons and labels, ideal for outlining strategic actions or project phases. Easily customize each stage to match your business objectives. Compatible with PowerPoint, Keynote, and Google Slides.


7 slides
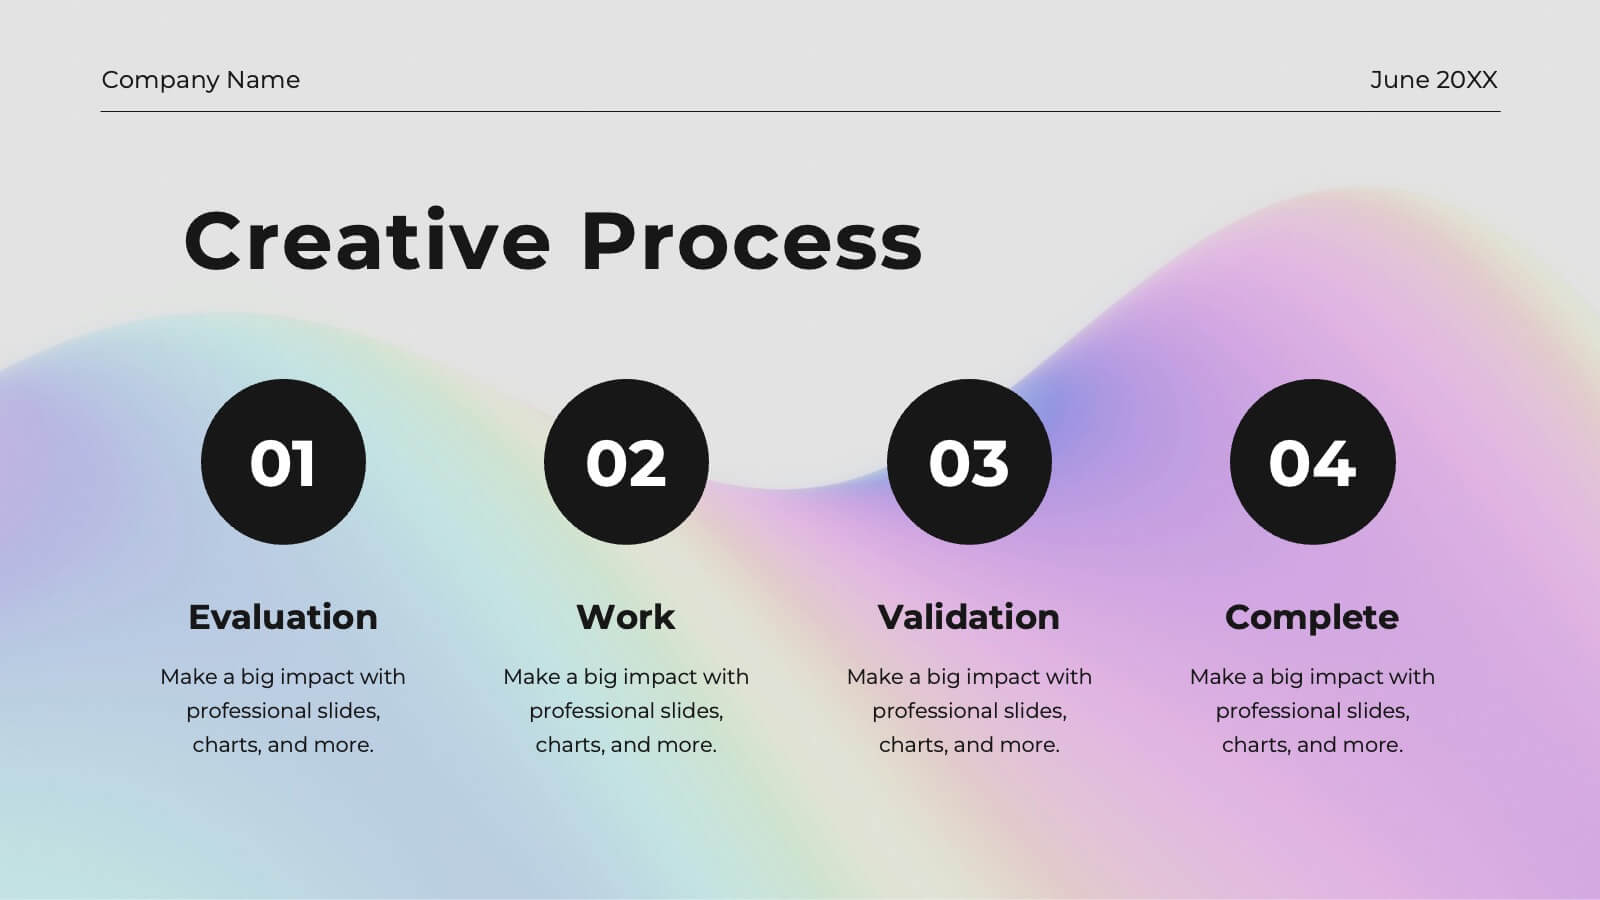
Geometric Steps Infographic
Unveil complex processes or hierarchies in a visually striking manner with the geometric steps infographic. Utilizing a blend of white, purple, yellow, red, and blue, this infographic captures attention through its distinct geometric shapes. This template design is an asset for educators, project managers, or business professionals aiming to detail a step-by-step guide or a layered approach in their presentations. Its compatibility across PowerPoint, Keynote, and Google Slides ensures a smooth integration into your deck, amplifying the comprehensibility and appeal of your content.