


Features
- 4 Unique slides
- Fully editable and easy to edit in Microsoft Powerpoint, Keynote and Google Slides
- 16:9 widescreen layout
- Clean and professional designs
- Export to JPG, PDF or send by email


Do you have any questions?
Recommend


5 slides
Geographic Oceania Overview Presentation
Visualize your regional data with a sleek, easy-to-read map highlighting key areas across Oceania. Perfect for presenting geographic insights, business distribution, or market trends, this clean layout ensures every detail stands out clearly. Fully compatible with PowerPoint, Keynote, and Google Slides for simple editing and professional presentations.


6 slides
Hexagonal Grid for Process Mapping Presentation
Visualize your workflow with structure using the Hexagonal Grid for Process Mapping Presentation. This clean, geometric layout guides viewers through each phase of your process with clarity and consistency. Ideal for outlining steps, stages, or interconnected tasks in a modern format. Fully editable in Canva, PowerPoint, Keynote, and Google Slides.


5 slides
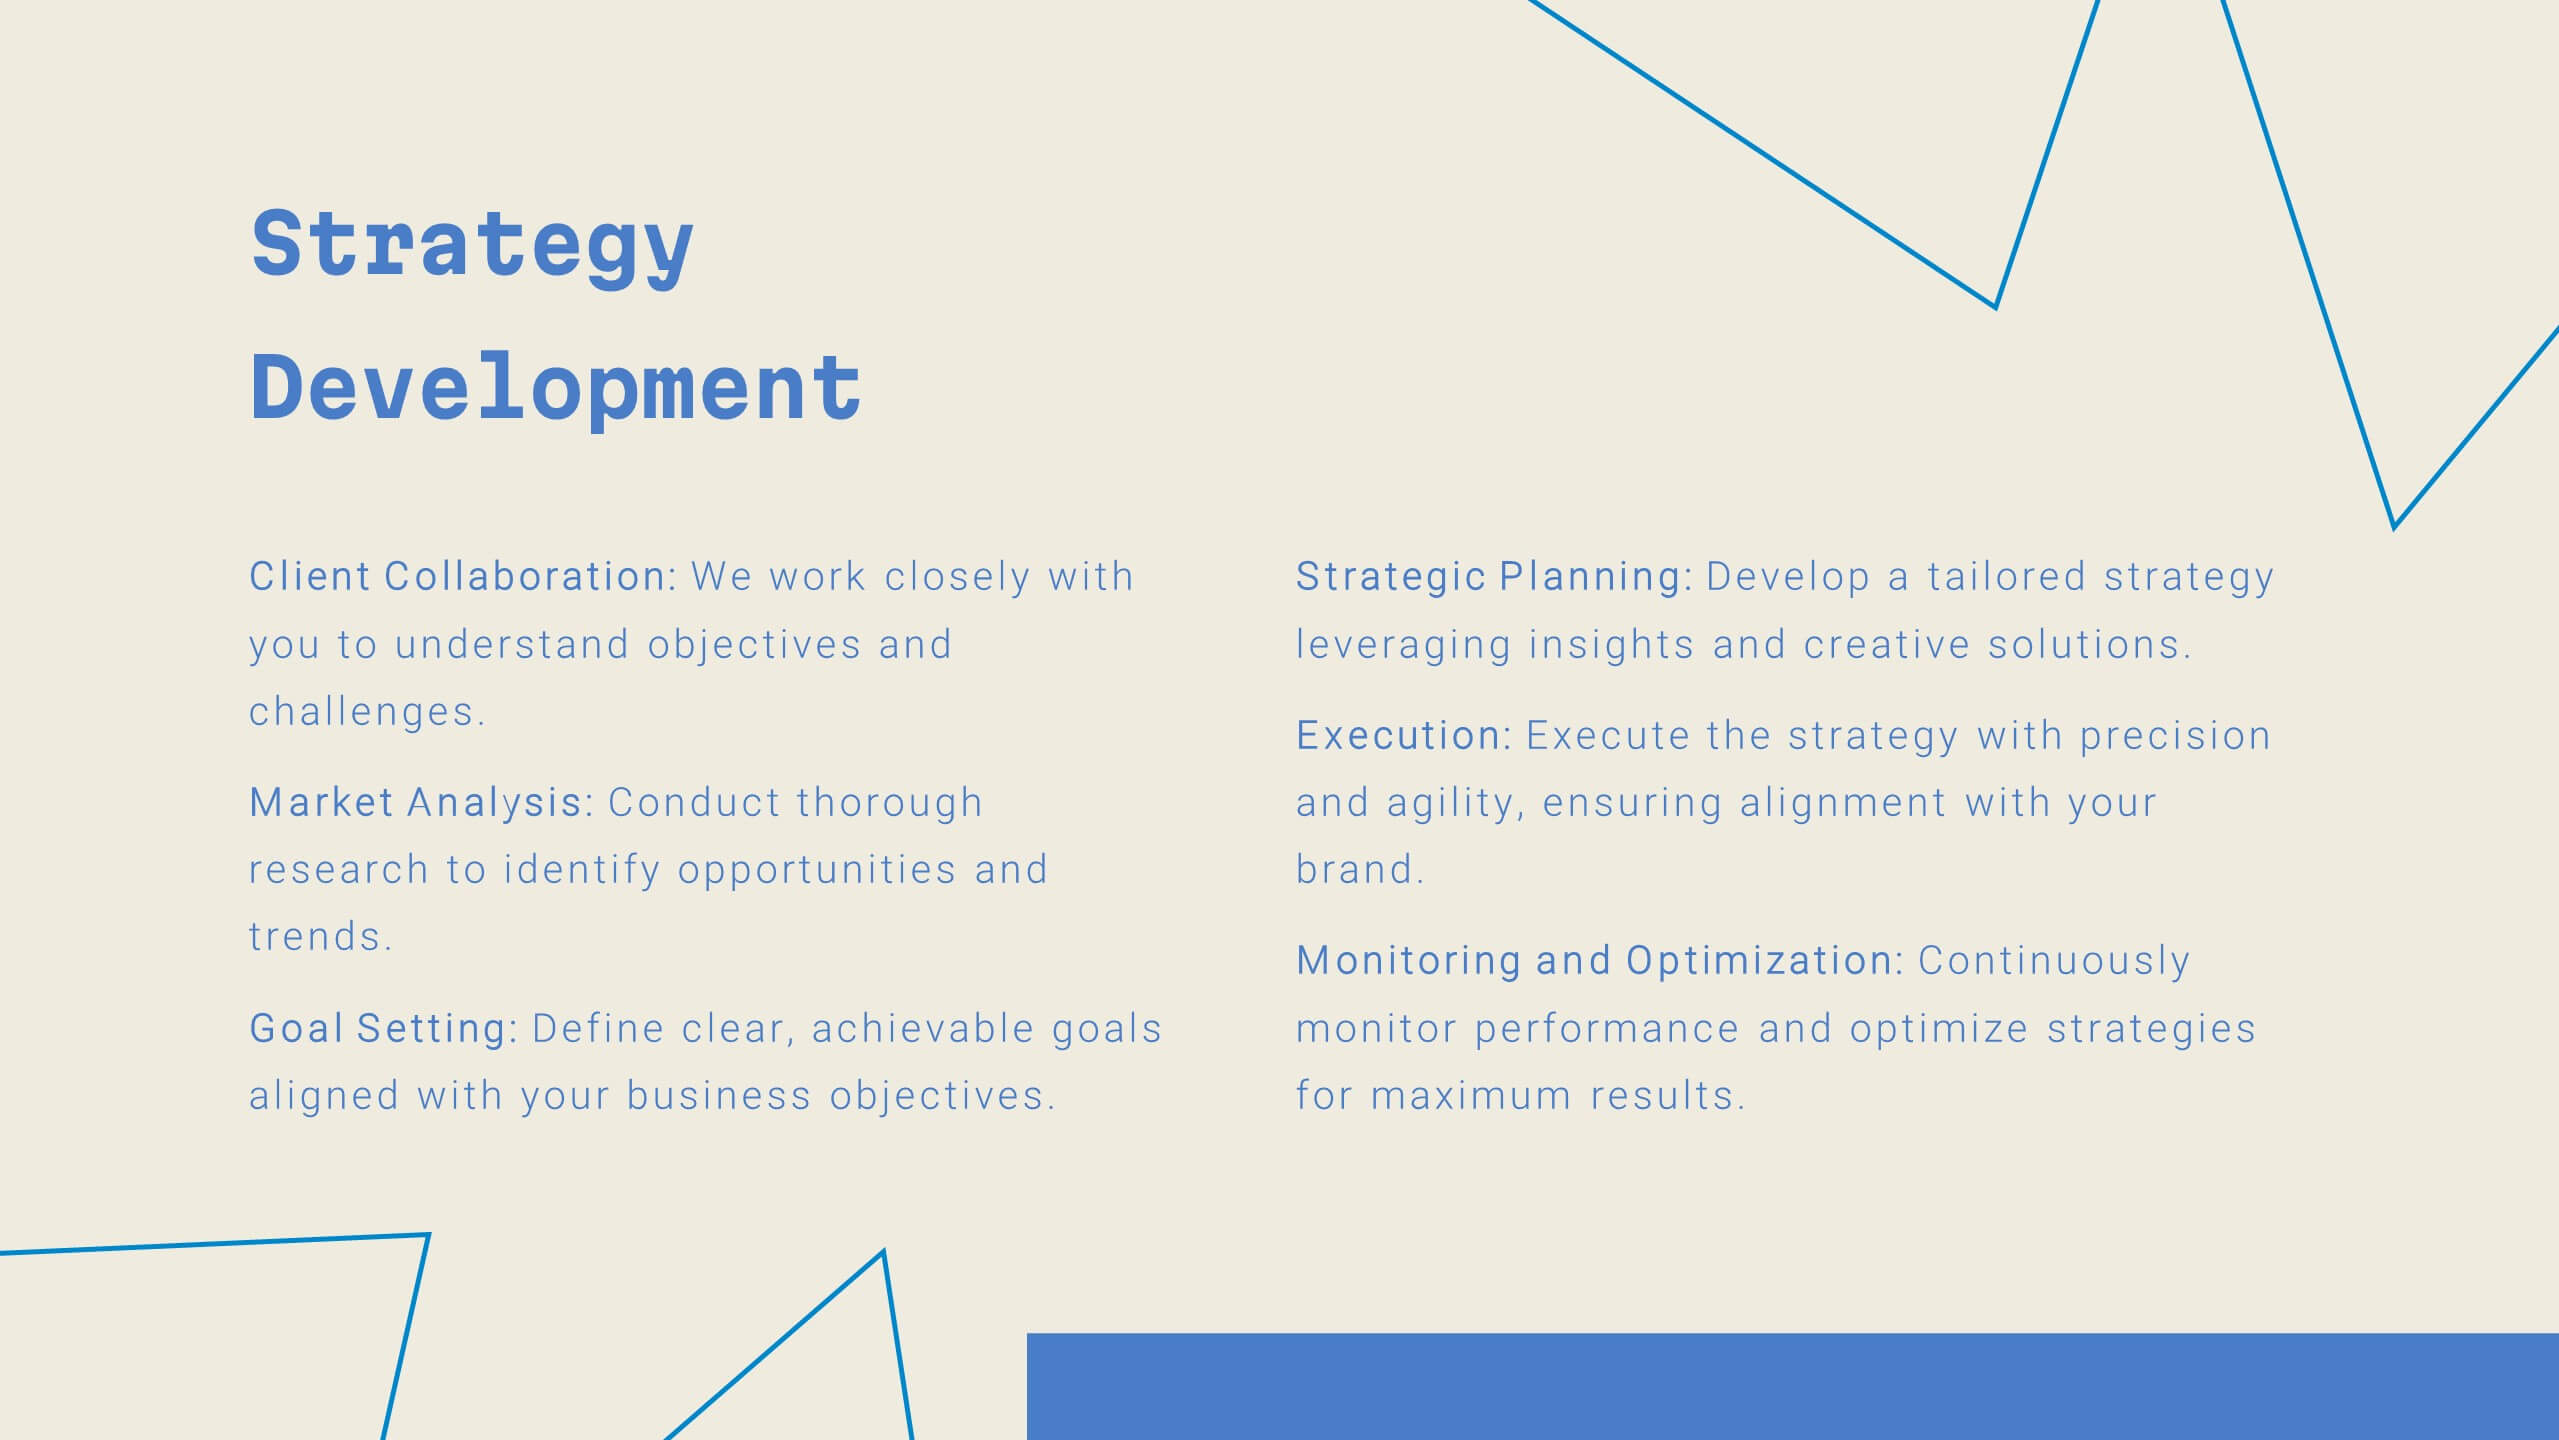
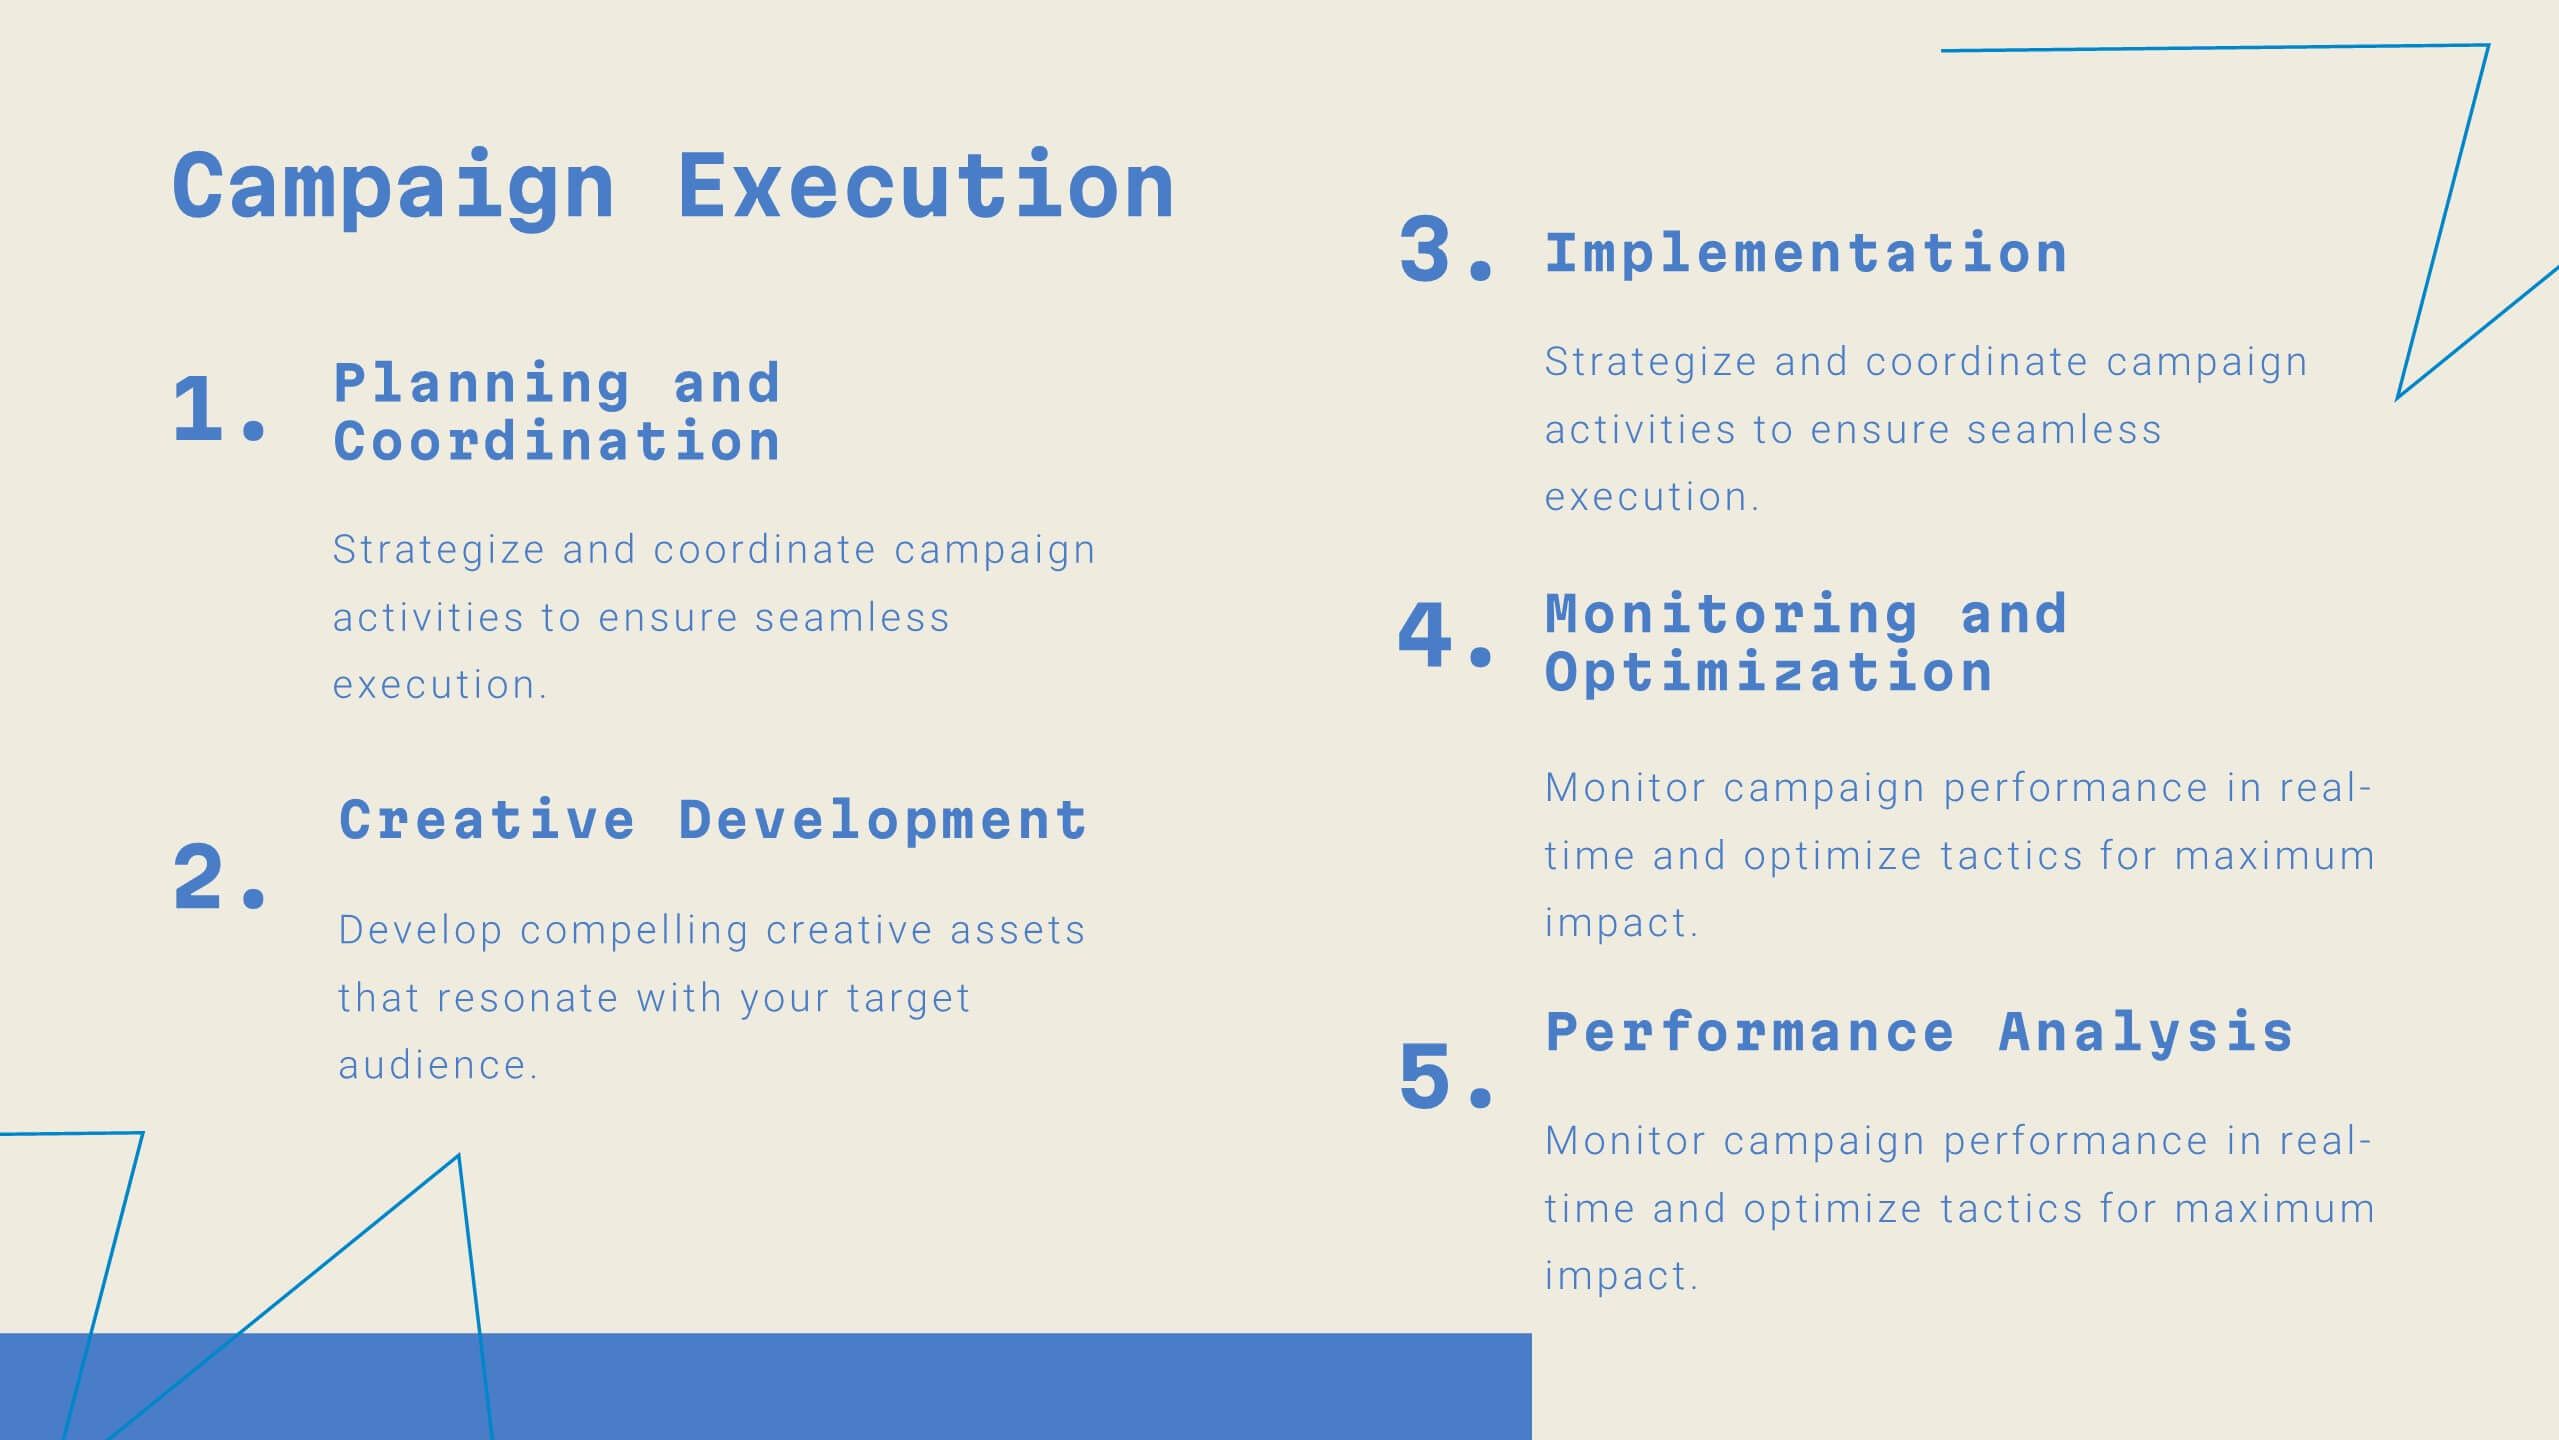
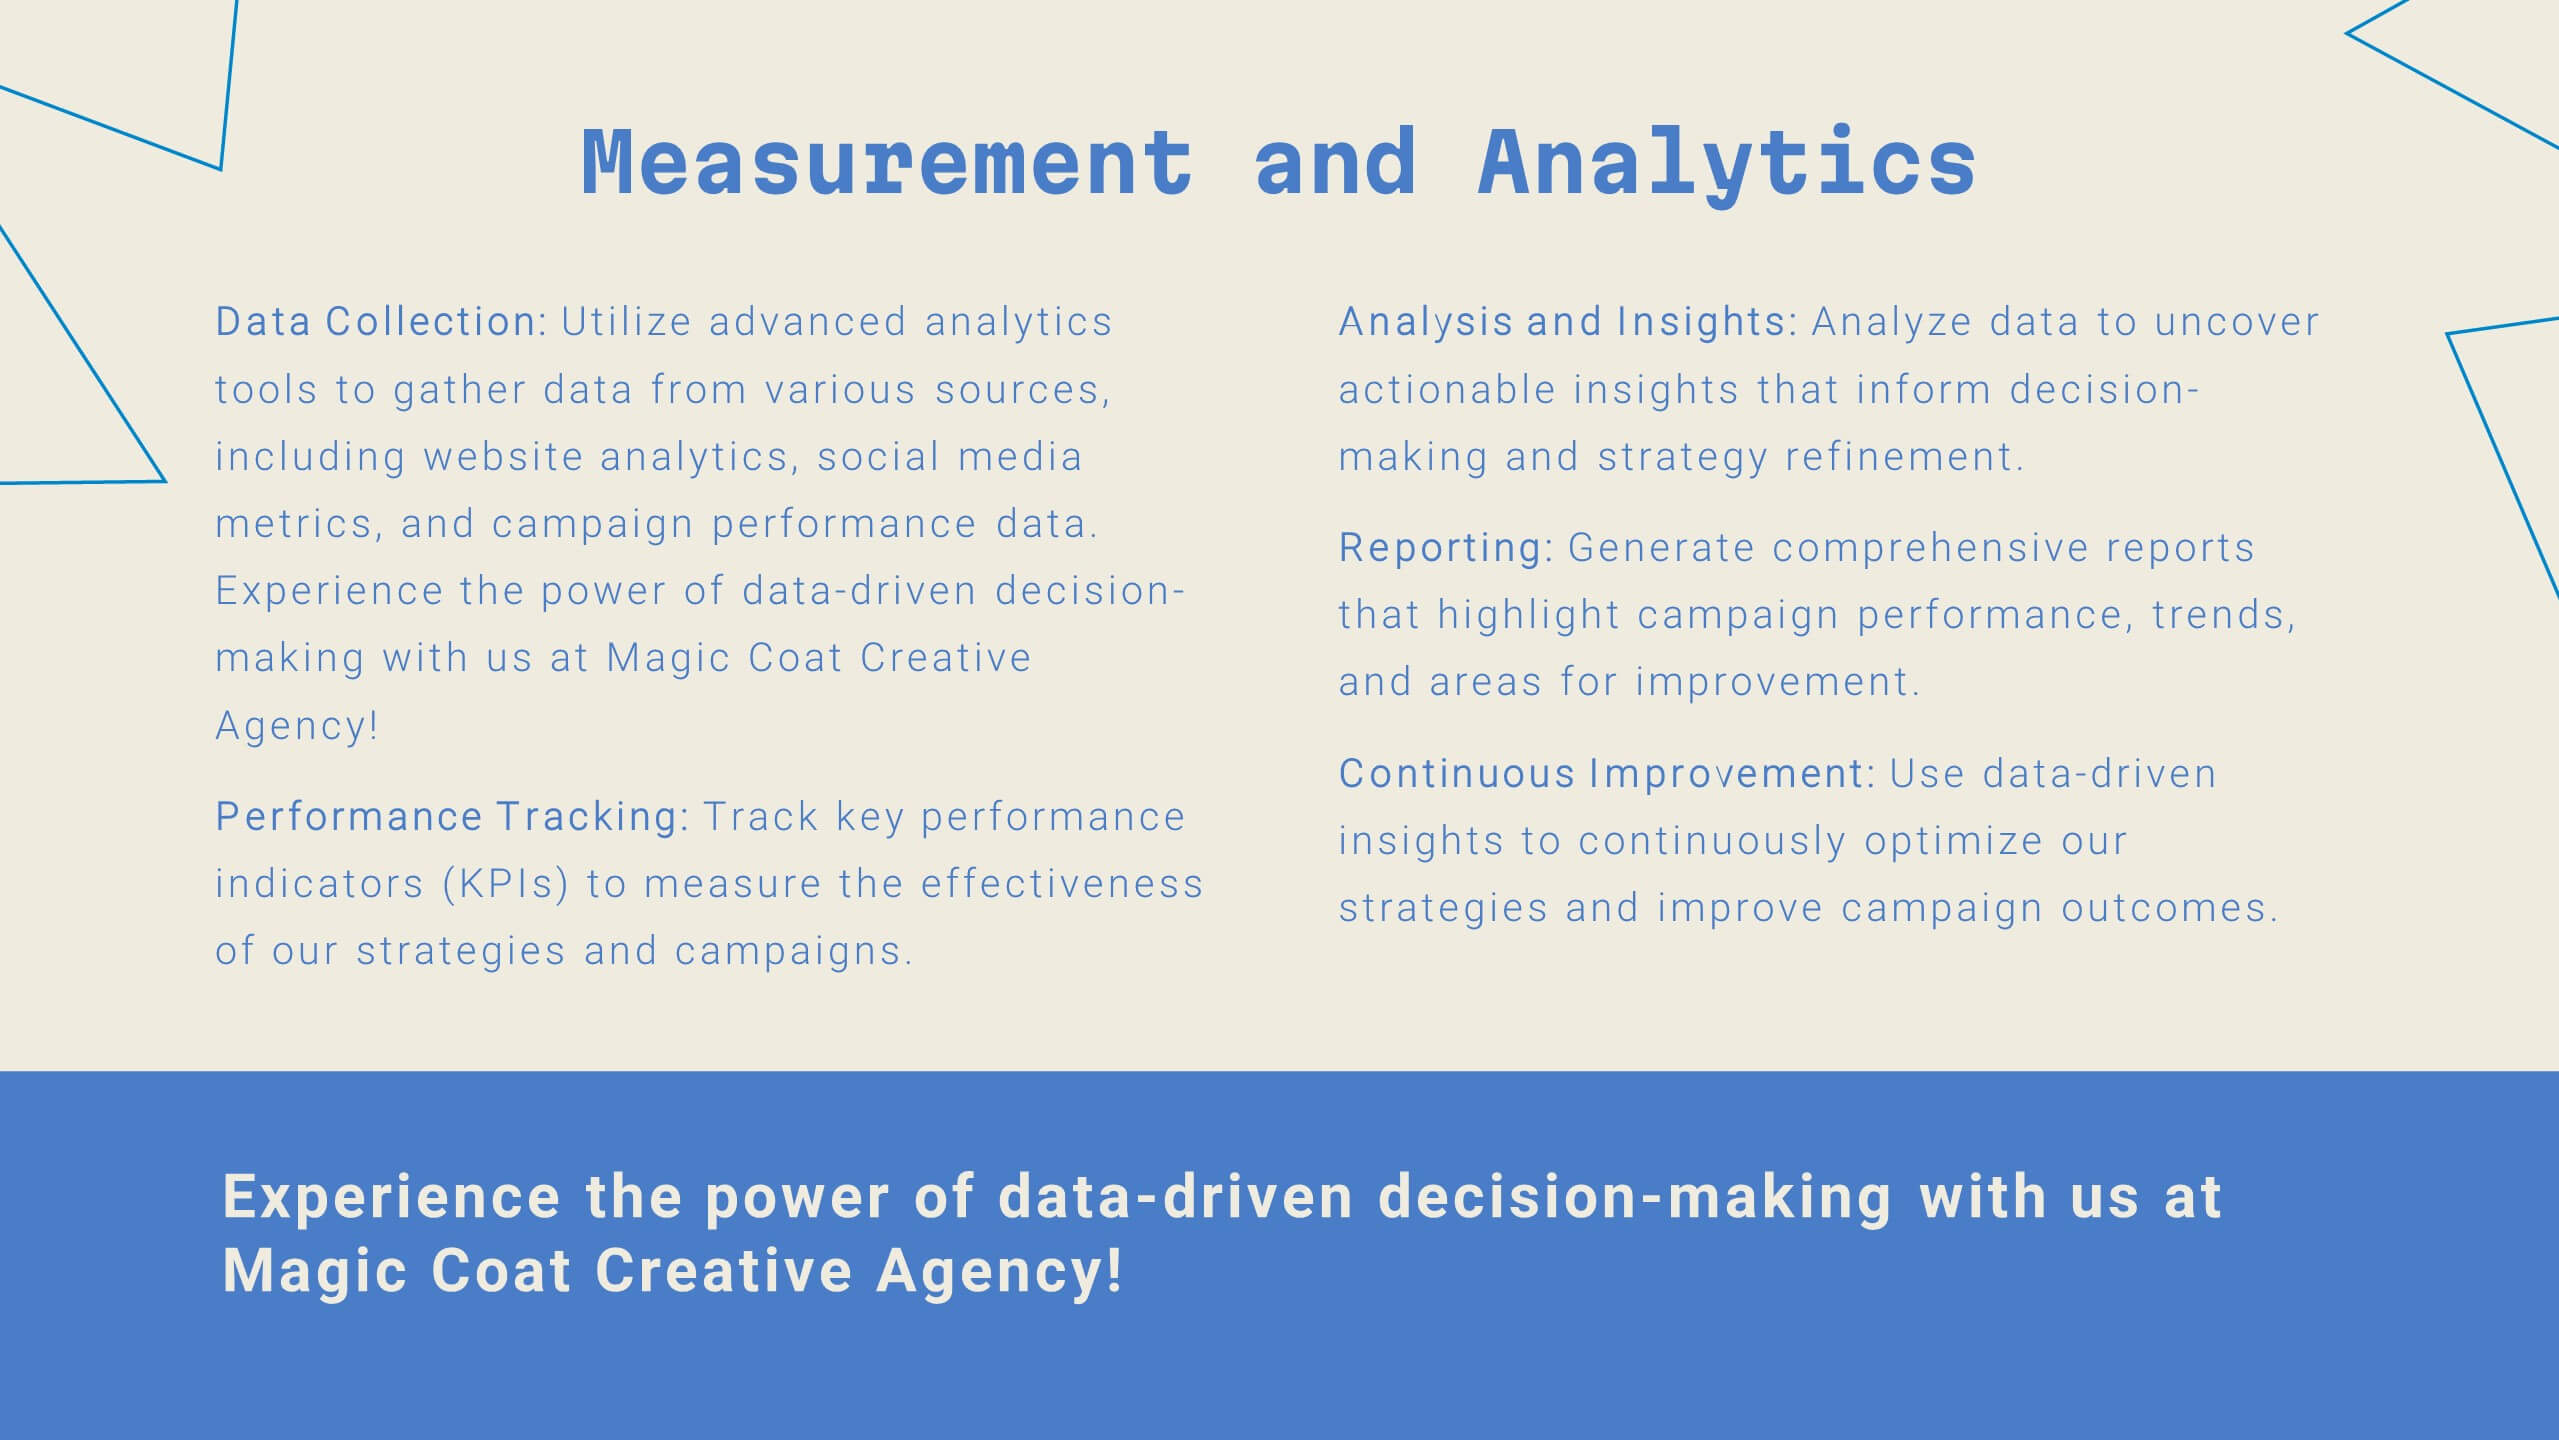
Marketing Strategies Infographics
Marketing Strategies refer to the plans and tactics implemented by businesses and organizations to promote their products, services, or brand to their target audience and achieve their marketing objectives. These infographics focuses on various marketing strategies used by businesses to promote their products or services. This provides a comprehensive overview of key marketing strategies, their benefits, and how they can be implemented effectively. These will help you convey the key concepts and benefits of various marketing strategies. Fully compatible with Powerpoint, Keynote, and Google Slides.


26 slides
Modern Company Profile Striped Presentation
Present your company with style, our modern company profile presentation, is the perfect template to showcase your business in a contemporary and stylish way. This template combines professionalism with a touch of flair and striped elements, making it ideal for modern businesses looking to make a lasting impression. Ideal for tech startups, creative agencies, or a professional service firms, this presentation will help you convey your company's professionalism. Fully customizable and compatible with Powerpoint, Keynote, and Google Slides. This makes it easy for potential clients, partners, and investors to reach out!
22 slides
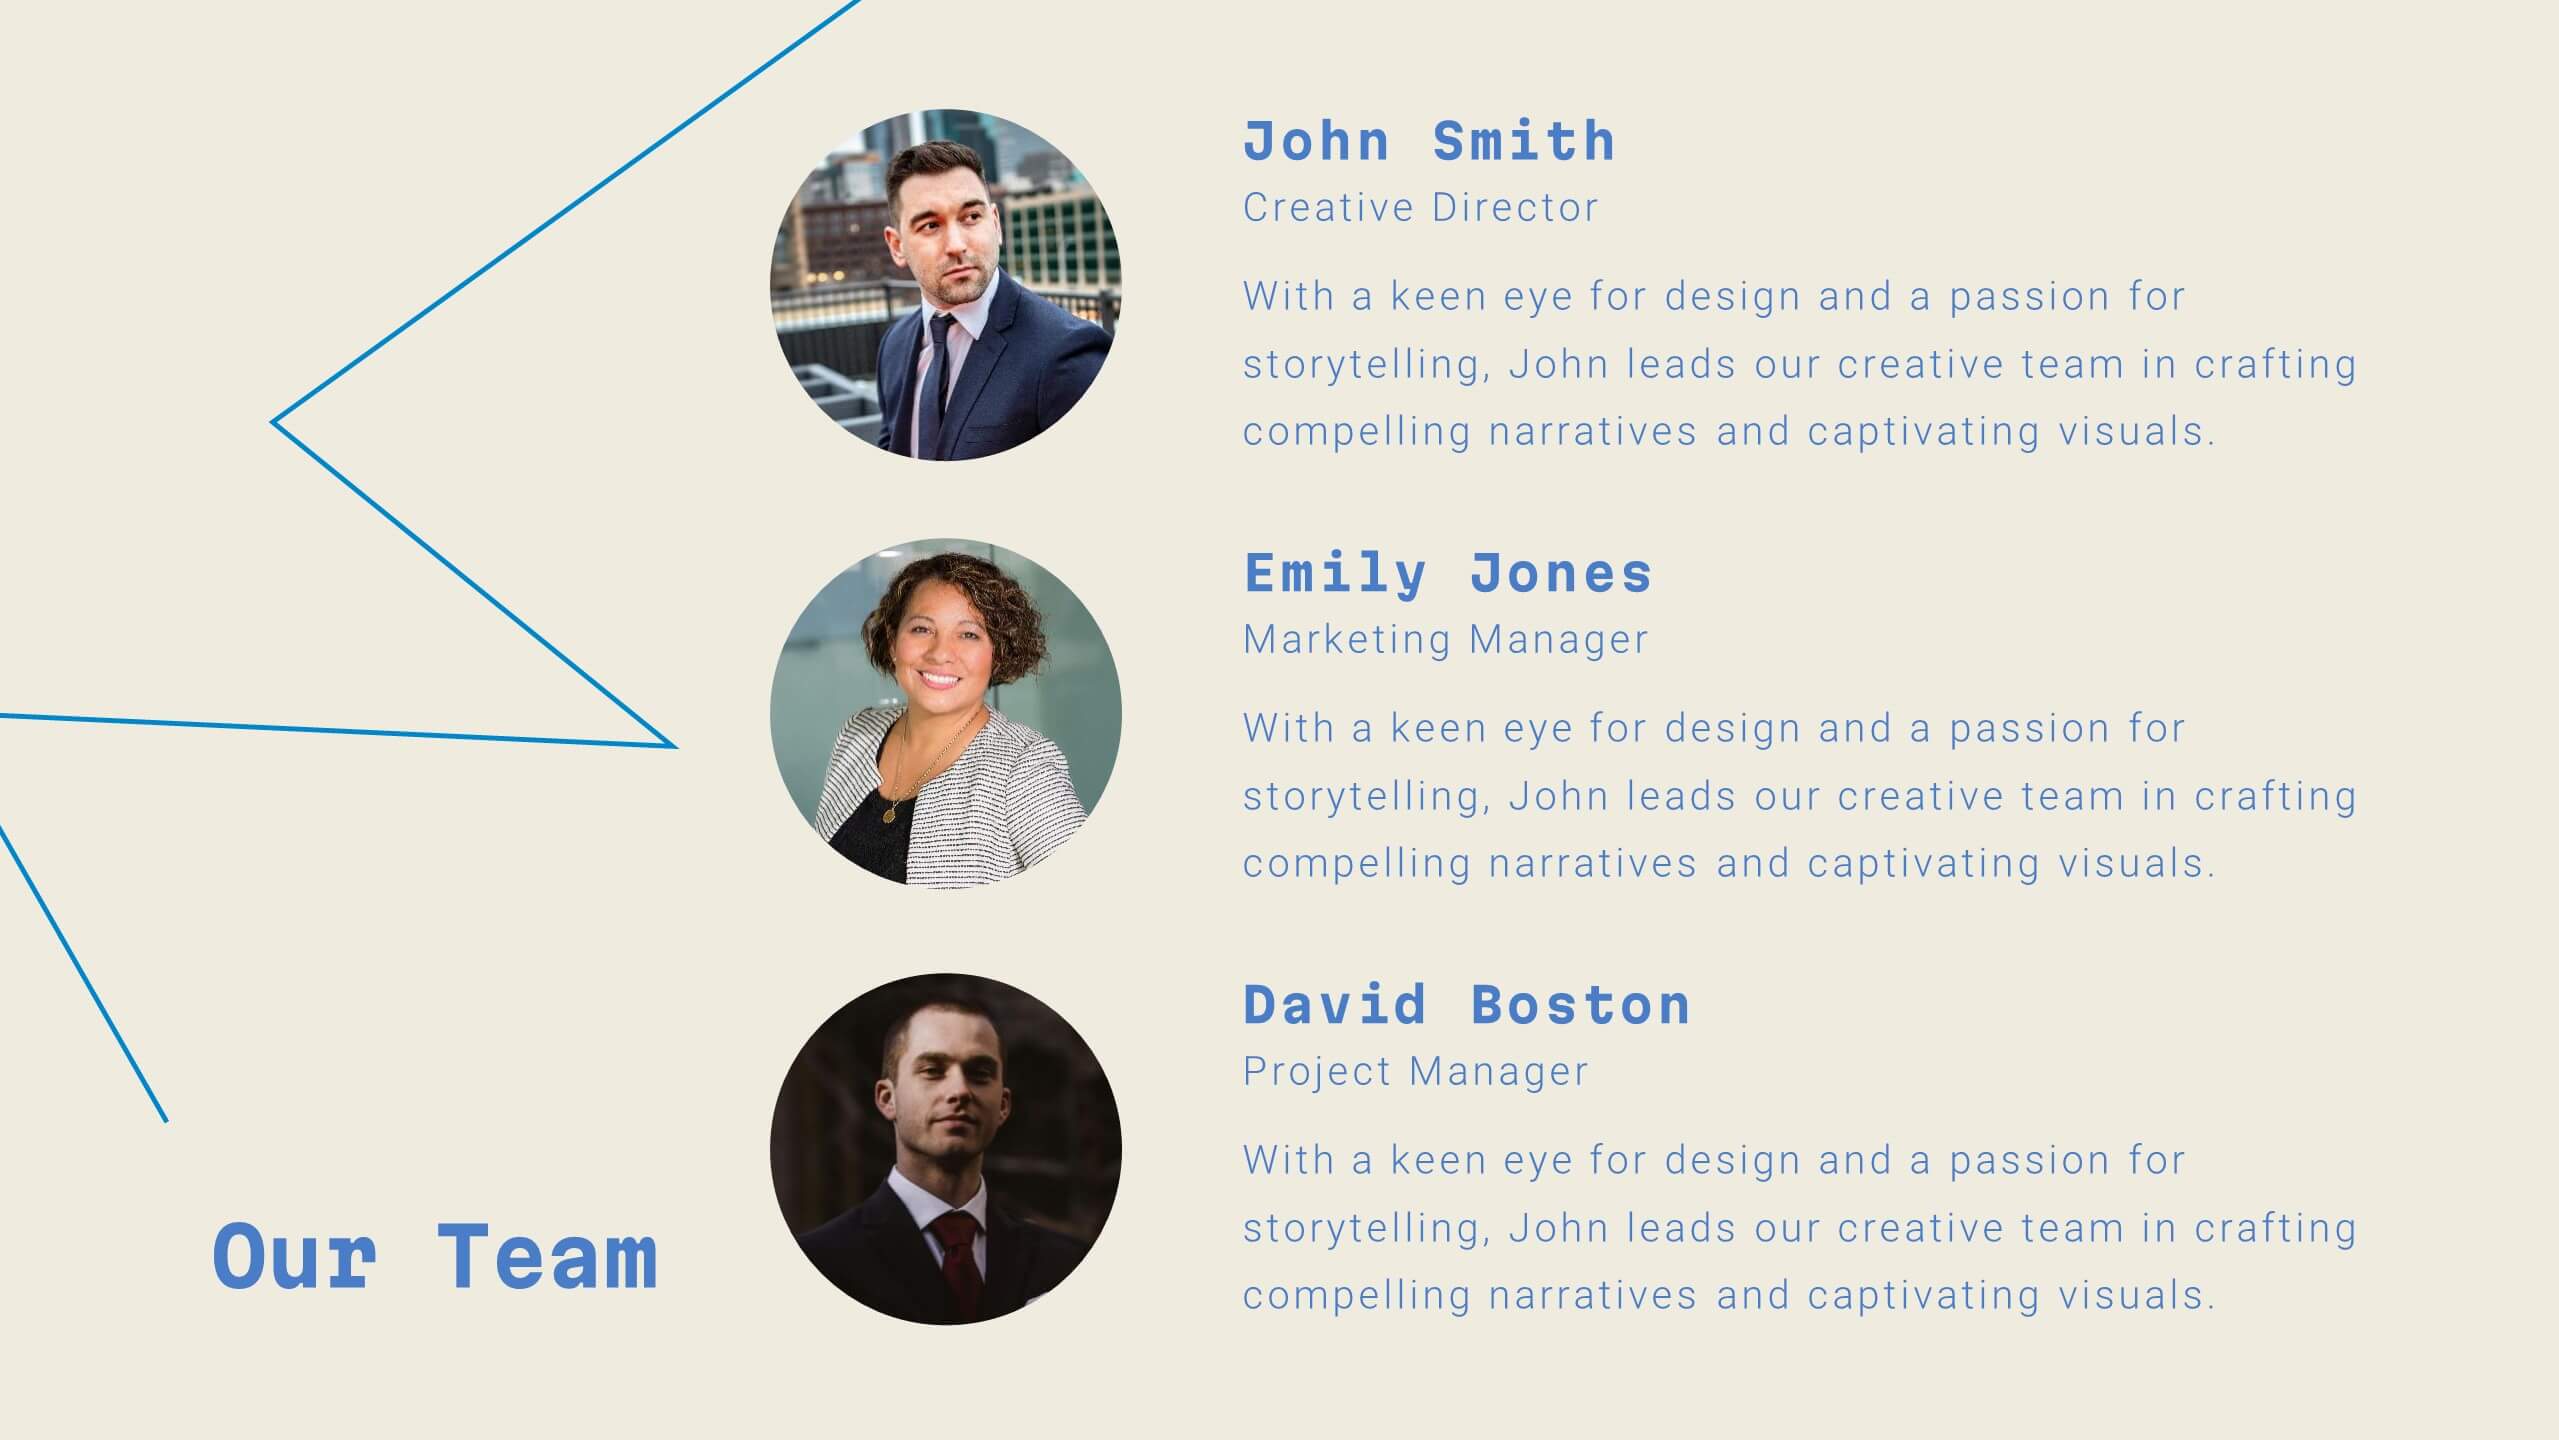
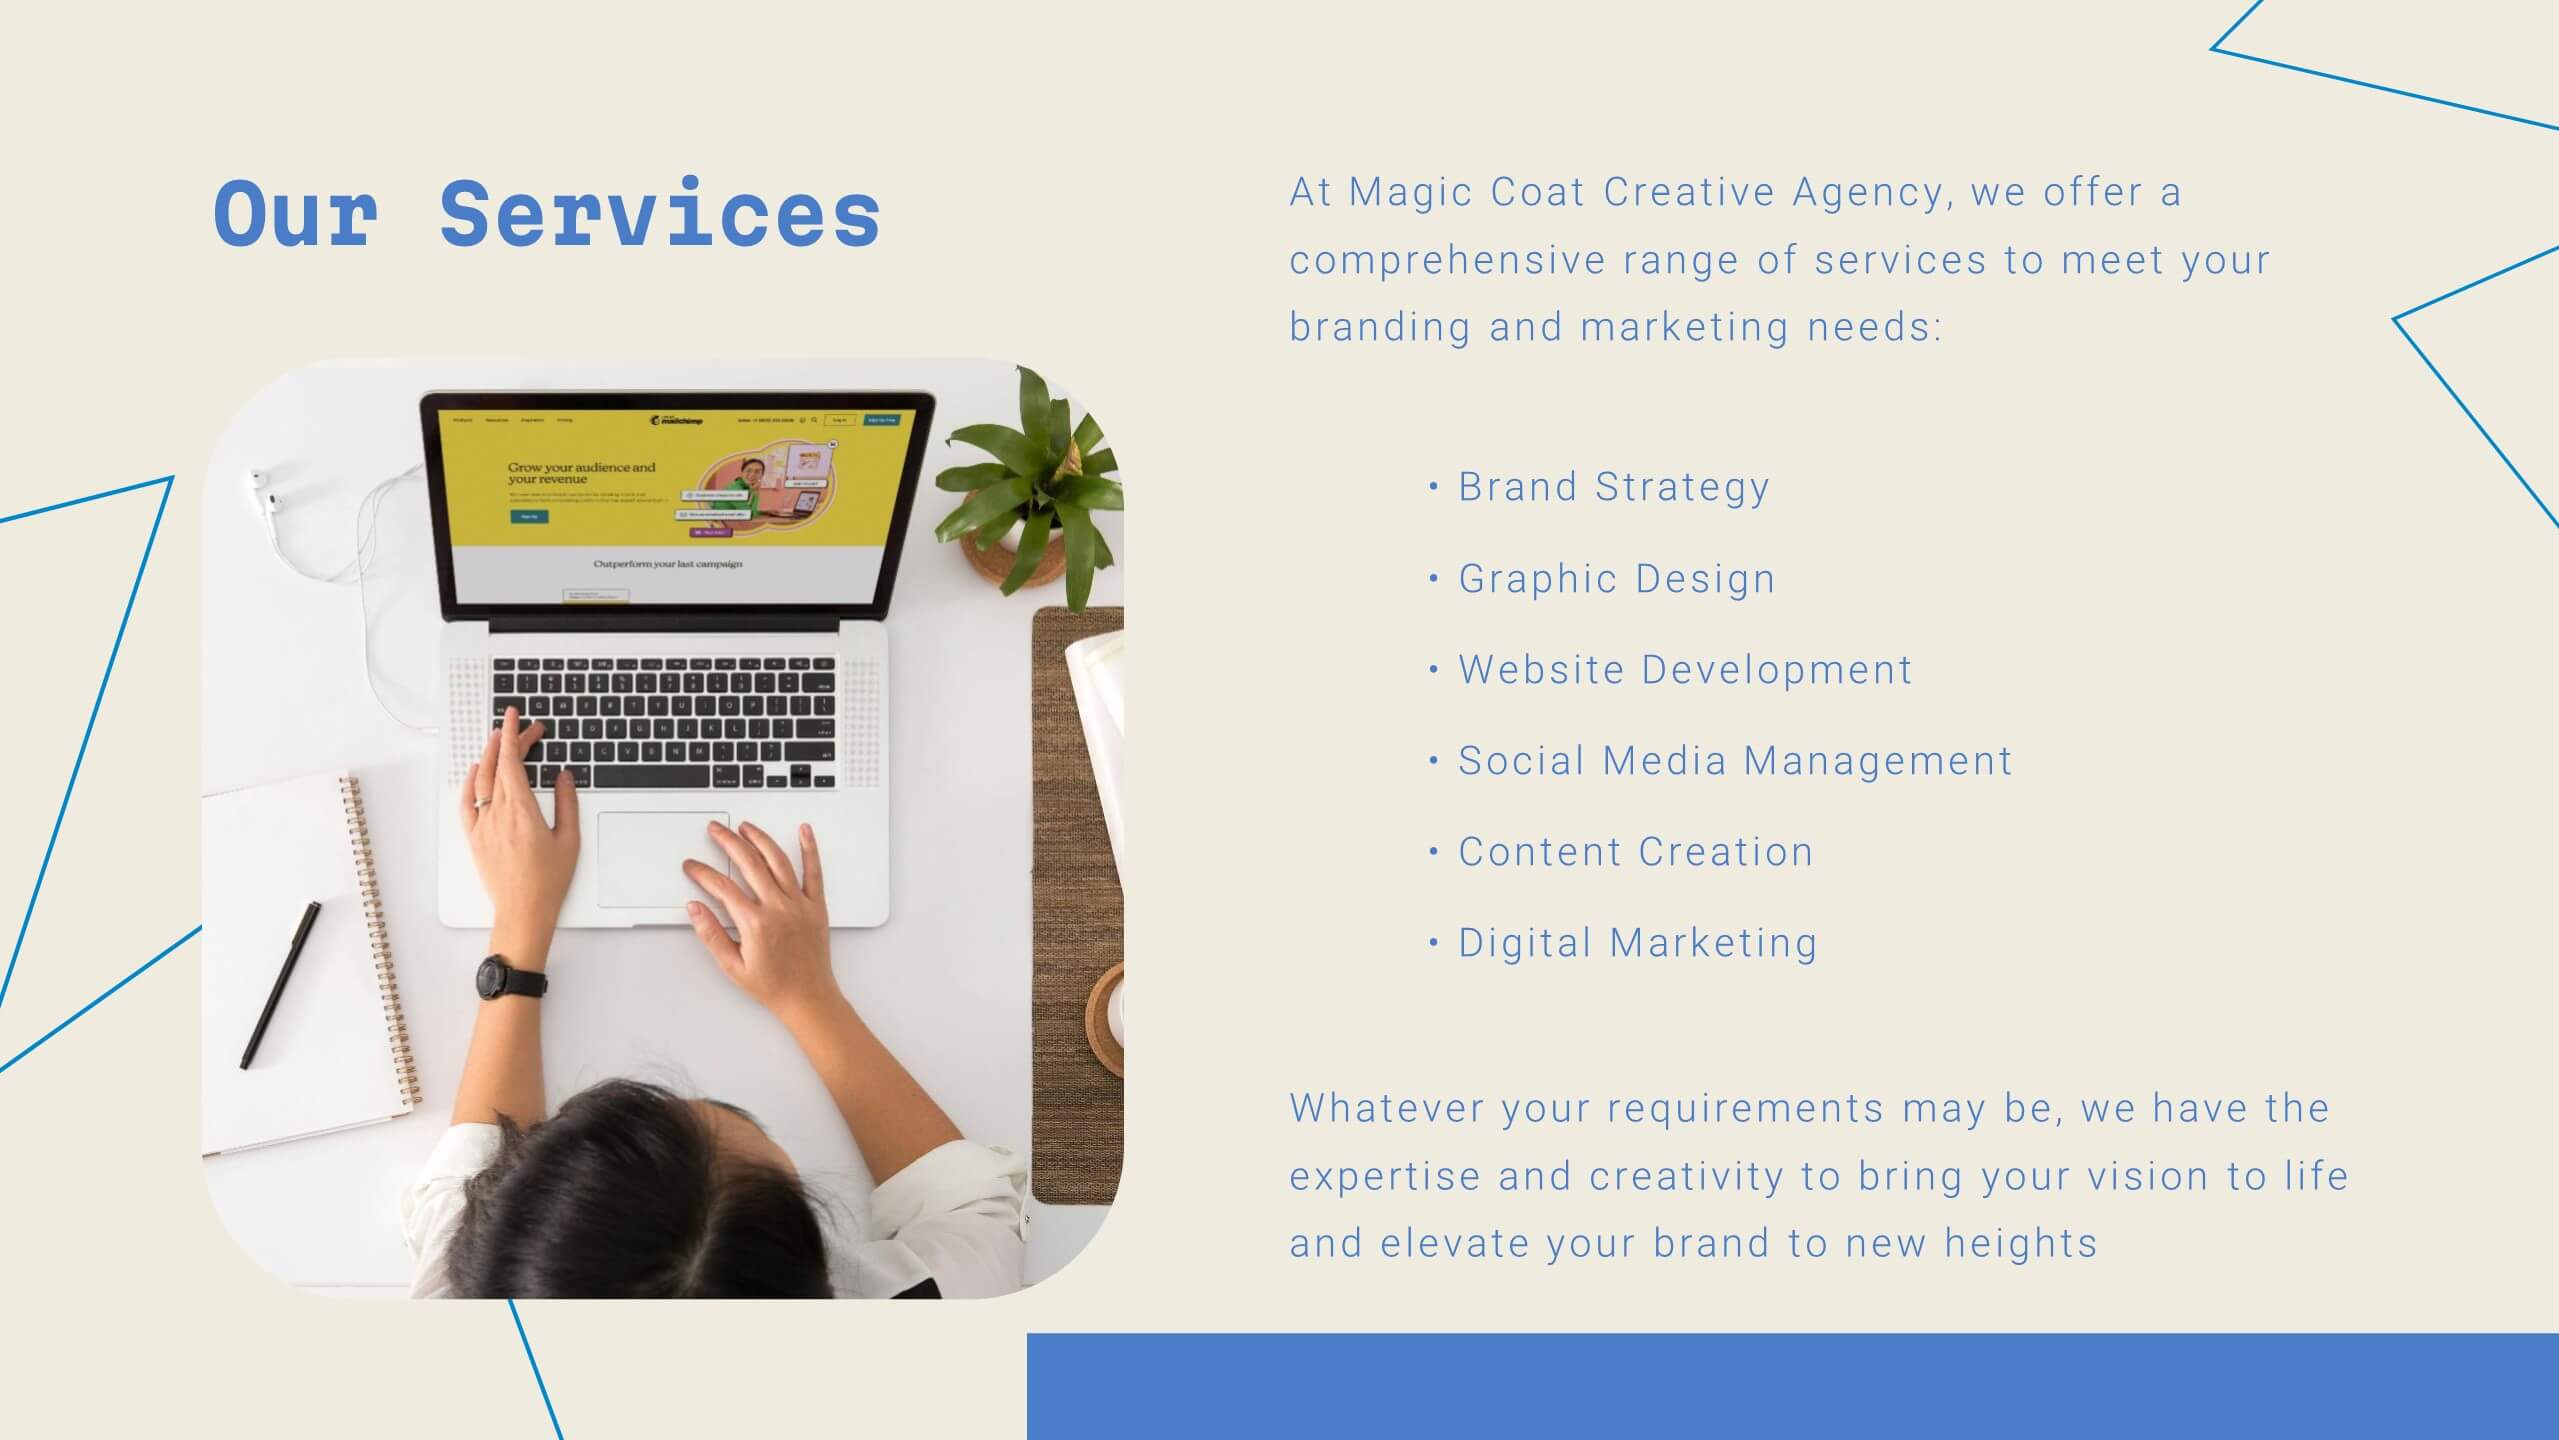
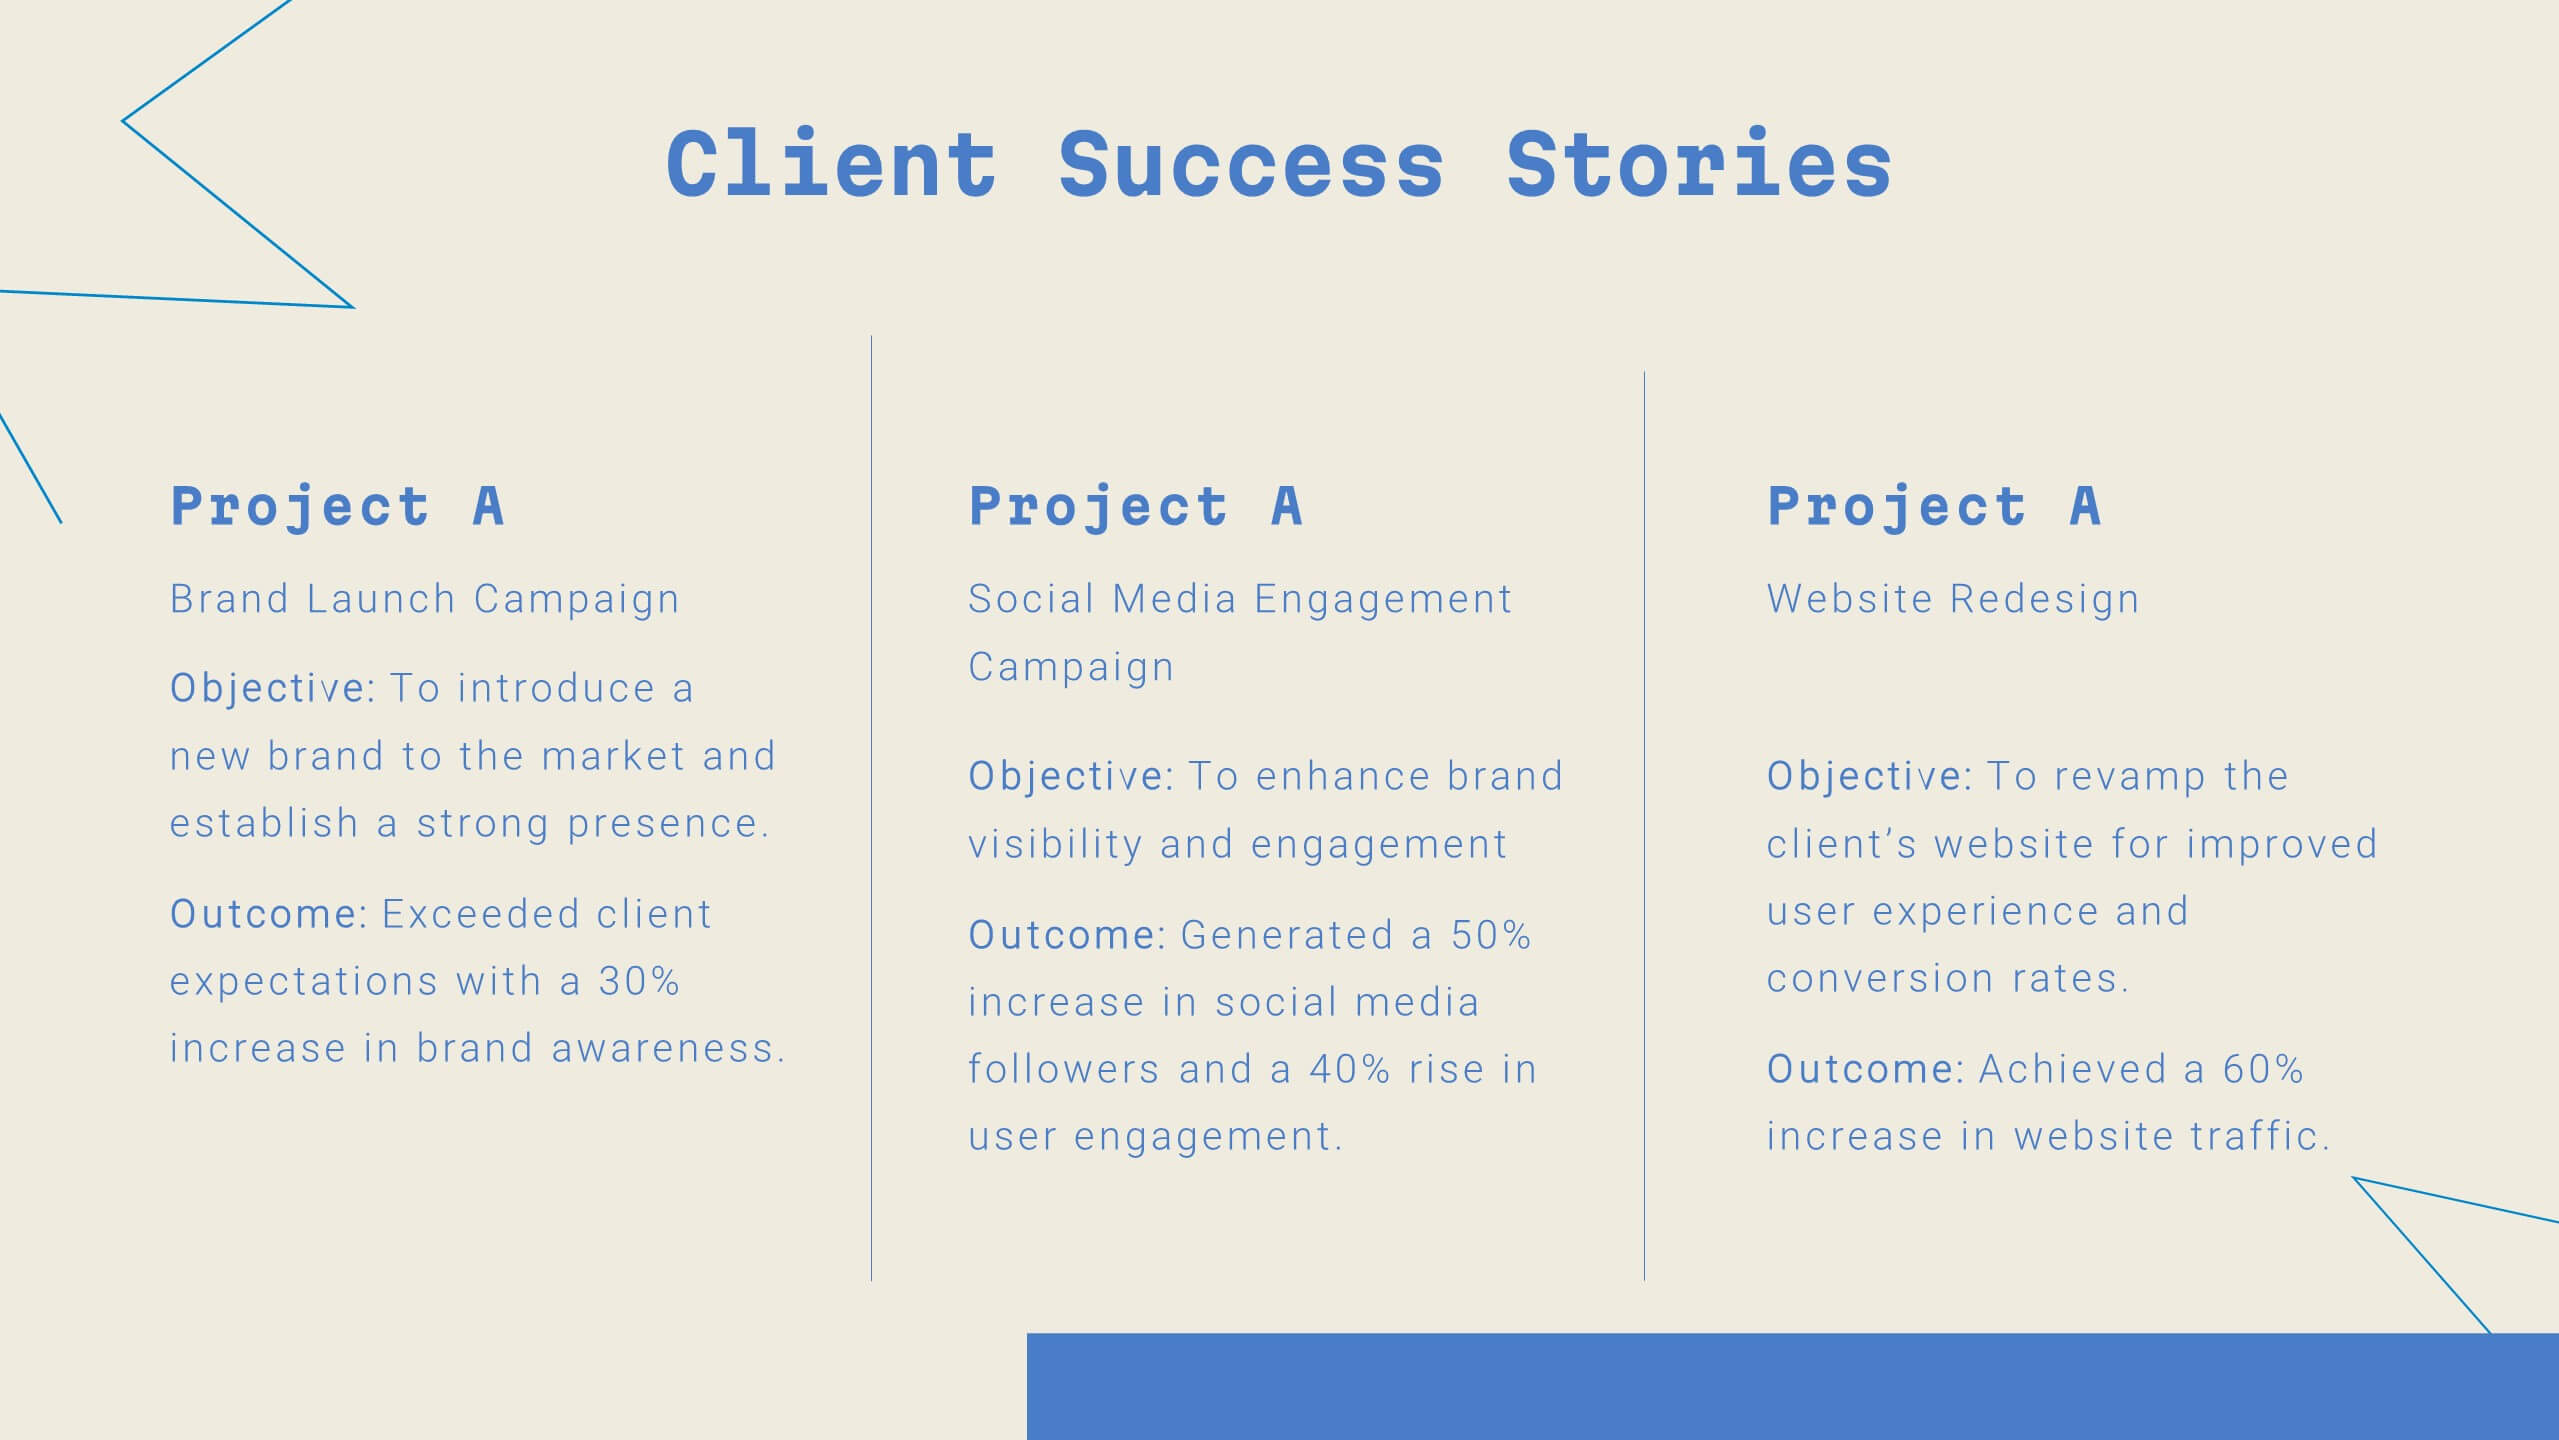
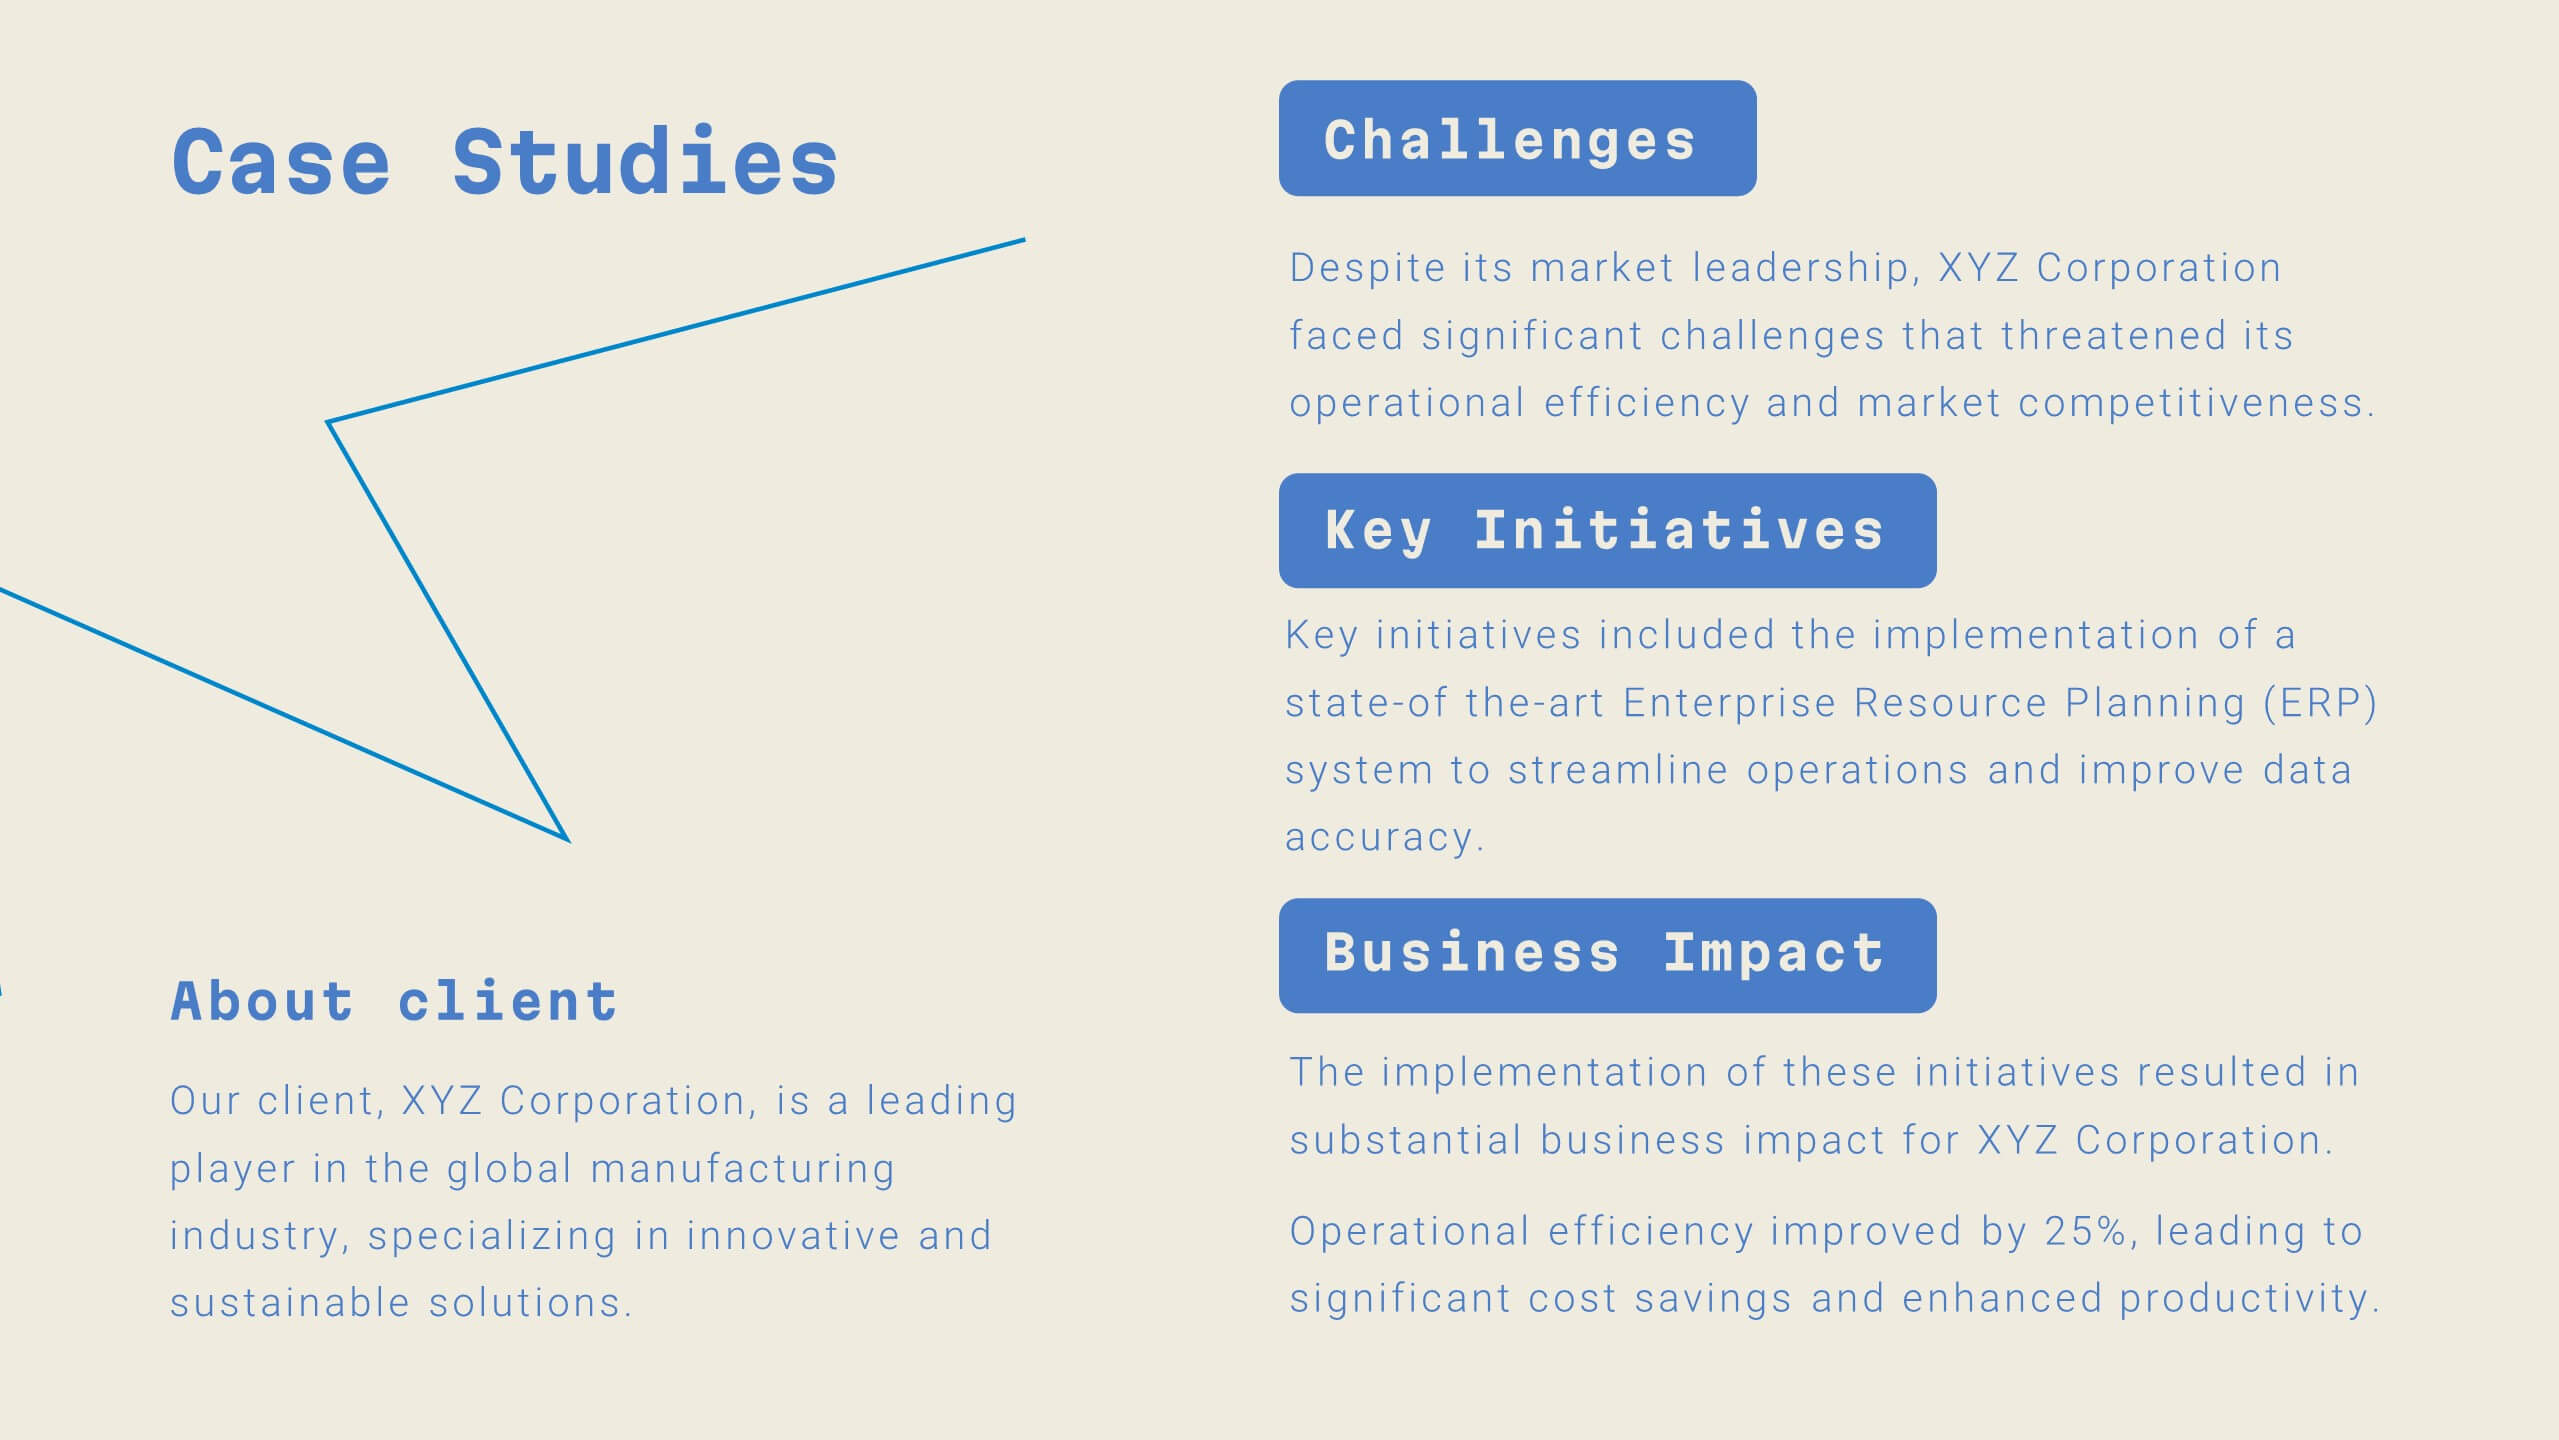
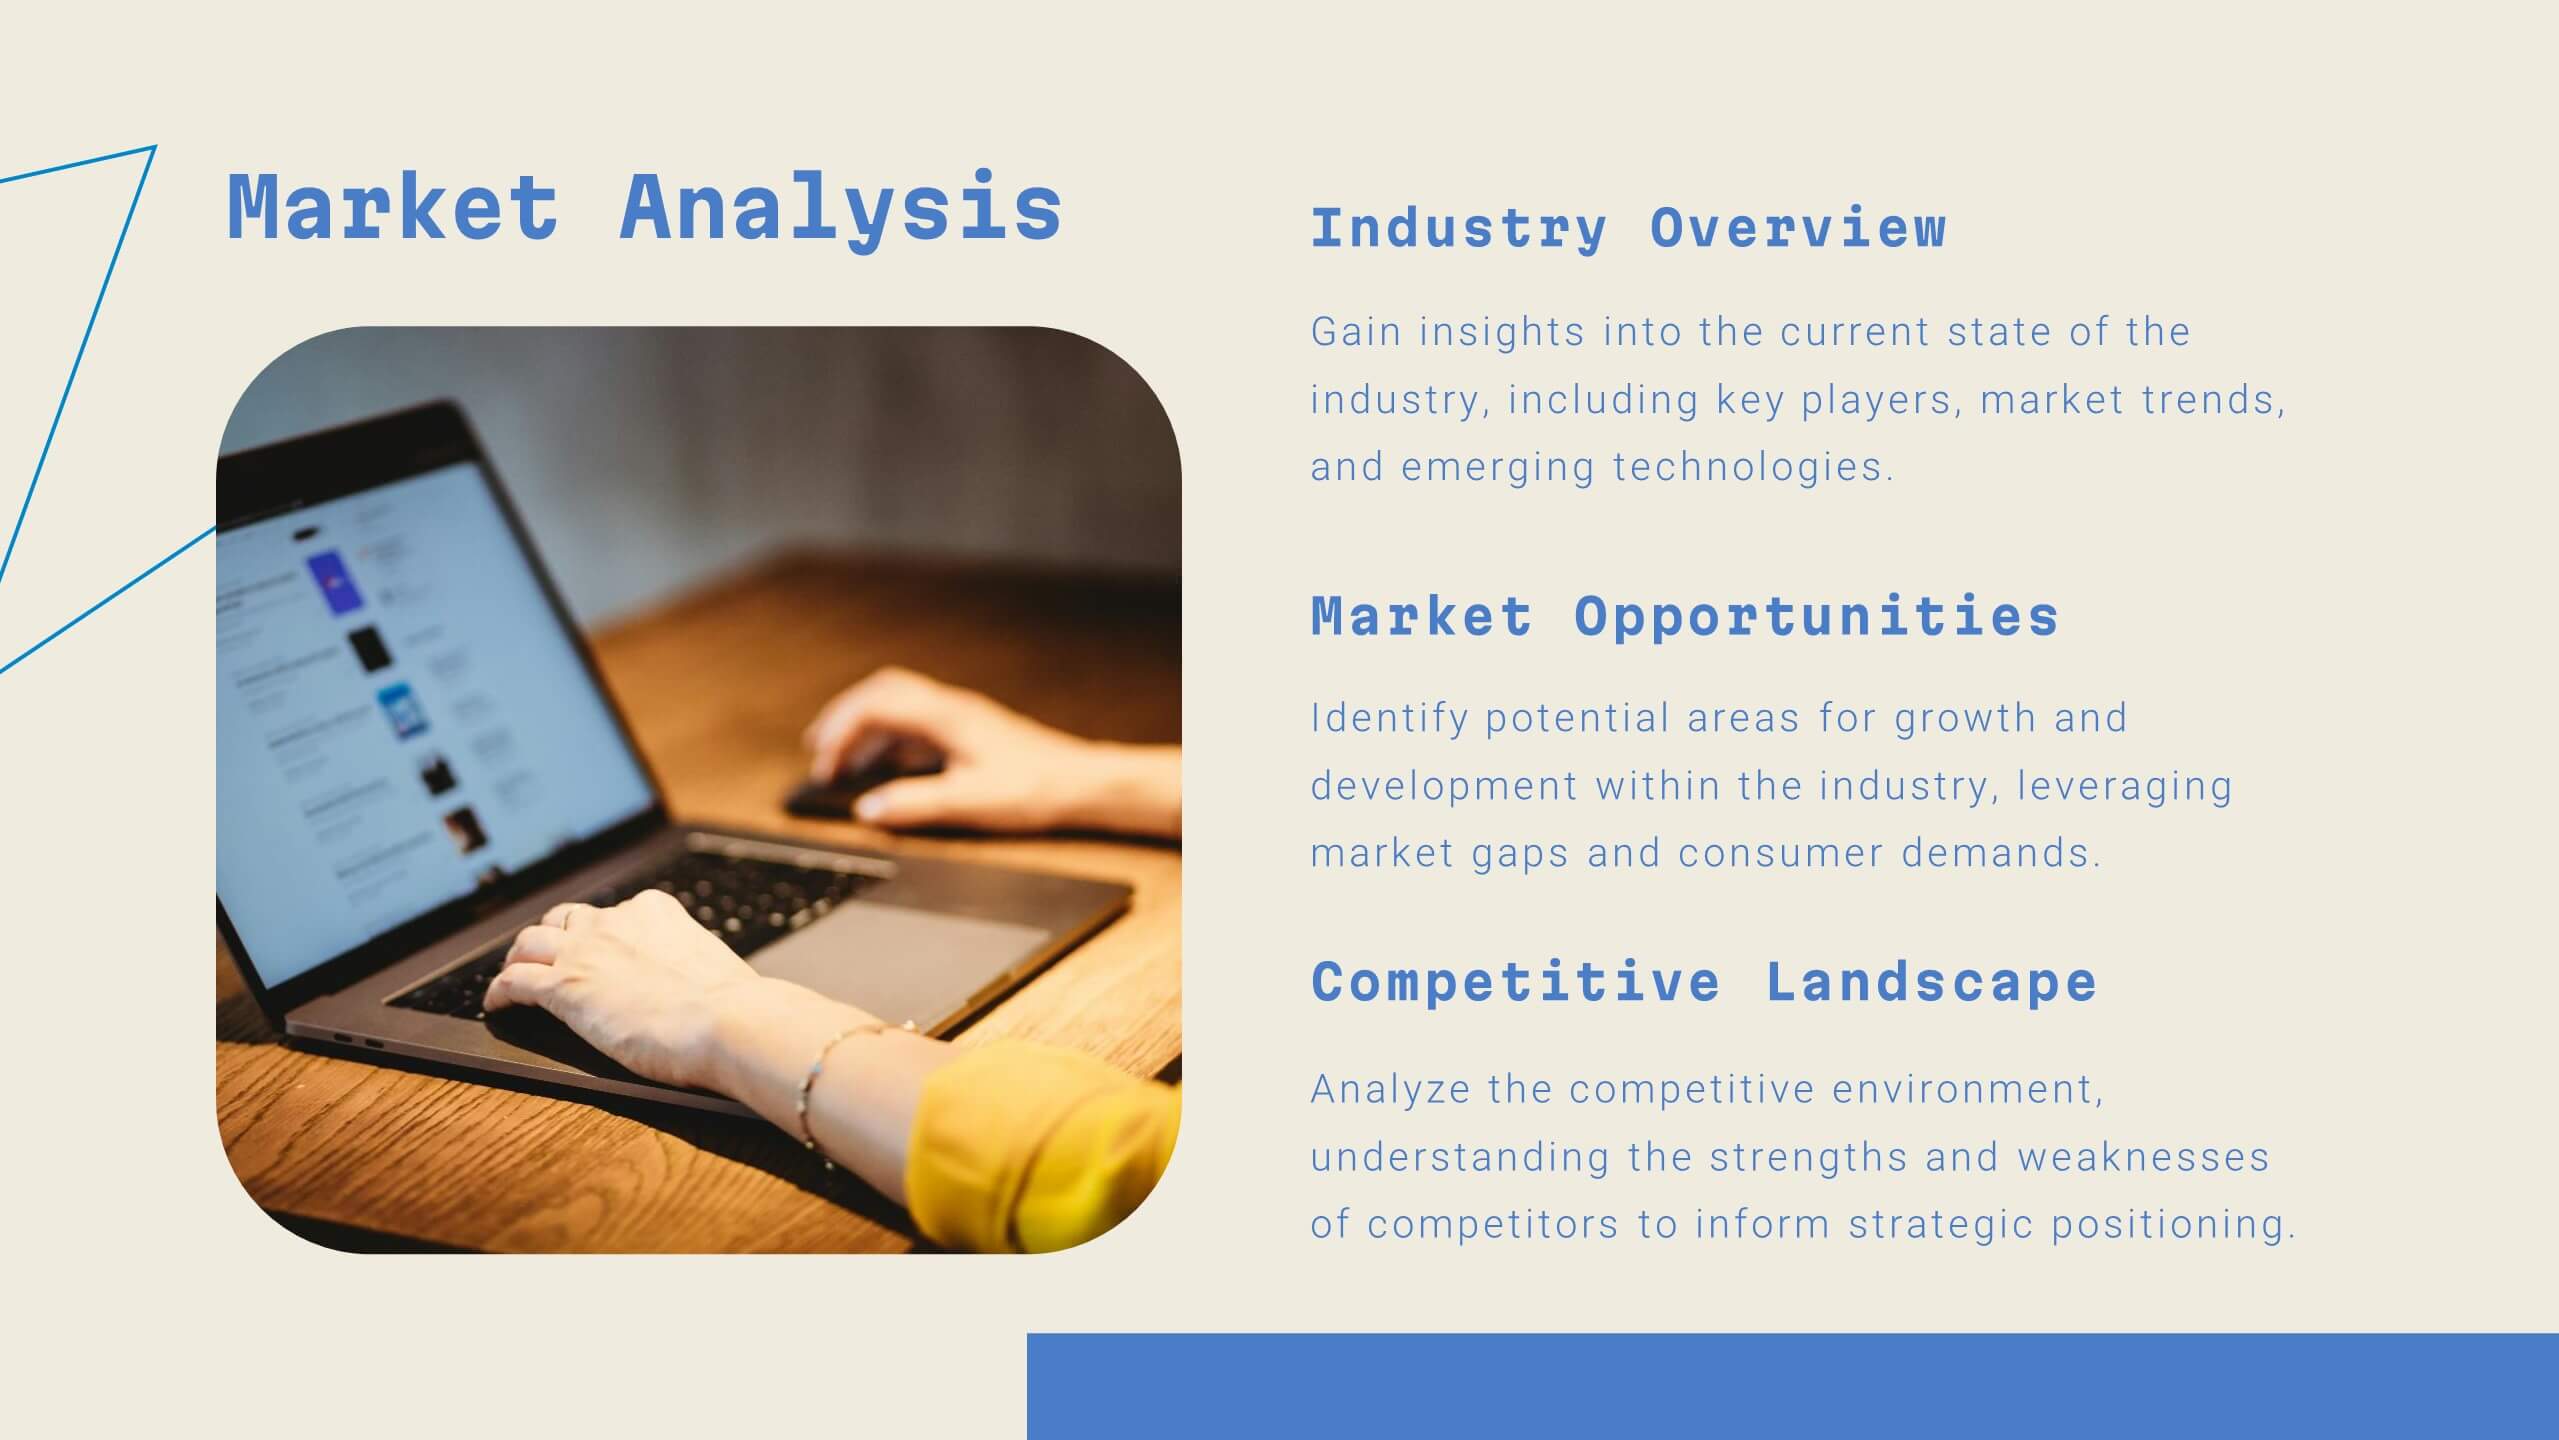
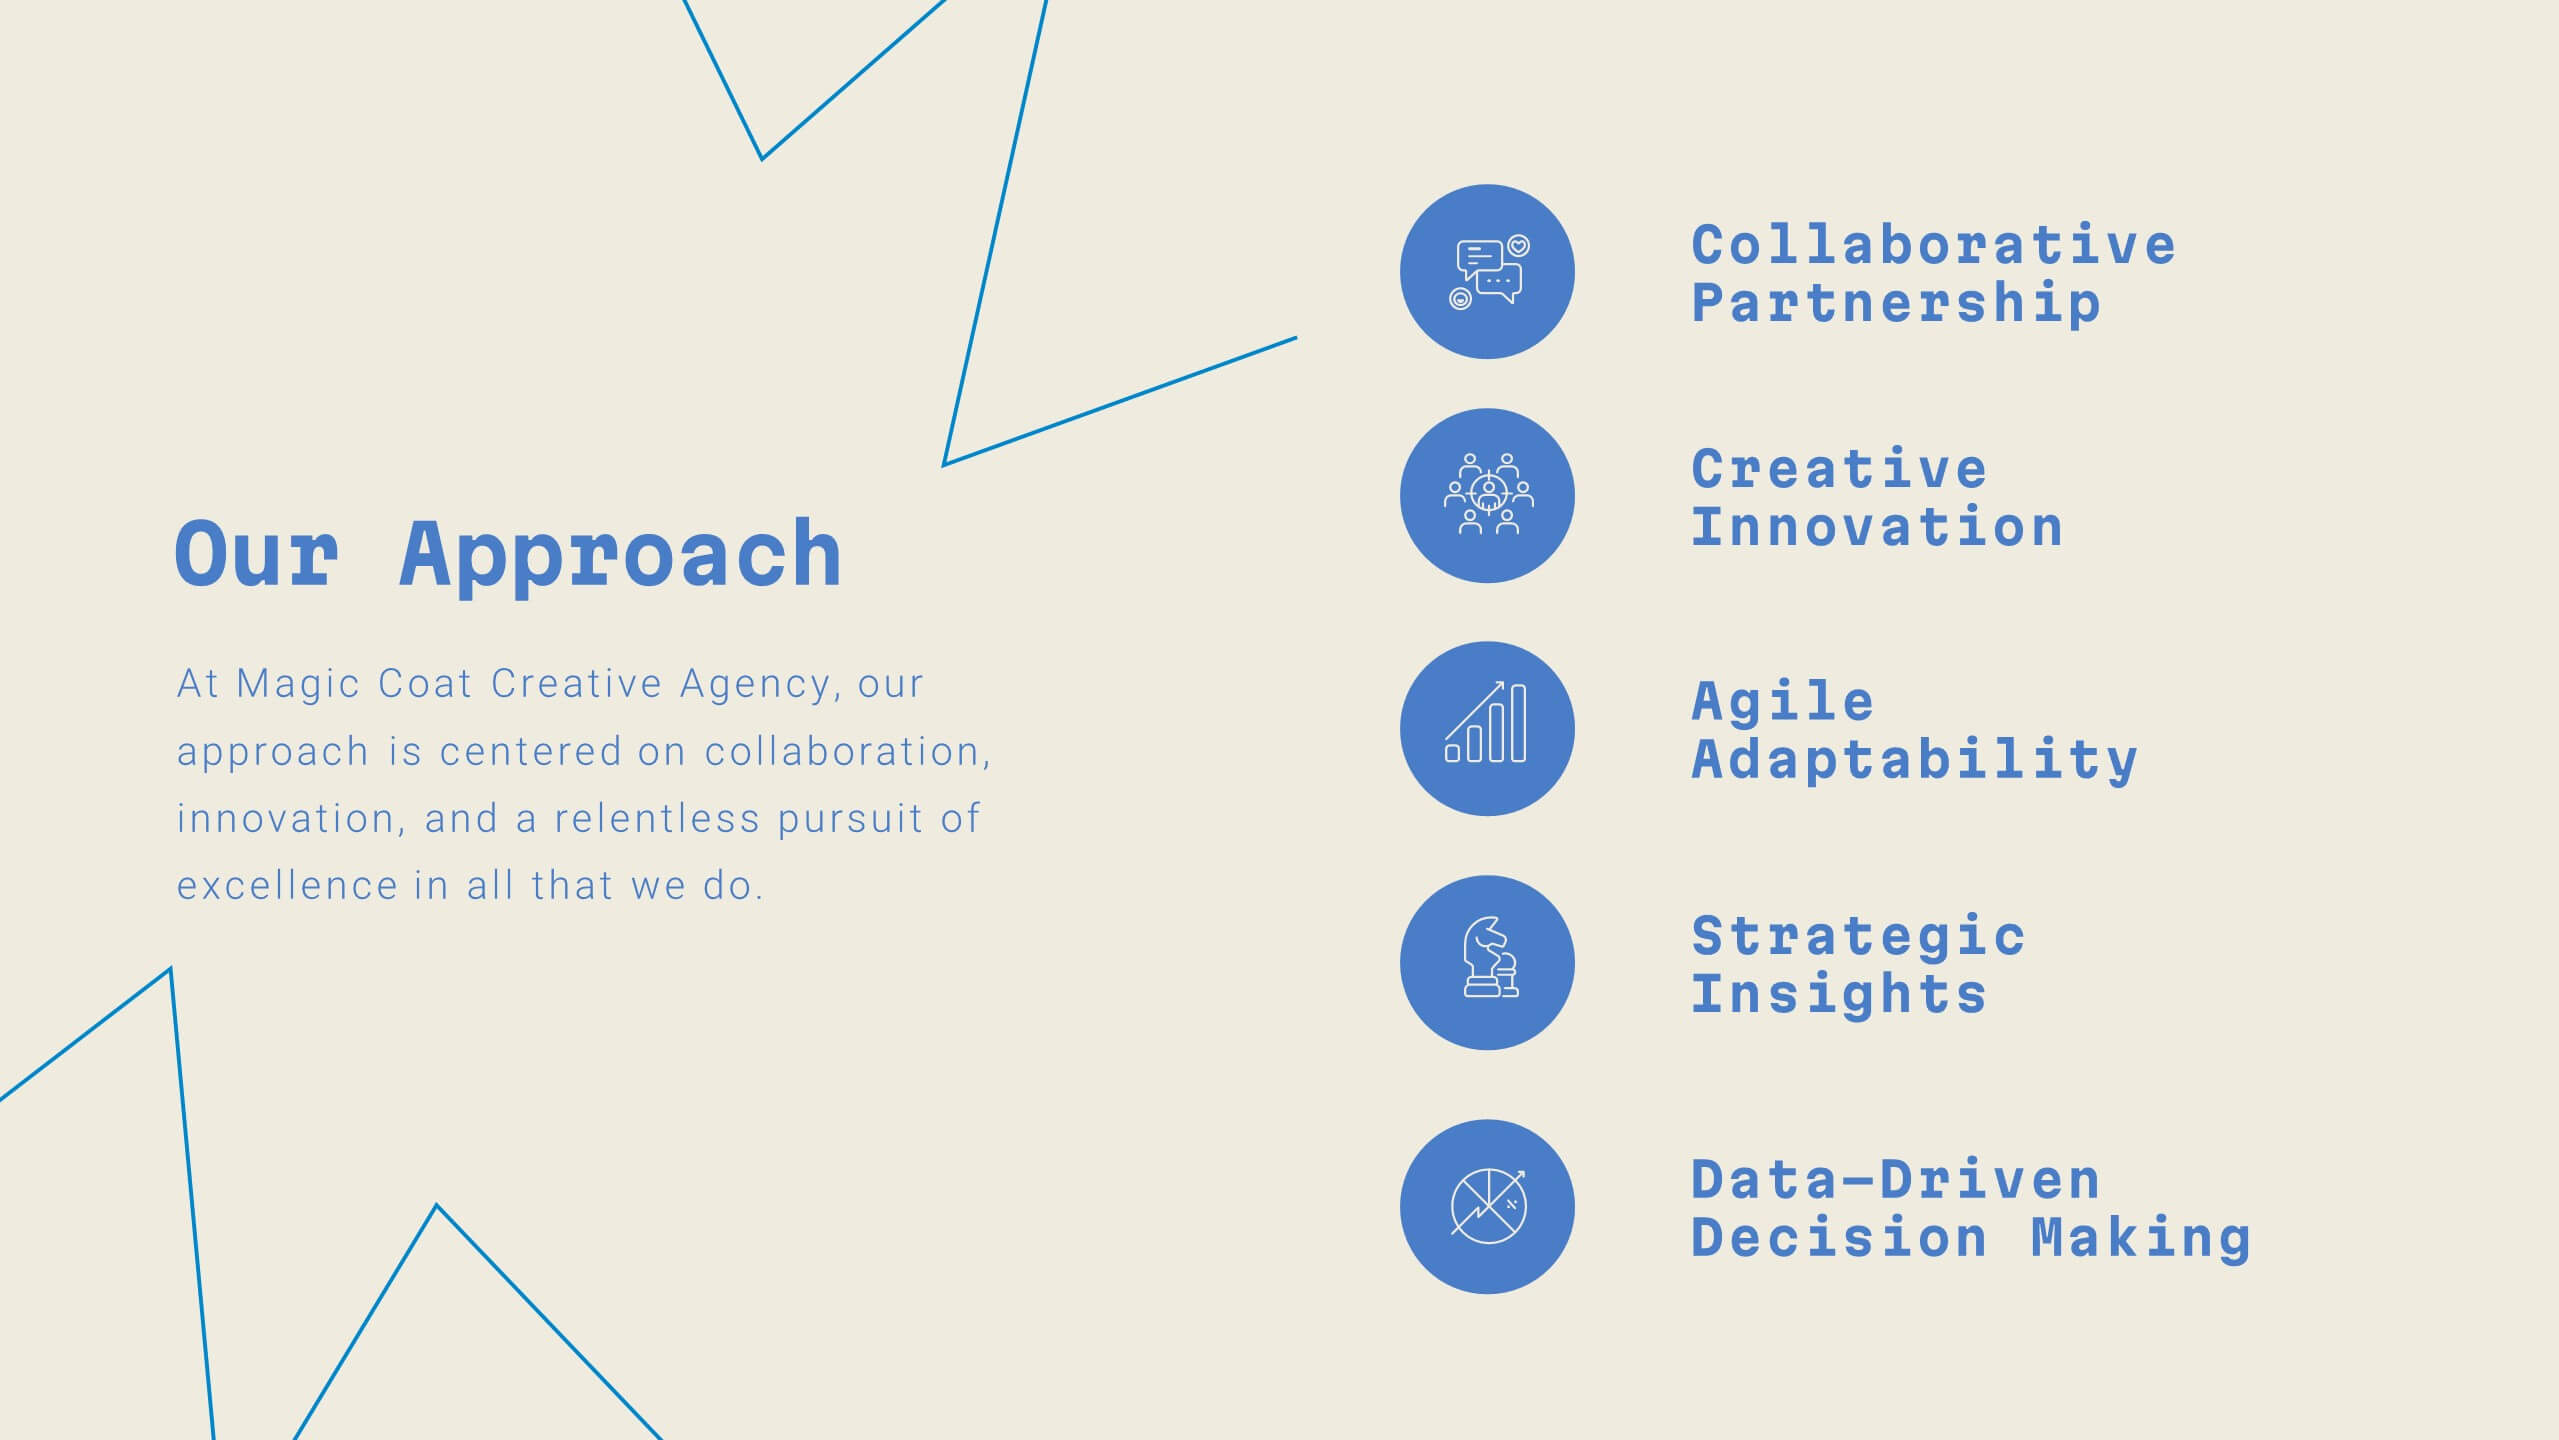
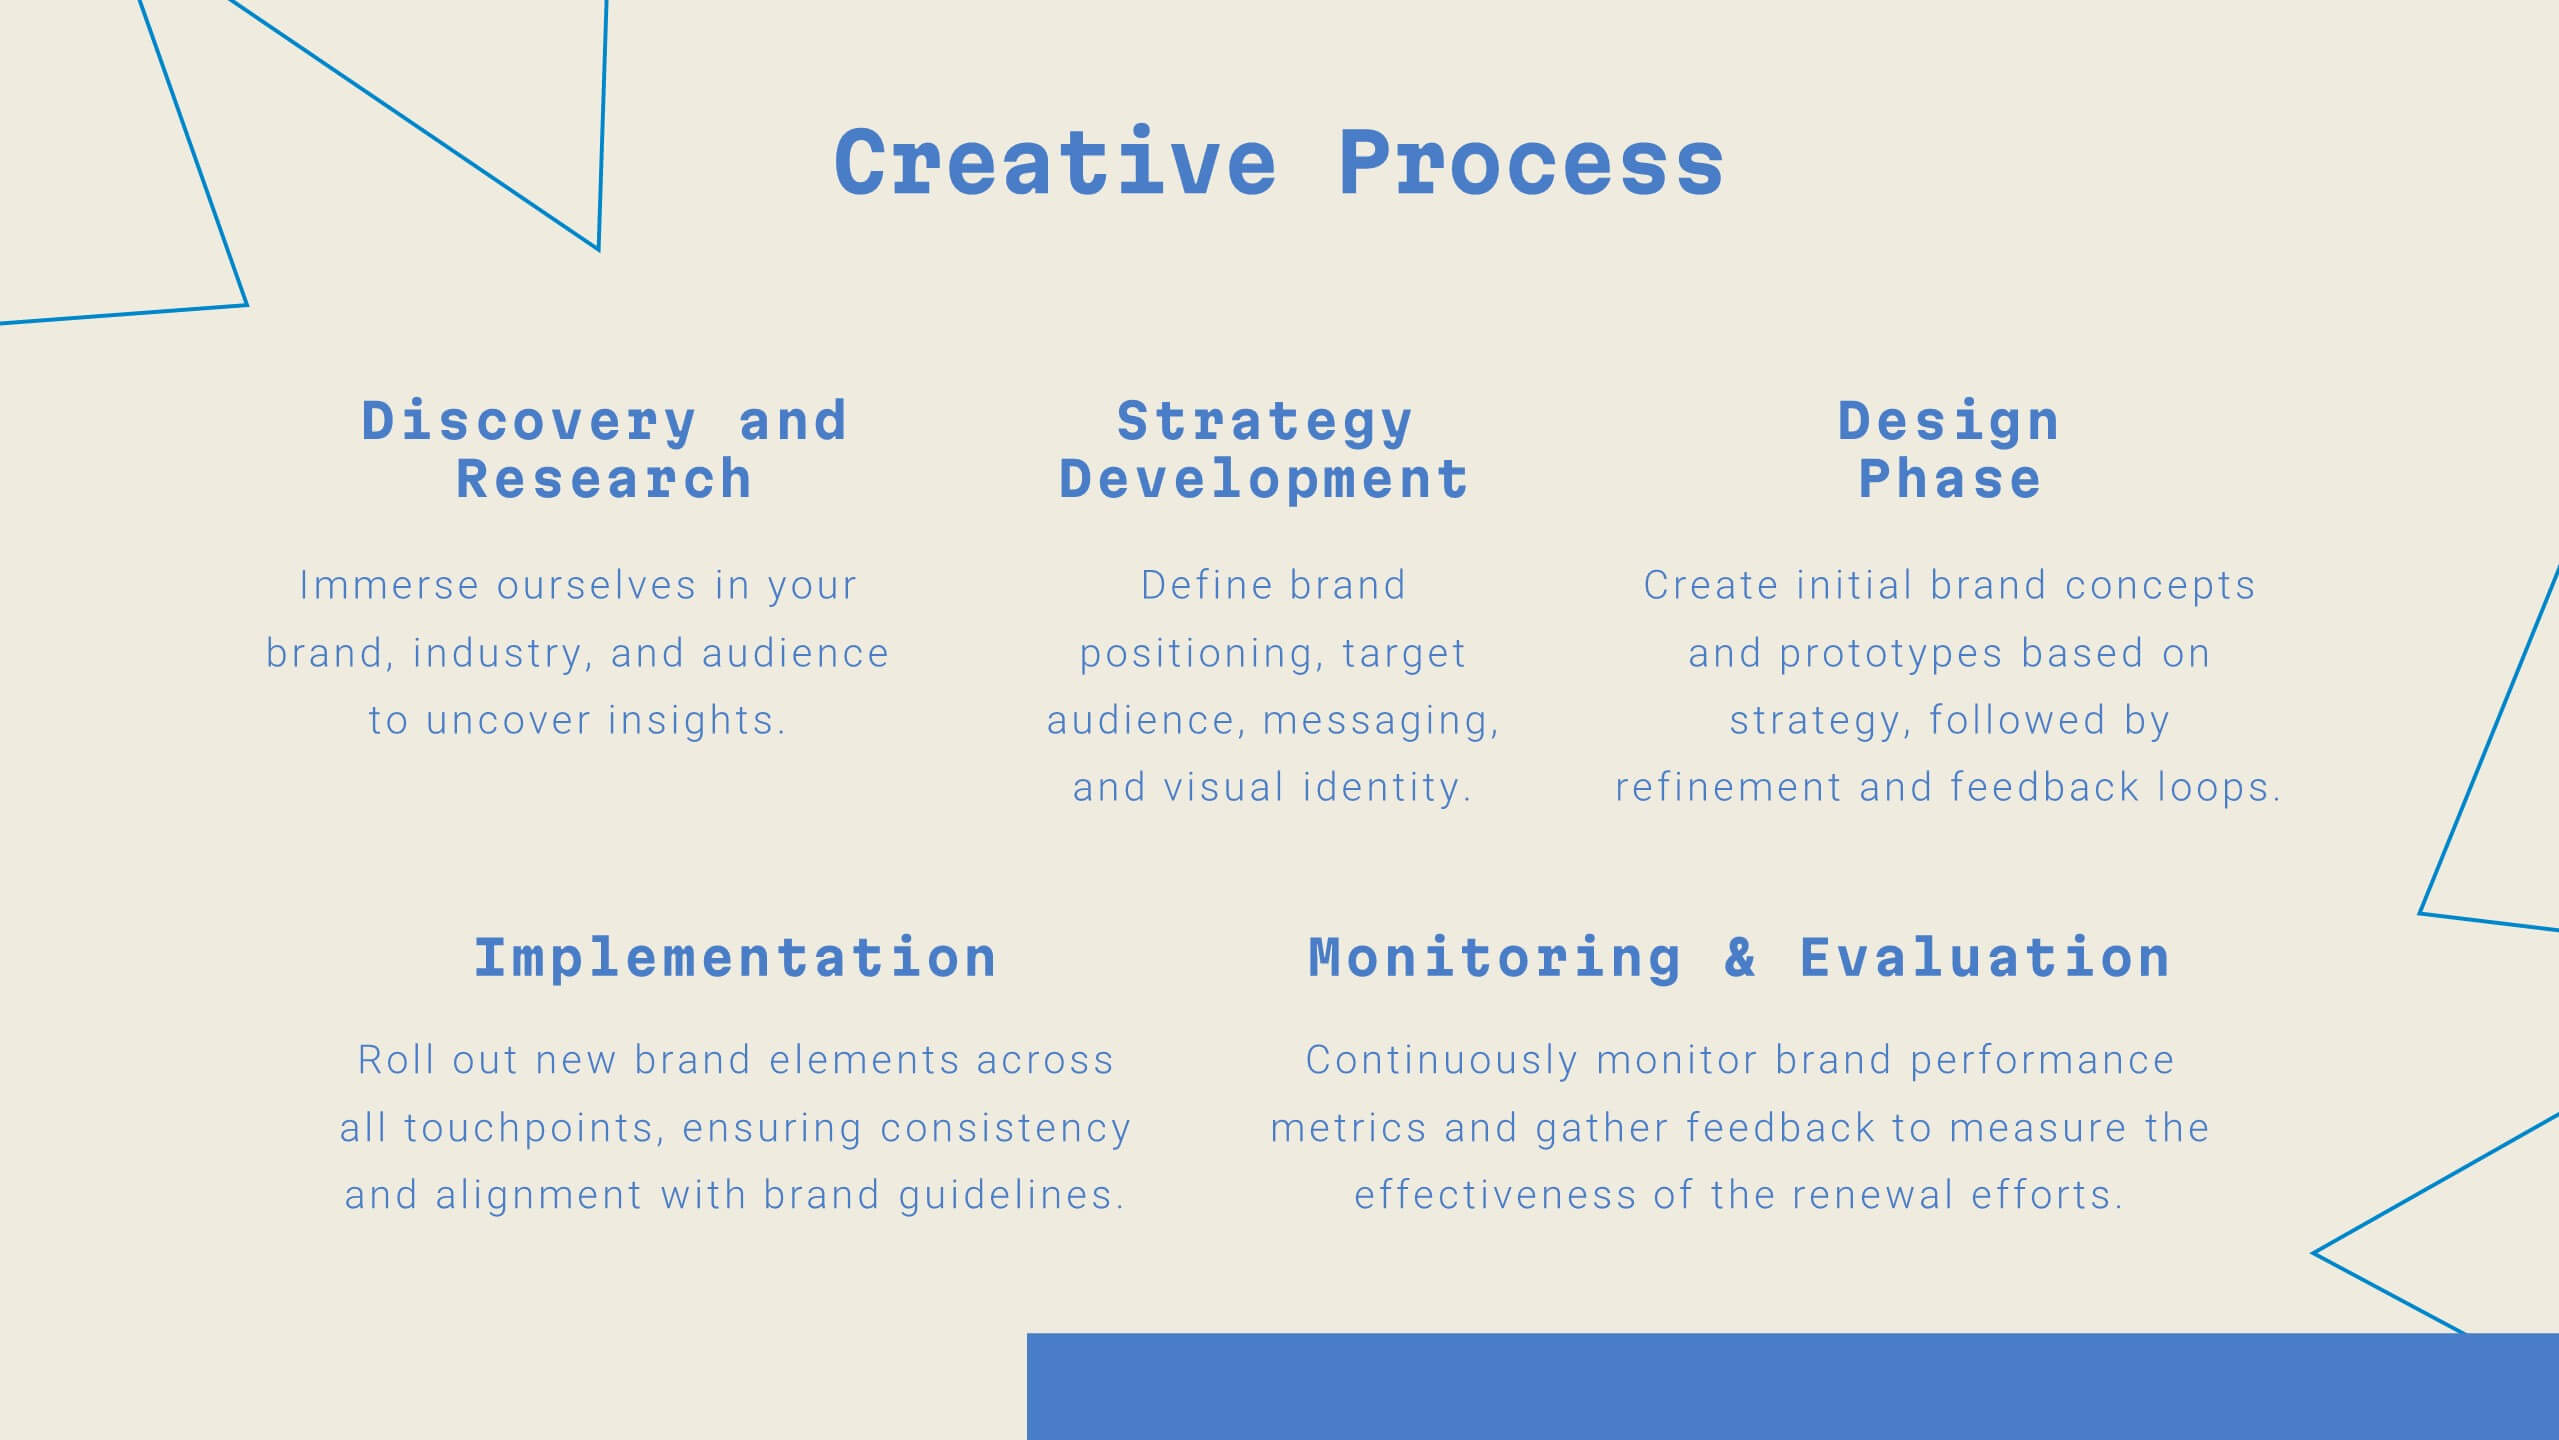
Unity Digital Agency Strategy Plan Presentation
Step into the future of digital marketing with this sleek template! From case studies to strategy development, it offers a comprehensive guide for creating impactful presentations. Highlight client success stories, industry trends, and creative processes with ease. Perfect for showcasing your agency's expertise. Compatible with PowerPoint, Keynote, and Google Slides.


3 slides
Company Meeting Summary Presentation
Bring clarity and focus to your post-meeting reports with this modern, professional layout. Designed to highlight discussion points, decisions, and next steps, it helps teams stay aligned and informed. Perfect for corporate updates or project recaps, this template works seamlessly with PowerPoint, Keynote, and Google Slides for quick, easy customization.


6 slides
Market Trends and Risk Analysis with PESTEL Presentation
Present strategic insights with clarity using this Market Trends and Risk Analysis with PESTEL slide. Ideal for business consultants, marketers, and strategic planners, this slide helps dissect external factors—Political, Economic, Sociocultural, Technological, Environmental, and Legal—into clearly labeled segments using a modern hexagonal layout. Each section offers dedicated space for brief analysis or key data points, making it perfect for risk assessment, market evaluation, and forecasting discussions. Easily customizable in PowerPoint, Keynote, and Google Slides.


8 slides
Benefits Table Template
Optimize your presentation of complex options with our "Benefits Table Template." Designed to clearly distinguish between different plans, this template enables you to showcase Plan A, Plan B, and Plan C with ease. Each column is distinctively colored and detailed to ensure your audience can grasp the variances in benefits at a glance. Ideal for comparing packages, costs, or strategic choices in a corporate setting, this template helps clarify decision-making processes. Compatible with PowerPoint, Keynote, and Google Slides, it is an invaluable tool for business analysts, sales teams, and marketers aiming to communicate effectively with their stakeholders.


4 slides
Veterinary Medicine and Animal Health Presentation
Bring animal healthcare insights to life with this playful and professional slide, featuring an illustrated dog and four food bowls to represent key veterinary topics. Ideal for clinics, pet wellness brands, or animal science presentations. Fully editable in PowerPoint, Keynote, or Google Slides.


5 slides
Innovation with Design Thinking Framework
Boost creativity and problem-solving with the Innovation with Design Thinking Framework Presentation. This slide features a vertically stacked rocket diagram symbolizing the five key phases of design thinking—perfect for illustrating iterative innovation processes. Each level includes editable text and icons, helping you align stakeholders around empathy, ideation, and prototyping. Ideal for workshops, innovation teams, educators, or product development presentations. Fully customizable in PowerPoint, Keynote, and Google Slides.


5 slides
USA Regional Map Slide Presentation
Bring your data to life with a bold, colorful snapshot of regional insights across the United States. This presentation makes it easy to highlight state-level trends, compare demographics, and visualize performance using clean map graphics and simple icons. Fully compatible with PowerPoint, Keynote, and Google Slides.


10 slides
Project Responsibility Chart Presentation
Streamline your project management with our Project Responsibility Chart template. Designed to clarify roles and tasks across your team, this color-coded chart ensures transparency and efficiency. Ideal for project leads to assign duties clearly and effectively. The template supports PowerPoint, Keynote, and Google Slides, making it versatile for any team environment.


6 slides
Workplace Culture and Office Environment Presentation
Highlight team values and workplace dynamics with this modern layout, featuring a central desk illustration flanked by six color-coded points. Perfect for showcasing employee engagement, office norms, or hybrid work strategies. The split design helps balance visual storytelling with concise content. Easily editable in PowerPoint, Keynote, or Google Slides to match your brand and message.


5 slides
Suicide Awareness Stats Infographics
Navigate the sensitive topic of suicide with the suicide awareness stats infographics template. Crafted with care in shades of blue, white, and purple, this vertical, informative infographic serves as a profound educational tool. It is essential for mental health advocates, educational institutions, and community outreach programs, offering a respectful yet impactful way of presenting statistics and information. The template includes thoughtfully designed graphics, relevant icons, and placeholders for real-world images, ensuring the data speaks volumes in raising awareness, promoting prevention, and supporting life-affirming actions within various communities.


5 slides
Scrum Workflow Roles & Sprints Presentation
Simplify your agile presentations with this Scrum Workflow Roles & Sprints Template. Designed to visualize sprint cycles, team roles, and process flow, this layout makes Scrum methodology easy to grasp. Ideal for product managers and agile teams. Fully editable in PowerPoint, Keynote, and Google Slides for seamless customization.


6 slides
Effective Leadership Decision-Making Presentation
Enhance decision-making clarity with this Effective Leadership Decision-Making template. Designed for managers, executives, and strategists, this slide visually represents decision paths, prioritization, and leadership impact. Featuring color-coded options and engaging graphics, it helps illustrate the influence of choices on business outcomes. Fully compatible with PowerPoint, Keynote, and Google Slides, making it a seamless addition to your presentations.


10 slides
Competitive Advantage Through Value Chain Presentation
Gain a Competitive Edge with Strategic Value Chain Optimization! This Competitive Advantage Through Value Chain presentation template is designed to help businesses map, analyze, and enhance their value chain for increased efficiency and profitability. Featuring a structured layout with dynamic elements, this template allows you to showcase key business activities, identify strengths, and optimize processes for sustainable competitive advantage. Perfect for consultants, business strategists, and executives, this template is fully editable and compatible with PowerPoint, Keynote, and Google Slides for seamless customization.