


Features
- 4 Unique slides
- Fully editable and easy to edit in Microsoft Powerpoint, Keynote and Google Slides
- 16:9 widescreen layout
- Clean and professional designs
- Export to JPG, PDF or send by email


Do you have any questions?
Recommend


2 slides
Corporate Identity and Services Overview Presentation
Clearly showcase your company’s offerings with the Corporate Identity and Services Overview Presentation. This modern, minimalist layout is ideal for highlighting key services, team roles, or business pillars with clarity and visual appeal. Fully editable in Canva, PowerPoint, and Google Slides for quick customization and professional results.


4 slides
Consumer Psychology in Marketing
Ever wonder what’s really going on inside a shopper’s mind? This infographic presentation explores the psychology behind consumer decisions, helping you visualize key buying patterns, emotional triggers, and marketing insights with clear, modern visuals. Fully customizable and easy to edit in PowerPoint, Keynote, and Google Slides.


5 slides
Long-Term Strategy Slide Presentation
Ignite big ideas with a bold, forward-moving layout that makes long-range goals feel inspiring and achievable. This presentation helps you outline future plans, key milestones, and strategic priorities with clarity and visual impact. Easy to edit and fully compatible with PowerPoint, Keynote, and Google Slides.


7 slides
Simple Table of Content Slide Presentation
A clean, structured layout makes it easy to guide your audience through key sections with clarity and flow. This simple table of content slide helps you introduce topics, outline ideas, and set expectations in a polished, professional way. Fully compatible with PowerPoint, Keynote, and Google Slides.


23 slides
Artarix Business Development Proposal Presentation
Streamline your growth strategy with this modern and professional presentation template. Covering key elements such as collaboration opportunities, performance metrics, process improvement, and resource allocation, it provides a structured approach to business expansion. Fully customizable and compatible with PowerPoint, Keynote, and Google Slides for seamless editing.


21 slides
Seaspray Design Proposal Presentation
Present your design proposal with confidence and clarity using this sleek, professionally crafted template. Tailored for designers and creatives, this presentation includes slides for a company overview, project summary, and a clear articulation of the problem statement with a proposed solution. Walk your audience through your objectives and goals, detailed scope of work, and structured methodology for implementation. Highlight key aspects with a timeline and milestones, and deliver value with dedicated slides for budget breakdowns and pricing structures. Build trust and credibility through client testimonials and showcase expertise with a team introduction. End your presentation with actionable next steps and a well-crafted conclusion to leave a lasting impact. Fully customizable for PowerPoint, Google Slides, and Keynote, this template is perfect for creative professionals aiming to win clients and projects with precision and style.


4 slides
Sales Funnel Data Presentation
Turn your data into a clear story with a visual flow that shows exactly how leads move from one stage to the next. This presentation helps explain conversion steps, highlight drop-off points, and simplify complex marketing insights. It’s easy to customize and fully compatible with PowerPoint, Keynote, and Google Slides.


7 slides
Transportation and Logistics Services Infographic
Transportation and logistics are critical to the functioning of modern economies, facilitating the movement of goods, people, and services from one place to another. This template is a professional infographic focusing on the main topics of transportation, logistics and their relationships. Use this template to illustrate the bustling world of transportation and logistic solutions from around the globe. It comes with a variety of diagrams and illustrations, which will make your presentation more appealing. This template is fully editable and compatible with Powerpoint, keynote and google slides.


20 slides
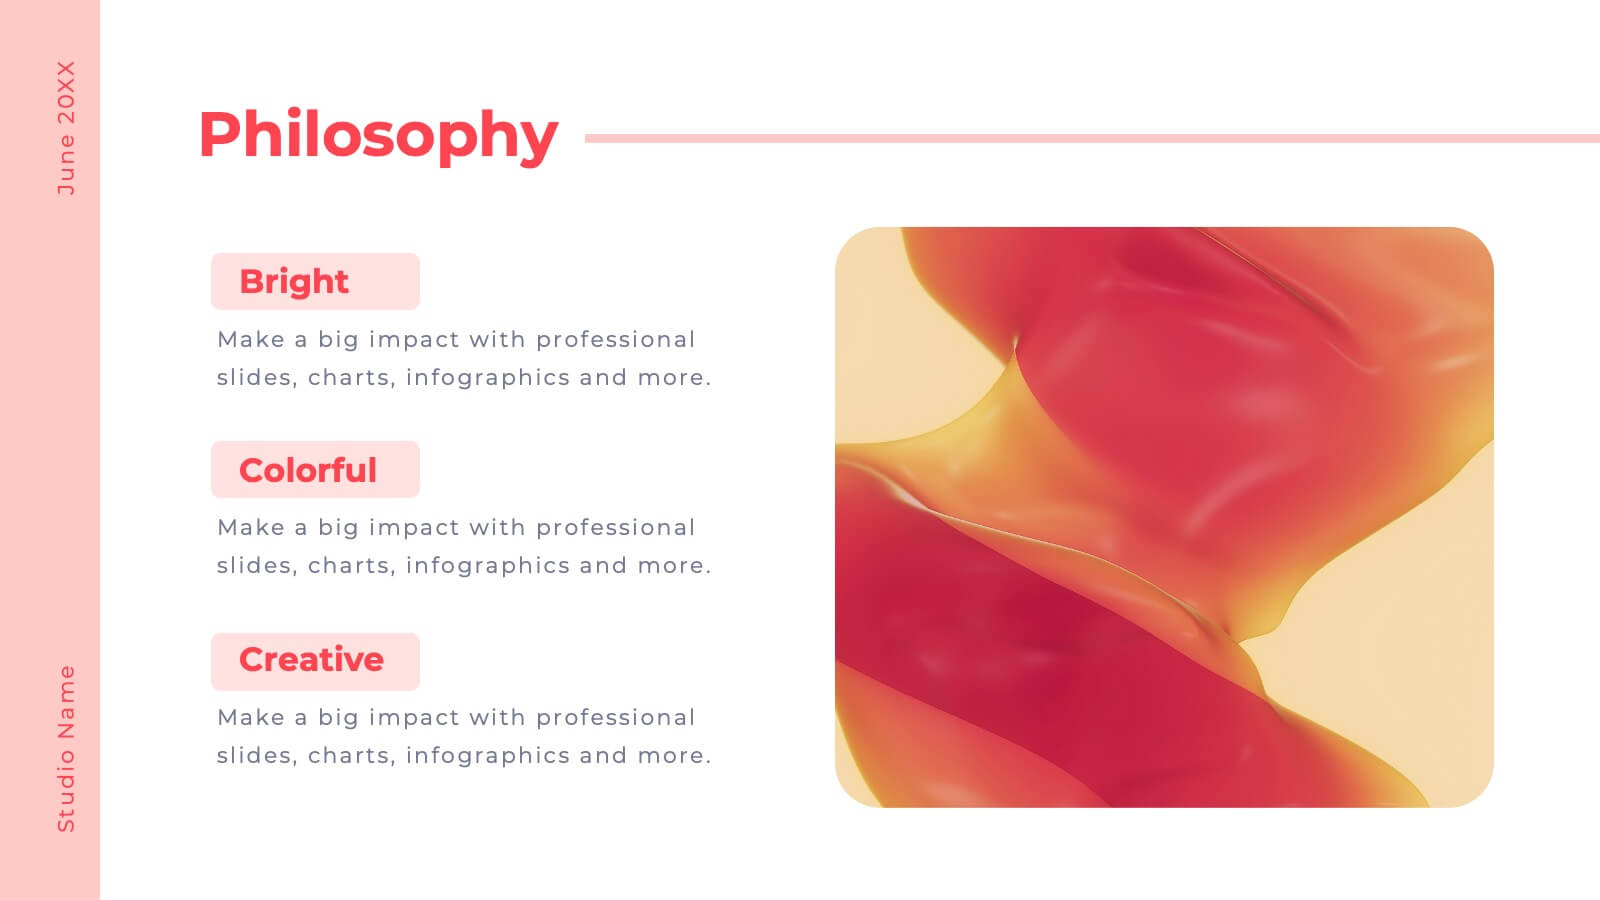
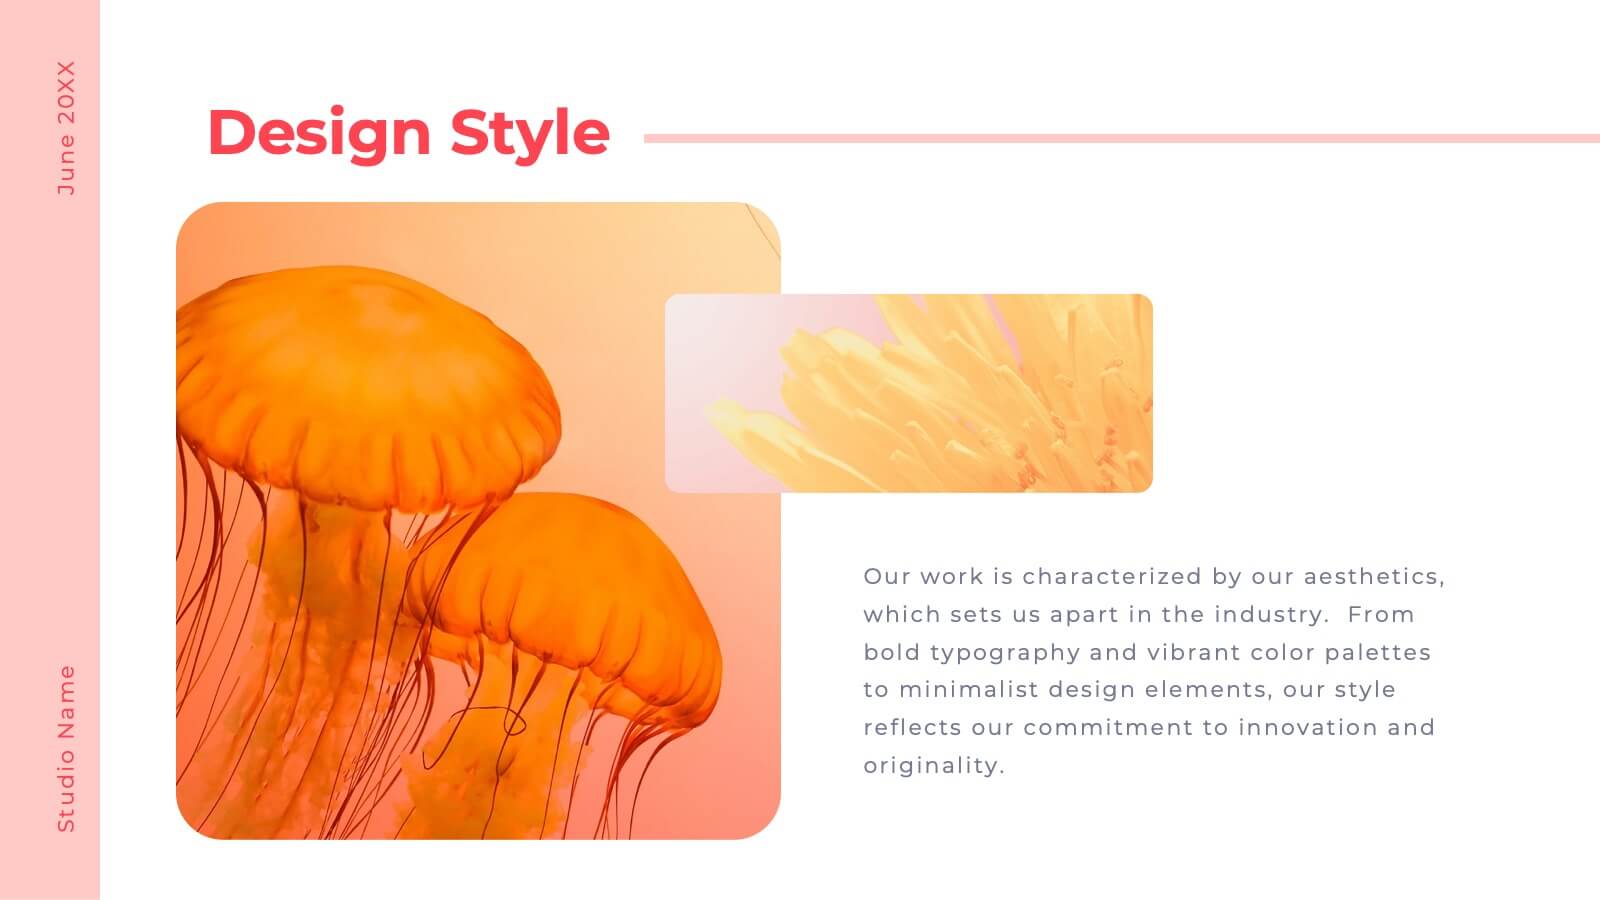
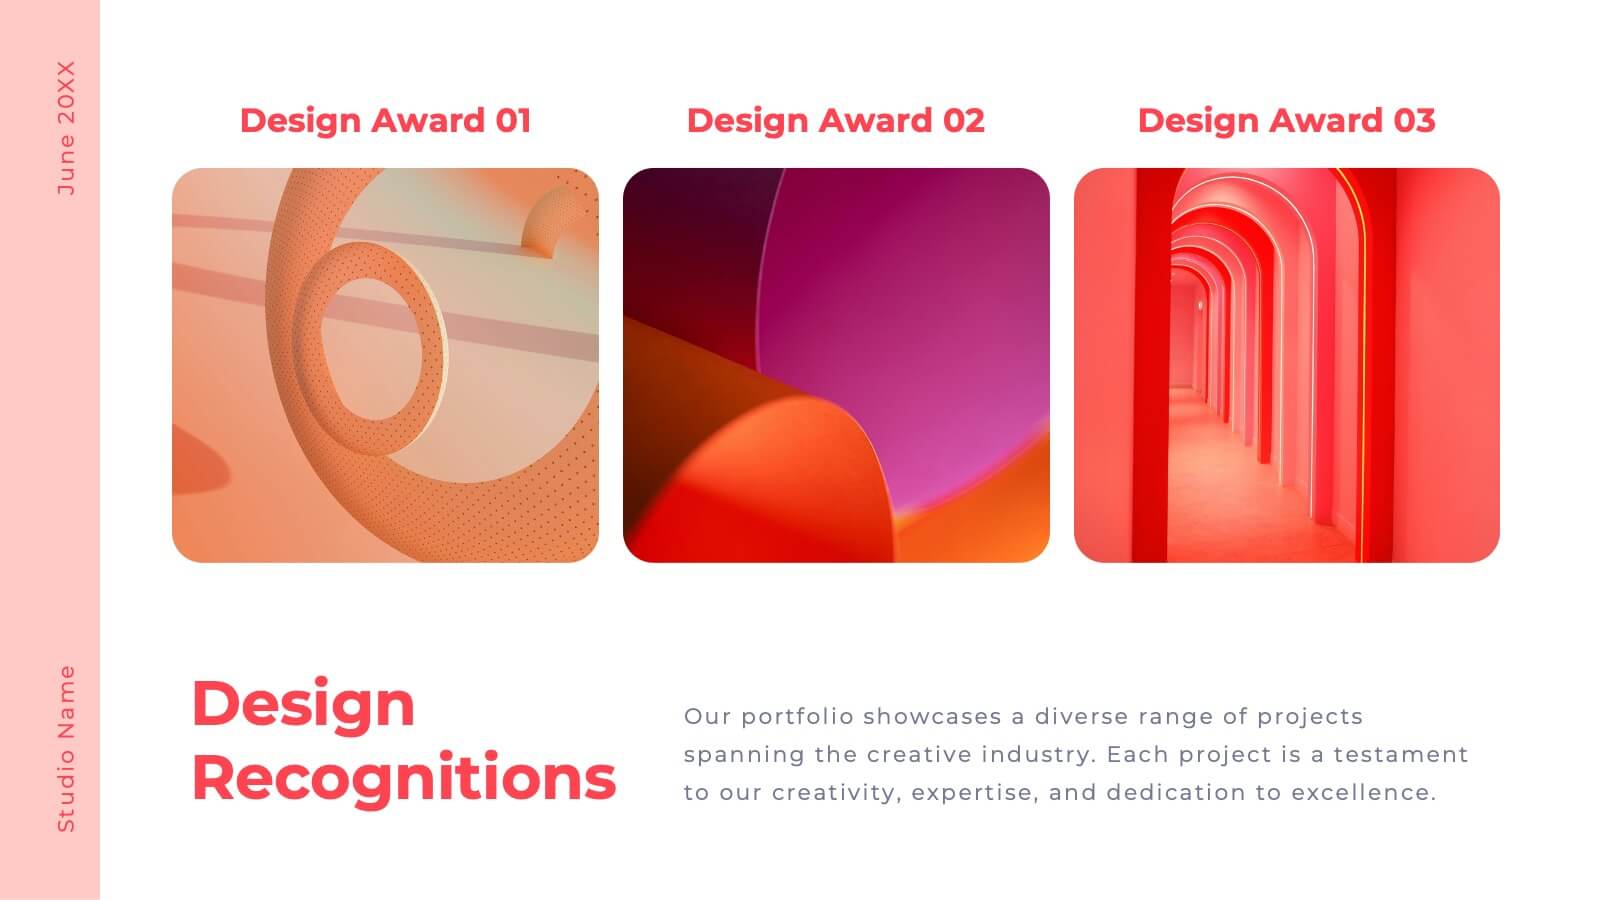
Valor Creative Portfolio Presentation
Step into creativity with this stunning portfolio template! Showcase your projects, design philosophy, and client testimonials with style and flair. Ideal for designers, artists, and creatives wanting to impress. Compatible with PowerPoint, Keynote, and Google Slides, this template elevates every portfolio to new heights. Perfect for making a lasting impact.


5 slides
Global Market Trends World Map Presentation
Visualize your market insights with this sleek and professional Global Market Trends World Map slide. Designed to highlight key regional data with pinpoint accuracy, it’s ideal for presenting statistics, regional performance, or global expansion strategies. The sidebar gradient layout offers space for five categories, each linked to map locations. Fully customizable and compatible with PowerPoint, Keynote, and Google Slides.


4 slides
Strategic Business Model Outline Presentation
Present a clear visual of your business model with this Strategic Business Model Outline. Designed to break down key components across four categories, this slide is perfect for strategy meetings, business overviews, or investor decks. Fully editable in PowerPoint, Keynote, and Google Slides for seamless customization and professional presentations.


5 slides
Types of Coffee Infographics
There are many different types of coffee, with varying tastes and brewing methods. This template features unique vertical Infographics as visual representation of different types of coffee that are popular in various parts of the world. These are designed to provide information on the different types of coffee, their origins, brewing methods, and taste profiles. You can also provide information on the ingredients used to make the coffee, such as the milk, cream, and sugars. These infographics are very visually pleasing, the icons, images, and color schemes are associated with coffee. Include your statistics on the popularity of different types of coffee and how they are consumed!


5 slides
Data-Driven Business Statistics
Visualize insights and percentages with this dynamic, data-driven infographic layout. Ideal for illustrating business progress, KPIs, and performance highlights. This editable template is fully compatible with PowerPoint, Keynote, and Google Slides, allowing you to tailor it effortlessly to fit your corporate style and messaging.
5 slides
Feedback Rating Smile Icons Presentation
Light up your presentation with a playful visual that turns audience feedback into clear, colorful insights. This slide helps you compare ratings, highlight sentiment patterns, and present review data in a friendly, memorable way. Perfect for surveys, reports, and performance reviews. Fully compatible with PowerPoint, Keynote, and Google Slides.


6 slides
Pyramid Triangle Diagram Presentation
Build your ideas from the ground up with this bold, layered layout that turns complex hierarchies into simple, engaging visuals. Perfect for illustrating processes, priorities, or business frameworks, it gives your message a clear structure and flow. Fully compatible with PowerPoint, Keynote, and Google Slides for smooth customization.


5 slides
History in Science Infographics
The history in science refers to the development of scientific knowledge throughout human history. These Infographics can be used to visualize and simplify complex scientific concepts and discoveries in a historical context. This can help students and others interested in science understand the evolution of scientific theories and breakthroughs over time, and how they have shaped our understanding of the world. These infographics use a variety of visual elements, such as timelines, graphs, illustrations, and icons, to tell a compelling story about the history of science. Compatible with Powerpoint, Keynote, and Google Slides.
6 slides
Investment Insights and Budget Tracker Presentation
Stay on top of your financial strategy with the Investment Insights and Budget Tracker Presentation. This slide layout organizes six financial metrics or priorities into clear, color-coded blocks—ideal for summarizing investment options, budget breakdowns, or cost categories. Perfect for finance teams, analysts, or consultants. Fully editable in Canva, PowerPoint, Google Slides, and Keynote.