


Features
- 4 Unique slides
- Fully editable and easy to edit in Microsoft Powerpoint, Keynote and Google Slides
- 16:9 widescreen layout
- Clean and professional designs
- Export to JPG, PDF or send by email


Do you have any questions?
Recommend


7 slides
Asia Regions Map Infographic
Embark on a visual journey across the vast and diverse continent of Asia with our meticulously crafted map infographic. Painted in the cultural richness of red, the depth of blue, and the clarity of white, our template captures the essence of Asia in all its glory. Adorned with pinpoint infographics, symbolic icons, and region-specific image placeholders, it serves as a comprehensive guide to Asia's multifaceted landscape. Impeccably designed for Powerpoint, Keynote, or Google Slides. An indispensable resource for educators, travelers, researchers, or businesses venturing into the Asian market. Explore with purpose; let every slide be a step into Asia's vibrant tapestry.


6 slides
Asia Map Population Infographic
Explore the demographic dynamics of Asia with our collection of infographic slides, designed to illustrate the population statistics across the continent. These templates are an essential tool for educators, demographers, and business analysts, providing detailed visualizations of population distribution, density, and growth trends. Each infographic combines the map of Asia with engaging graphical elements such as bar graphs, pie charts, and statistical callouts that emphasize key data points like total population, urban versus rural distribution, and demographic forecasts. The color-coding and spatial arrangements on the map effectively highlight variations and trends across different countries and regions, making complex data easy to understand and visually compelling. Fully customizable, these templates allow you to adjust the data presentation to suit specific needs or focuses, such as comparing population growth rates or highlighting demographic challenges. Whether used in presentations, reports, or educational materials, these slides offer a comprehensive and accessible way to communicate the demographic landscape of Asia.


6 slides
OKR Goal-Setting Framework
Clarify your goals and drive performance with this OKR-based layout that maps Objectives, Key Activities, and Results in a clear, actionable format. Ideal for teams, managers, and performance reviews. Each section is fully editable to match your organizational strategy. Compatible with PowerPoint, Keynote, and Google Slides.


7 slides
Milestones in Project Management Infographic
Showcase the journey of your projects with our Milestones in Project Management Infographic, perfect for project managers, team leaders, and business strategists. This infographic is designed to visually communicate the key achievements and phases of your project timeline. Our infographic allows for a clear depiction of project progress, with markers for each significant milestone achieved. It's an effective tool for reflecting on past successes, current status, and future objectives. With customizable timelines and milestone markers, you can illustrate the path your project has taken, highlight critical deliverables, and forecast upcoming targets. This SEO-friendly infographic is crafted to enhance reports, presentations, and project reviews, making it a valuable asset for stakeholder communication. Employ this infographic to present a cohesive narrative of your project's development, celebrate accomplishments, and maintain momentum towards your project goals.


8 slides
Hierarchical Structure Tree Diagram
Simplify the visualization of your team's hierarchy or process flow with this clean and modern tree diagram template. Perfect for organizational charts, project teams, or strategy frameworks. Easily editable in PowerPoint, Keynote, and Google Slides for full flexibility.


7 slides
Change Management Presentation Template
Our Change Management Infographic is designed to visually present your information. This infographic presentation comes with a seven page layout, all neatly arranged into a well-organized structure, which shows the steps of a change management process. This can be used for any kind of presentation purpose, education, employees, new product launch or even for training executives, managers and supervisors. With this template the variety of elements included are to help you create your own personalized content, you can make your own presentations for any business or industry in just minutes!


5 slides
Online Video Games Infographics
Dive into the digital realm with our online video games infographics template, tailored in striking shades of purple, blue, pink, and black that echo the electric ambiance of the gaming world. This dynamic ensemble, perfect for game developers, and gaming communities, brings to life the universe of online gaming. Compatible with Powerpoint, Keynote, and Google Slides. It features creative graphics and gaming icons, capturing everything from player statistics to game mechanics. Whether you're spotlighting trends or unveiling a revolutionary game, this template levels up your presentation, engaging your audience right from the start screen.


7 slides
Sustainability Risk Management Infographic
Elevate your presentations with our Sustainability Risk Management infographic, compatible with Powerpoint, Keynote, and Google Slides. This infographic is a vital tool for professionals dedicated to showcasing the importance of sustainable practices and risk mitigation in their organizations. It's crafted to display the interconnectivity between environmental, social, and governance (ESG) factors and business operations. Our Sustainability Risk Management infographic effectively breaks down complex sustainability challenges into digestible parts. It's an invaluable resource for corporate strategists, environmental consultants, and policy makers. By simplifying the communication of sustainability data, it encourages stakeholder engagement and facilitates strategic planning sessions. The design of the infographic ensures that sustainability goals and risk assessments are presented in an engaging and memorable manner. It supports your narrative by visually guiding your audience through the elements of sustainability that are pivotal for risk management. By integrating this infographic into your slide decks, you can confidently convey the message that responsible management is key to long-term success.


4 slides
Resource Mapping in African Regions Presentation
Visualize regional distribution clearly with the Resource Mapping in African Regions Presentation. This engaging slide highlights key areas using color-coded map segments, helping you present data like resource allocation, project focus, or regional analysis with clarity. Ideal for NGOs, researchers, or government briefings. Compatible with PowerPoint, Keynote, Canva, and Google Slides.


5 slides
Veterinary Diagnostics and Treatment Presentation
Clearly outline your care process with the Veterinary Diagnostics and Treatment presentation. This slide features a visually appealing medical bag segmented into four quadrants, each marked by colorful paw prints and editable titles. Ideal for showcasing diagnosis steps, treatment plans, or service categories for veterinary clinics. Fully customizable and easy to adapt for use in PowerPoint, Keynote, and Google Slides. Perfect for pet care professionals seeking a professional, pet-friendly visual.


20 slides
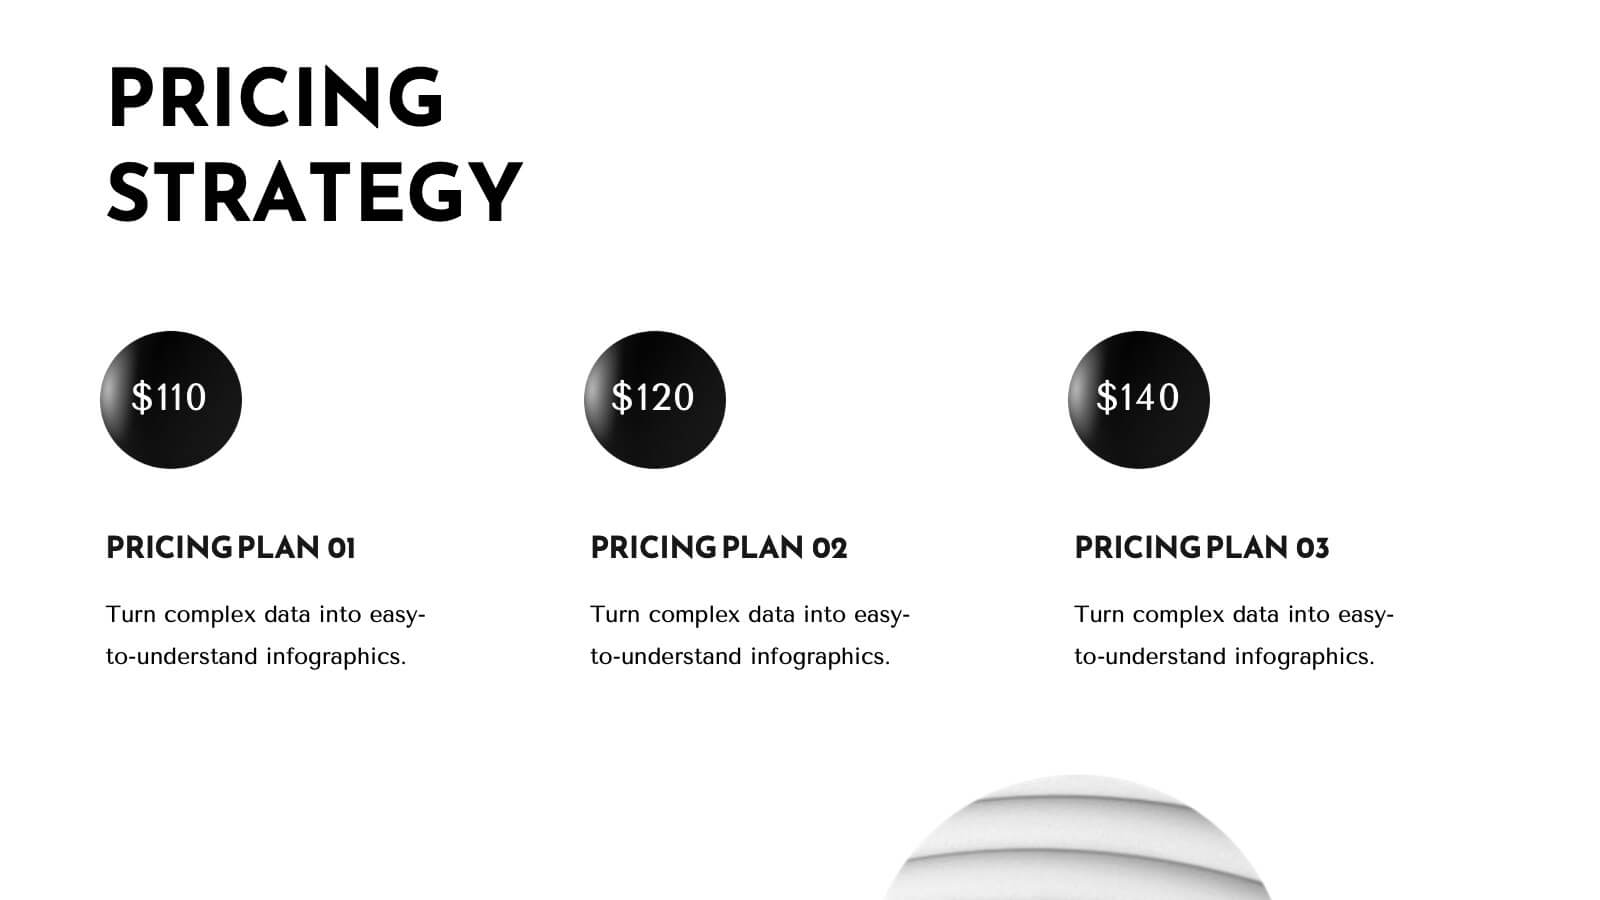
Solstice Product Launch Presentation
Introducing our product launch template! Highlight your product’s features, target audience, and unique selling proposition with a sleek, modern design. Showcase marketing strategies, distribution channels, and competitive landscape effortlessly. Ideal for sales teams and marketers. Compatible with PowerPoint, Keynote, and Google Slides.

21 slides
Trident Product Development Plan Presentation
Present your product development strategy with this sleek, professional template! Highlight company overview, product features, and unique selling proposition. Ideal for showcasing market analysis, pricing strategy, and production process. Perfect for developers and project managers. Compatible with PowerPoint, Keynote, and Google Slides.


21 slides
Flamelore Agile Project Plan Presentation
Organize and deliver your Agile Project Plan seamlessly with this dynamic presentation template. Designed to align with Agile principles, it features a comprehensive structure covering objectives, scope of work, and key deliverables. The template helps you outline a detailed project timeline and budget breakdown to keep stakeholders informed. Illustrate complex information with visual aids such as pyramids, charts, and process diagrams, making data interpretation effortless. Highlight team members, their roles, and responsibilities to foster transparency and accountability. With slides dedicated to risk assessment and evaluation criteria, you can confidently navigate potential challenges. This fully editable template works across PowerPoint, Google Slides, and Keynote, providing flexibility and a polished design for project managers, teams, and business professionals. Whether you're pitching to stakeholders or aligning your team, this Agile framework ensures clear communication and actionable steps.


5 slides
Marketing Funnel AIDA Breakdown
Visually map out your marketing strategy with the Marketing Funnel AIDA Breakdown Presentation. This template clearly illustrates the four essential stages—Attention, Interest, Desire, and Action—using a clean funnel design for easy audience understanding. Ideal for sales pitches, marketing plans, and campaign reports. Fully editable in PowerPoint, Keynote, and Google Slides.


7 slides
Business Credit Card Infographic
Navigating business credit cards can seem overwhelming, but with our vibrant infographic, it becomes effortless. Drenched in playful pinks and dynamic colors, this tool is more than just eye-catching—it's a roadmap to the intricate realm of corporate credit. Tailored for everyone from financial educators to seasoned business owners, this infographic offers a clear, concise breakdown of business card essentials, benefits, and best practices. Whether you're presenting, learning, or simply seeking clarity, this resource promises invaluable insights with a dash of flair. Dive in and demystify the world of business credit cards with us!


4 slides
Professional Business Company Profile Presentation
Present your business with confidence using the Professional Business Company Profile Presentation. Featuring clean design, geometric elements, and photo placeholders, this template is ideal for showcasing your company’s identity, values, and services. Fully customizable in PowerPoint, Google Slides, and Canva for seamless branding and presentation updates.


7 slides
Company Profile History Infographic
This collection of templates is meticulously designed to detail a company's historical growth and significant milestones, ensuring that stakeholders can grasp the evolution and achievements of the business effectively. Each template varies in design, from sleek, minimalistic layouts to more robust, data-intensive presentations, making it versatile for different corporate needs and preferences. Included features range from detailed timelines and milestone markers to percentage breakdowns, which not only aid in visualizing the company's journey but also emphasize important events such as key product launches, expansion milestones, and significant shifts in company strategy. Additionally, these templates allow for customization, including the ability to incorporate company-specific branding elements like logos, color schemes, and typography. Ideal for shareholder meetings, investor pitches, and internal strategy discussions, these templates serve as a powerful tool for companies to showcase their historical context, financial growth, market expansion, and customer engagement over the years, aligning past achievements with future goals in a clear and structured format.