


Features
- 12 Unique slides
- Fully editable and easy to edit in Microsoft Powerpoint, Keynote and Google Slides
- 16:9 widescreen layout
- Clean and professional designs
- Export to JPG, PDF or send by email


Do you have any questions?
Recommend


26 slides
Kasra Presentation Template
Fitness is an important part of good health. It improves your quality of life and may keep you from getting sick by helping to strengthen your immune system, prevent heart disease and reduce the risk of diabetes and much more. The Kasra template will help you deliver your message with an impact. Whether you're selling your product, promoting an event, or creating a landing page, this template features the necessary components to capture your audience's attention. This provides you with a powerful platform to engage others, illustrate key messages and demonstrate deep insight into an issue.


6 slides
PESTEL Framework Breakdown Presentation
Kickstart your strategic thinking with a bold, colorful layout that makes external business factors easy to understand at a glance. This presentation breaks complex influences into clear, structured sections, helping teams analyze trends and plan with confidence. Fully editable and compatible with PowerPoint, Keynote, and Google Slides.


5 slides
Search Engine Marketing Analysis Presentation
Showcase your SEM insights with a presentation slide that’s as sharp as your strategy. This layout helps you break down ad performance, keyword data, and campaign elements clearly and visually. Perfect for marketers presenting to clients or teams, and fully compatible with PowerPoint, Keynote, and Google Slides.


5 slides
Business Introduction and Company Profile Presentation
Introduce your business with precision and clarity using this company profile layout. Highlight your mission, vision, and key insights alongside sleek visuals and structured content. Perfect for new client onboarding, internal briefings, or stakeholder presentations. Fully editable in PowerPoint, Keynote, and Google Slides for seamless, professional customization.


26 slides
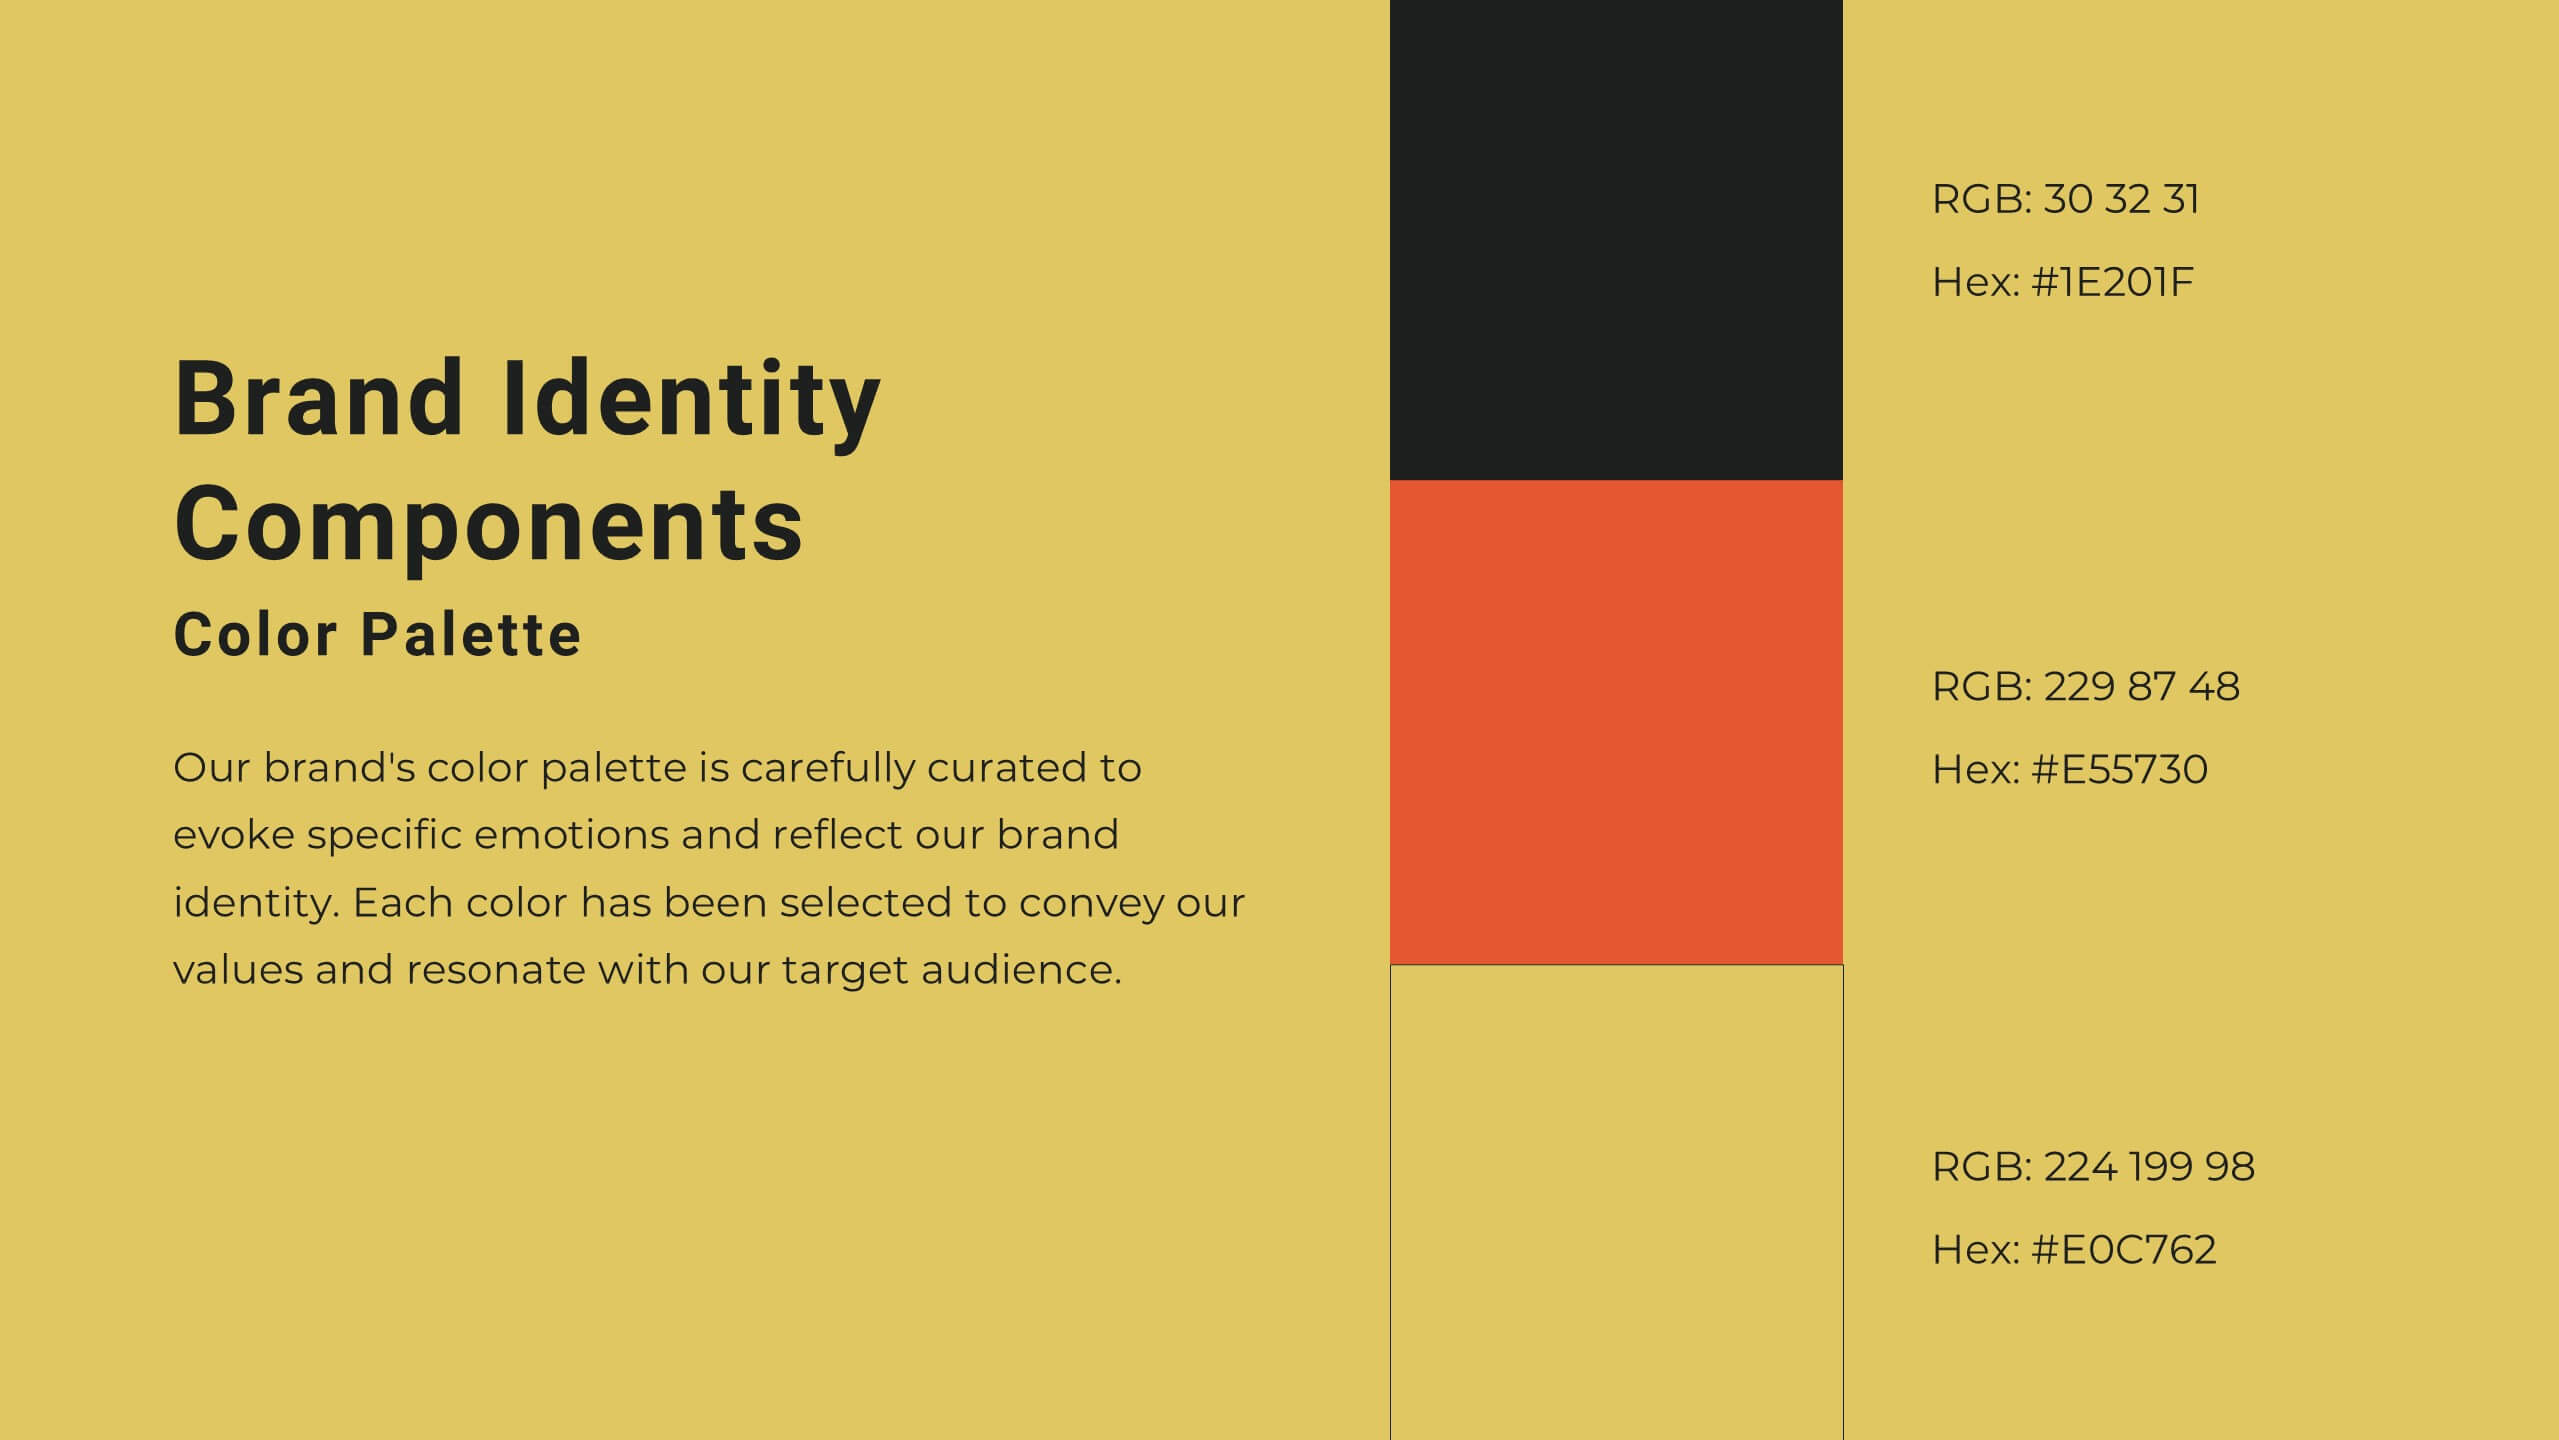
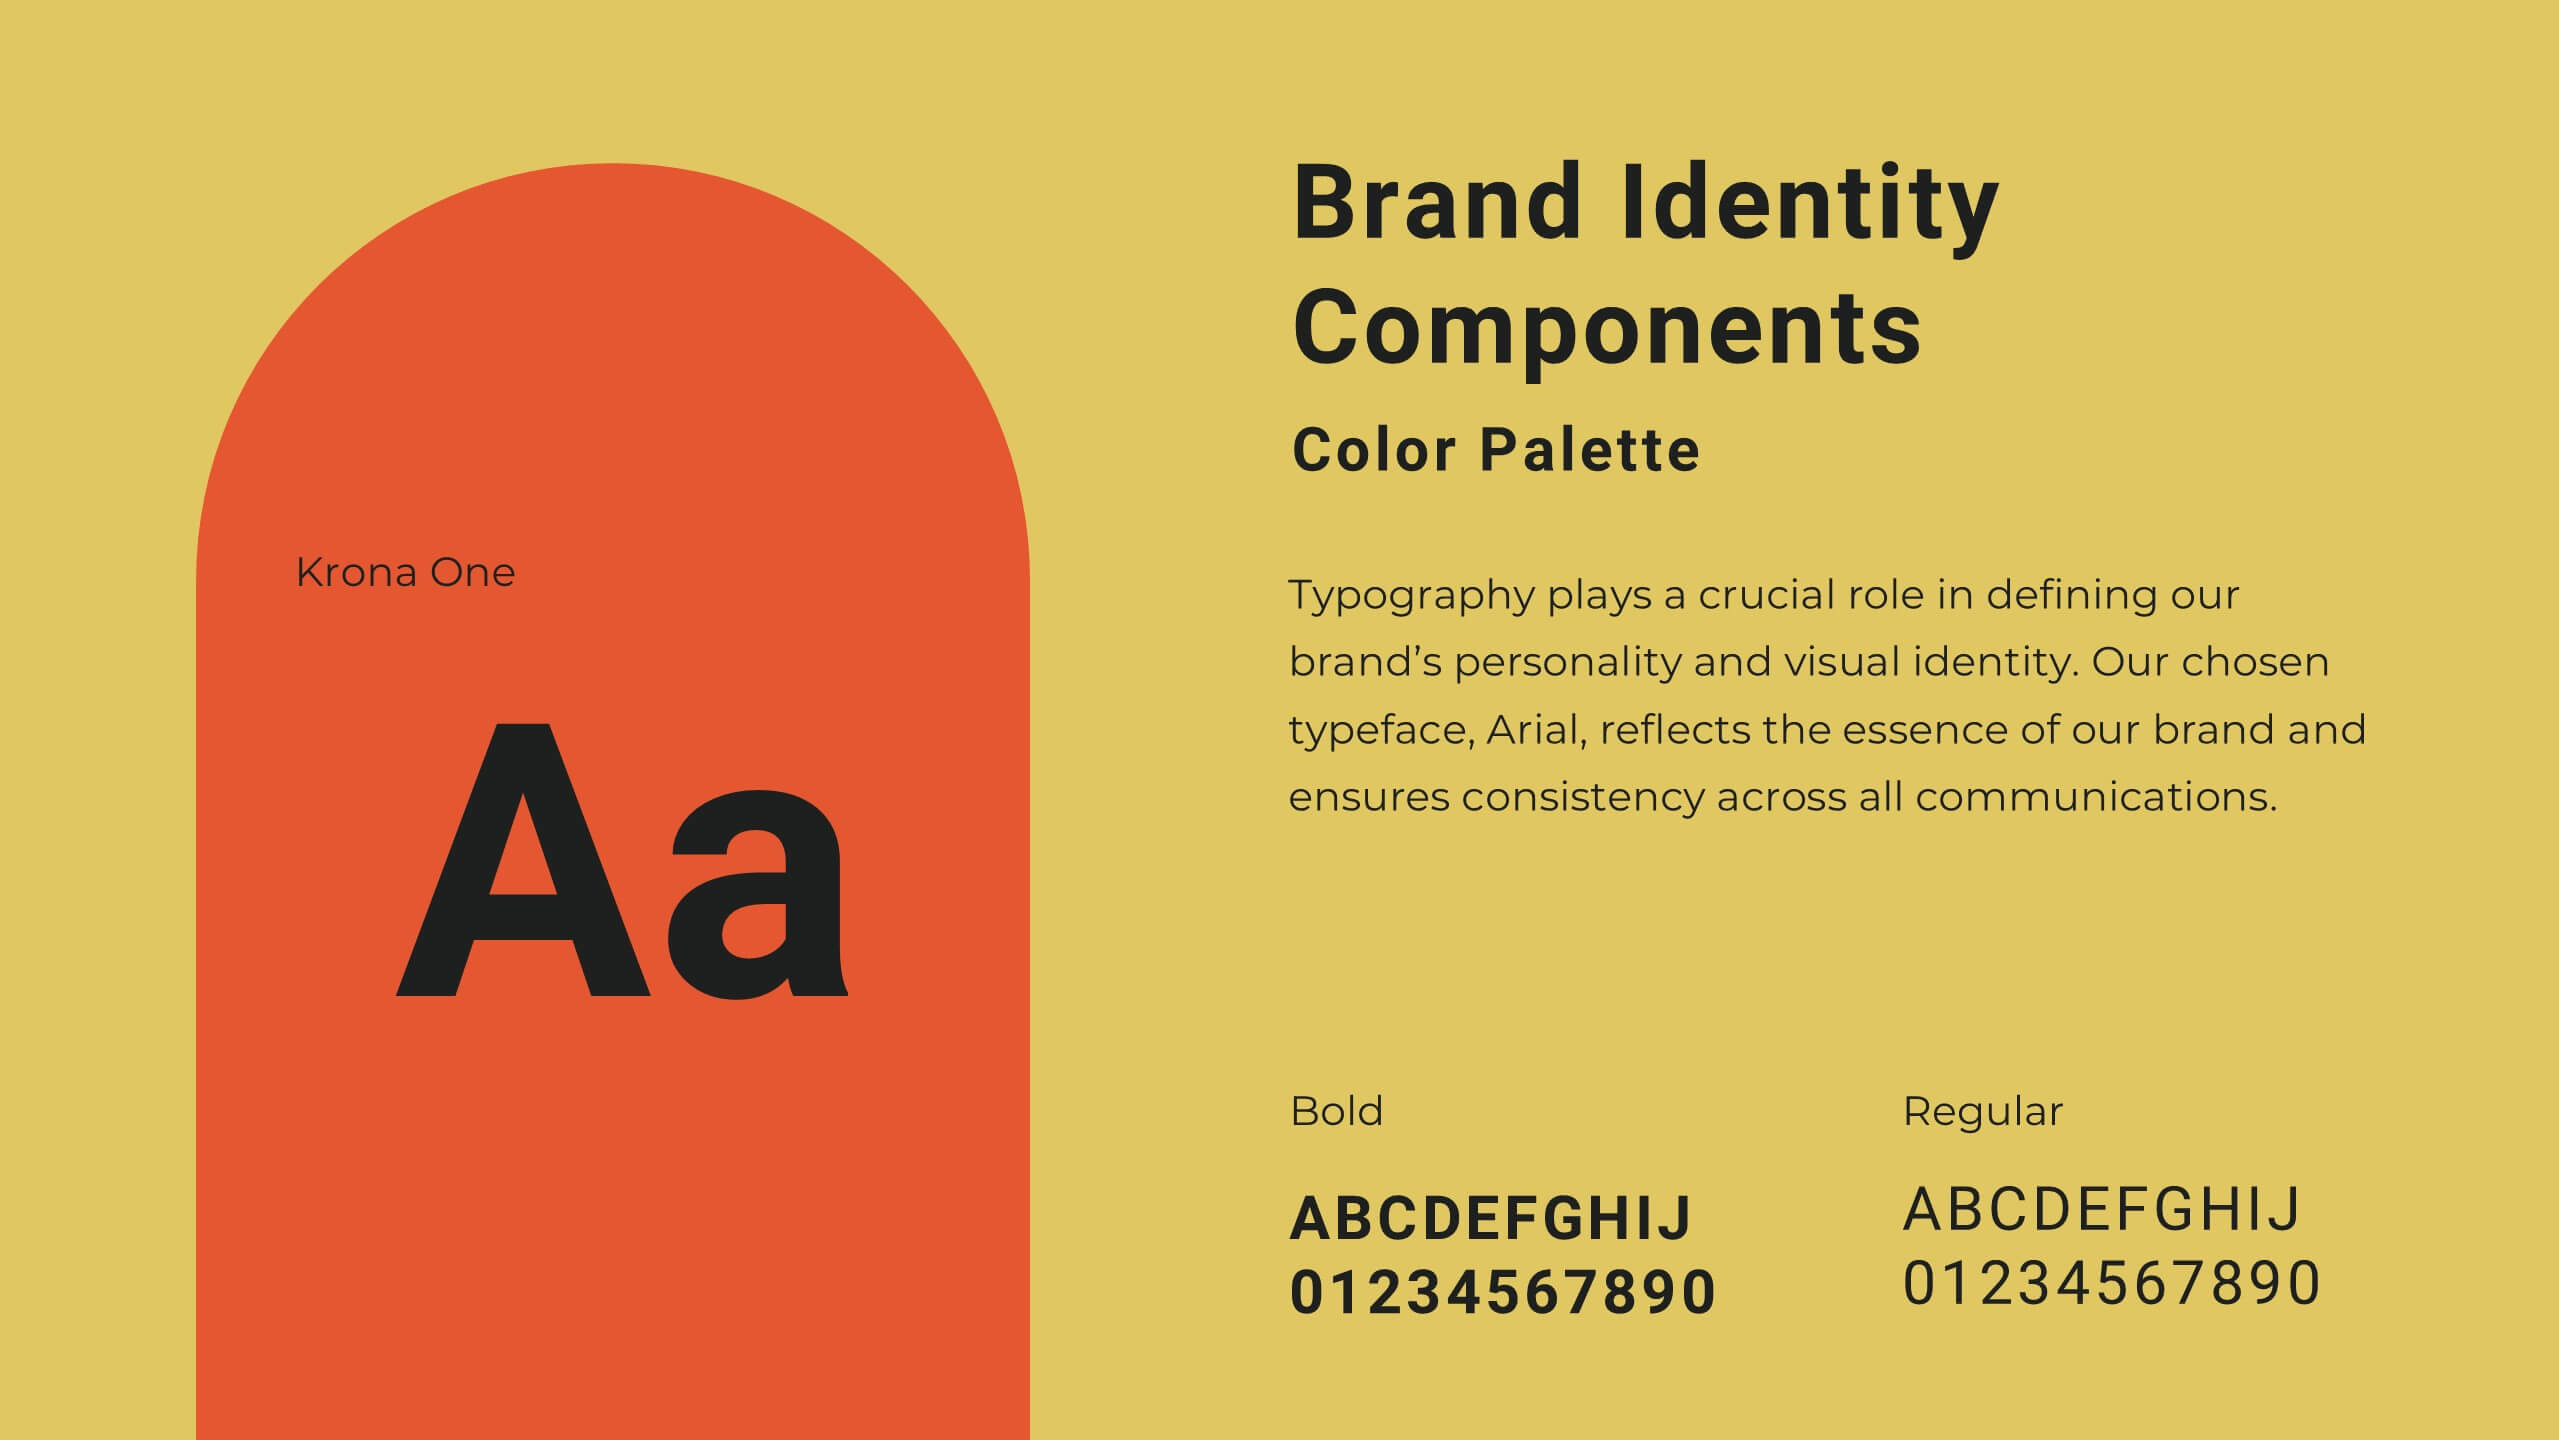
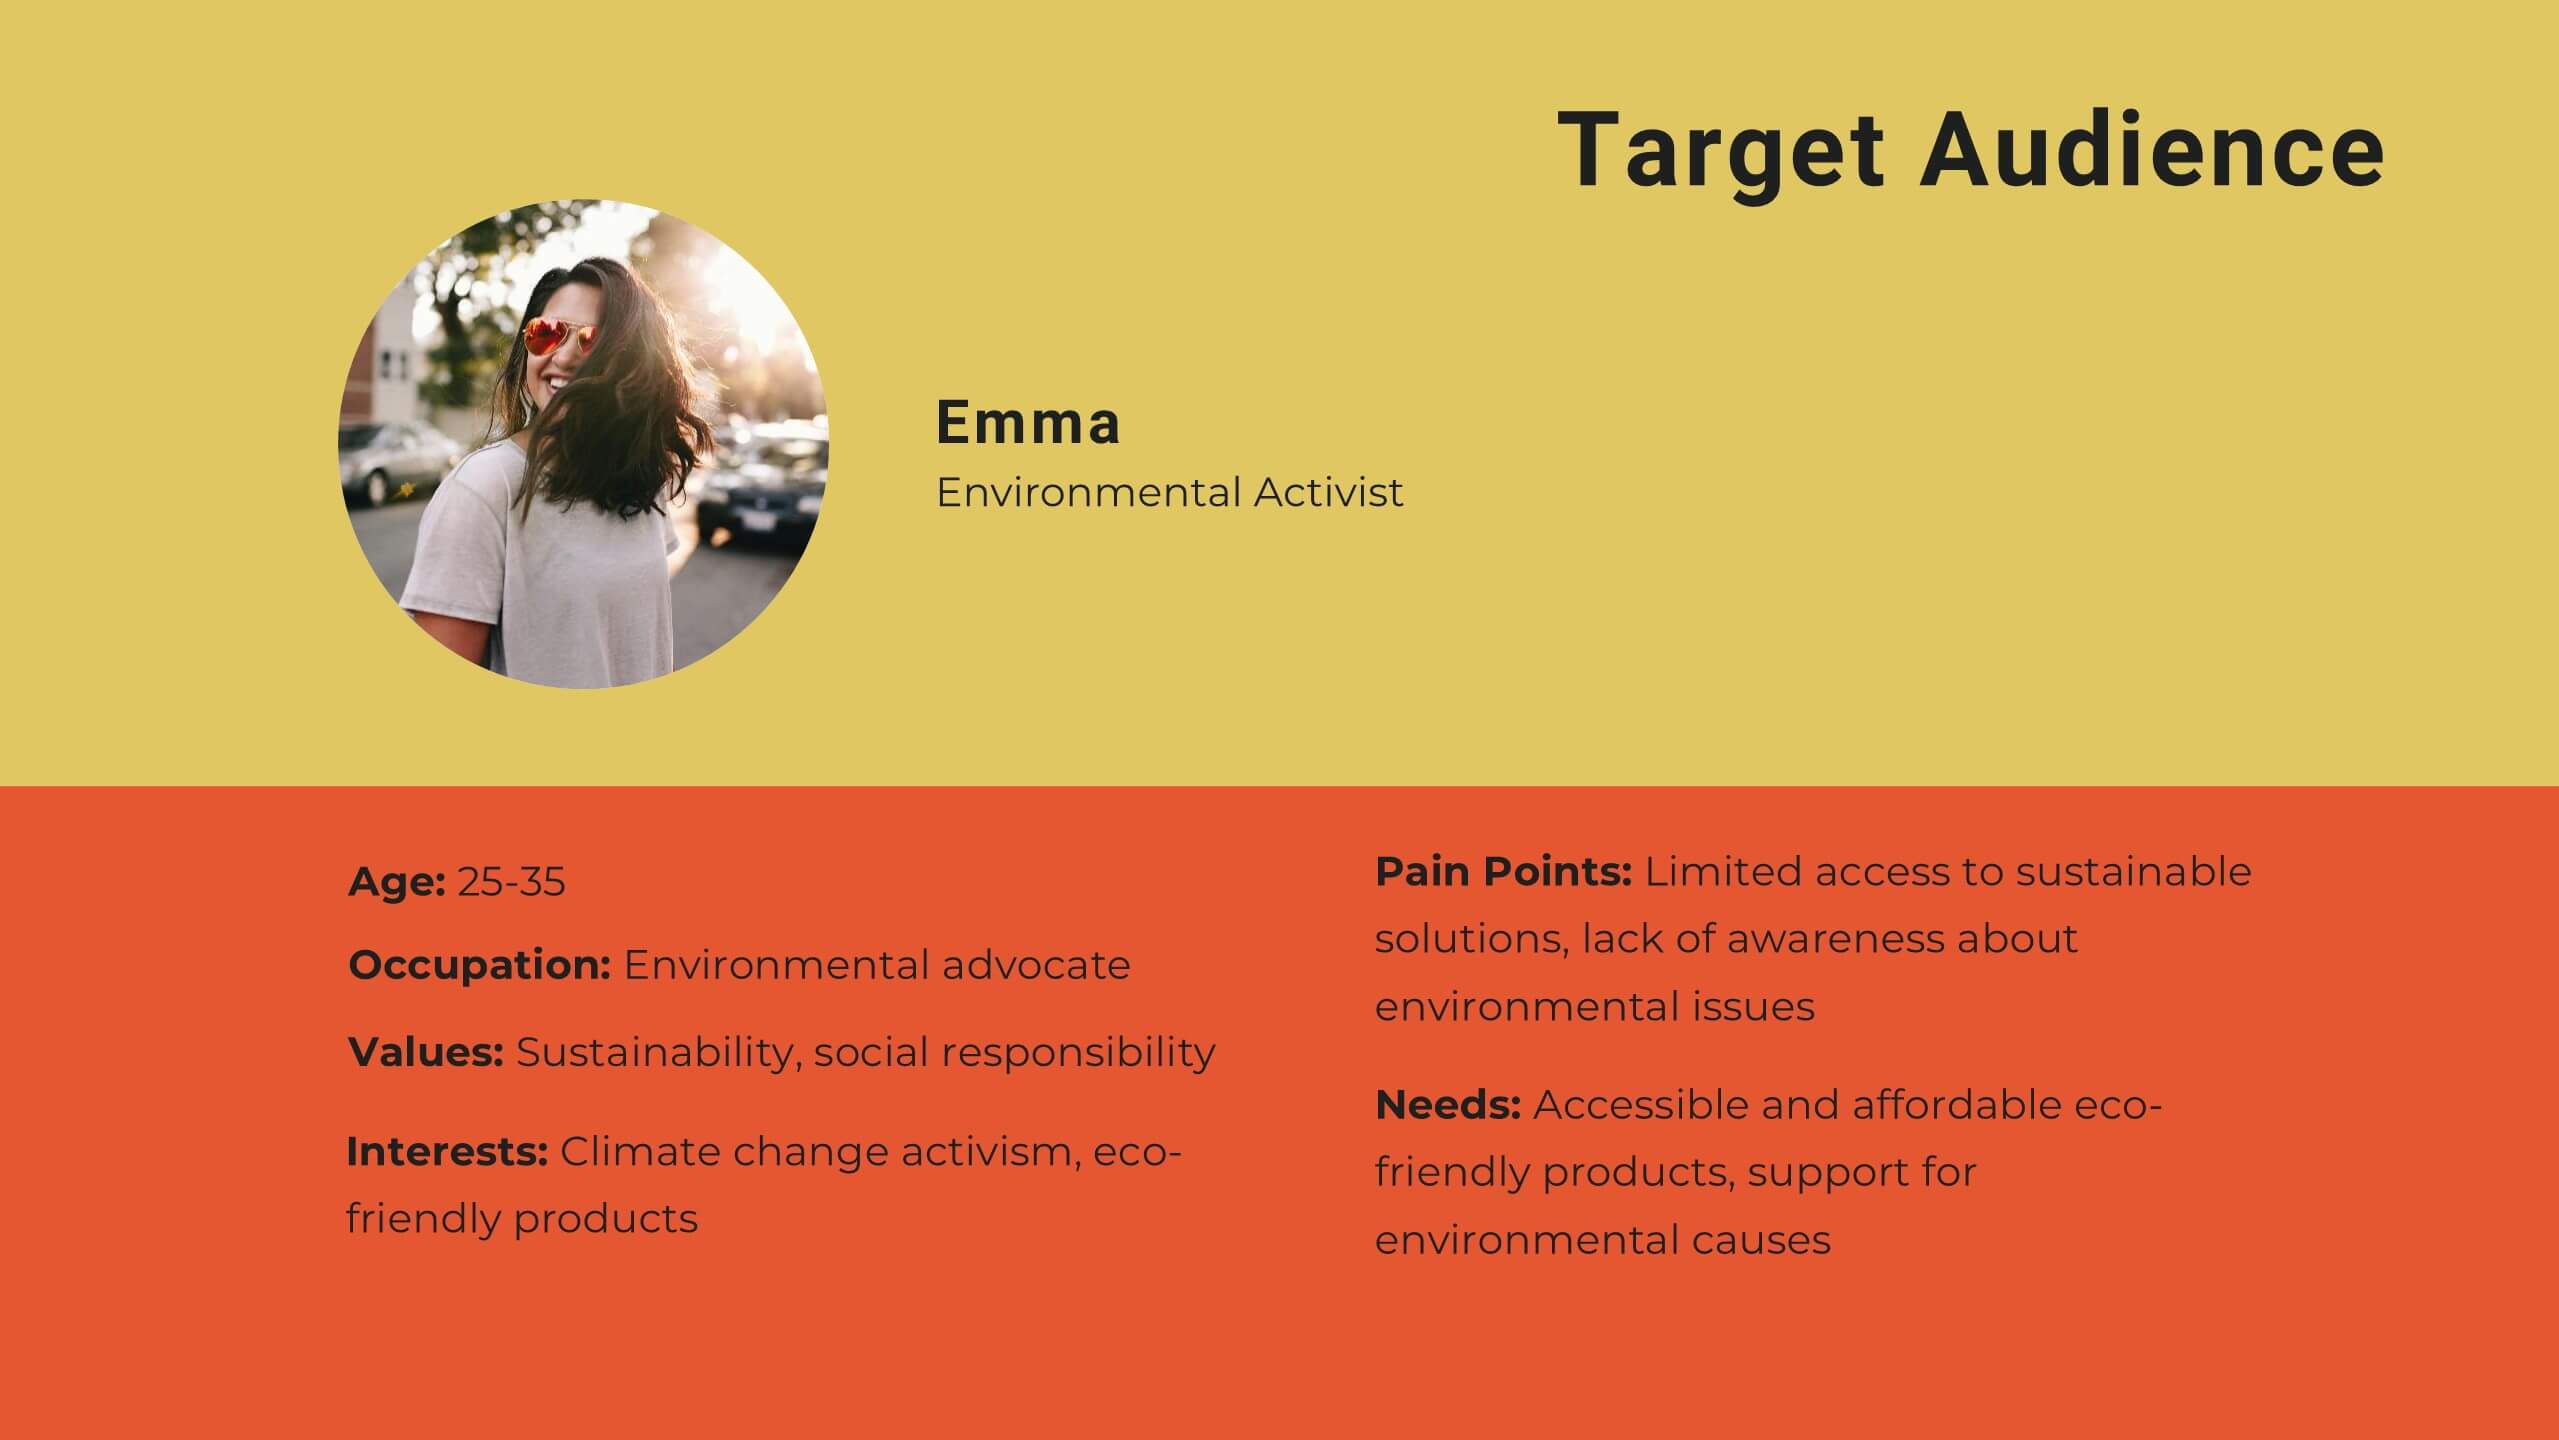
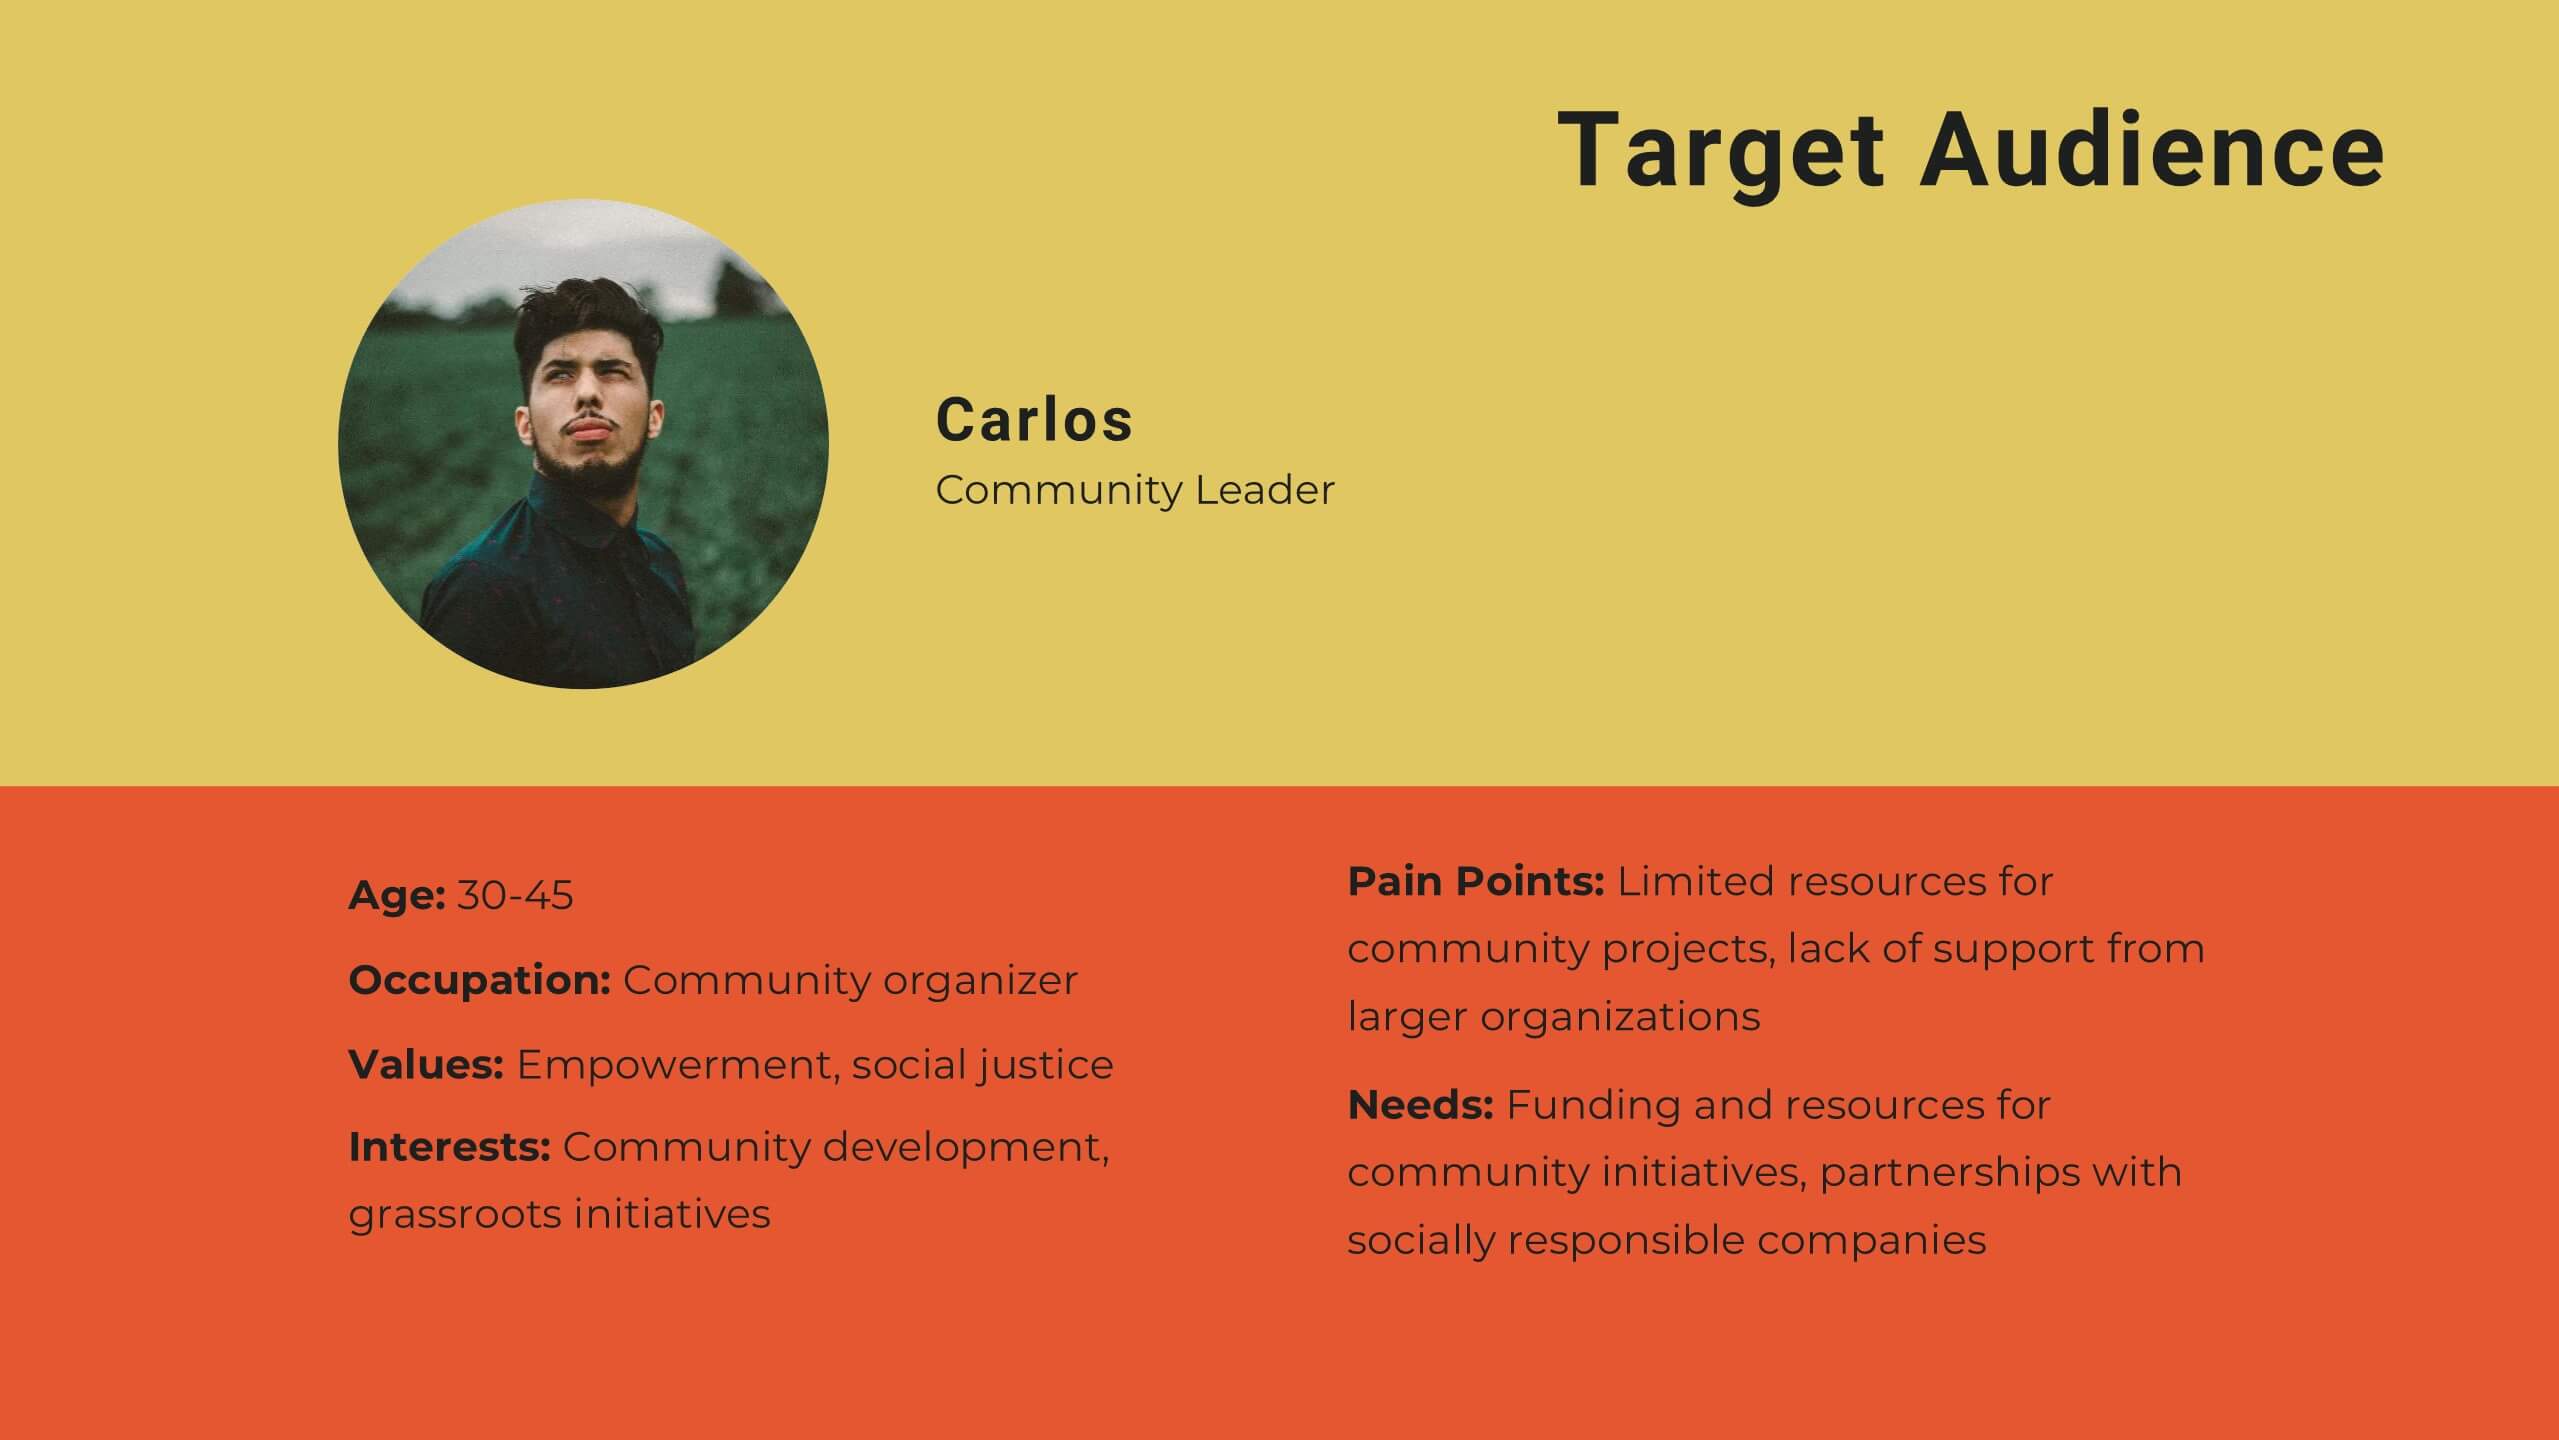
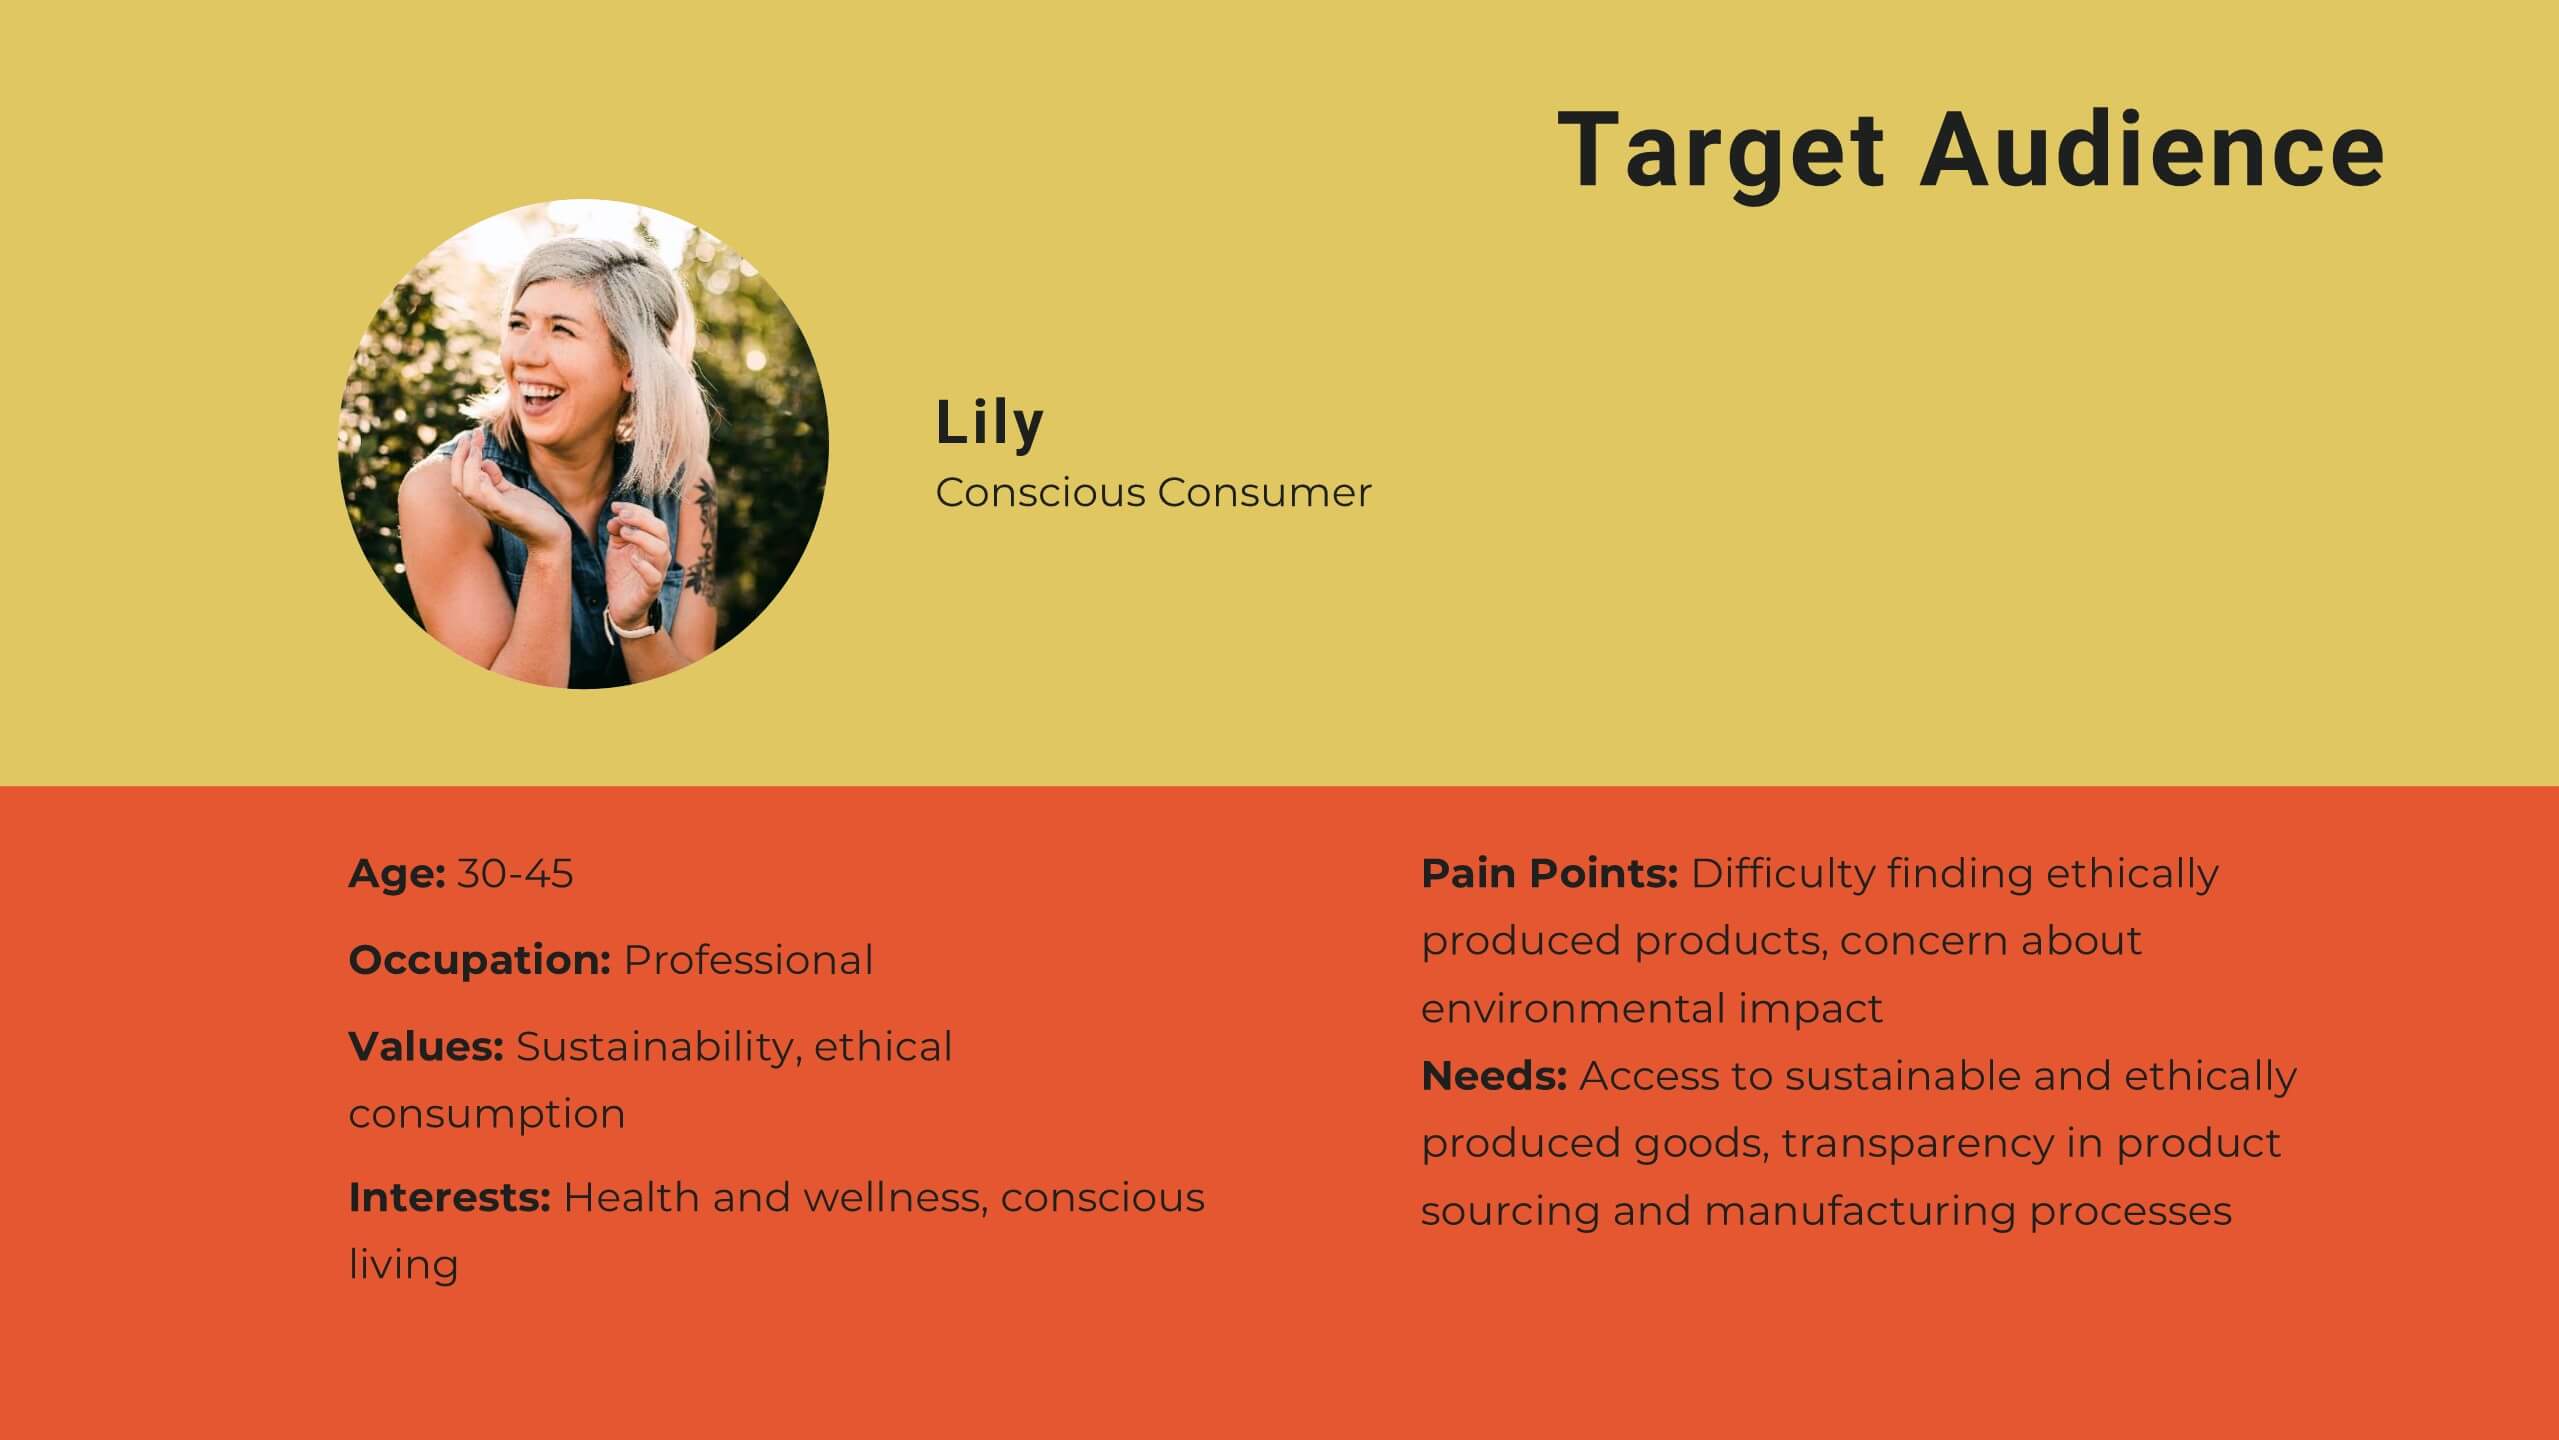
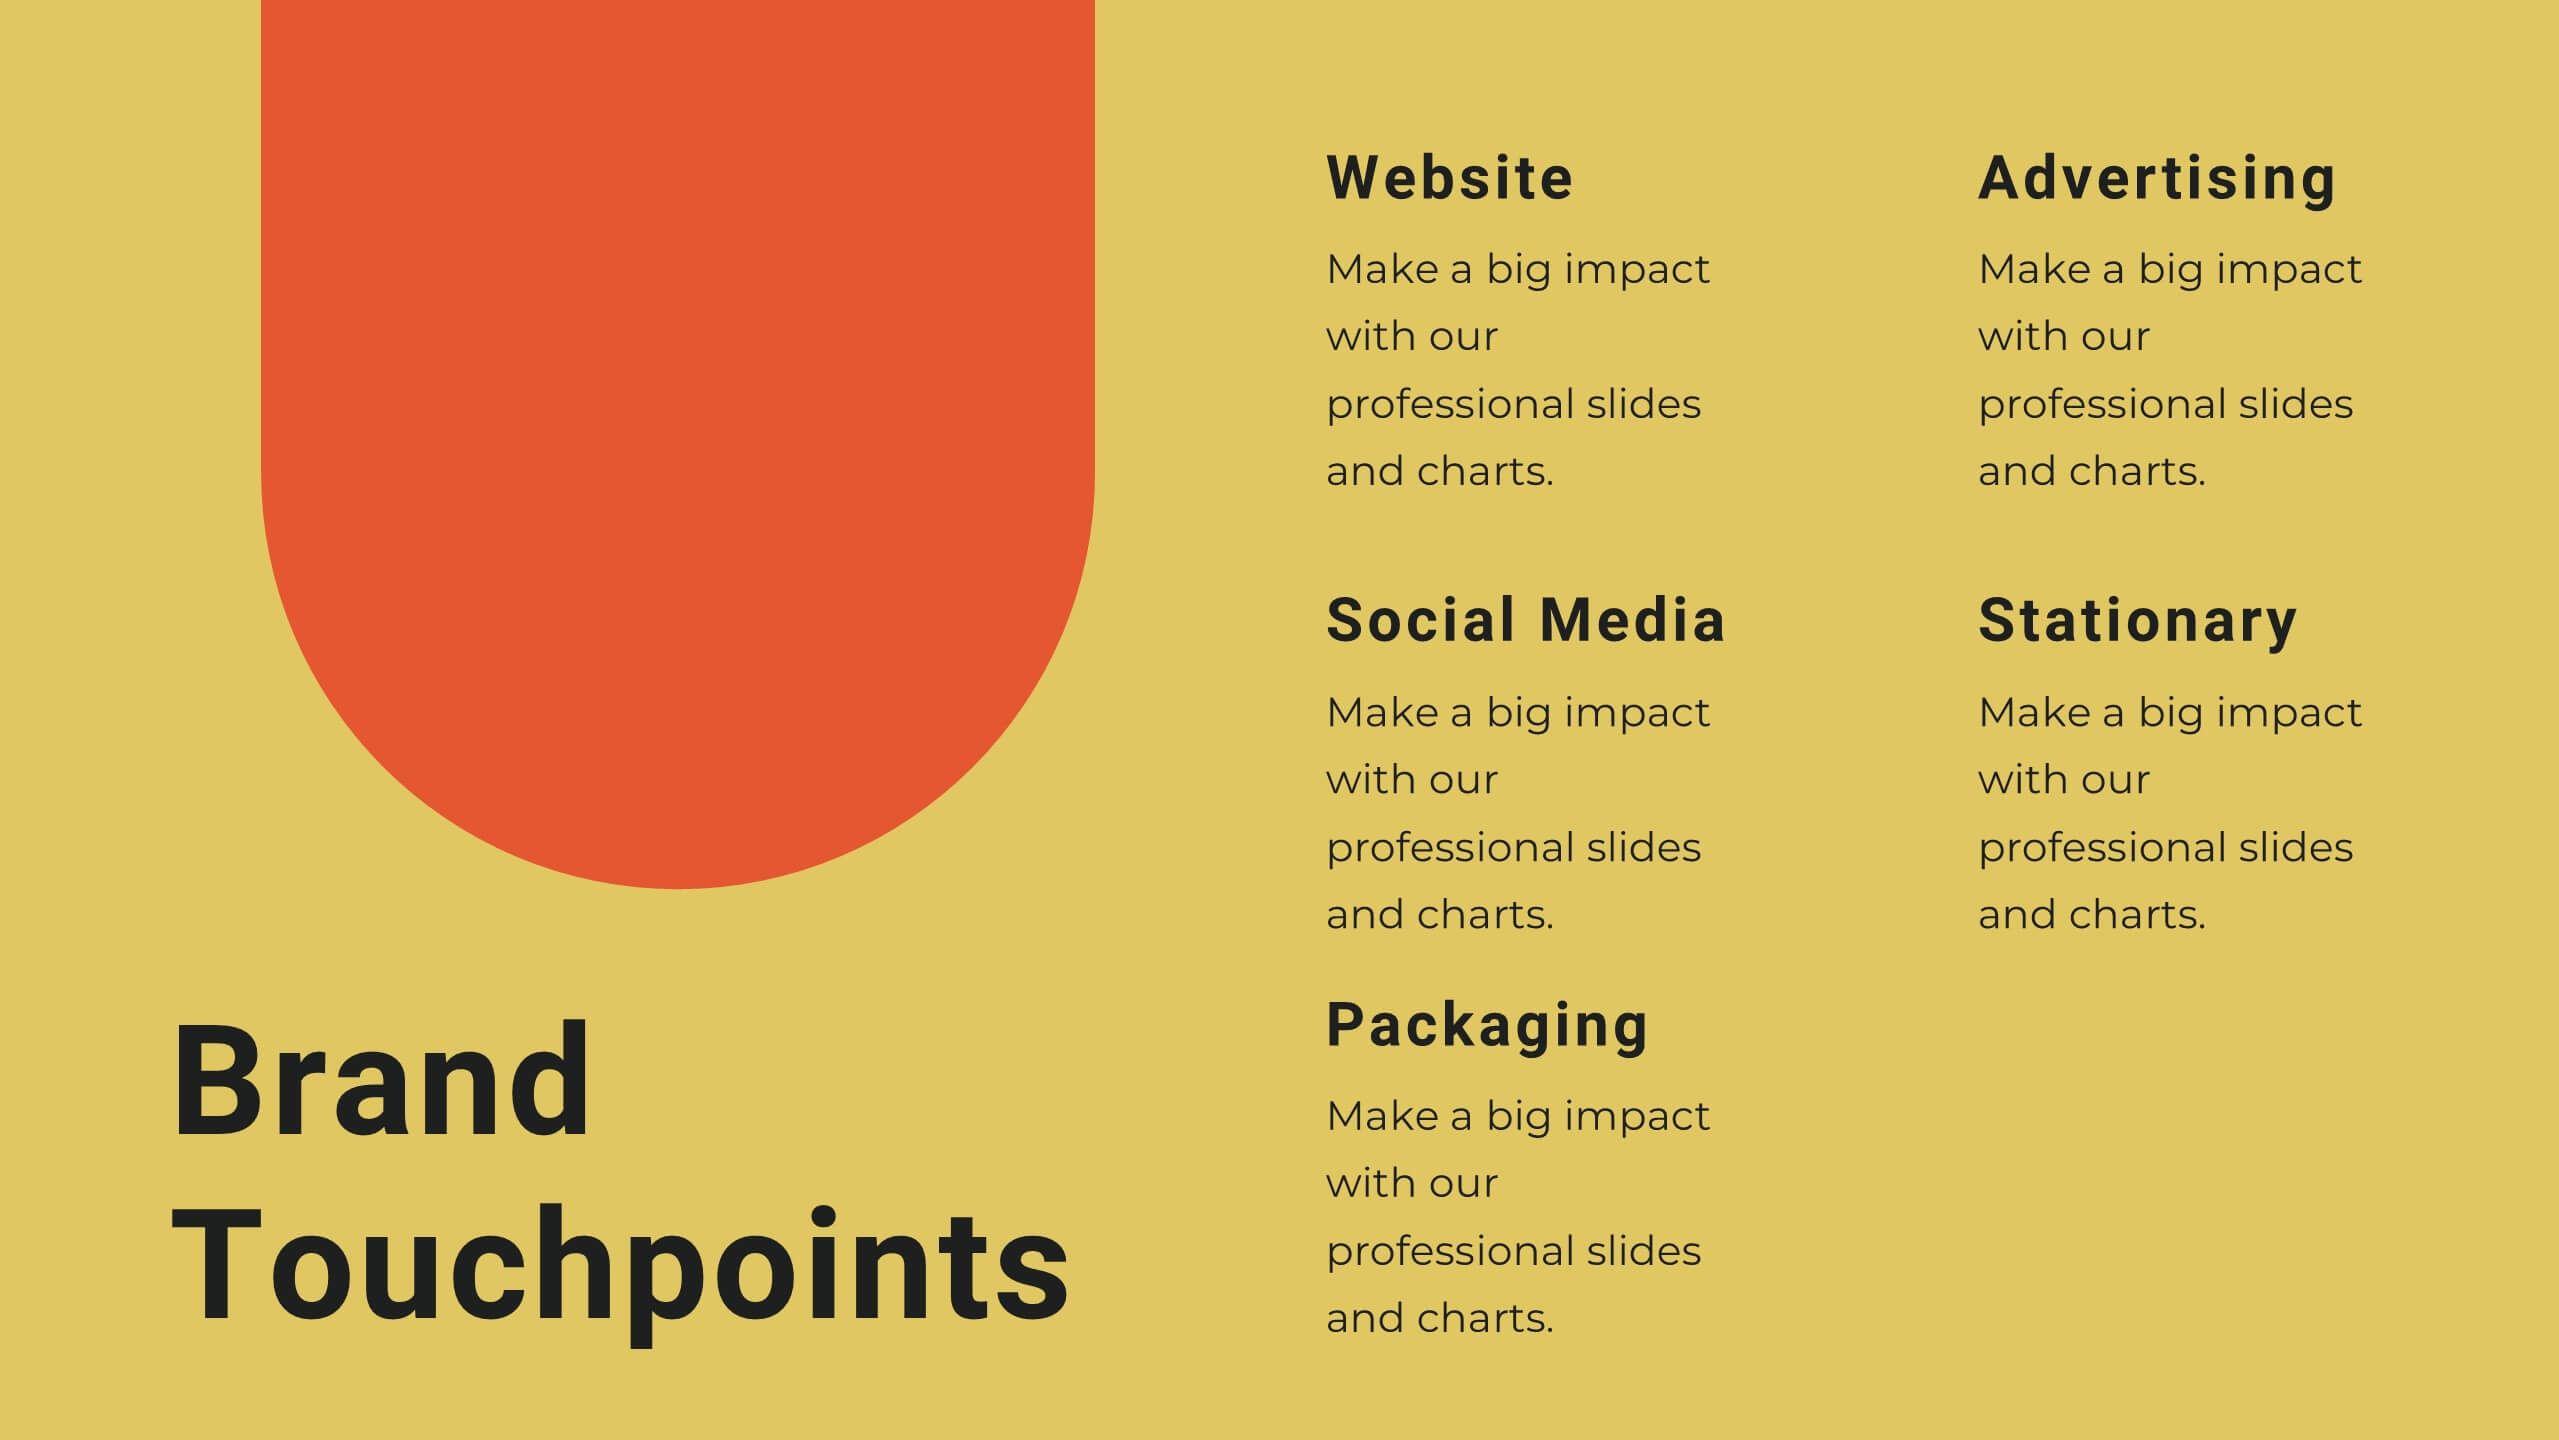
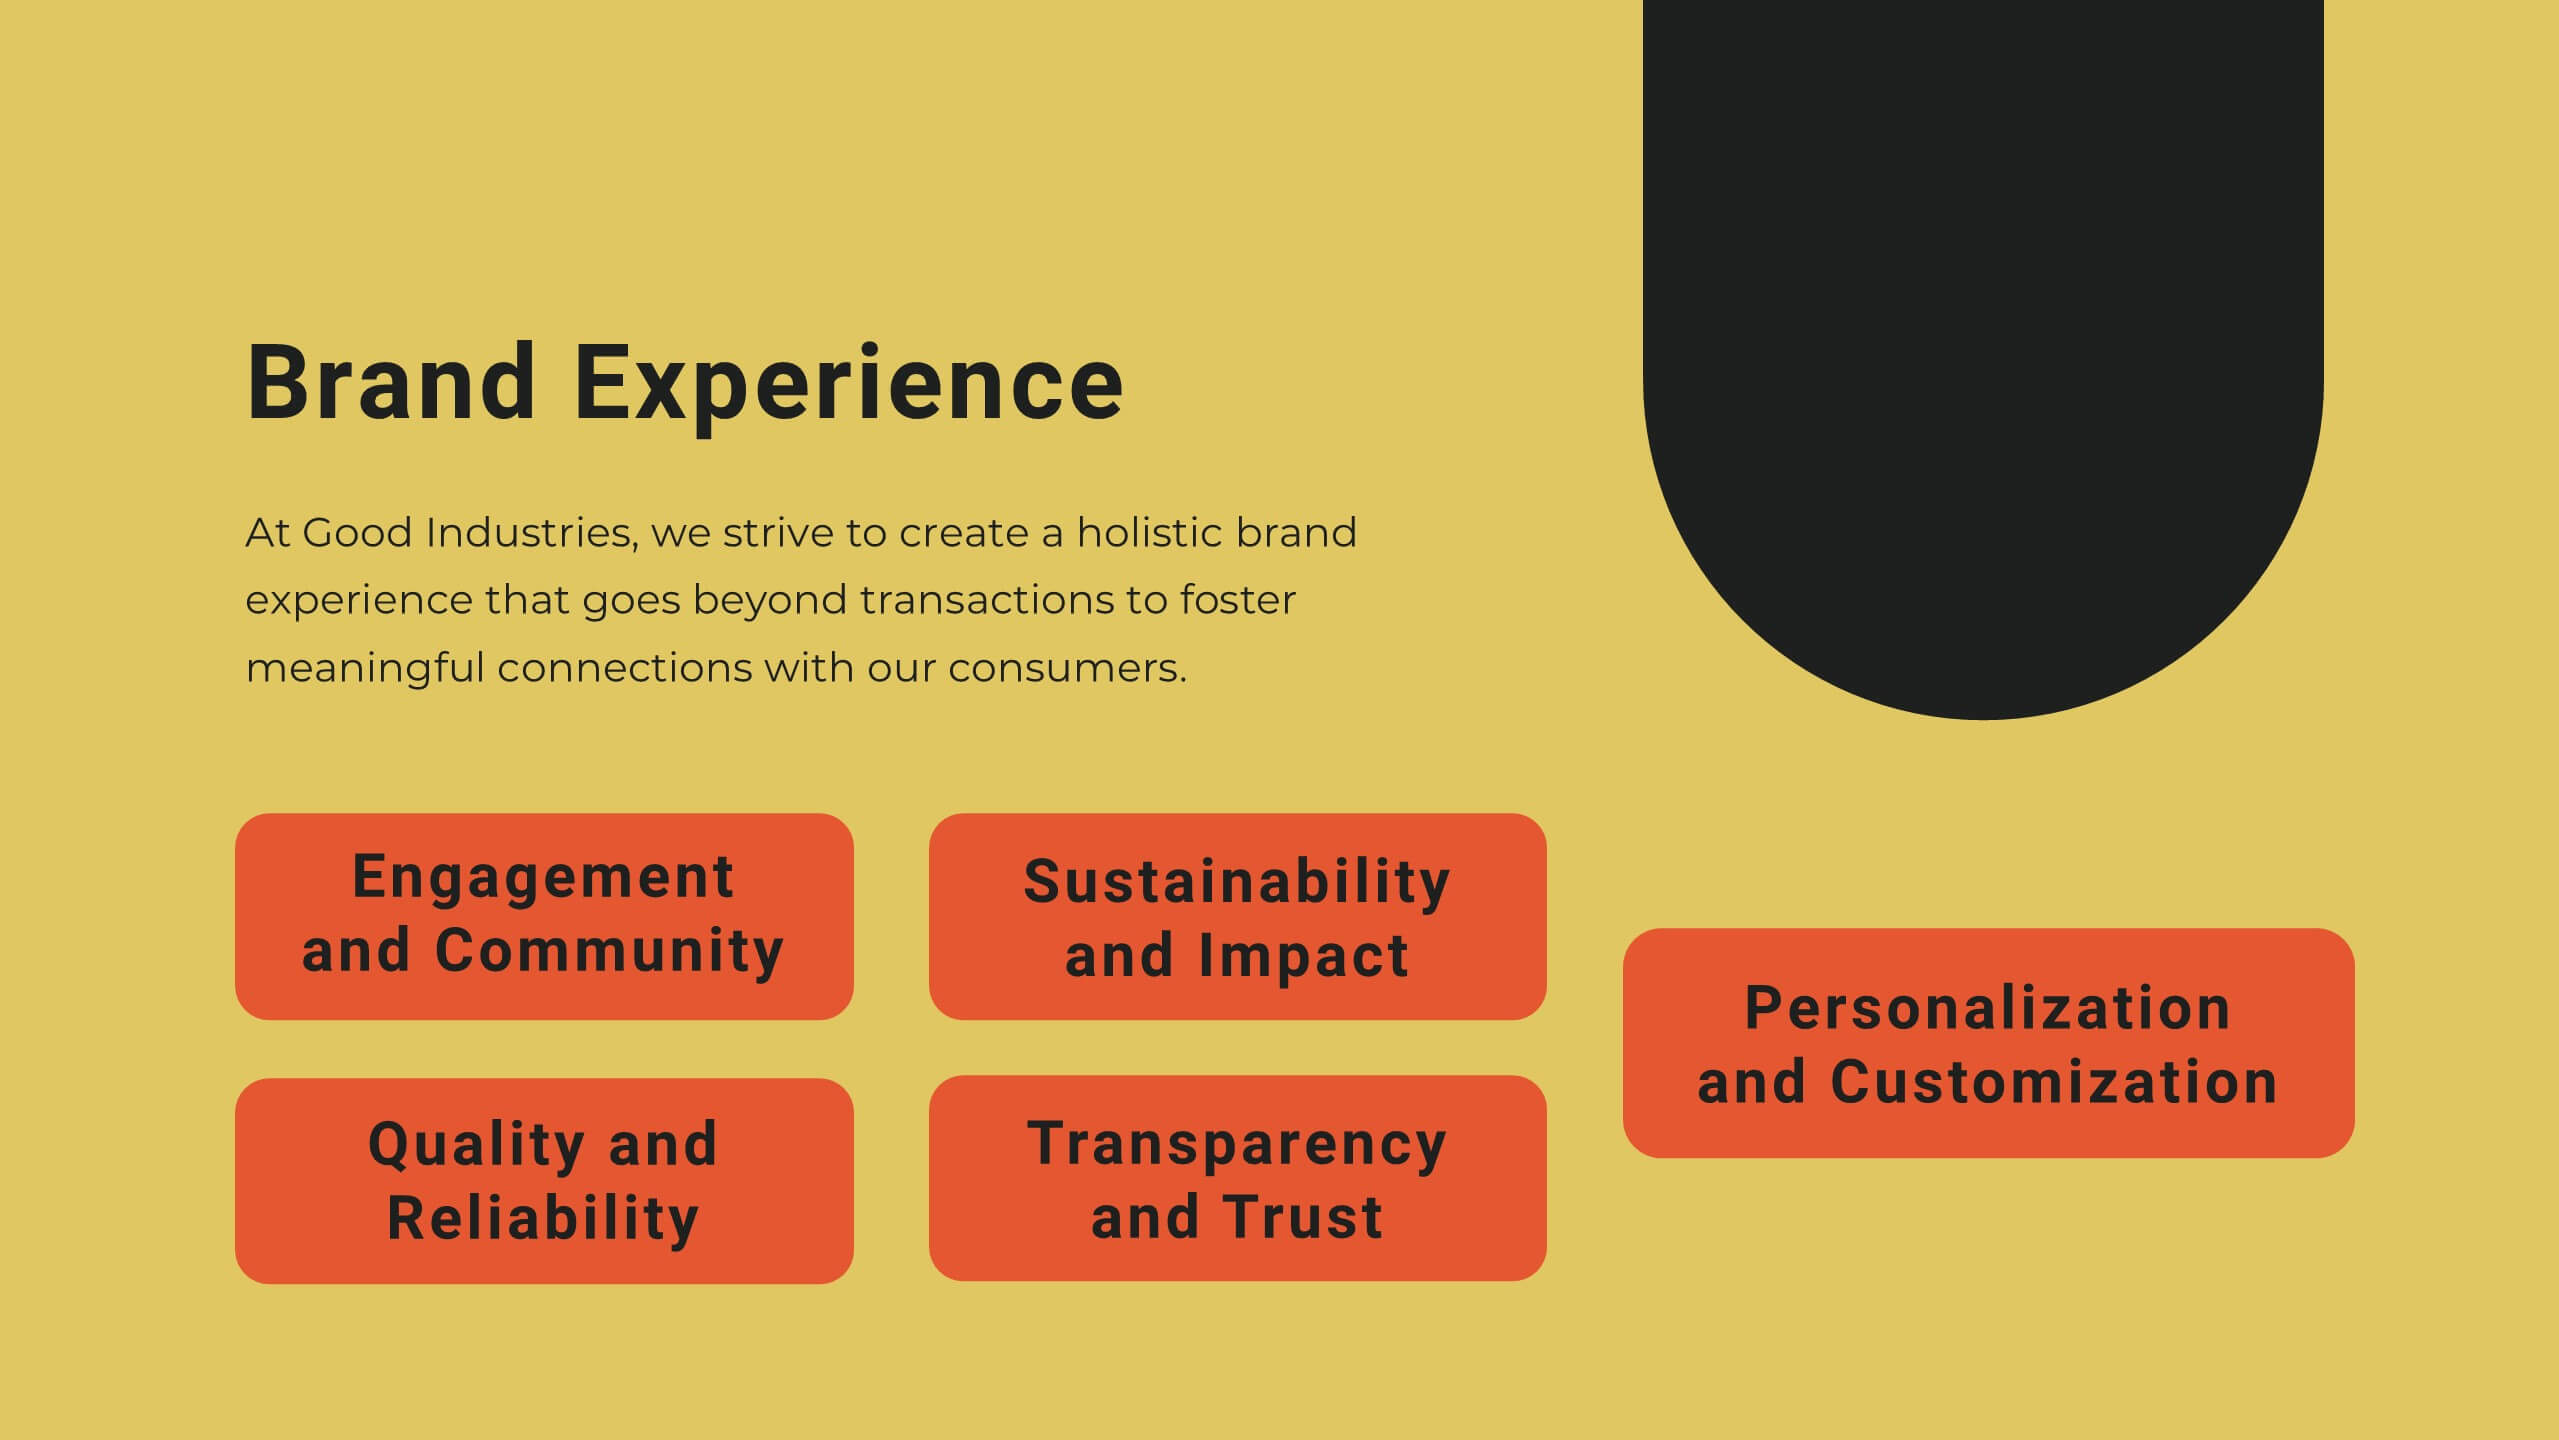
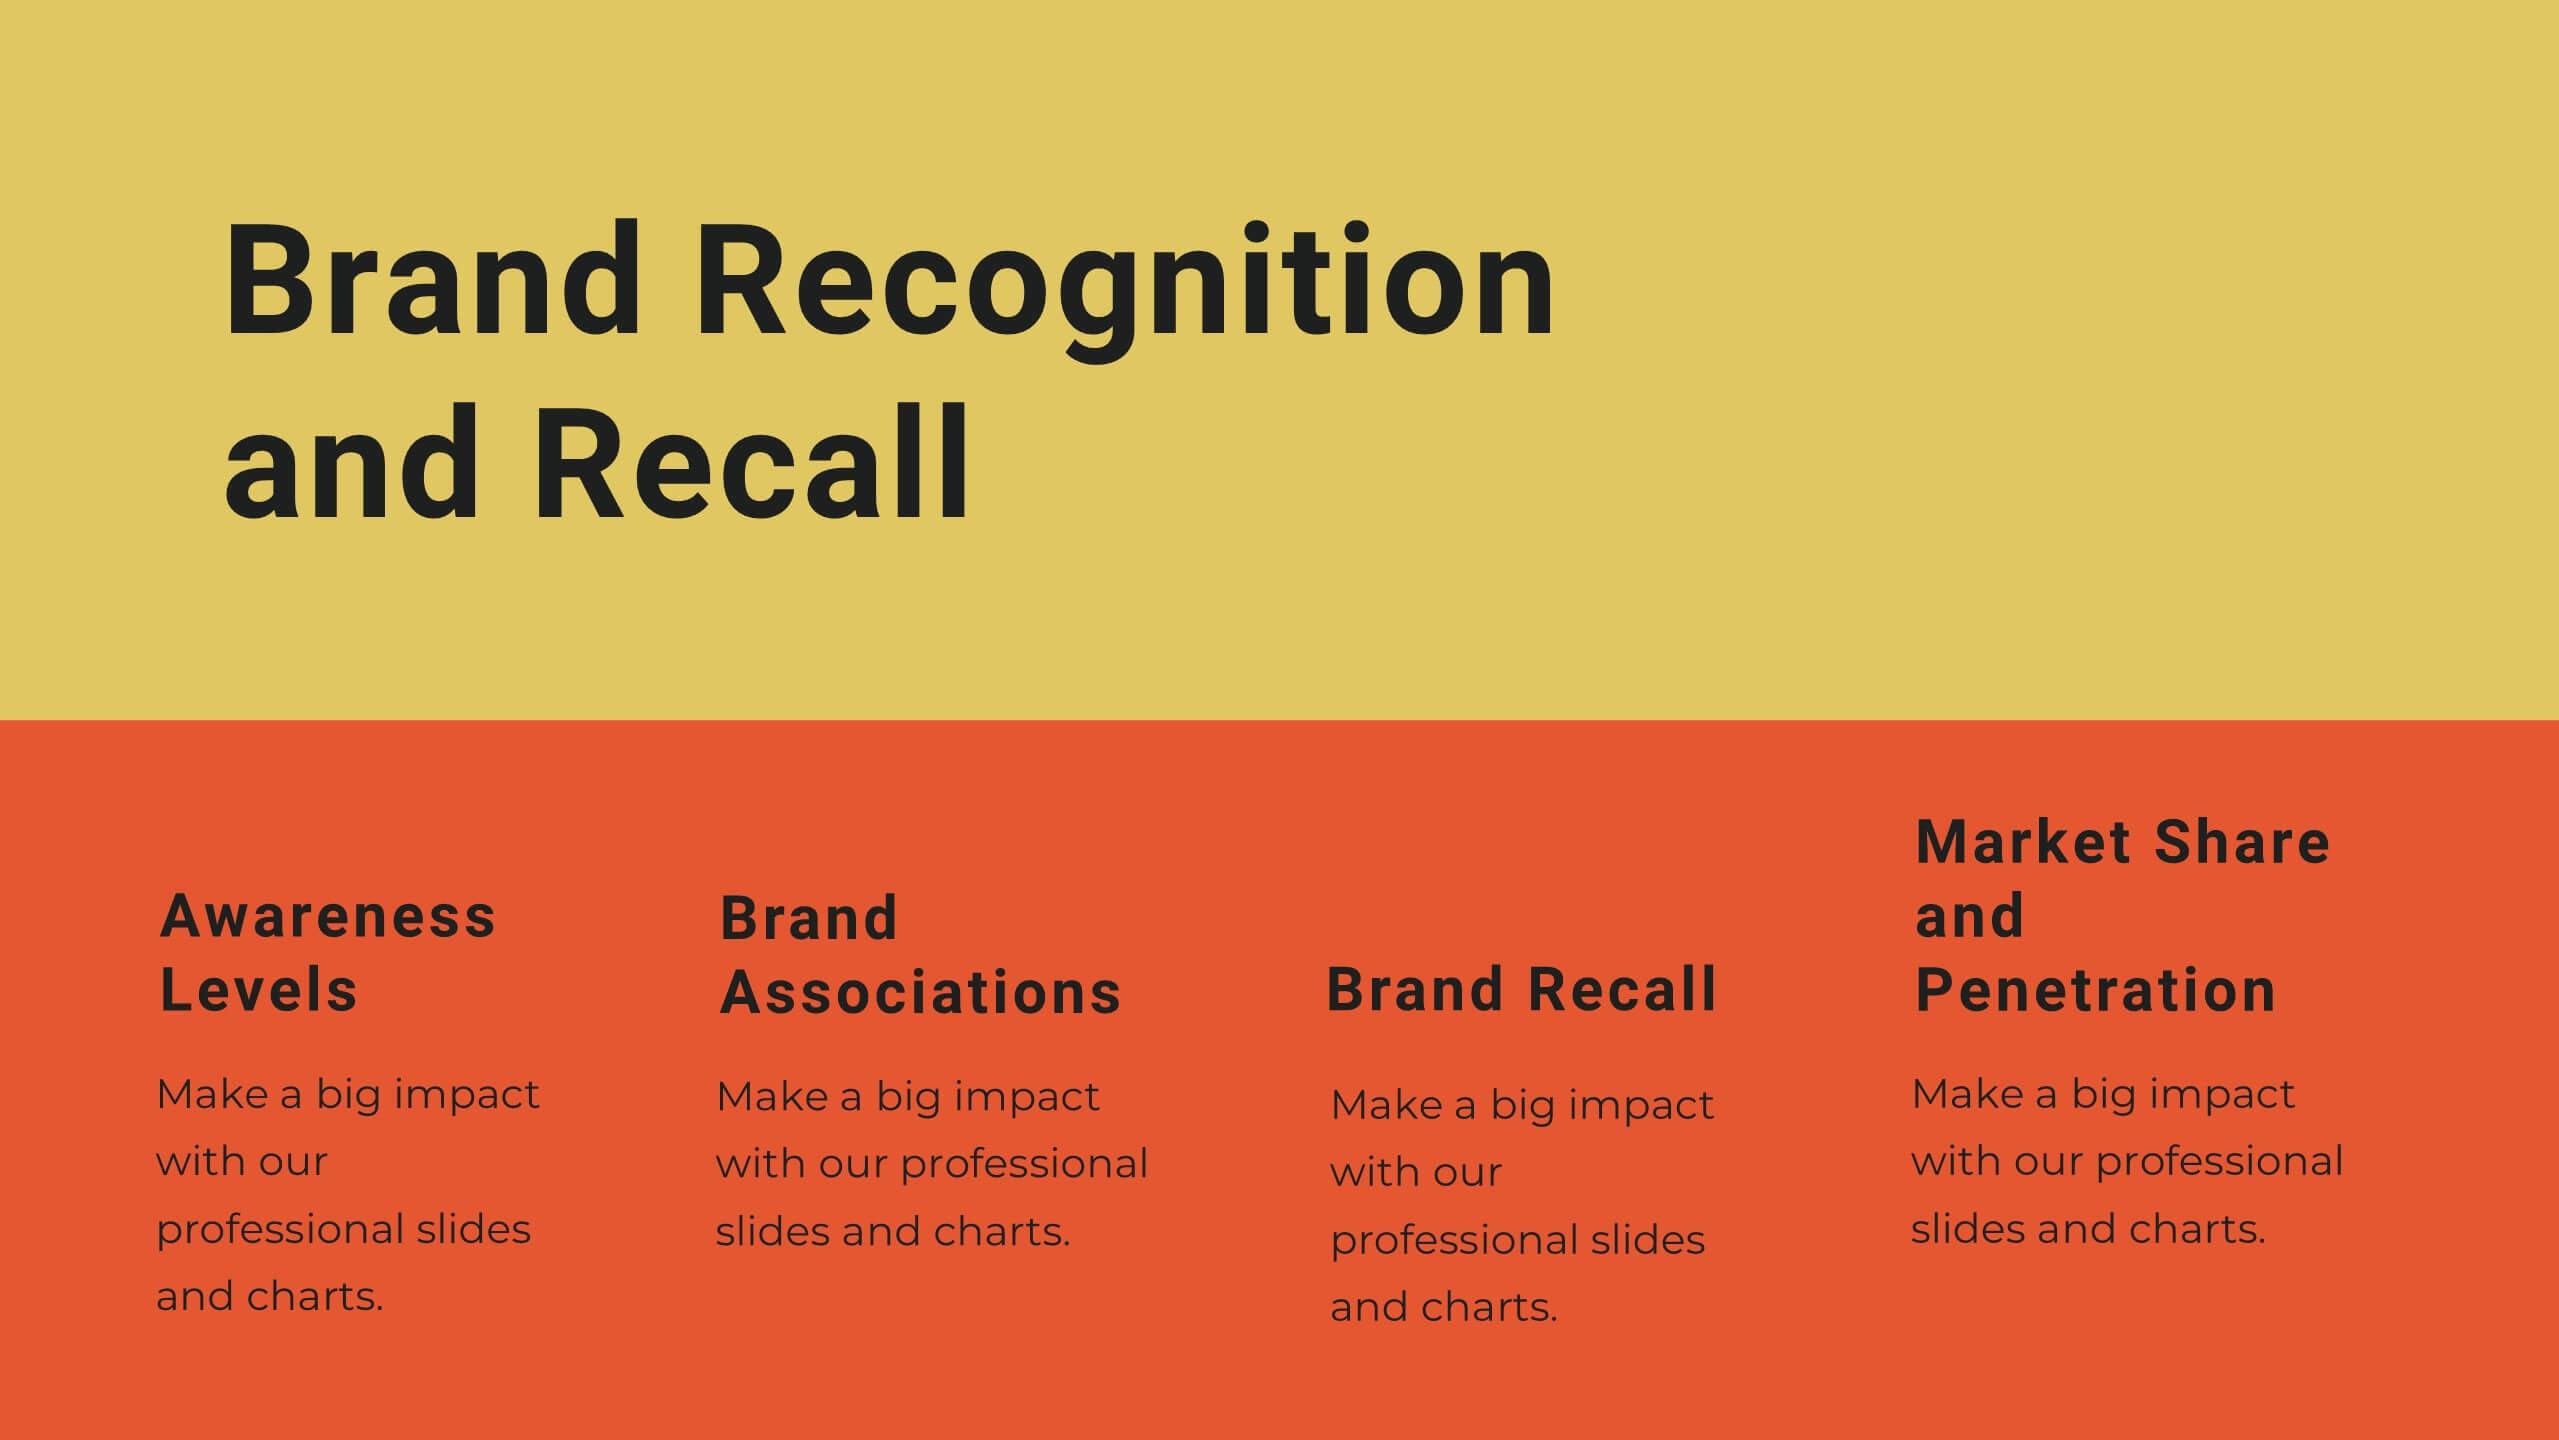
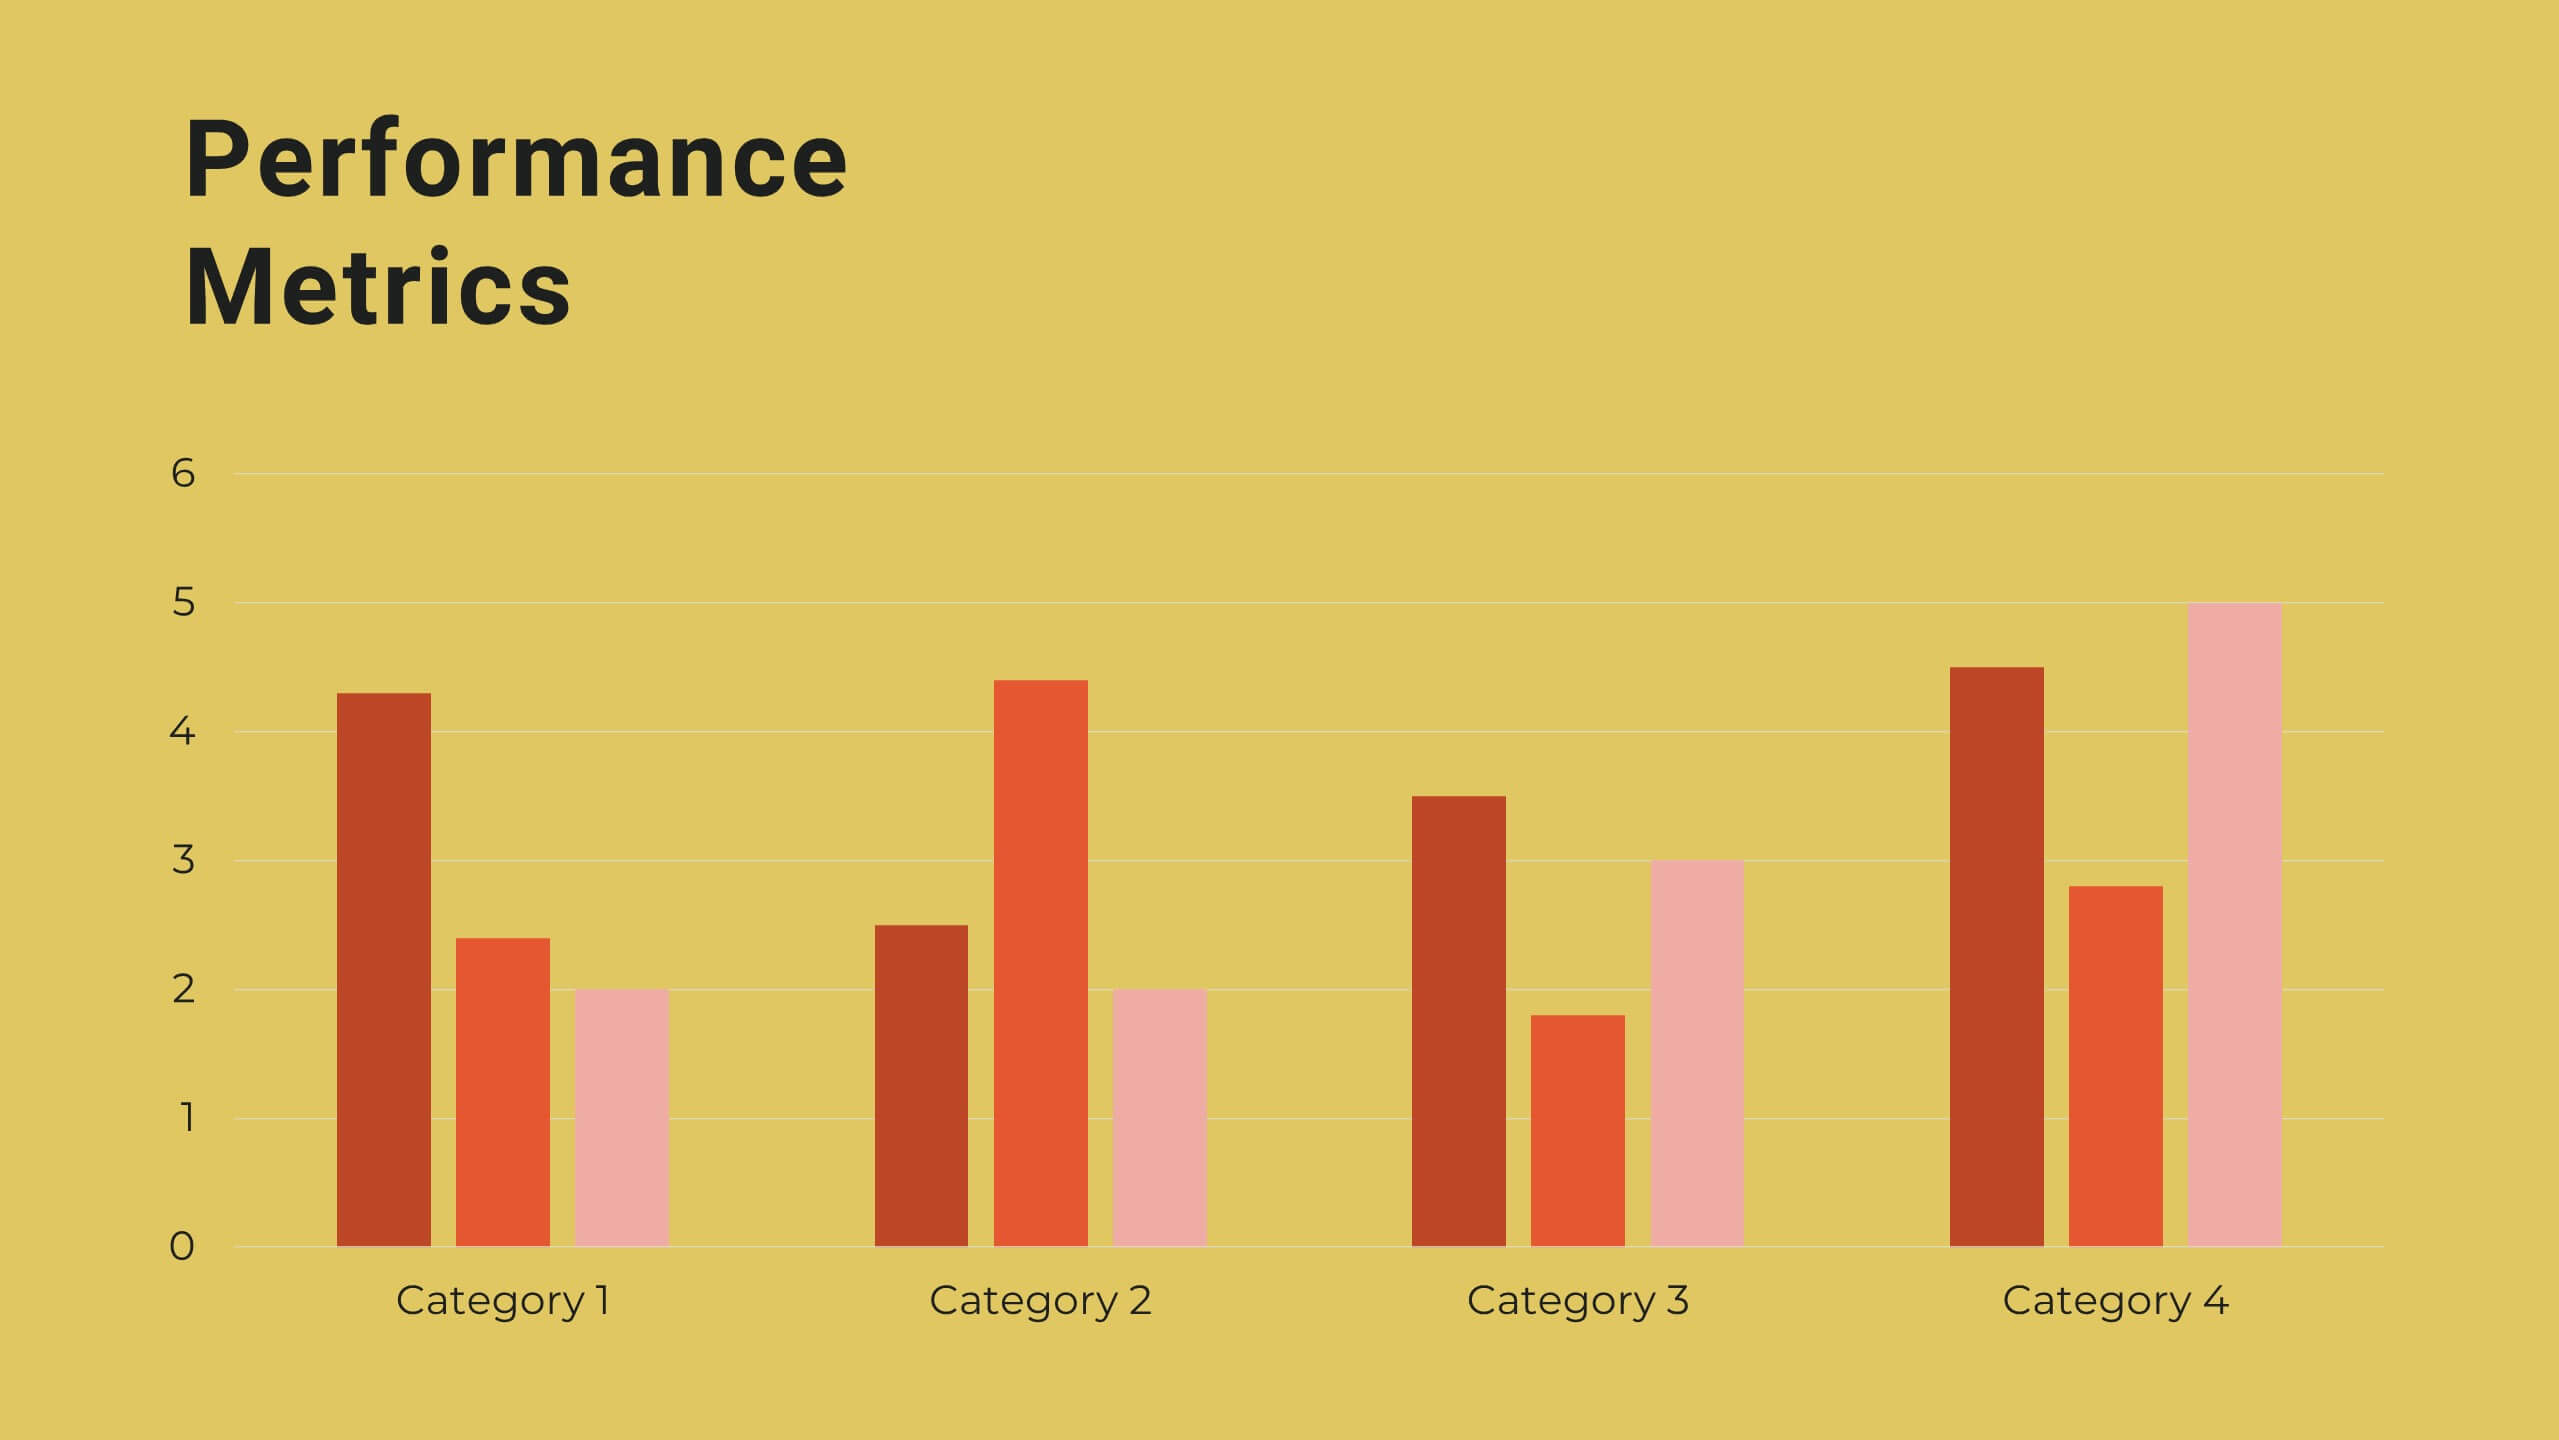
Yttrium Brand Strategy Report Presentation
Present your brand strategy with confidence using this vibrant, structured template! Covering brand identity, values, audience personas, and positioning, this template is perfect for crafting a compelling brand narrative. Fully customizable, it’s designed for seamless use in PowerPoint, Keynote, and Google Slides, making it an ideal tool for branding presentations.


26 slides
Law Firm and Research Presentation
Discover the fantastic Law Firm Presentation Template, perfect for showcasing your legal expertise! With its clean, beautiful design and easy-to-understand visuals, this template is great for all ages. This versatile template works with both PowerPoint and Google Slides, allowing you to choose your preferred platform. Customizing the template is a breeze, thanks to its simple-to-edit features. With image placeholders, effortlessly drag and drop your favorite photos to create a unique, professional presentation. The clean design helps your audience focus on crucial content, while the beautiful elements provide a polished, modern look. Creative modern icons allow you to emphasize key points, making your presentation engaging and memorable. Our Law Firm Presentation Template is a time-saver, designed for quick, efficient editing. Create a powerful presentation that leaves a lasting impression on your audience with ease. Enhance your legal presentations with this amazing template. Its clean design, creative icons, easy editing, and compatibility with PowerPoint and Google Slides make it the perfect solution for your needs. Download now and elevate your legal presentations!


5 slides
Employee Feedback Survey Report Presentation
Deliver clear insights into team sentiment with this employee rating slide. Designed with star rating visuals and thumbs-up iconography, it's perfect for showcasing staff satisfaction, engagement, and performance reviews. Easy to customize in PowerPoint, Keynote, and Google Slides.


4 slides
Corporate Growth and Strategy Map Presentation
Visualize your business development path with this layered strategy map. Ideal for showcasing organizational goals, strategic initiatives, and cascading growth stages. Each level is clearly structured for easy customization, making it perfect for leadership planning, corporate roadmaps, or strategic reviews in PowerPoint, Keynote, or Google Slides.


26 slides
Company Profile and Accomplishments Presentation
A company profile is a document that provides an overview of a business entity. This template serves as a company introduction, presenting essential information about company history, products or services, achievements, goals, and other relevant details. This template showcases the milestones and capabilities of a company. This presentation is perfect for businesses, startups, or organizations looking to highlight their success, growth, and overall expertise in their industry. The clean layout, engaging visuals, and comprehensive information, will help your presentation leave a lasting impression on your audience and enhance your company's reputation.


26 slides
Emery Presentation Template
Ready to make an impression? Style and professionalism are all wrapped up in Emery. New businesses and startups will find it useful - from real estate to travel agencies and everything in-between. Emery is a bold, colorful minimalistic aesthetic template. It's easy to customize, clean and bold template for you to use for your company website. It's flexible and makes an easy quick start. Fill in your details with our easy to edit text, pictures, timelines, charts and we'll set you up for success. Use this fantastic template to promote your business or project and create the perfect document.


10 slides
Business Data Charts Presentation
Visualize insights with precision using this Business Data Charts Presentation Template. Featuring clean, colorful doughnut charts and clearly labeled segments, it’s ideal for showcasing survey results, KPI breakdowns, or performance metrics. Designed for professionals who want sleek data visuals, and fully customizable in PowerPoint, Keynote, and Google Slides.


10 slides
Teamwide Business Implementation Plan Presentation
Visualize your implementation roadmap with this team-focused progress slide. Featuring circular avatars, percentage bars, and milestone titles, it’s ideal for highlighting departmental progress or execution timelines. Fully editable in PowerPoint, Keynote, and Google Slides—perfect for internal updates, leadership reviews, or showcasing collaborative performance across business functions.


6 slides
State-by-State Business Distribution Map Presentation
Visualize regional performance with this State-by-State Business Distribution Map template. Ideal for showcasing business coverage, sales territories, or demographic trends across the U.S. Each state is color-coded for clarity, with editable text and icons. Fully compatible with PowerPoint, Keynote, and Google Slides—perfect for executives, marketers, or analysts.


21 slides
Illusia Artist Portfolio Template Presentation
Make your creative work shine with this vibrant and versatile portfolio presentation template. Designed for artists, designers, and creative professionals, this template enables you to showcase your projects, philosophy, and achievements in a visually captivating way. Present your journey with slides that cover an introduction, portfolio overview, creative process, and collaborations. Highlight your unique style and philosophy while featuring key projects with dynamic layouts. Share your accolades, services offered, pricing details, and client testimonials to build trust and credibility. Fully customizable and compatible with PowerPoint, Google Slides, and Keynote, this template offers effortless editing to align with your branding and personal style. Perfect for portfolio reviews, client meetings, or showcasing your work online, this template is designed to make a bold, professional impression.


4 slides
Colorful Brainstorming Mind Map Presentation
A spark of imagination is all it takes to bring ideas to life, and this presentation helps you map them with clarity and flow. Designed to simplify complex thinking, it organizes concepts into visually connected clouds for effortless brainstorming. Fully compatible with PowerPoint, Keynote, and Google Slides.


20 slides
Illumira Design Proposal Presentation
Impress clients with this modern and professional design proposal presentation template. It covers key sections such as project summary, objectives, budget breakdown, and action plans. Fully customizable with clean layouts and engaging visuals, perfect for showcasing your design solutions effectively. Compatible with PowerPoint, Keynote, and Google Slides.


21 slides
Ashbrook Startup Funding Proposal Presentation
This Startup Funding Presentation Template is designed to help entrepreneurs pitch their ideas effectively. Covering essential aspects such as the business model, market analysis, growth plan, and financial overview, it provides a professional structure to captivate investors. Fully customizable and compatible with PowerPoint, Keynote, and Google Slides.