


Features
- 5 Unique slides
- Fully editable and easy to edit in Microsoft Powerpoint, Keynote and Google Slides
- 16:9 widescreen layout
- Clean and professional designs
- Export to JPG, PDF or send by email


Do you have any questions?
Recommend


5 slides
USA Resources Map Infographics
A USA resources map is a visual representation of the natural resources found in different regions of the United States. This presentation template showcases the diverse natural resources found across the United States. It provides an overview of different types of resources, including minerals, energy sources, agricultural products, and more, allowing viewers to understand the richness and distribution of resources in the country. This can provide valuable information for industries, researchers, and students to understand the distribution and utilization of natural resources across the country.


10 slides
National Distribution Network in the US Presentation
Present your logistics strategy with clarity using the National Distribution Network in the US Presentation. This slide visually maps out your key distribution hubs across the country, pairing each location with a numbered label and space for insights or logistics data. Ideal for supply chain overviews, retail operations, or partner briefings. Fully editable in Canva, PowerPoint, and Google Slides.


22 slides
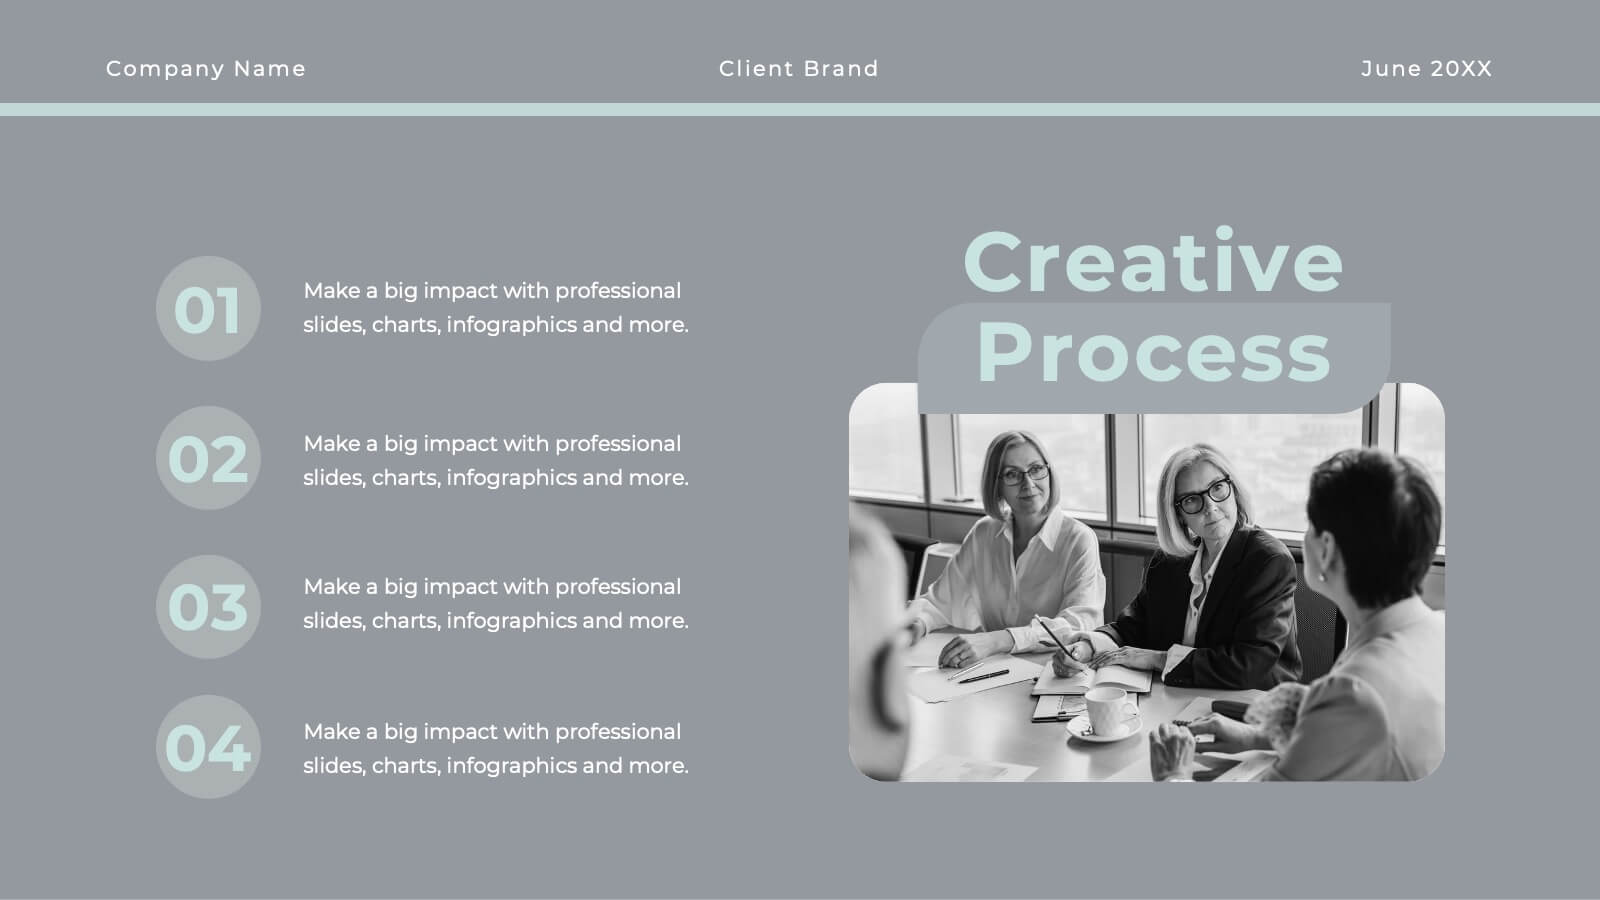
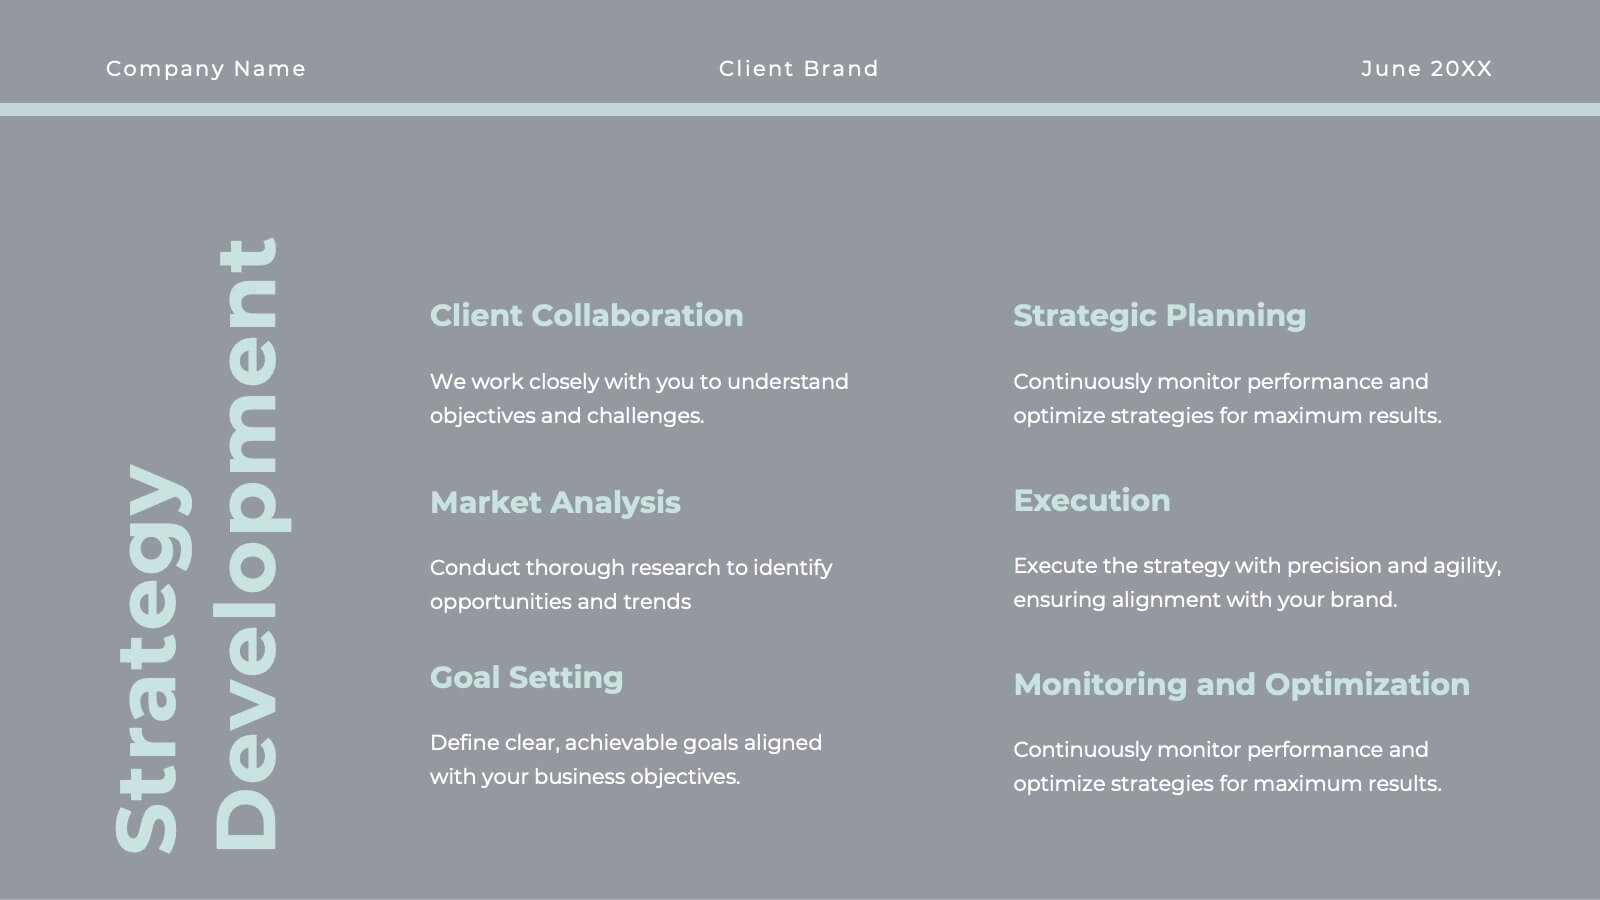
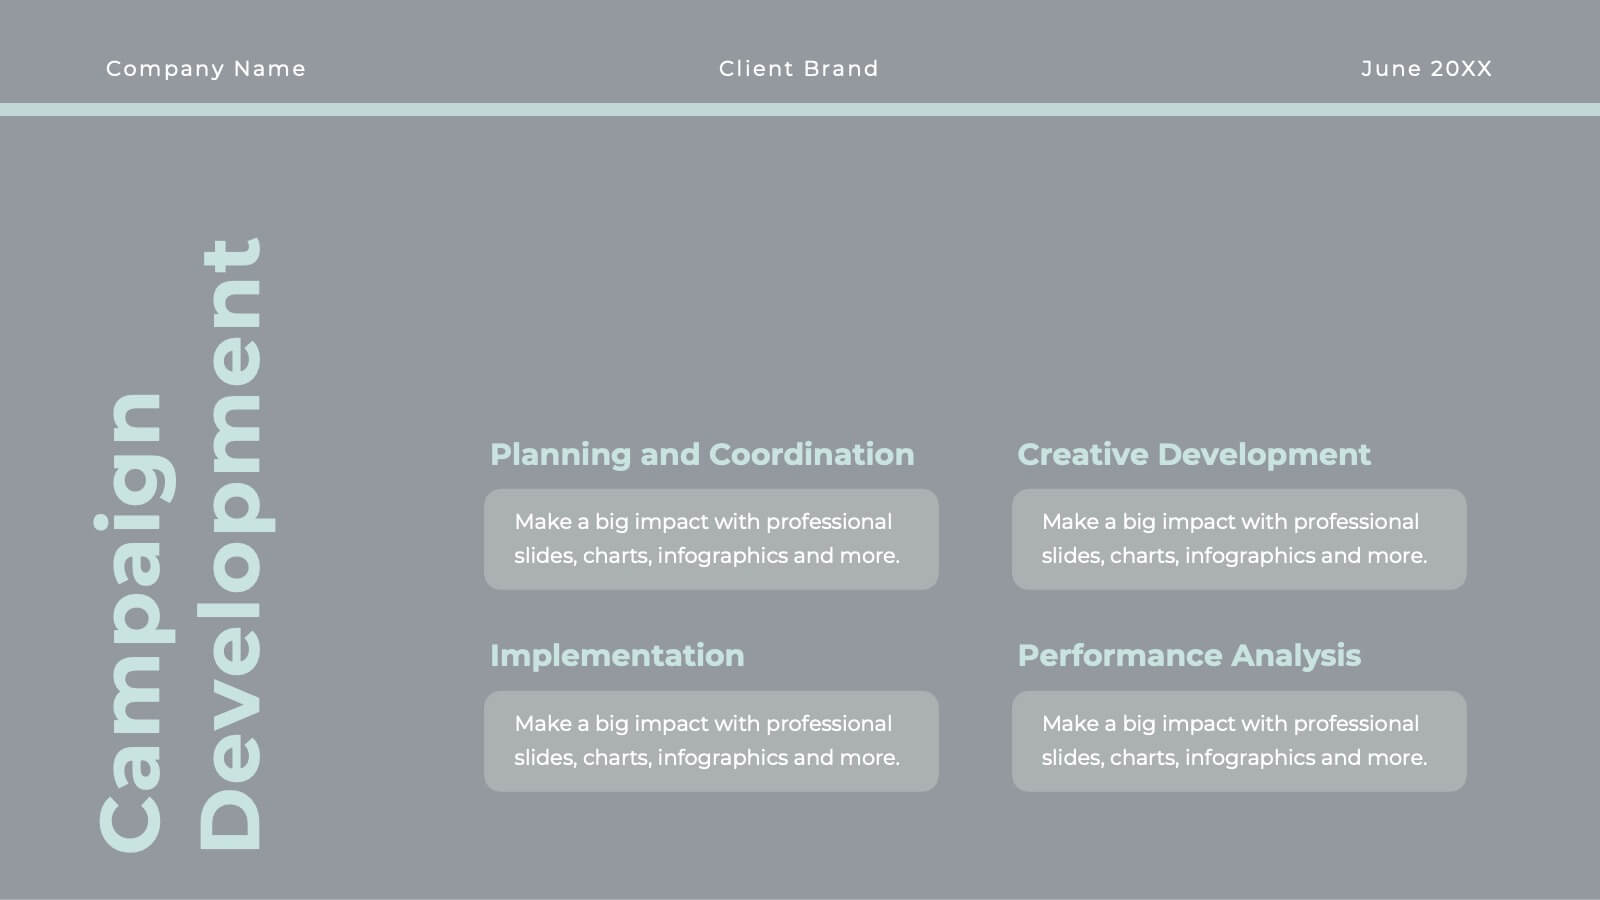
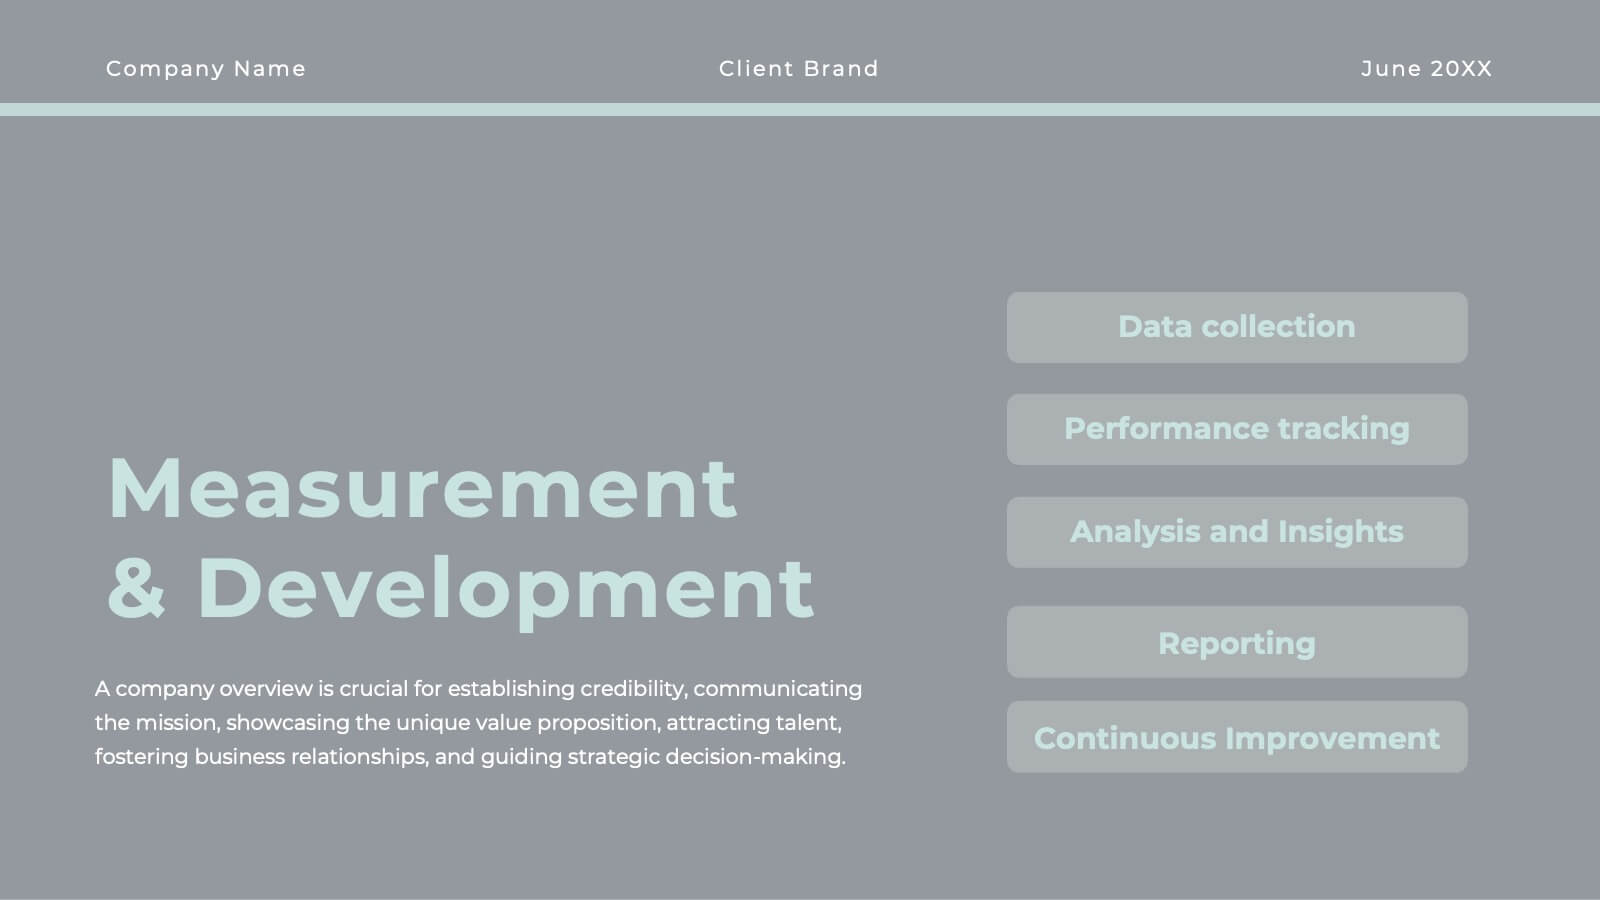
Whirlwind Advertising Agency Proposal Presentation
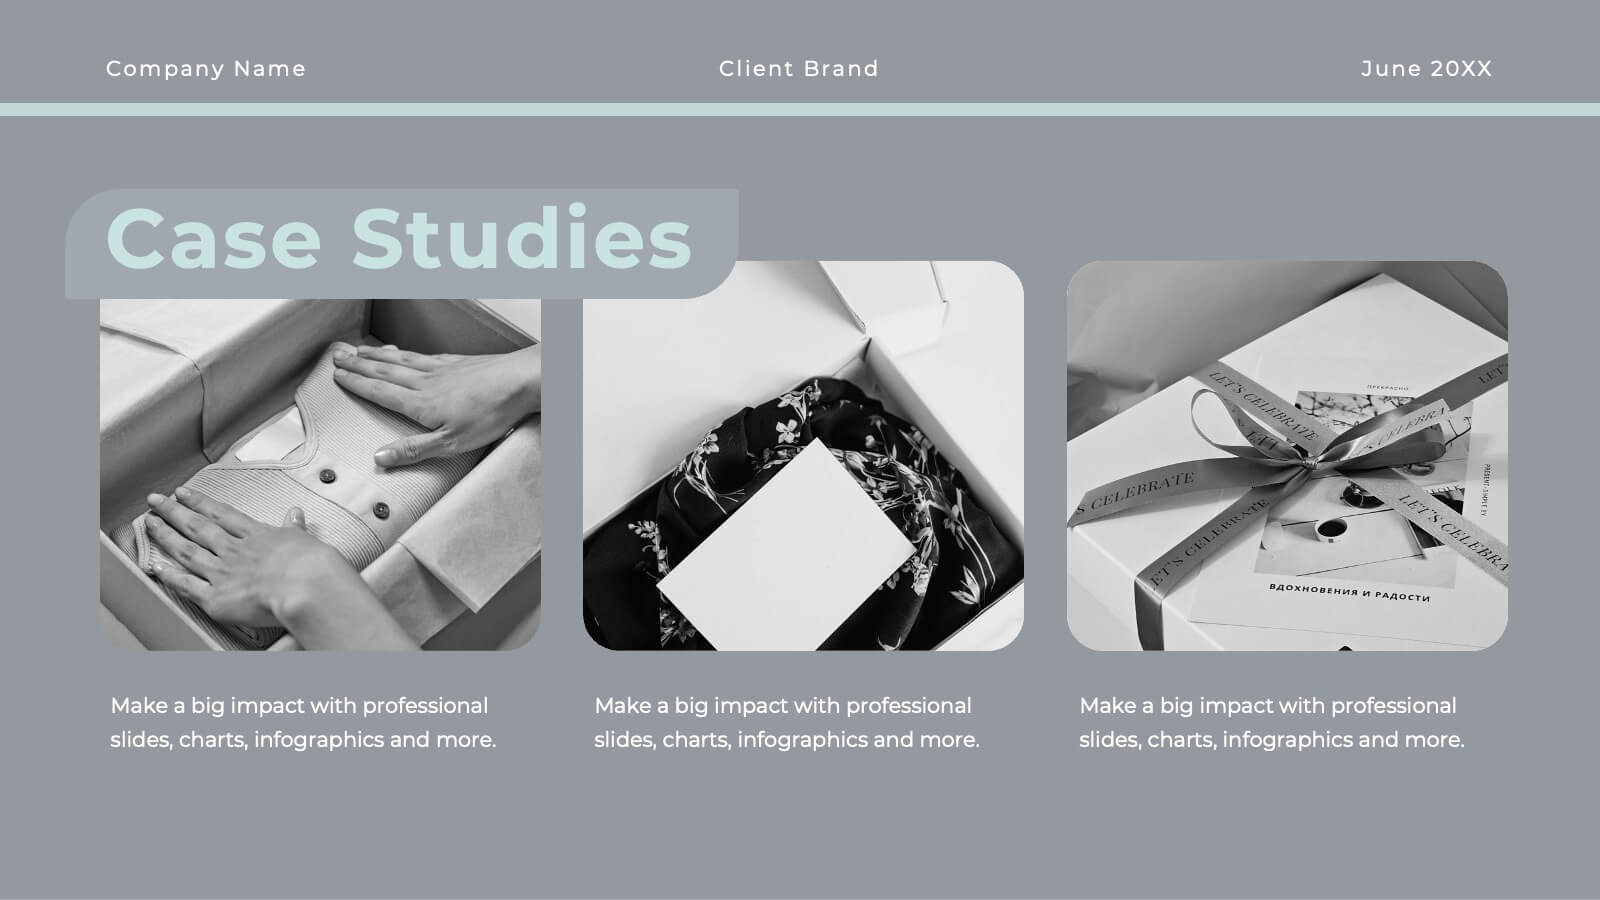
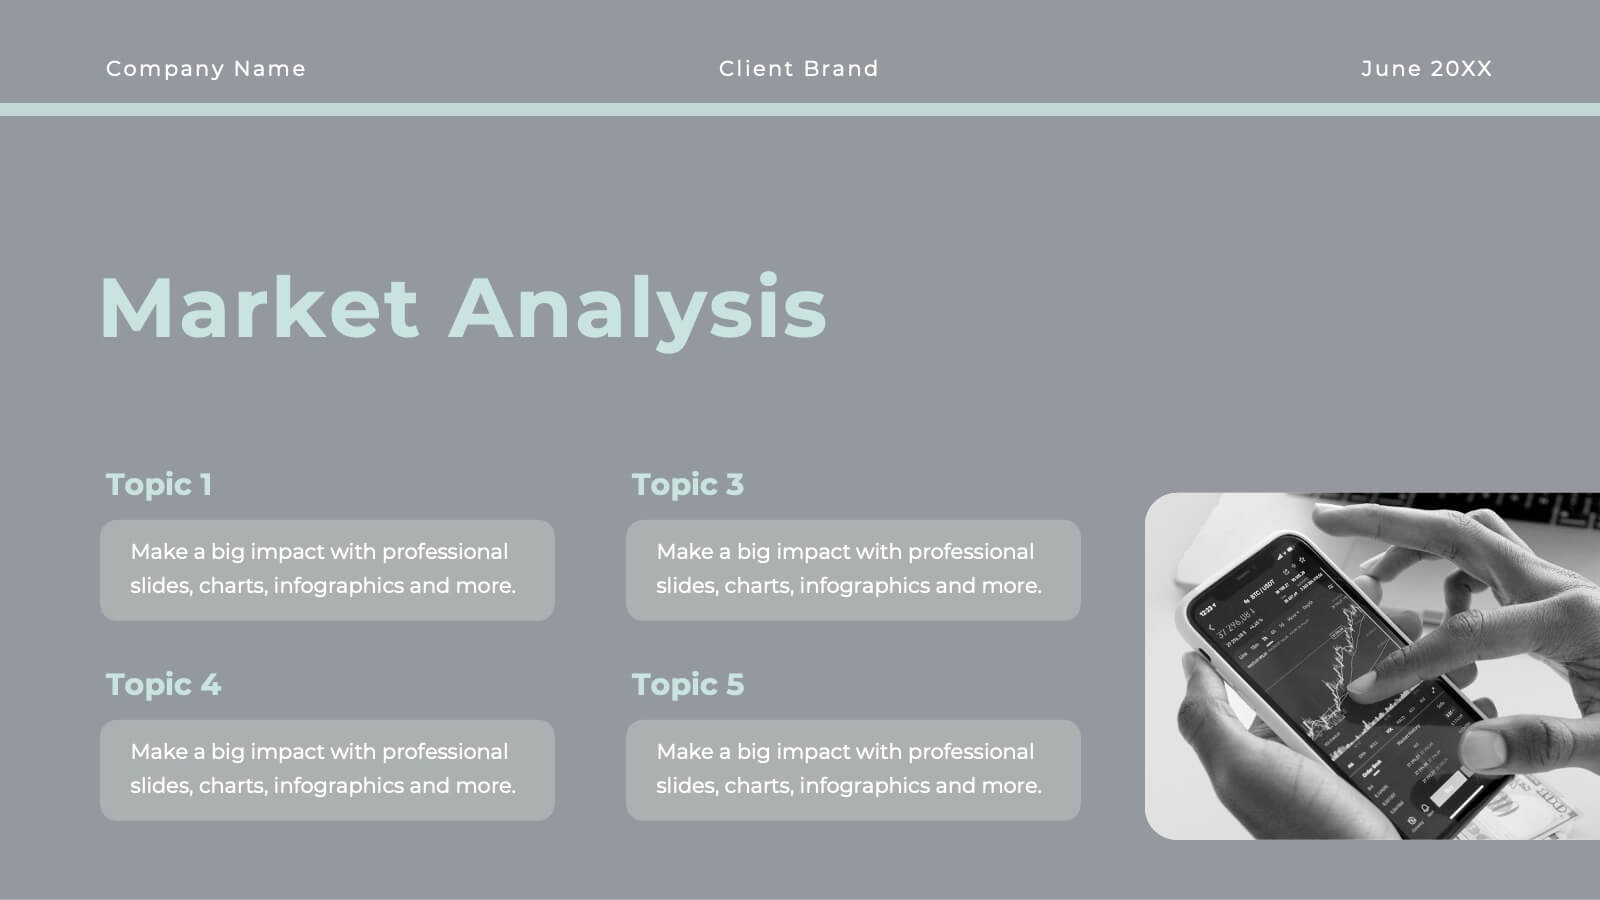
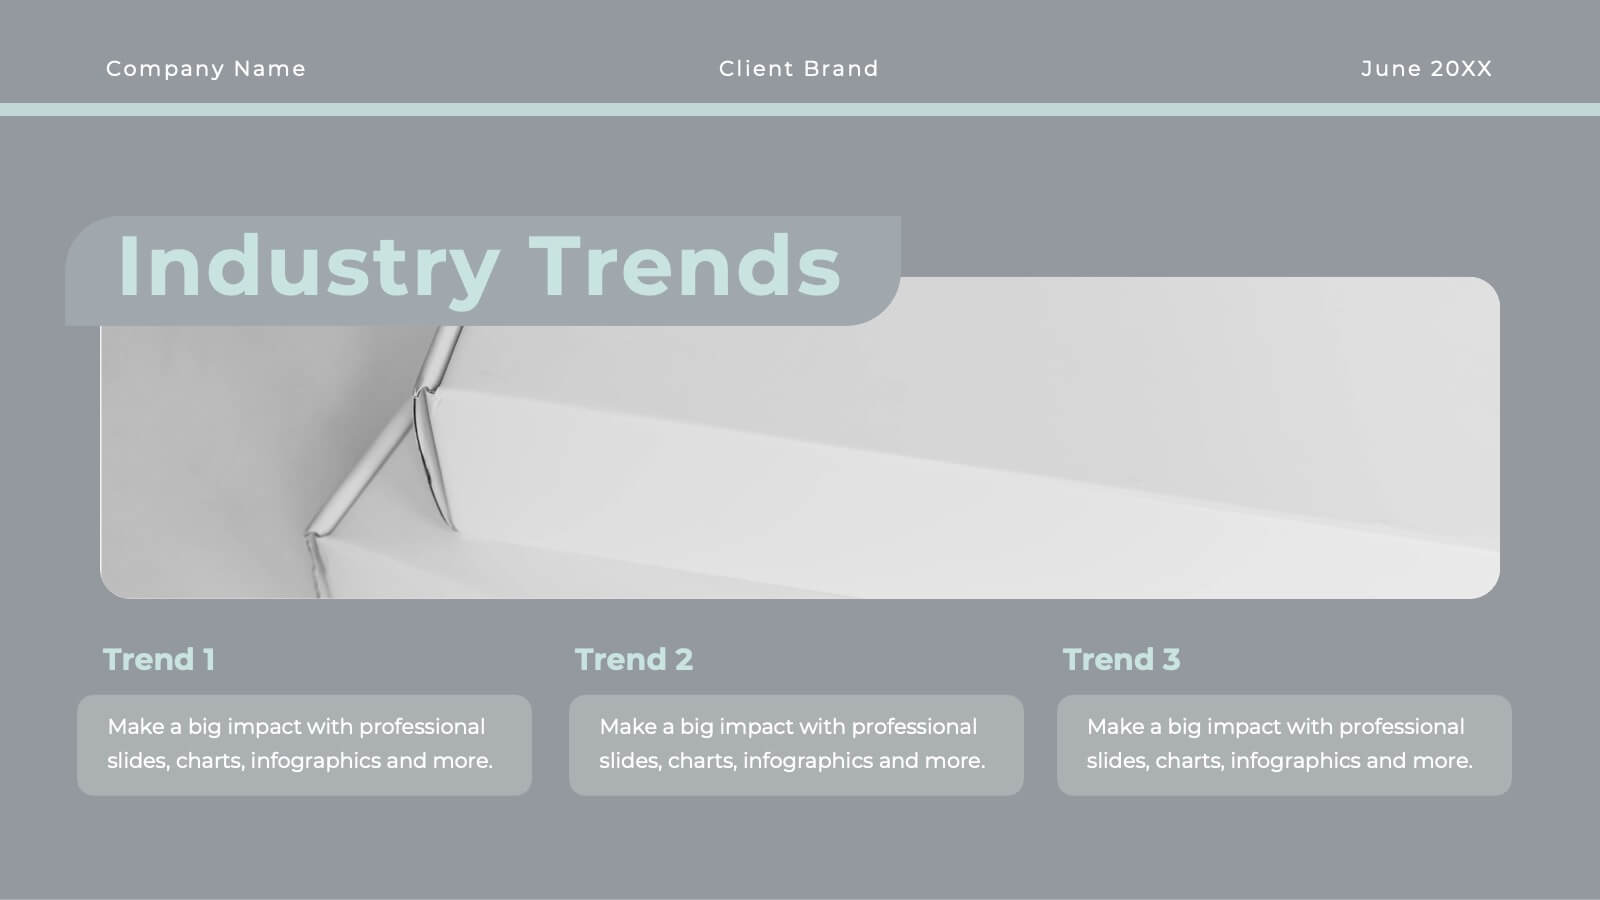
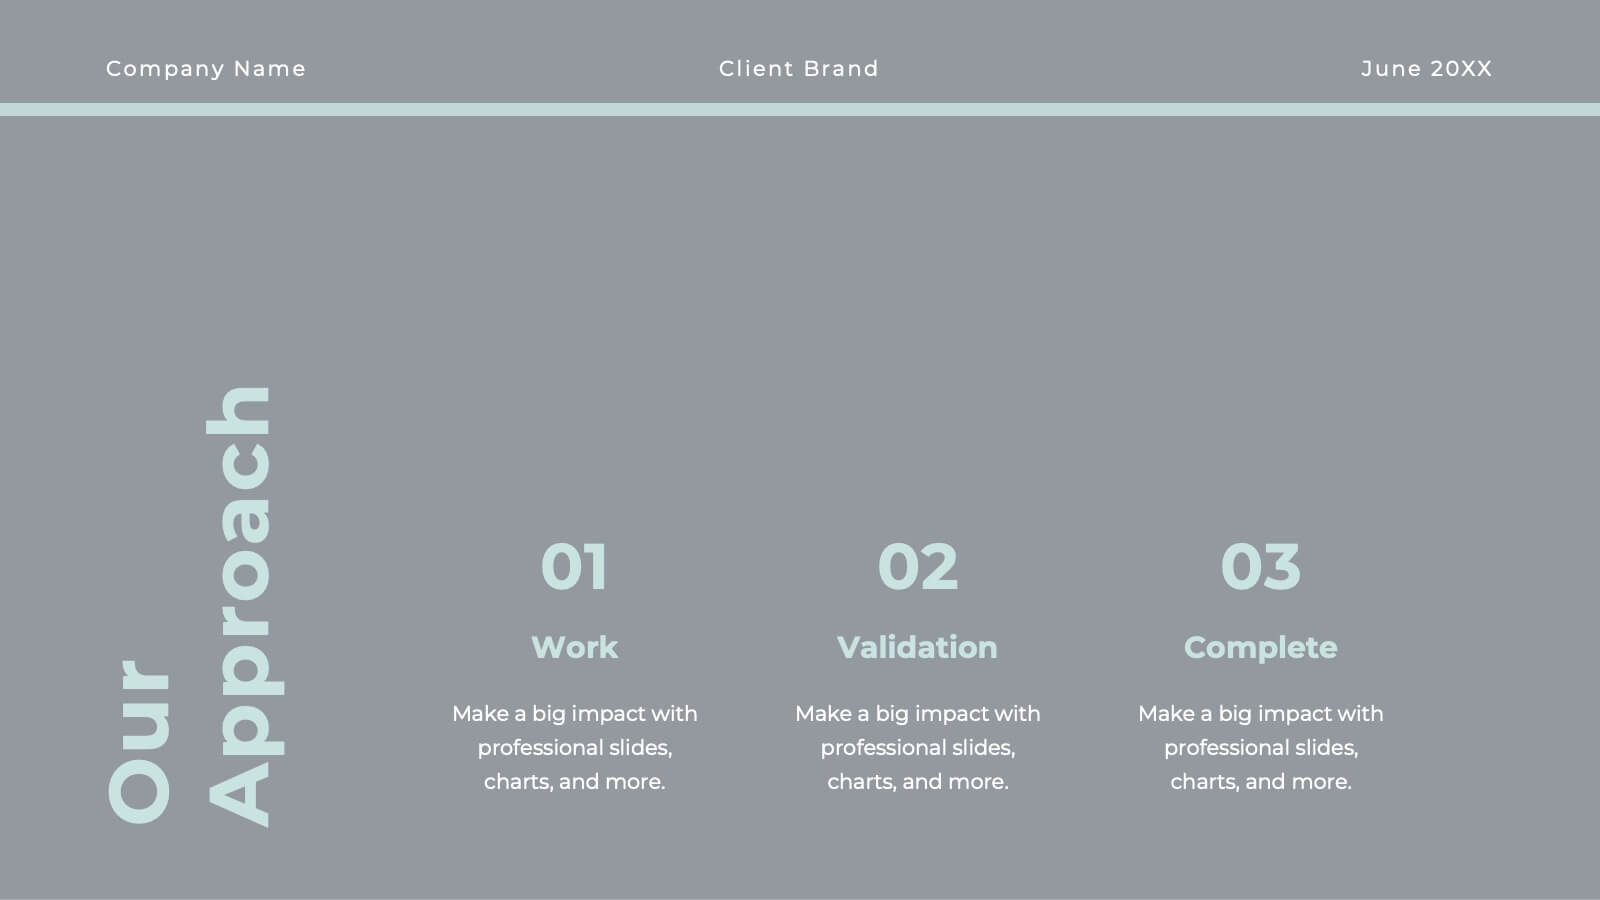
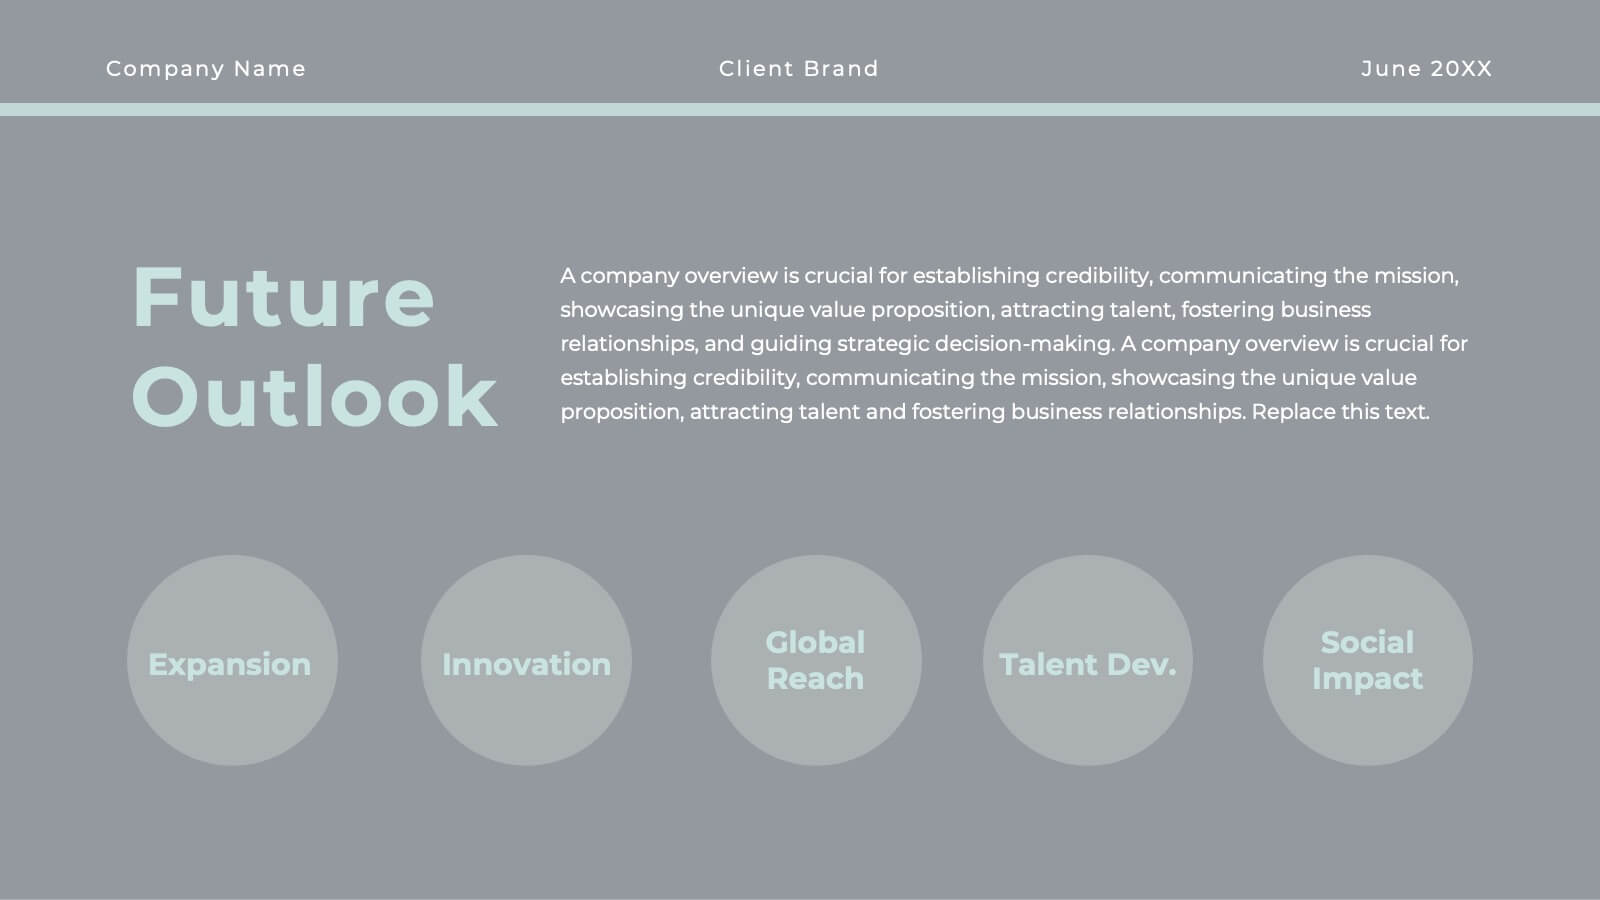
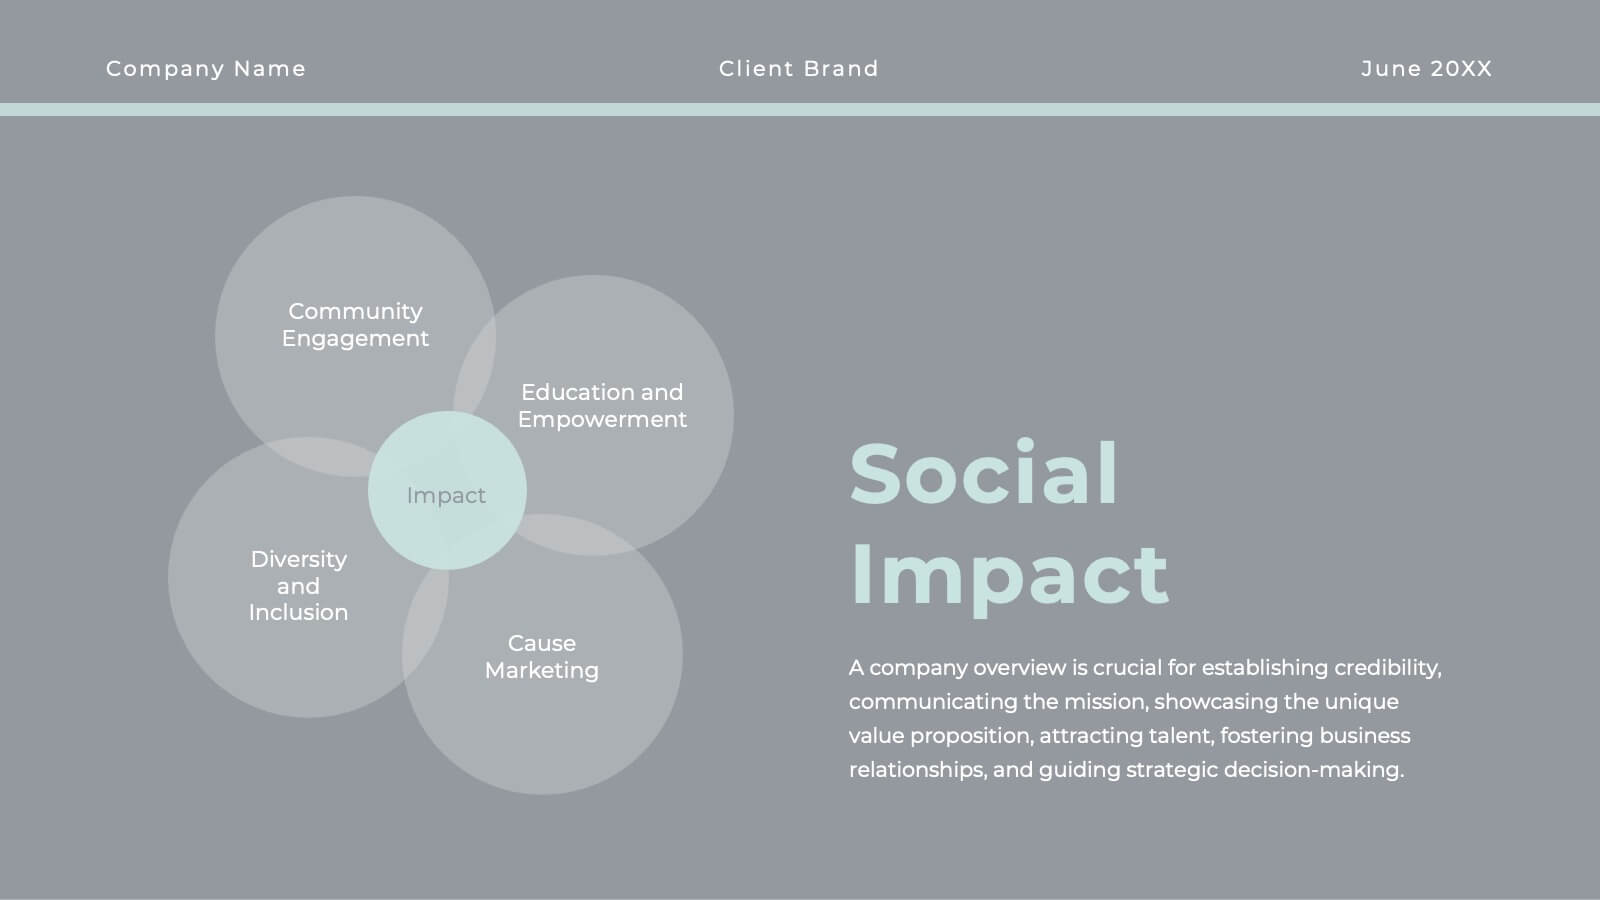
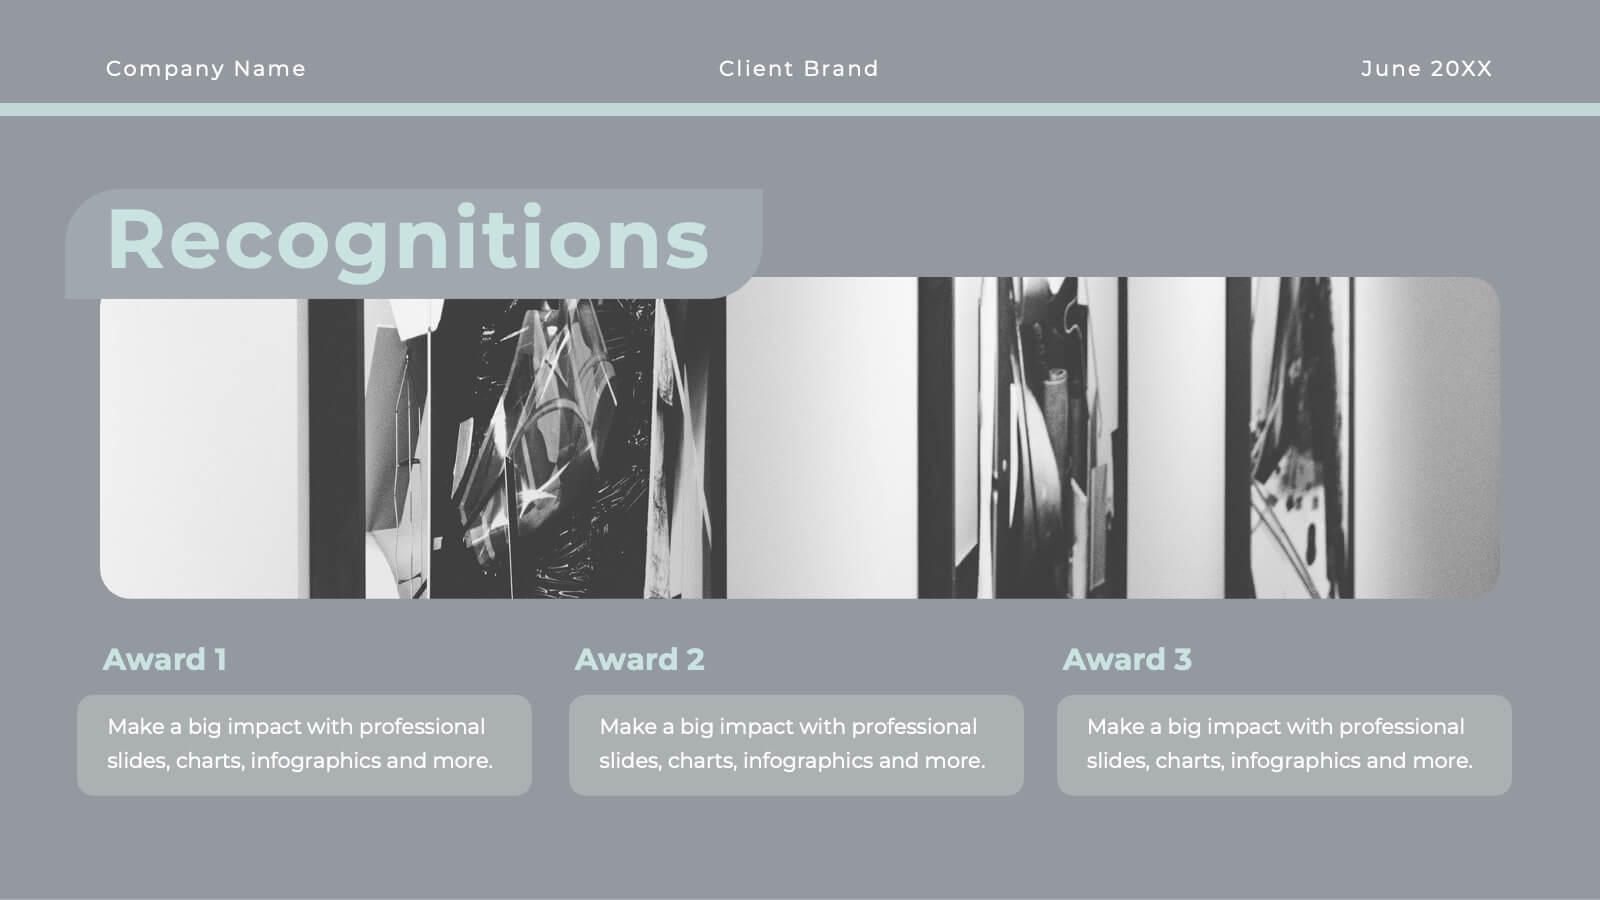
Get ready to elevate your agency’s game with a proposal template that’s as polished as your services! This sleek and sophisticated design is crafted to make a lasting impression on your clients and partners. From introducing your team’s expertise to showcasing successful case studies, every slide is meticulously designed to reflect professionalism and creativity. The clean, modern layout helps you present your market analysis, industry trends, and strategic approach with clarity and impact. With dedicated sections for client testimonials, campaign development, and partnership opportunities, this template ensures your agency’s value proposition is communicated with confidence and style. Perfectly adaptable to PowerPoint, Keynote, and Google Slides, this proposal template is your go-to tool for sealing deals and building lasting relationships. Your agency’s vision and mission will shine through in a presentation that’s both powerful and persuasive, making your proposals truly unforgettable!


5 slides
Future of 5G Technology Infographics
Embrace the telecommunications revolution with the future of 5G technology infographics template. This vibrant, creatively styled vertical layout is designed to captivate and educate, making it an ideal companion for tech enthusiasts and educators alike. The template, adorned in a dynamic spectrum of purple, orange, blue, and green, simplifies the complex narrative of 5G evolution. Compatible with Powerpoint, Keynote, and Google Slides. It features intuitive graphics, engaging icons, and image placeholders, all to highlight 5G's possibilities and its impact on global connectivity. It's the perfect medium for illustrating the sophisticated architecture.


6 slides
Problem Analysis Infographic
These slides provide a structured and aesthetically pleasing approach for detailing problem analysis within a project or organizational context. Each slide incorporates various design elements that guide the viewer through the steps or layers of the problem, allowing for a comprehensive understanding and discussion. The use of soft color palettes and clear text placement ensures that the information is easily digestible. The diverse layouts cater to different aspects of problem analysis, from bullet points to diagrammatic representations, making these templates versatile for various presentation needs. These are ideal for presenting complex information in a straightforward manner to ensure clear communication of issues and strategies within team meetings or presentations to stakeholders. The flexibility of the design also allows for easy customization to suit specific project requirements or branding needs.


8 slides
Tourism Strategy and Location Guide Presentation
Planning a strategy that inspires wanderlust? This sleek presentation template helps organize global tourism goals with location-based insights, iconic visuals, and easy-to-edit layout sections. Perfect for destination marketing, regional analysis, or travel business pitches. Fully compatible with PowerPoint, Keynote, and Google Slides for effortless editing and impactful delivery.


6 slides
Audience Targeting and Segmentation
Get to know your audience like never before with this human-centered visual layout—ideal for mapping out key segments, demographics, and targeting strategies. Great for marketing plans, user personas, or customer insights presentations, this slide keeps your data visually focused and easy to digest. Fully compatible with PowerPoint, Keynote, and Google Slides.


4 slides
Task Management Checklist Presentation
Stay organized and boost productivity with the Task Management Checklist template. This structured design helps you categorize tasks into Do’s and Don’ts, ensuring a clear workflow for efficient task execution. Fully editable and compatible with PowerPoint, Keynote, and Google Slides, making it perfect for teams and professionals alike.


7 slides
Asia Regions Map Infographic
Embark on a visual journey across the vast and diverse continent of Asia with our meticulously crafted map infographic. Painted in the cultural richness of red, the depth of blue, and the clarity of white, our template captures the essence of Asia in all its glory. Adorned with pinpoint infographics, symbolic icons, and region-specific image placeholders, it serves as a comprehensive guide to Asia's multifaceted landscape. Impeccably designed for Powerpoint, Keynote, or Google Slides. An indispensable resource for educators, travelers, researchers, or businesses venturing into the Asian market. Explore with purpose; let every slide be a step into Asia's vibrant tapestry.


4 slides
Three-Part Triangle Model Presentation
Show the perfect balance between three core ideas with this dynamic triangular layout. Designed for clarity and structure, it’s ideal for visualizing strategies, models, or relationships in a professional way. Fully editable and compatible with PowerPoint, Keynote, and Google Slides for effortless customization and polished results.


22 slides
Dakota Corporate Strategy Agenda Presentation
Maximize your strategic sessions with this dynamic corporate strategy agenda presentation template. This template is designed to streamline your business discussions, featuring sections for everything from speaker introductions to session overviews and networking breaks. It’s ideal for conferences, workshops, or any corporate gatherings where a clear, structured schedule is essential. Compatible with major platforms like PowerPoint, Google Slides, and Keynote, it ensures you can organize and execute your agenda efficiently, fostering effective communication and collaboration across your team.


6 slides
Market Growth Strategy with Asia Map Presentation
Visualize strategic growth across Asian markets with this map-based presentation. Highlight regions by opportunity level, compare metrics with vertical bar charts, and display yearly projections. Ideal for business development, expansion plans, or market analysis. Fully editable in PowerPoint, Keynote, and Google Slides for tailored, data-driven presentations.


7 slides
South America Infographic Presentation Template
South America is the fourth largest continent in size and the fifth largest in population. It is located primarily in the southern hemisphere, situated between the Pacific and Atlantic Oceans, with mostly colonies on other continents. South America is a continent entirely in the Western Hemisphere, mostly in the Southern Hemisphere. This South America map template is a great base for lesson plans, reference guides and much more. This map template is fully editable and can be easily customized to suit your presentation needs, add multiple layers of text, pictures and various other features.


2 slides
Weekly Agenda Presentation
Keep your week running smoothly with a clean, organized layout that highlights priorities, tasks, and key reminders at a glance. This presentation makes planning effortless, helping teams stay aligned and focused throughout the week. Ideal for meetings, schedules, and productivity workflows. Fully compatible with PowerPoint, Keynote, and Google Slides.


4 slides
Segmented Metrics Pie Chart Overview Presentation
Present your performance data with precision using the Segmented Metrics Pie Chart Overview Presentation. This clean and modern slide design features a donut-style pie chart divided into clearly marked percentage segments, ideal for showcasing metric distribution, KPI breakdowns, or analytical summaries. Each slice is color-coded and paired with editable labels and icons, making complex data easy to digest at a glance. Perfect for business reviews, dashboards, or investor updates. Fully compatible with PowerPoint, Keynote, and Google Slides for effortless customization.


26 slides
Leadership and Management Skills Presentation
Elevate your leadership and management training with a presentation template that's as organized and efficient as it is visually appealing. The design is tailored for clarity, with a clean, contemporary layout that speaks to professionals eager to enhance their skills. Each slide is crafted with purpose, using a smart blend of graphics and space to highlight key concepts in leadership and management. This template includes a variety of slides to cover all training aspects: from the core qualities of a leader to the intricacies of team management. Graphs and charts provide a clear representation of management theories, while comparison slides help illustrate different leadership styles. Whether for a corporate training session, a workshop for budding entrepreneurs, or a classroom lecture, this set is ready for use in PowerPoint, Keynote, and Google Slides, making it a valuable tool for any leadership development program.


6 slides
Tactical Planning for Clear Objectives Presentation
Break down your action plan with this Tactical Planning for Clear Objectives slide. Using a simple A–E step structure paired with a lightbulb visual, this layout helps present business goals or strategy stages clearly and engagingly. Easily customize it in PowerPoint, Google Slides, or Canva to fit your content.