


Features
- 26 Unique slides
- Fully editable and easy to edit in Microsoft Powerpoint, Keynote and Google Slides
- 16:9 widescreen layout
- Clean and professional designs
- Export to JPG, PDF or send by email.


Do you have any questions?
Recommend


6 slides
Porter's Five Forces Strategy Presentation
Give your competitive analysis a bold, intuitive flow with a clean layout that visually breaks down each force in a simple, strategic way. This presentation helps you highlight market pressures, evaluate risks, and support smarter decision-making with clarity and confidence. Fully editable and compatible with PowerPoint, Keynote, and Google Slides.


22 slides
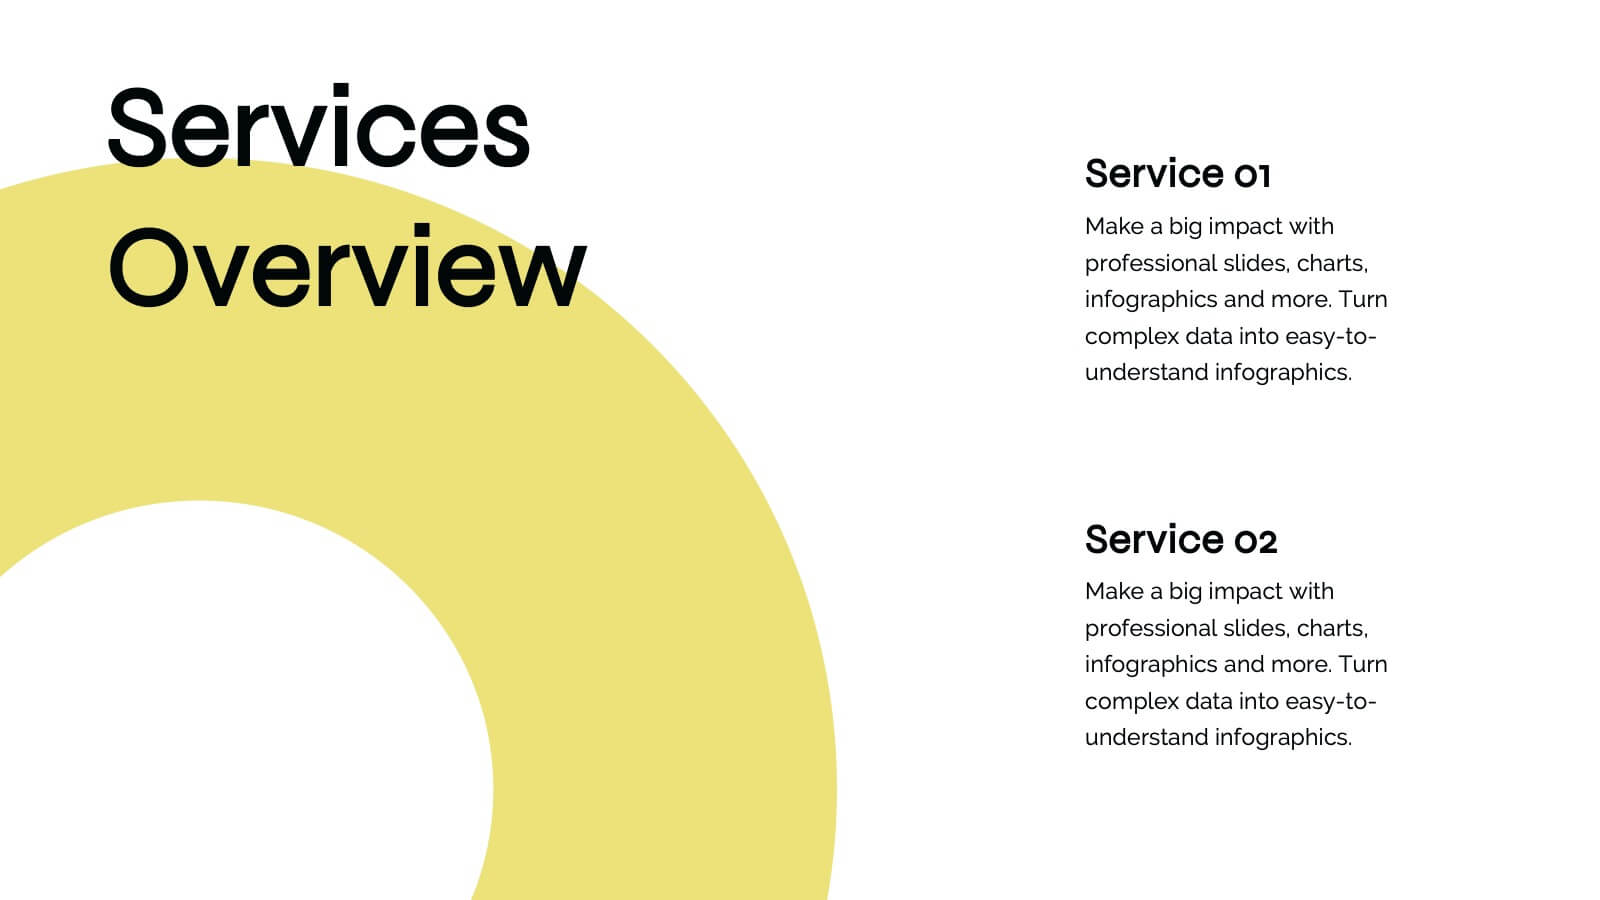
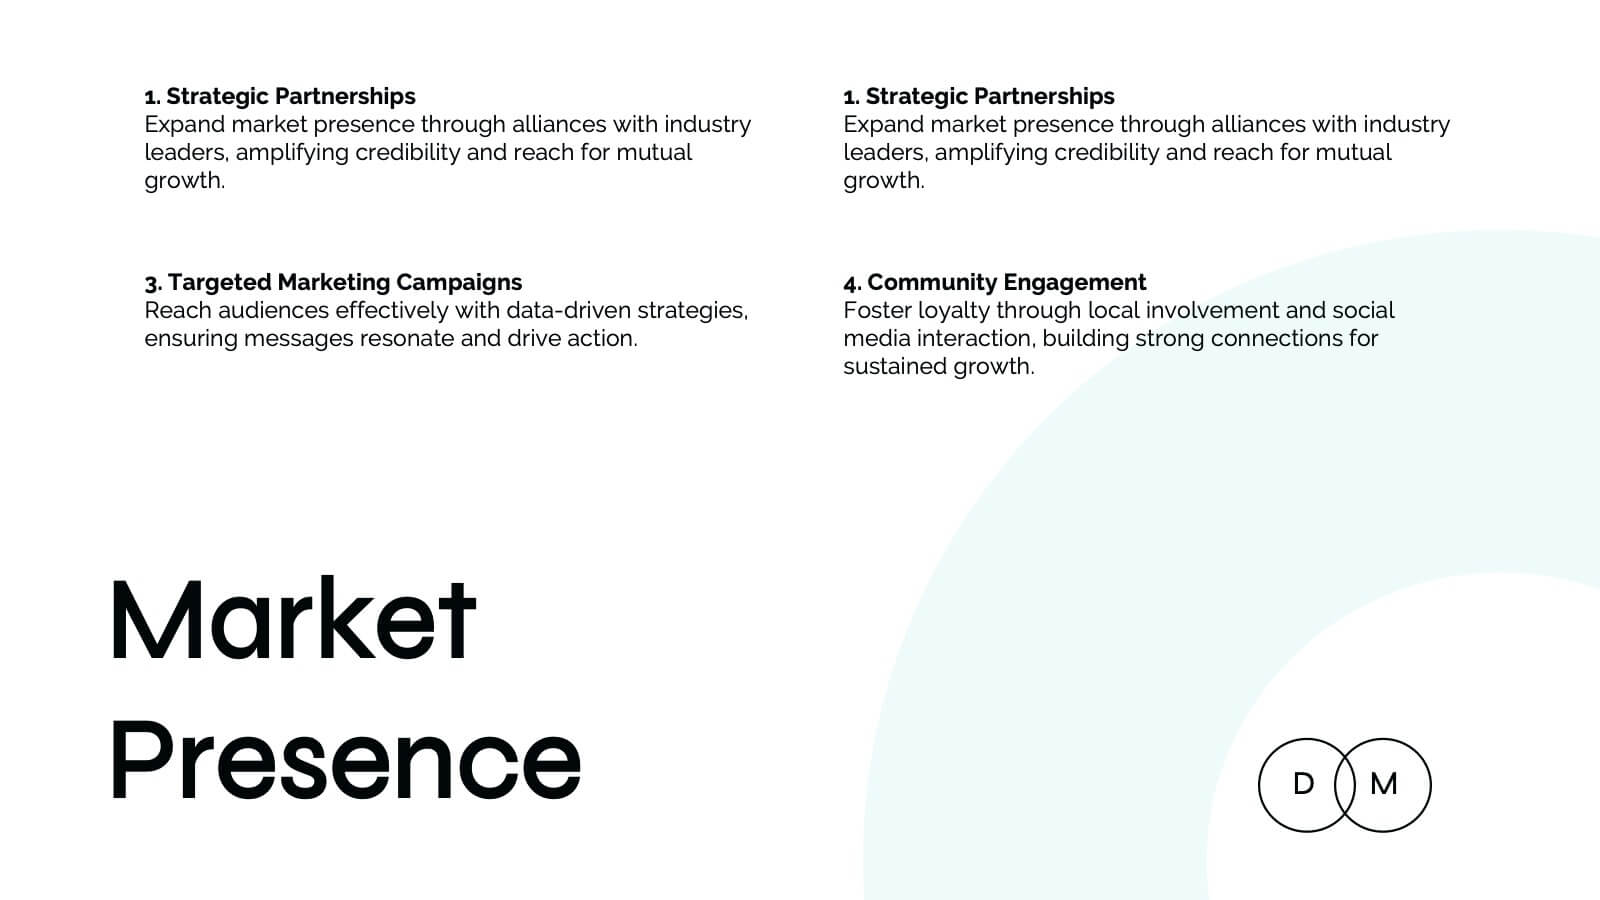
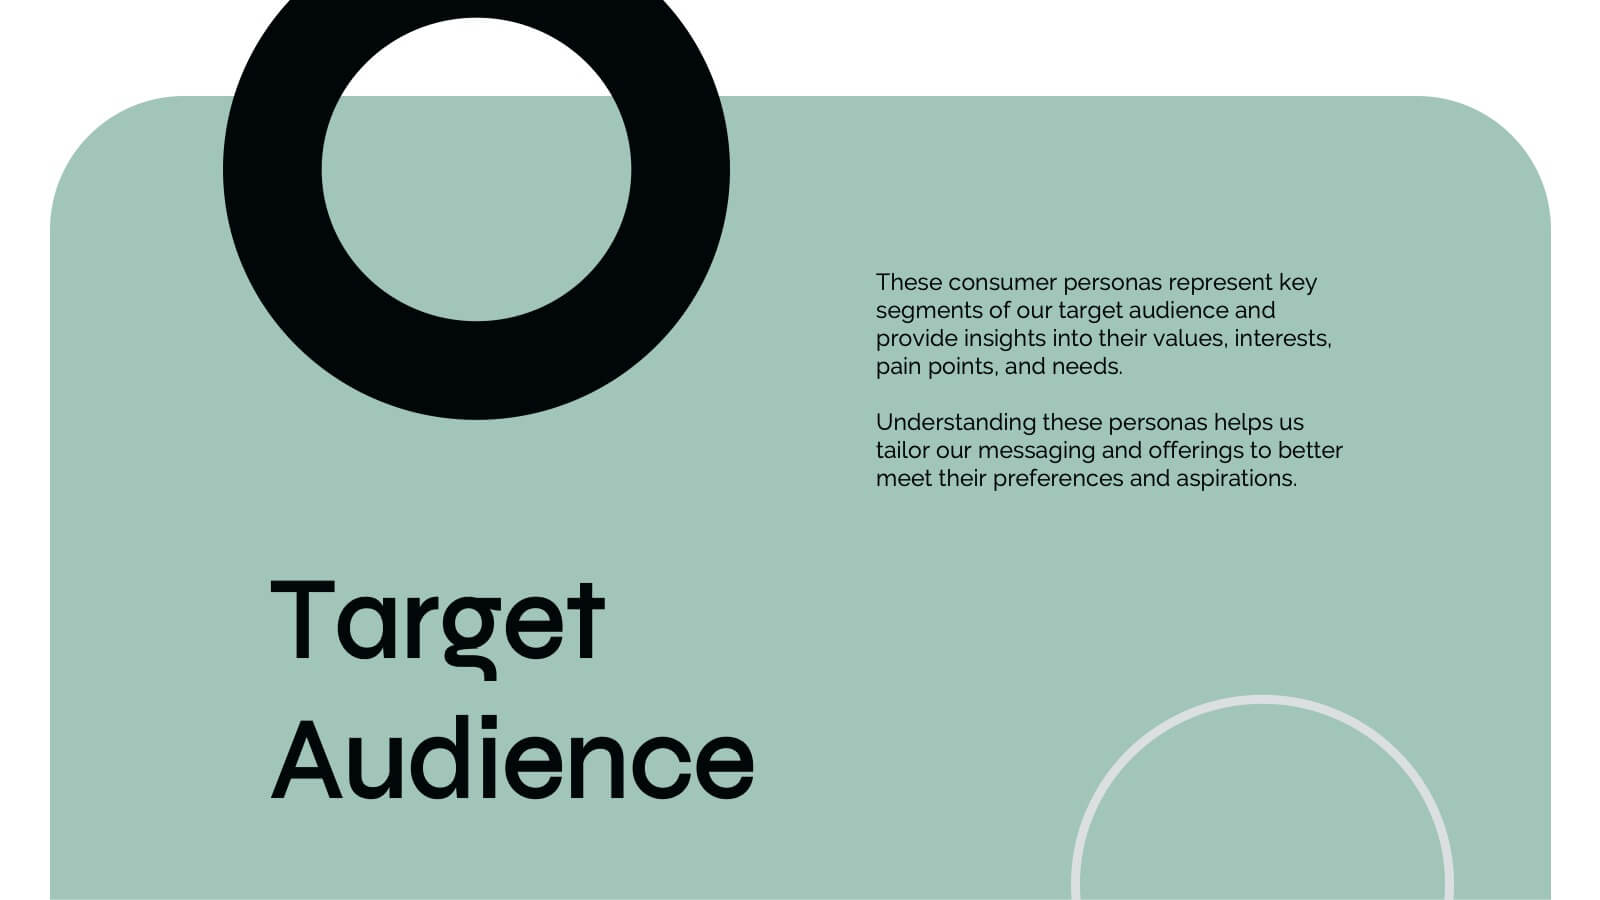
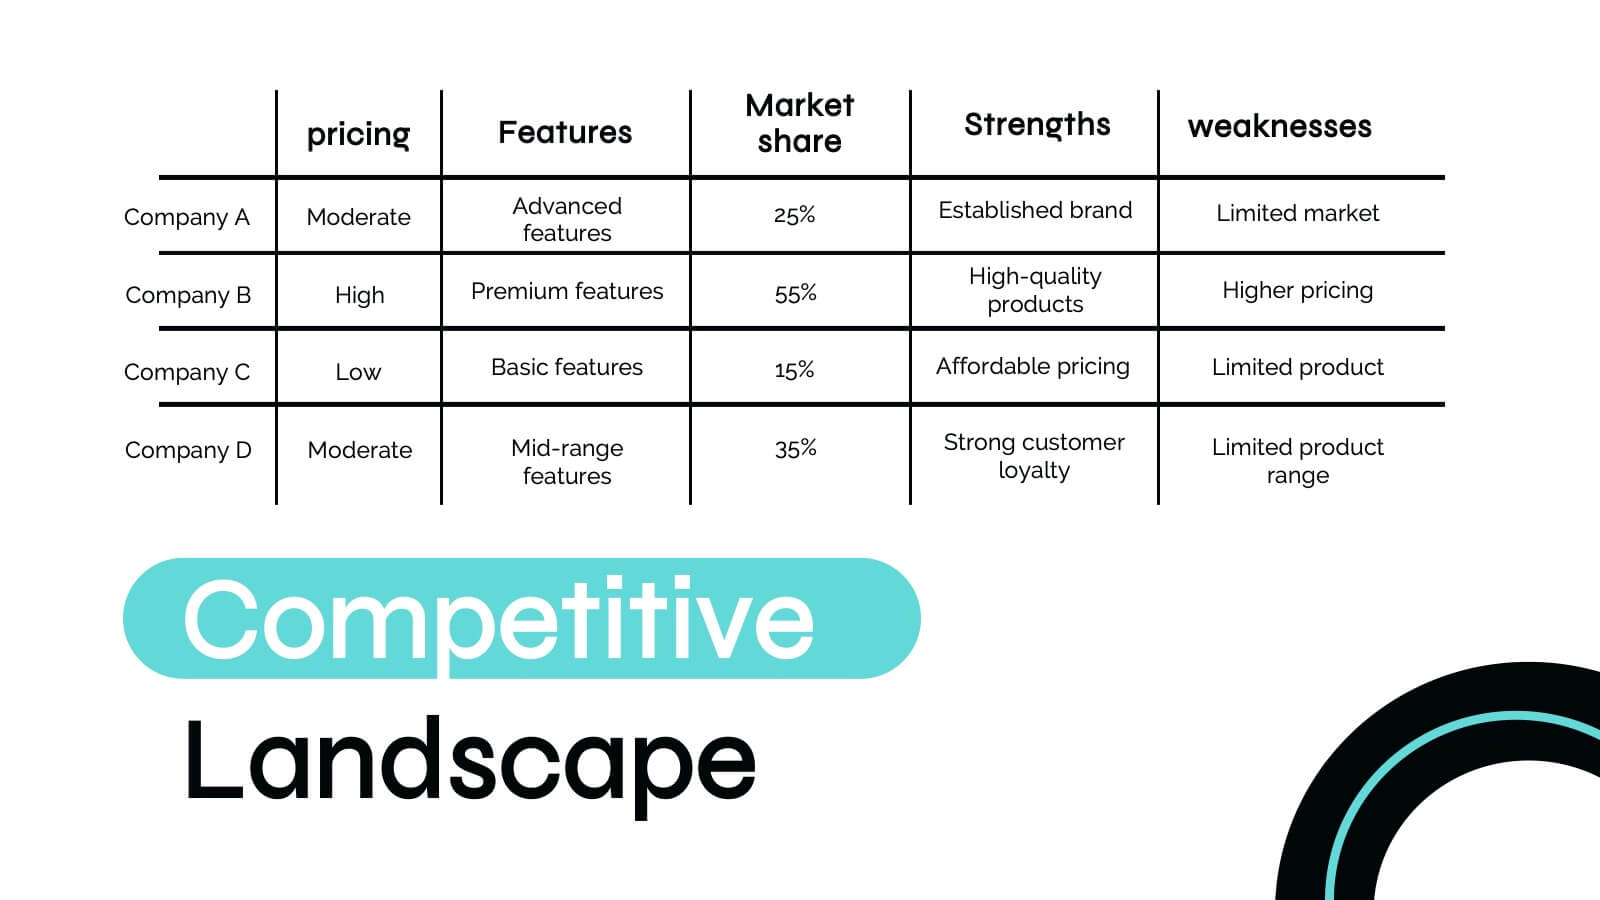
Hercules Digital Marketing Strategy Plan Presentation
Ignite your next marketing presentation with this bold, dynamic template that showcases every key element of your marketing strategy! From company history and target audience insights to competitive landscape analysis, this design makes presenting your marketing message a breeze. Perfect for professionals, it’s fully compatible with PowerPoint, Keynote, and Google Slides for seamless usage across platforms.


13 slides
Organizational Company Profile Presentation
Elevate your business overview with this straightforward Company Profile template. The opening slide announces the essence of your business, preparing the audience for a journey through your organizational landscape. Structured to highlight the key areas of your business, the template includes an 'About Us' section, laying out your mission and vision. Learn about the dedicated team behind the success with the 'Meet Our Team' slide, providing a personal touch to your corporate identity. Set clear, achievable goals with a slide dedicated to outlining your short-term and long-term objectives. Engage your audience with a 'Business Facts' slide that provides tangible insights into your company's performance. Finally, the 'Contact Us' slide offers a clear invitation for further dialogue, fostering potential partnerships. Ideal for those searching for a comprehensive yet accessible company presentation, this template is designed to convey your business strengths and opportunities effectively.


4 slides
Market Research Case Study Presentation
Present compelling data insights with the Market Research Case Study Presentation template. Designed for structured storytelling, this template visually maps out research findings, trends, and key takeaways to support data-driven decisions. Perfect for marketing reports, business strategies, and competitive analysis, it’s fully customizable and compatible with PowerPoint, Keynote, and Google Slides.


8 slides
Large-Scale Data Processing Tools Presentation
Simplify the complexity of data processing with this sleek and modern template for mapping large-scale tools and systems. Ideal for tech teams, data analysts, and IT professionals, this slide helps you explain how data flows through cloud-based infrastructures. Fully customizable and compatible with PowerPoint, Keynote, and Google Slides.


4 slides
Revenue and Expense Forecasting Overview Presentation
Easily illustrate financial trade-offs with the Revenue and Expense Forecasting Overview Presentation. This clean, visual slide design features a seesaw-style balance graphic to help communicate proportional budgeting between revenue, balance, and expenses. Ideal for finance updates, annual reports, and planning meetings. Fully editable in PowerPoint, Google Slides, Keynote, and Canva.


5 slides
Big Data Interpretation and Metrics Presentation
Break down complex data into digestible segments with the Big Data Interpretation and Metrics Presentation. Featuring a puzzle-inspired layout, this template is ideal for illustrating interconnected data points, analytics strategies, or metric-based frameworks. Fully customizable in PowerPoint, Keynote, and Google Slides.


7 slides
PESTEL Framework Business Presentation
The "PESTEL Framework Business" presentation effectively utilizes a segmented color scheme to categorize different environmental factors impacting business strategy: Political, Economic, Social, Technological, Environmental, and Legal. Each segment is color-coded and designated space for text, making it easy to highlight how each factor can influence business operations and decision-making processes. This visual arrangement not only aids in easy comprehension but also allows for a systematic review of external factors, essential for strategic planning.


6 slides
Leadership and Business Teamwork Presentation
Drive results through synergy with this dynamic Leadership and Business Teamwork presentation slide. Designed with a six-part segmented pie chart, this layout helps visualize collaborative frameworks, team roles, or leadership models in an engaging way. Ideal for team workshops, leadership development, or strategic planning meetings. Easy to personalize in PowerPoint, Keynote, or Google Slides.


21 slides
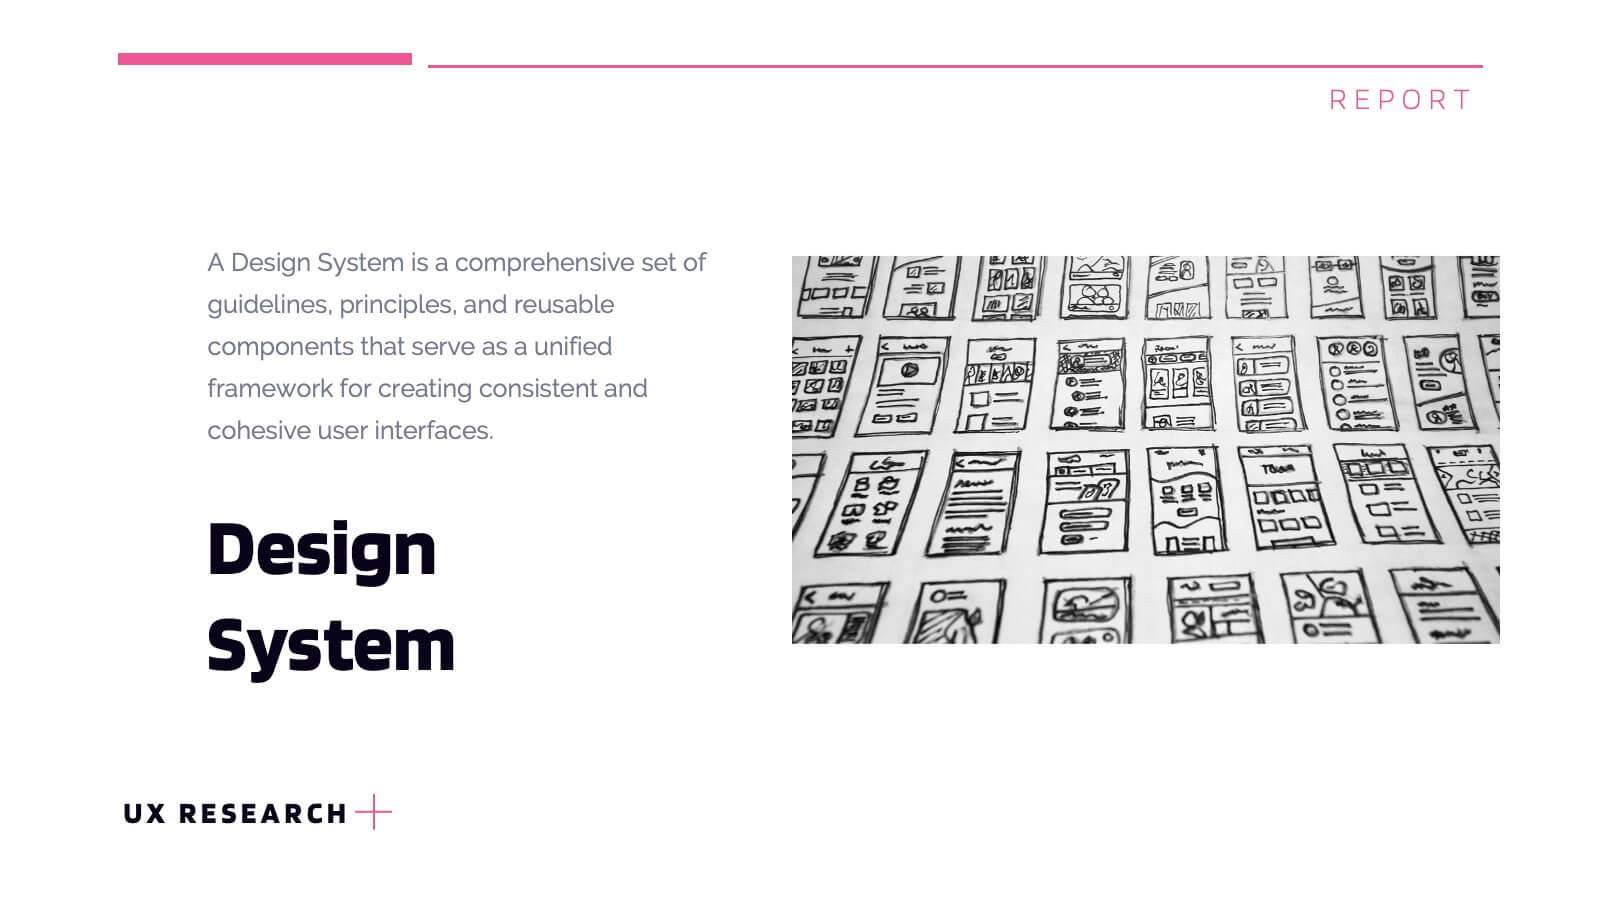
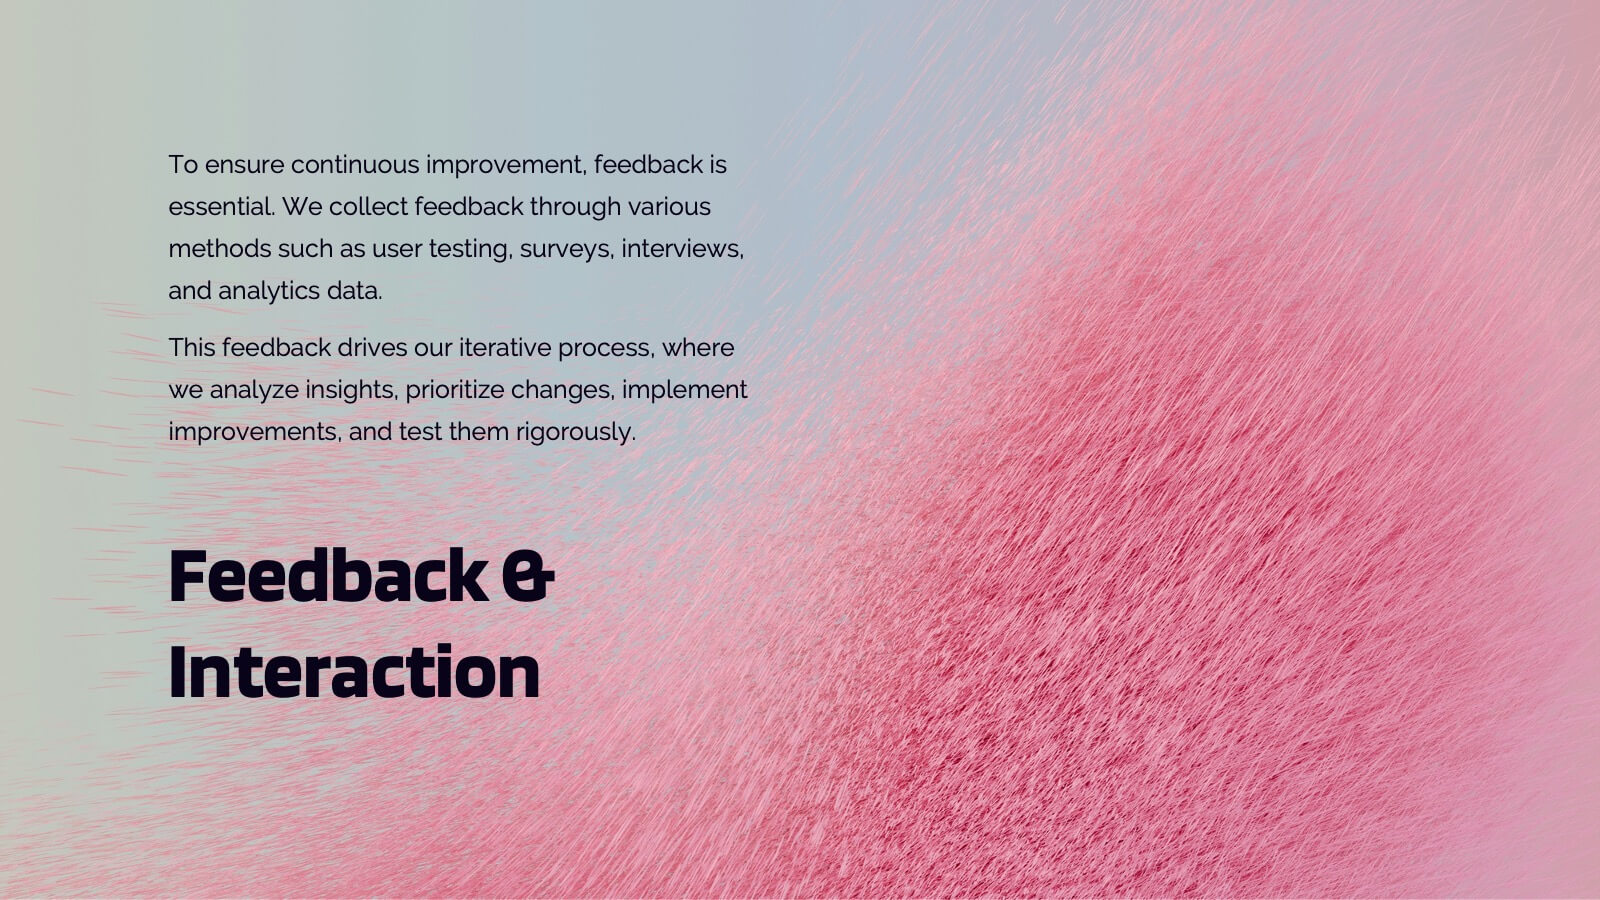
Lumascend UX Research Report Presentation
Present your UX research findings with clarity using this engaging and organized template! Covering key areas like user personas, wireframes, testing, and interaction design, it ensures all aspects of your design process are communicated effectively. Perfect for UX teams, stakeholders, or client presentations, this template works seamlessly with PowerPoint, Keynote, and Google Slides.


21 slides
Luminor Project Timeline Presentation
Stay on track and achieve your goals with this dynamic project timeline presentation template. It provides a clear structure to outline key milestones, objectives, budget breakdown, risk management, and resource allocation, ensuring seamless project execution. The modern and professional design enhances communication with stakeholders and team members alike. Fully customizable and compatible with PowerPoint, Keynote, and Google Slides.


6 slides
World Market Presence and Expansion Map Presentation
Showcase your company’s global footprint with this World Market Presence and Expansion Map. Visually highlight key regions, market activity, or strategic territories. Perfect for investor decks, global overviews, or international growth strategies. Fully editable in PowerPoint, Keynote, and Google Slides for seamless integration into your professional presentation workflow.


4 slides
Property Investment Pitch Deck Presentation
Impress investors with a sleek and confident presentation designed to highlight property opportunities and market growth. This professional layout helps you showcase financial insights, projections, and investment strategies with clarity and style. Fully customizable and compatible with PowerPoint, Keynote, and Google Slides for effortless editing and impactful delivery.


22 slides
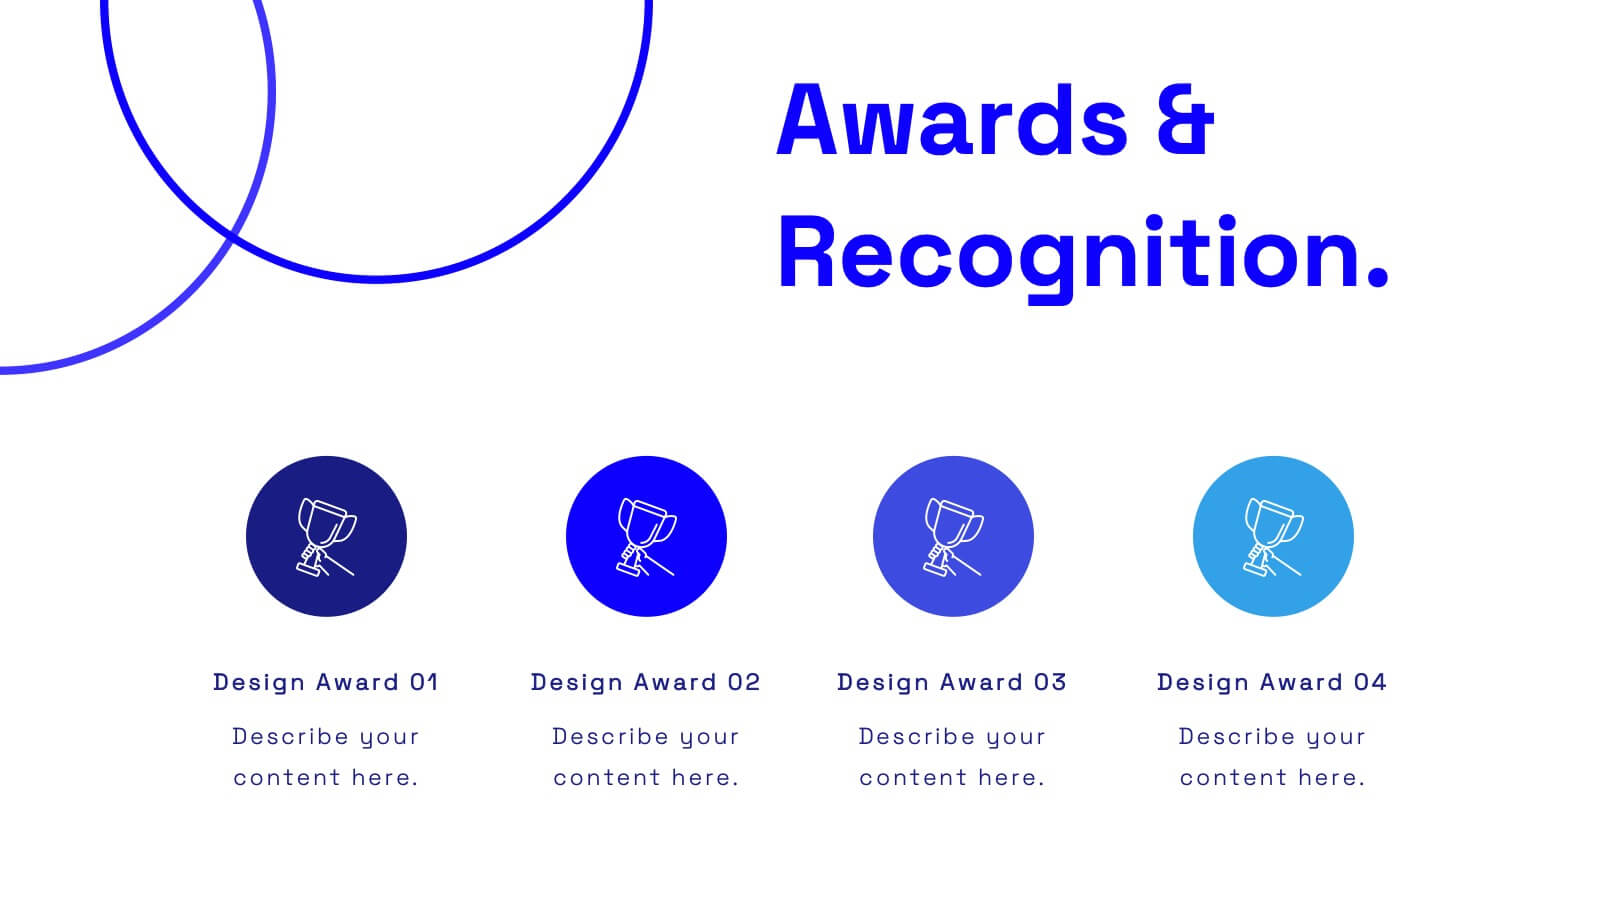
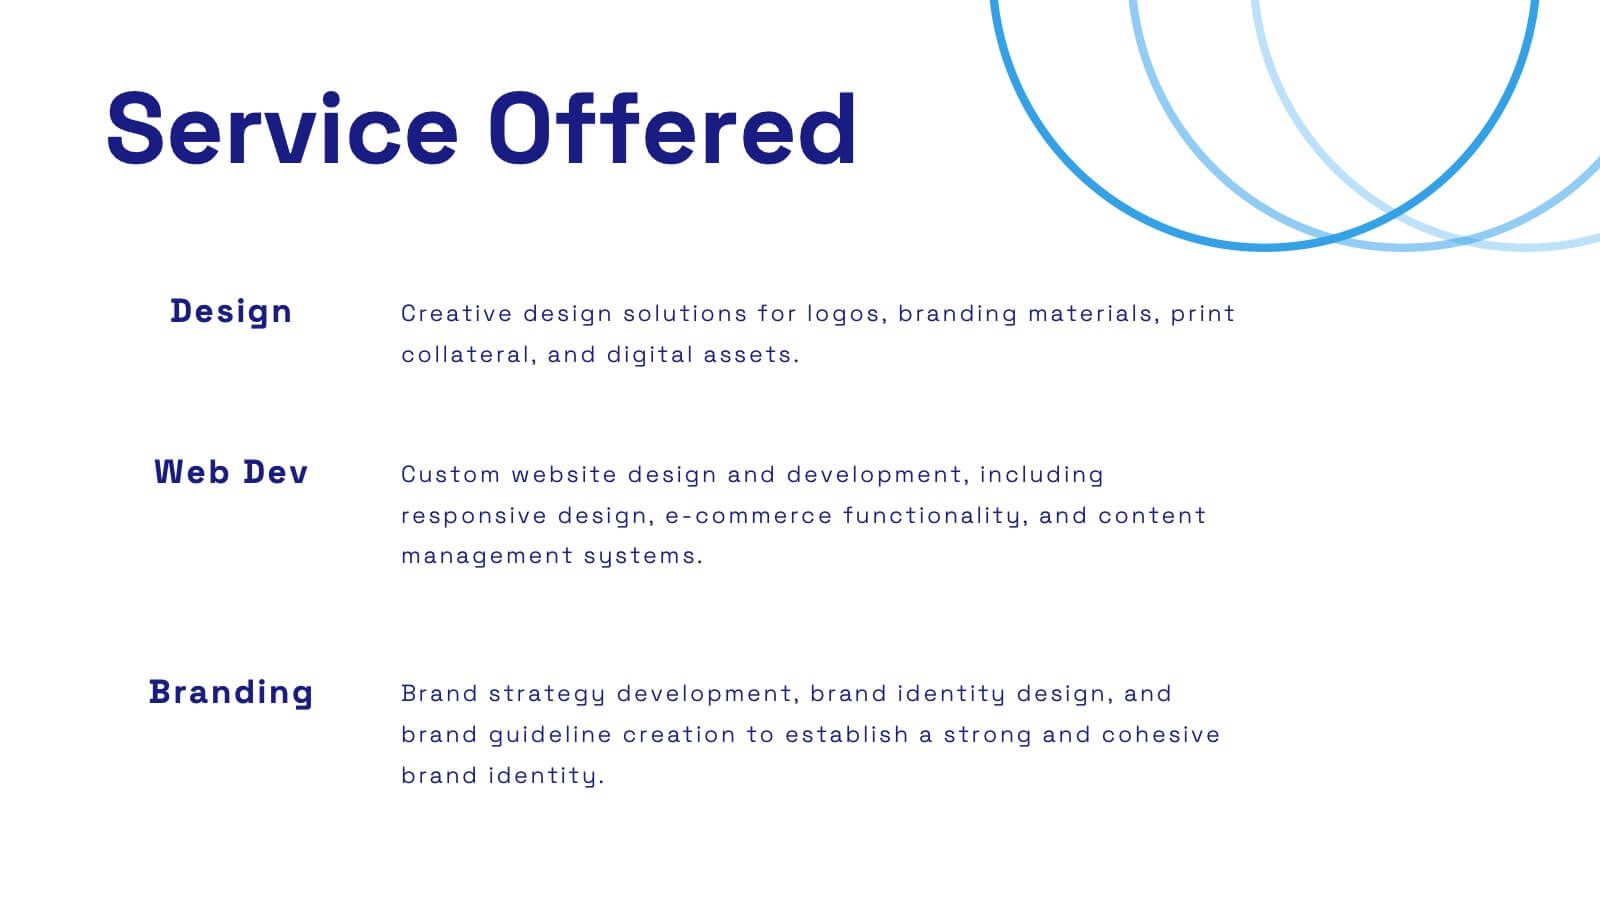
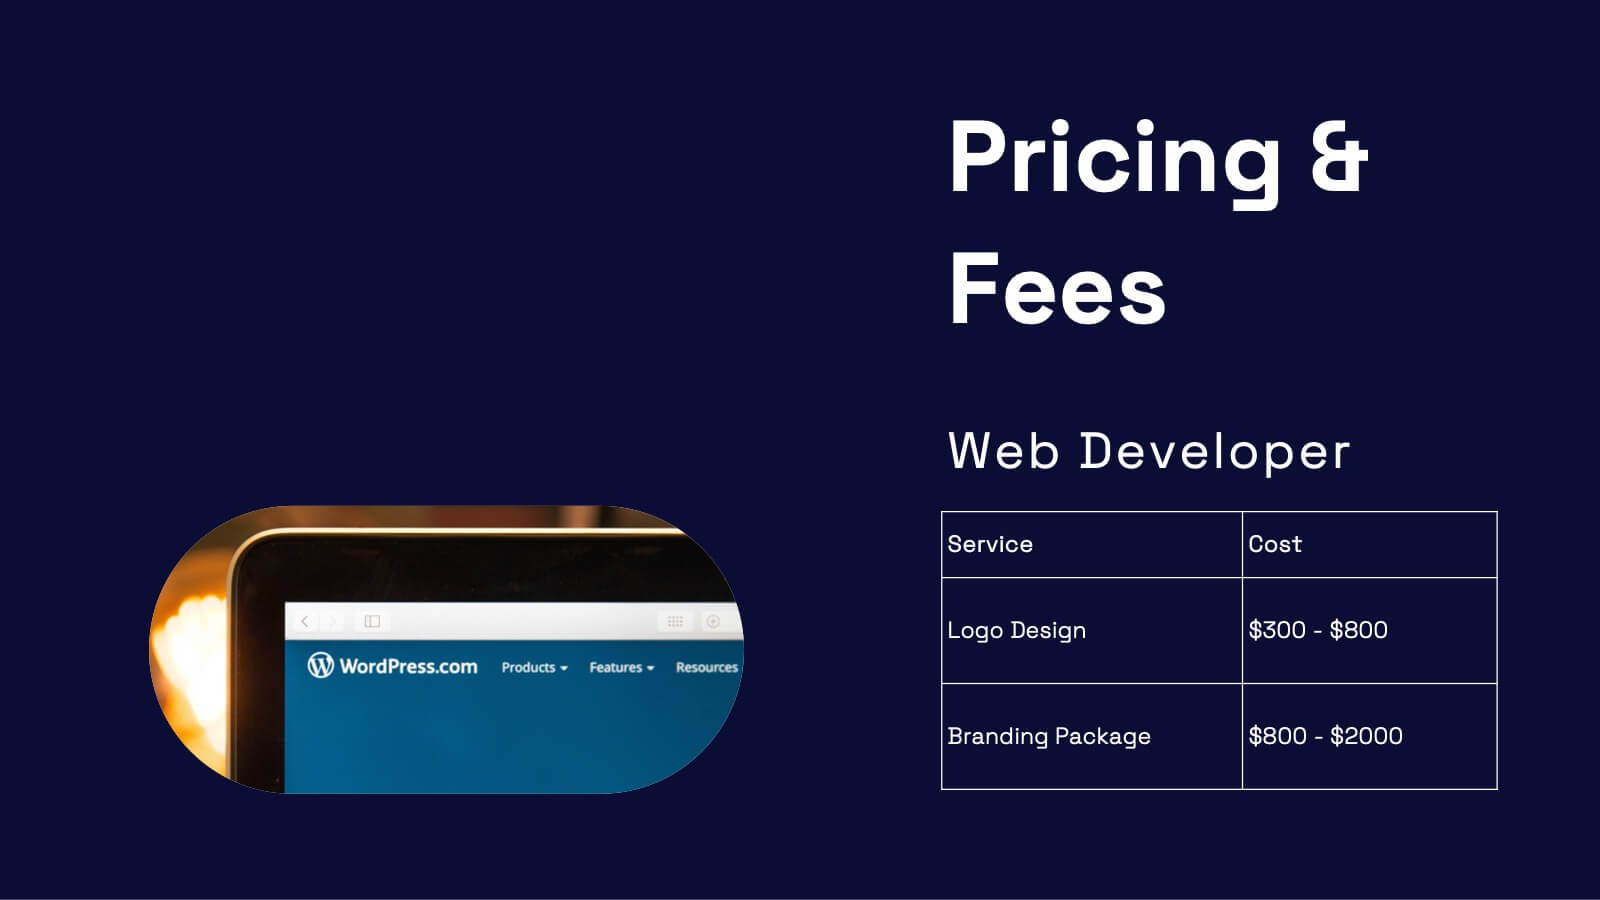
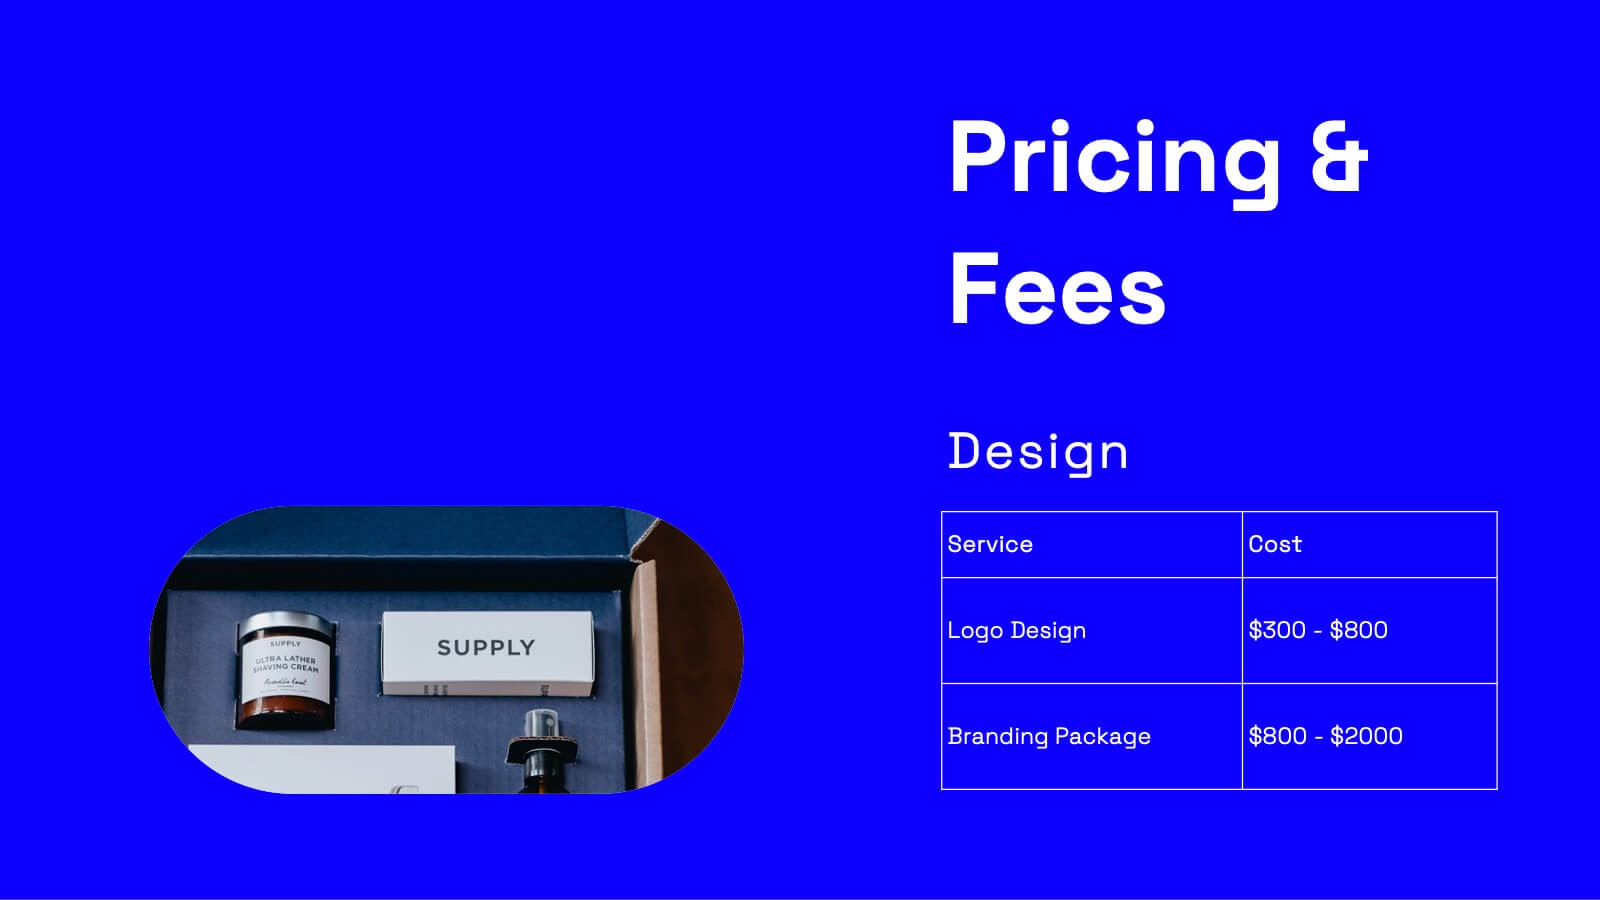
Wanderer Professional Portfolio Showcase Presentation
Showcase your creative work with this sleek, modern portfolio template. Perfect for highlighting your projects, philosophy, and client testimonials, it features a professional design with a dynamic layout. Display your awards, services offered, and pricing clearly to impress potential clients. Compatible with PowerPoint, Keynote, and Google Slides, it ensures seamless presentations on any platform.


6 slides
Strategy Planning with Business Model Canvas Presentation
Streamline your strategy planning with this Business Model Canvas template. Designed to help entrepreneurs, business owners, and teams outline key business elements, this slide organizes essential components like value propositions, customer segments, revenue streams, and cost structures. Fully editable in PowerPoint, Keynote, and Google Slides, allowing seamless customization to match your branding and business needs.


6 slides
SEO Ads and Social Media Planning Presentation
Boost your online presence with the SEO, Ads, and Social Media Planning Presentation. This layout features engaging iconography and a central post mockup to highlight content strategy, paid advertising, engagement metrics, and platform-specific insights. Ideal for marketing teams and campaign proposals. Fully editable in PowerPoint, Keynote, and Google Slides.
5 slides
Project Progress Milestones Tracker Presentation
Stay on track and make timelines shine with this clean, visual layout. This template helps you clearly showcase task progress, deadlines, and deliverables over time—perfect for project updates, team planning, or stakeholder reporting. Fully editable and easy to use in PowerPoint, Keynote, and Google Slides for seamless collaboration.