


Features
- 7 Unique slides
- Fully editable and easy to edit in Microsoft Powerpoint, Keynote and Google Slides
- 16:9 widescreen layout
- Clean and professional designs
- Export to JPG, PDF or send by email


Do you have any questions?
Recommend


7 slides
Bowtie Chart for Threat Mitigation Presentation
Visualize and mitigate threats with precision using the Bowtie Chart for Threat Mitigation Presentation. This structured layout highlights risks, controls, and consequences in a mirrored bowtie format—perfect for safety planning, compliance, and risk assessment. Fully customizable in Canva, PowerPoint, Google Slides, and Keynote for seamless integration into your workflow.


6 slides
Future Trends in 5G Connectivity Presentation
Showcase the evolving landscape of mobile innovation with this modern 5G trends infographic. Featuring a central smartphone graphic and five vertically aligned icons, this slide is perfect for highlighting connectivity advancements, industry shifts, and upcoming opportunities. Color-coded markers enhance clarity for presentations on telecom, IoT, smart cities, and emerging tech. Fully editable in PowerPoint, Keynote, and Google Slides.


20 slides
Ascent Design Strategy Proposal Presentation
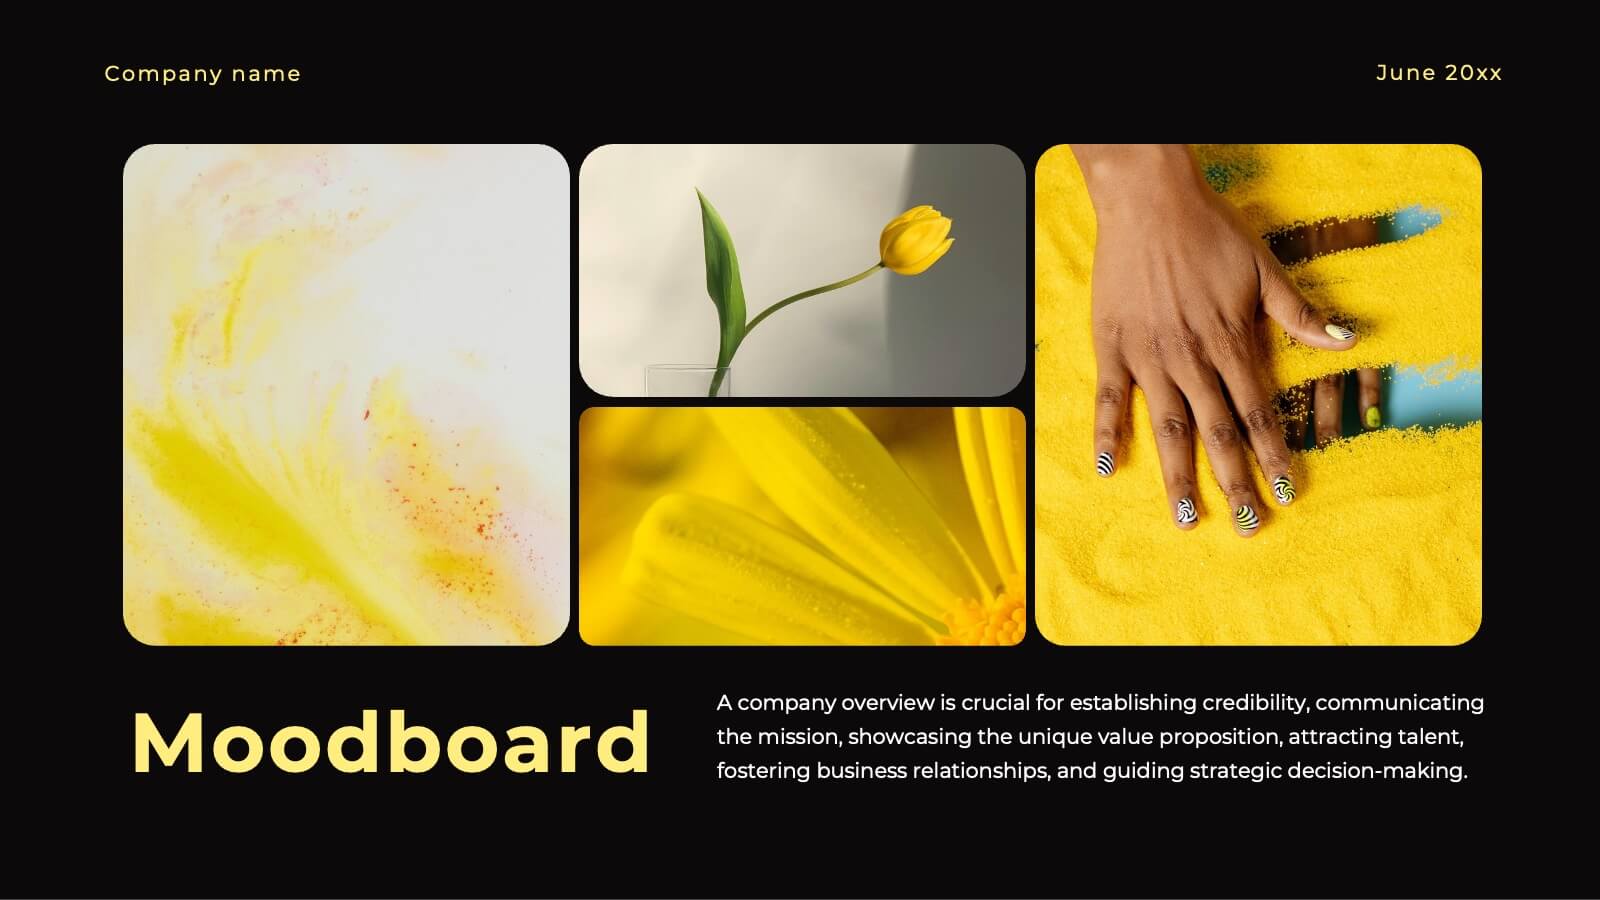
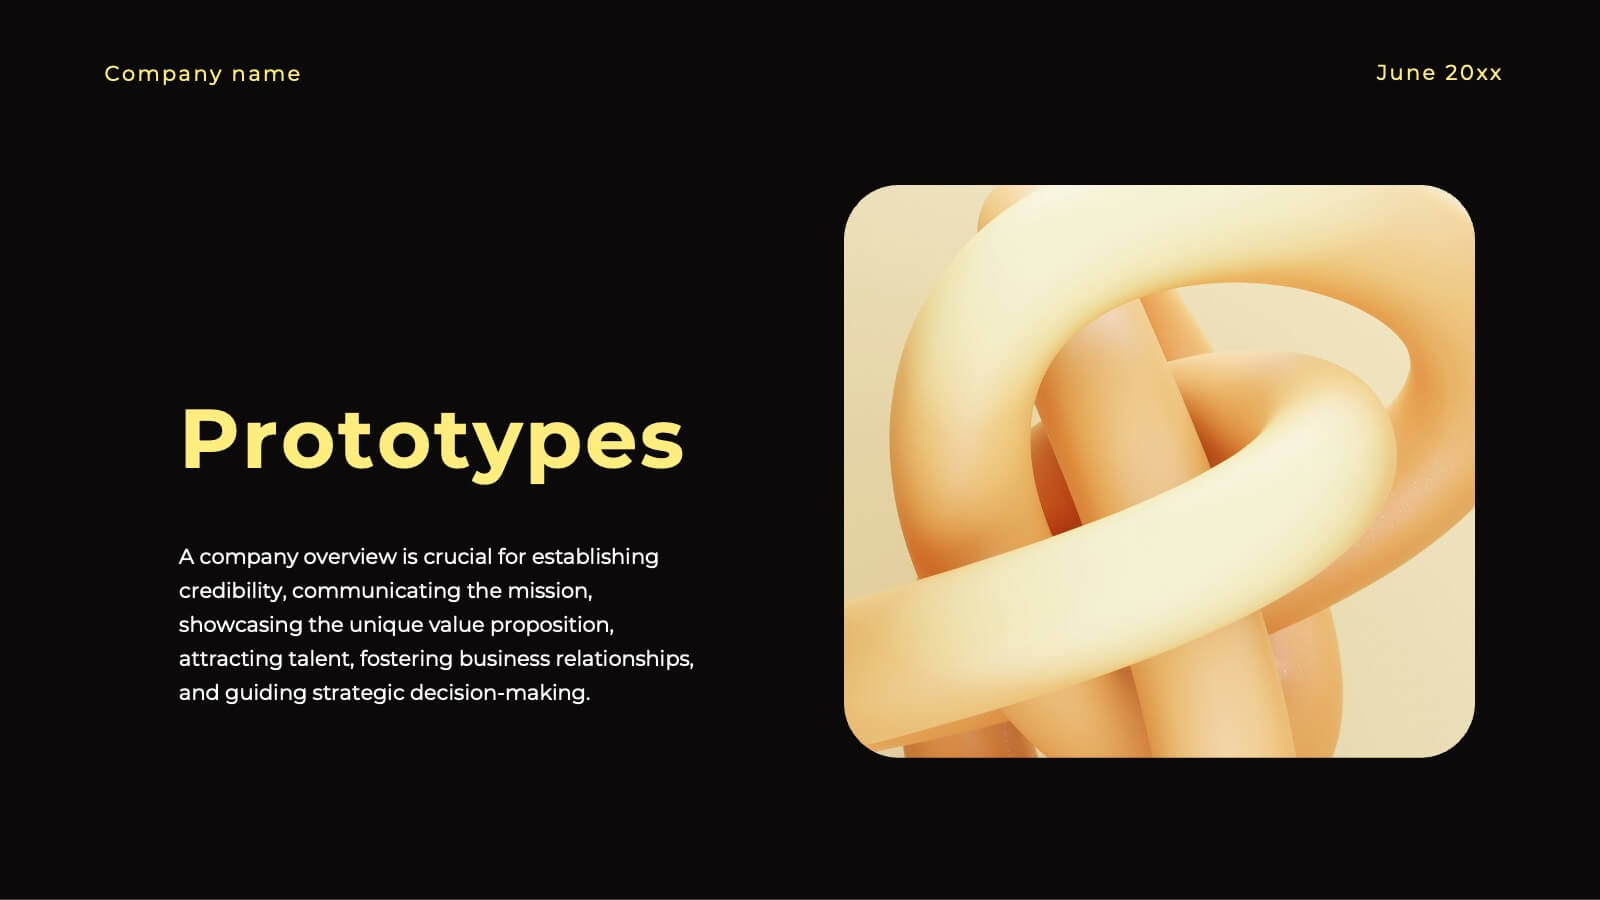
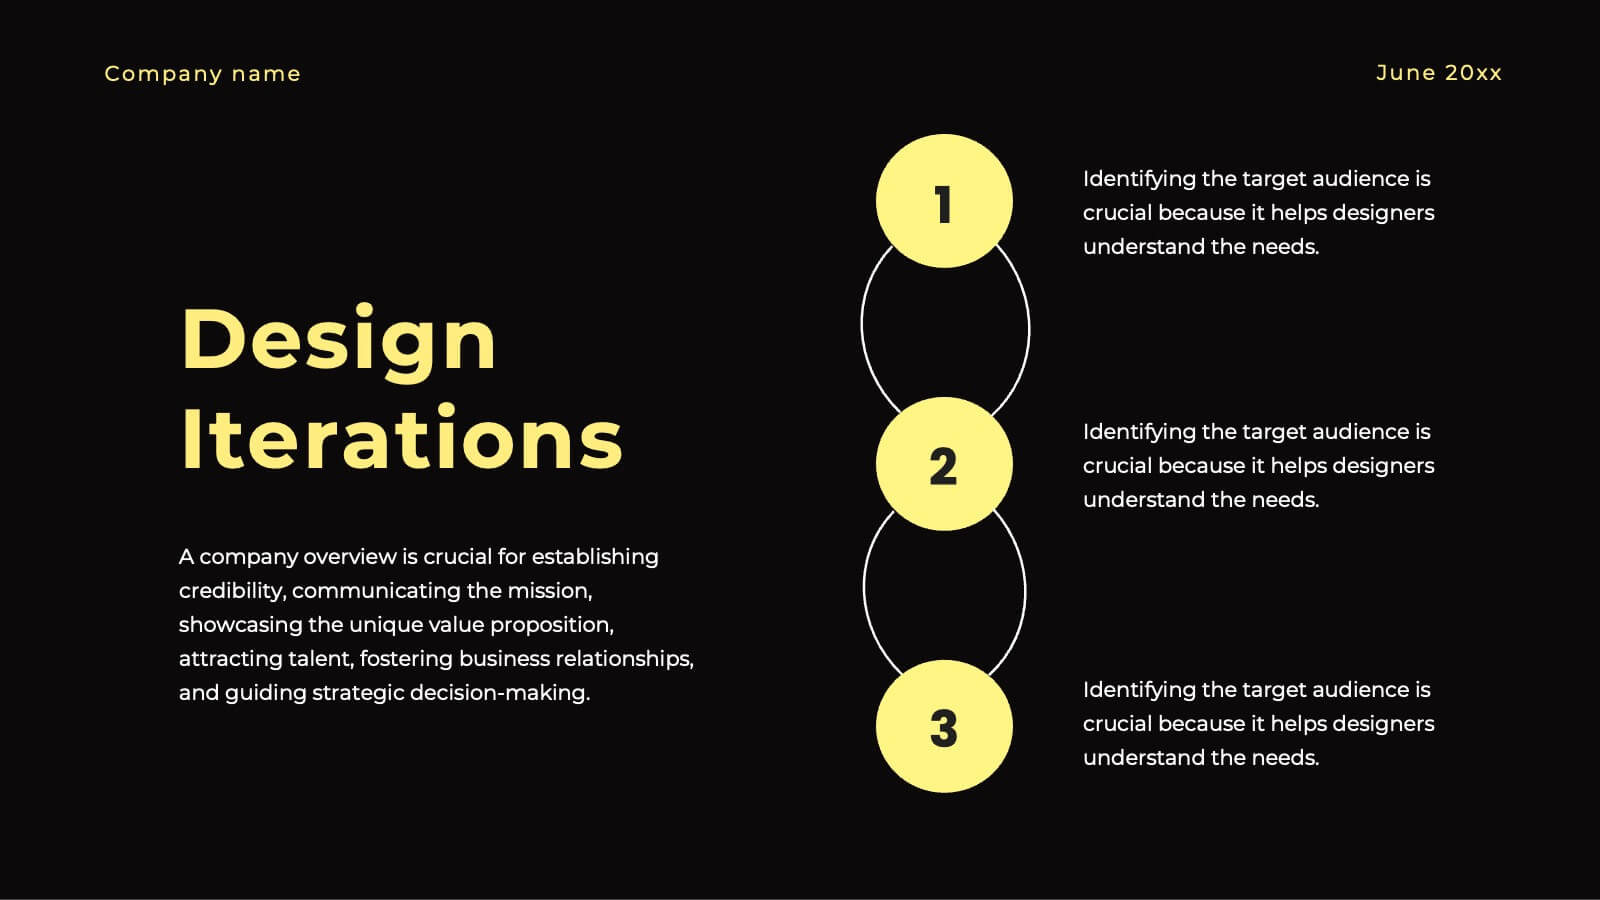
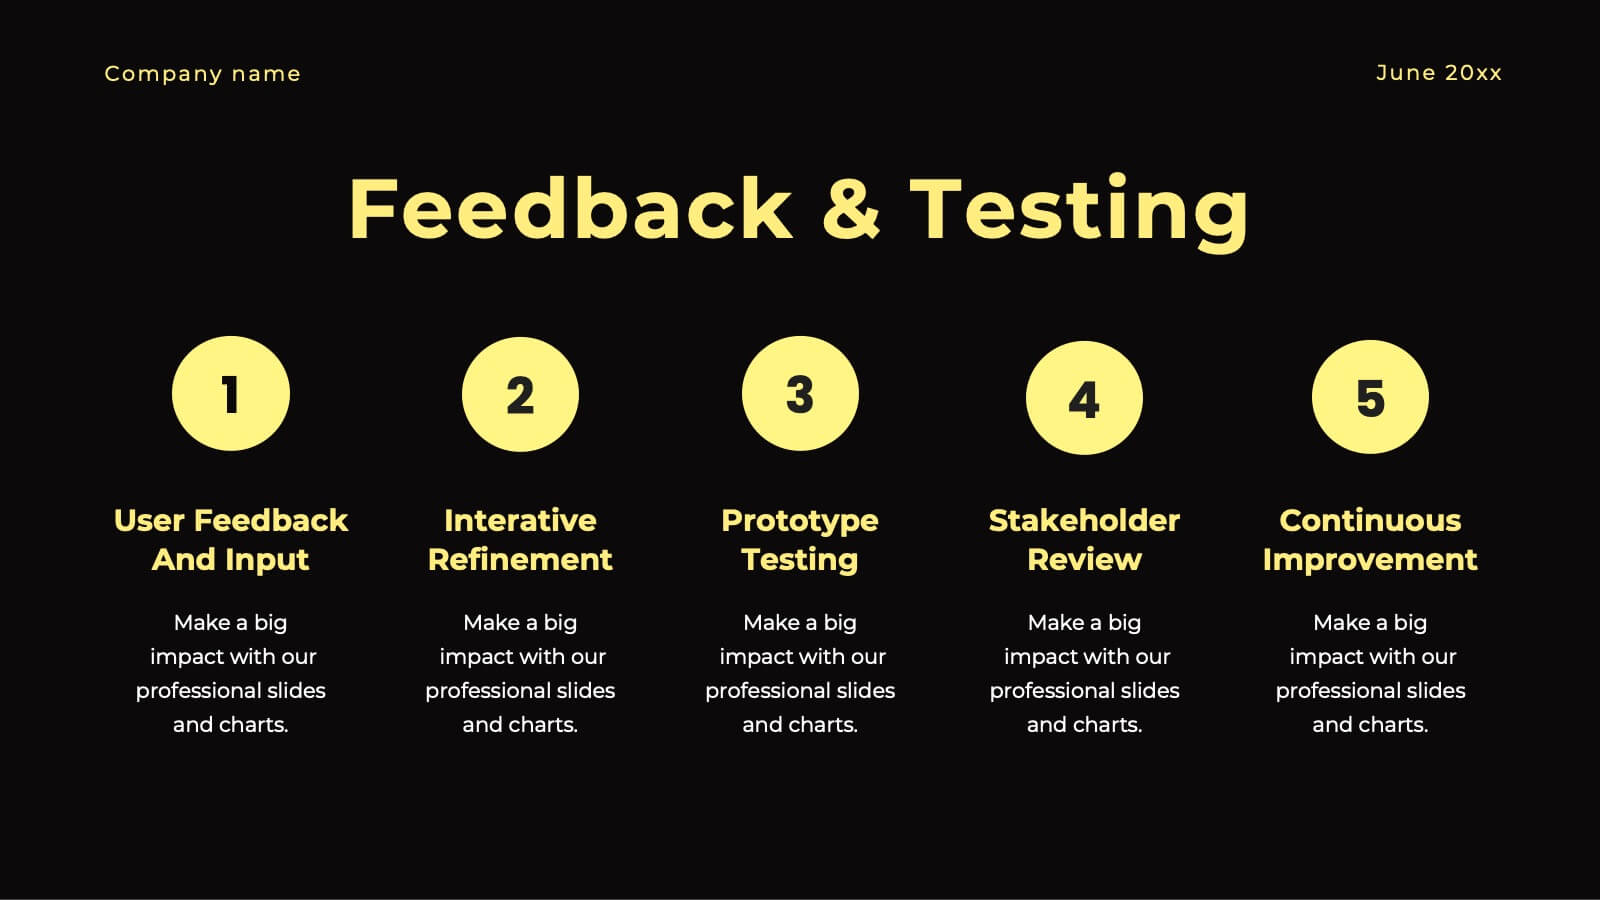
A minimalist and sleek template ideal for presenting design strategy and development. Includes sections for design brief, audience insights, concept development, design elements, prototyping, and feedback. Suitable for design professionals to showcase visual direction and project timelines. Fully customizable in PowerPoint, Keynote, and Google Slides for versatile presentations.


7 slides
Digital Business Strategy Infographic
Navigate the complex landscape of digital business strategy with this comprehensive infographic template, which is meticulously designed to aid business strategists, entrepreneurs, and students in understanding and developing effective business plans. This resource breaks down the core components of a successful business strategy into digestible, visually engaging segments. The template spans several key areas of strategic planning including execution, governance, planning, marketing, and innovation. Each section is clearly delineated with vibrant colors and icons that correspond to different aspects of business strategy, such as venture, capital, and brand positioning. The layout is thoughtfully organized to guide the viewer through the process step-by-step, making complex concepts accessible and straightforward. Utilizing a clean and professional design, this template is ideal for presentations, educational materials, or as a visual aid during business meetings. It provides a clear roadmap for aligning digital tools and platforms with business objectives, highlighting the pathways to profitability and market expansion. Whether for internal strategy sessions, academic purposes, or entrepreneurial pitches, this infographic is an invaluable tool for conveying the essentials of digital business strategy effectively and efficiently.


4 slides
Marketing Plan Overview
Visualize your marketing cycle with this clean, three-stage arrow diagram. Each segment—labeled A, B, and C—represents a key phase in your marketing strategy, making it ideal for campaign planning, product launches, or promotional timelines. Fully editable in PowerPoint, Keynote, and Google Slides for effortless customization.


22 slides
Event Agenda Presentation
Organize your event with precision using this Event Agenda presentation template. Designed for clarity and impact, it includes slides for conference overviews, speaker introductions, session descriptions, and networking opportunities. Perfect for business conferences or workshops, this template is compatible with PowerPoint, Keynote, and Google Slides, ensuring your event runs smoothly and professionally.


5 slides
Agile Project Roadmap Presentation
Visualize your quarterly project plans with clarity using this Agile roadmap slide. Designed with a horizontal layout for Q1 to Q4, this infographic includes three workstreams and color-coded bars to represent initiatives or sprints. Icons provide quick visual cues for different teams or objectives. Ideal for agile teams, product managers, or project leads who need a clean, editable layout. Compatible with PowerPoint, Keynote, and Google Slides.


5 slides
Regional Overview North America Map Presentation
Bring your data to life with a vibrant visual layout that breaks down key insights across different North American regions. This professional design helps you compare performance, track growth, or present market summaries clearly and effectively. Fully compatible with PowerPoint, Keynote, and Google Slides for easy customization and use.


4 slides
Business Innovation Strategy
Drive transformation and clarity with this Business Innovation Strategy presentation. Featuring a sleek diamond-sequence layout (A–D), it guides your audience through key phases like ideation, development, execution, and scaling. Ideal for product planning, growth initiatives, and organizational innovation. Fully customizable in PowerPoint, Keynote, and Google Slides.


7 slides
College Statistics Infographic Presentation
A College Statistics Infographic is a visual representation of key data and statistics related to a college. This template can provide a quick and easy-to-understand overview of various aspects of the institution, such as enrollment figures, graduation rates, student demographics, and academic performance metrics. Featured are icons, illustrations, diagrams, and other design elements to enhance the visual appeal of this infographic and make it more engaging for your viewers. This template can be a useful tool for students, teachers, and others interested in learning more about a college.


8 slides
Achievements and Goals Milestone
Illustrate your team's journey with this visually engaging milestone roadmap. Featuring a step-by-step block design with space for five key accomplishments, it's perfect for goal tracking, progress reviews, or roadmap presentations. Fully editable in PowerPoint, Keynote, and Google Slides.


20 slides
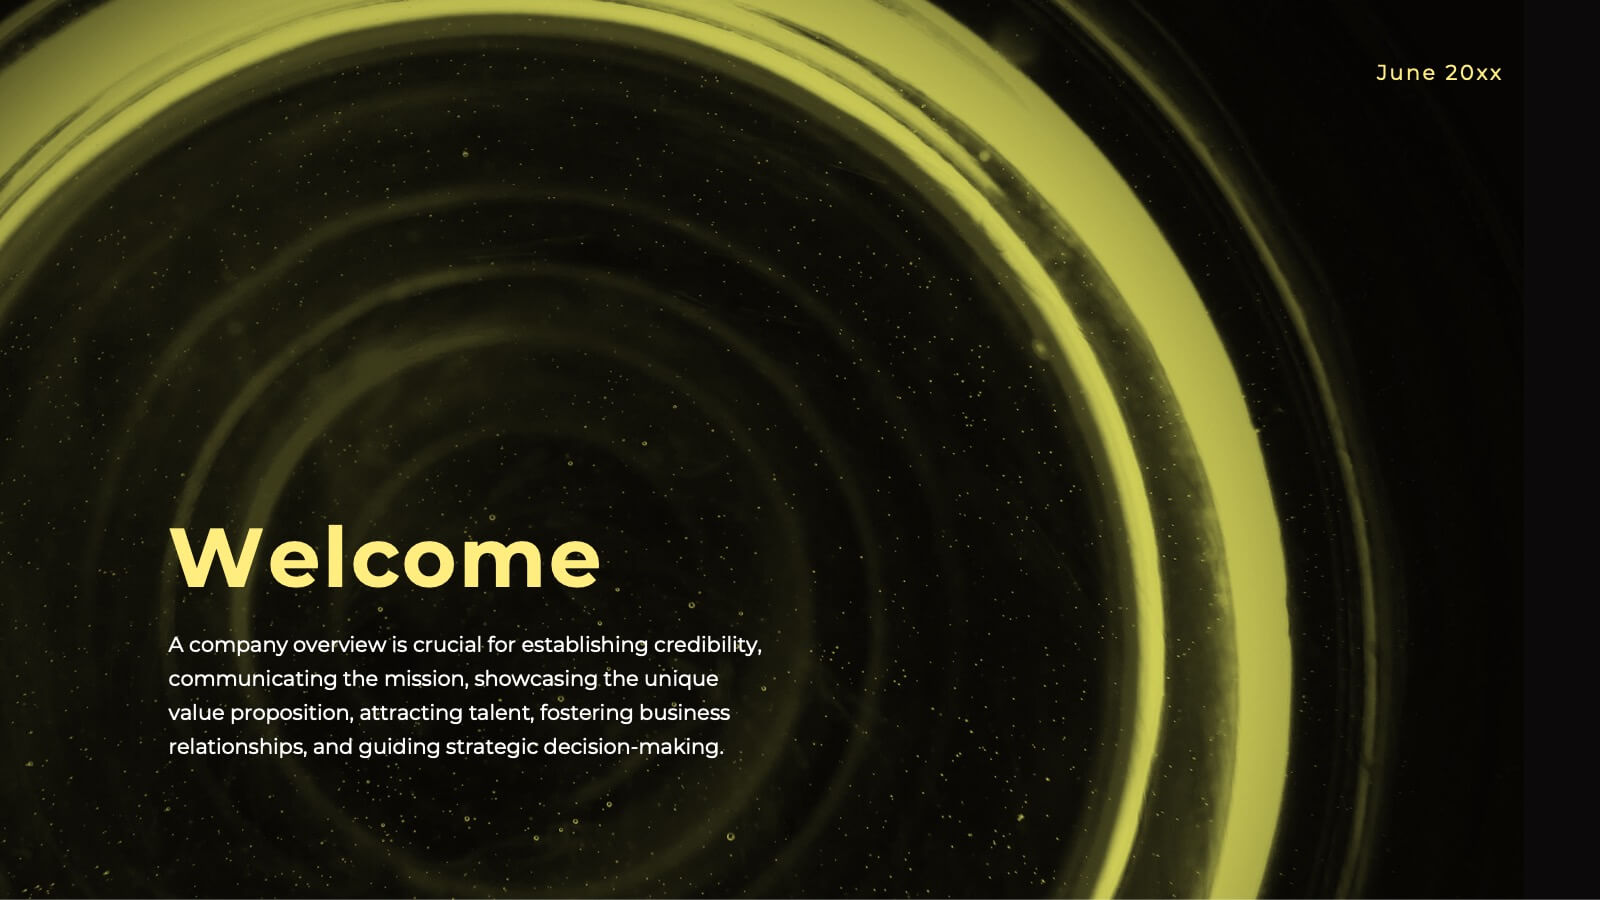
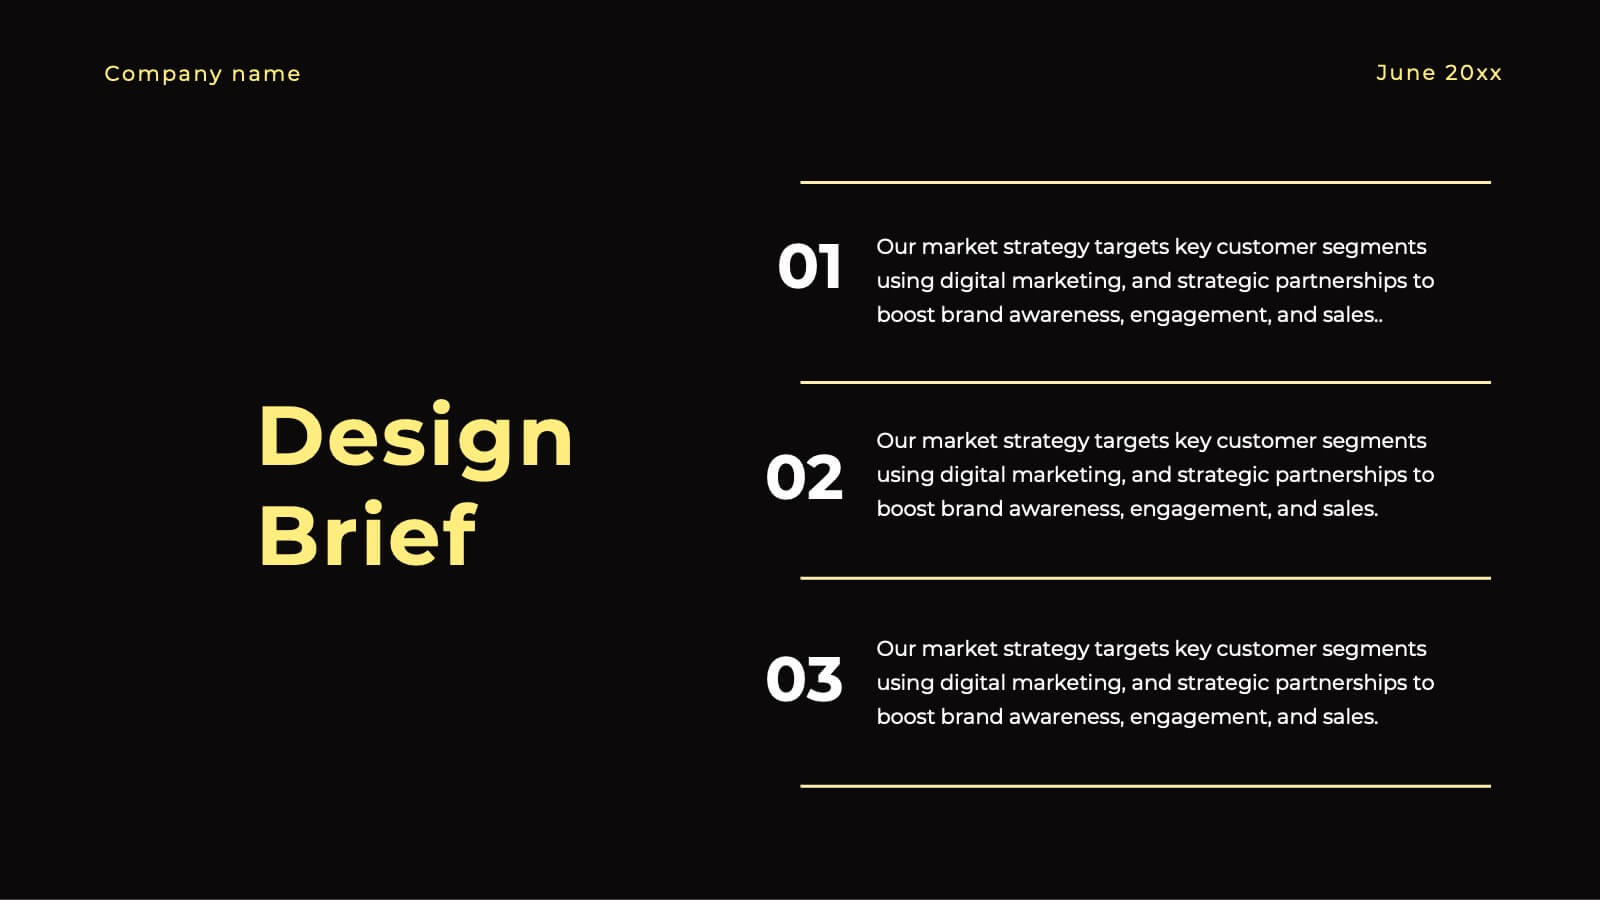
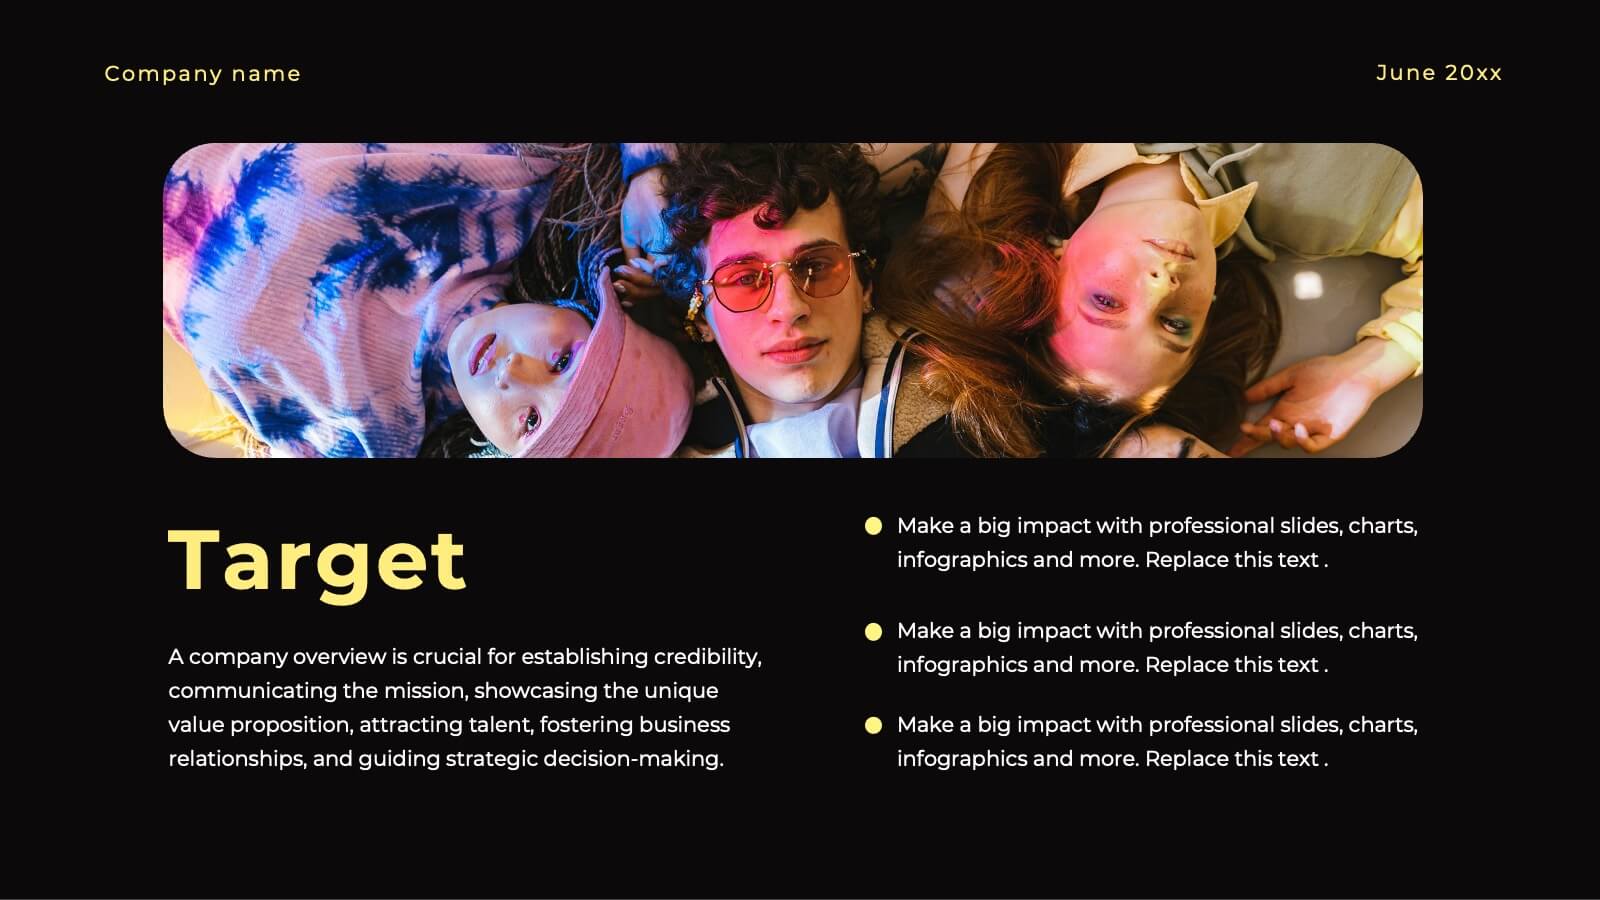
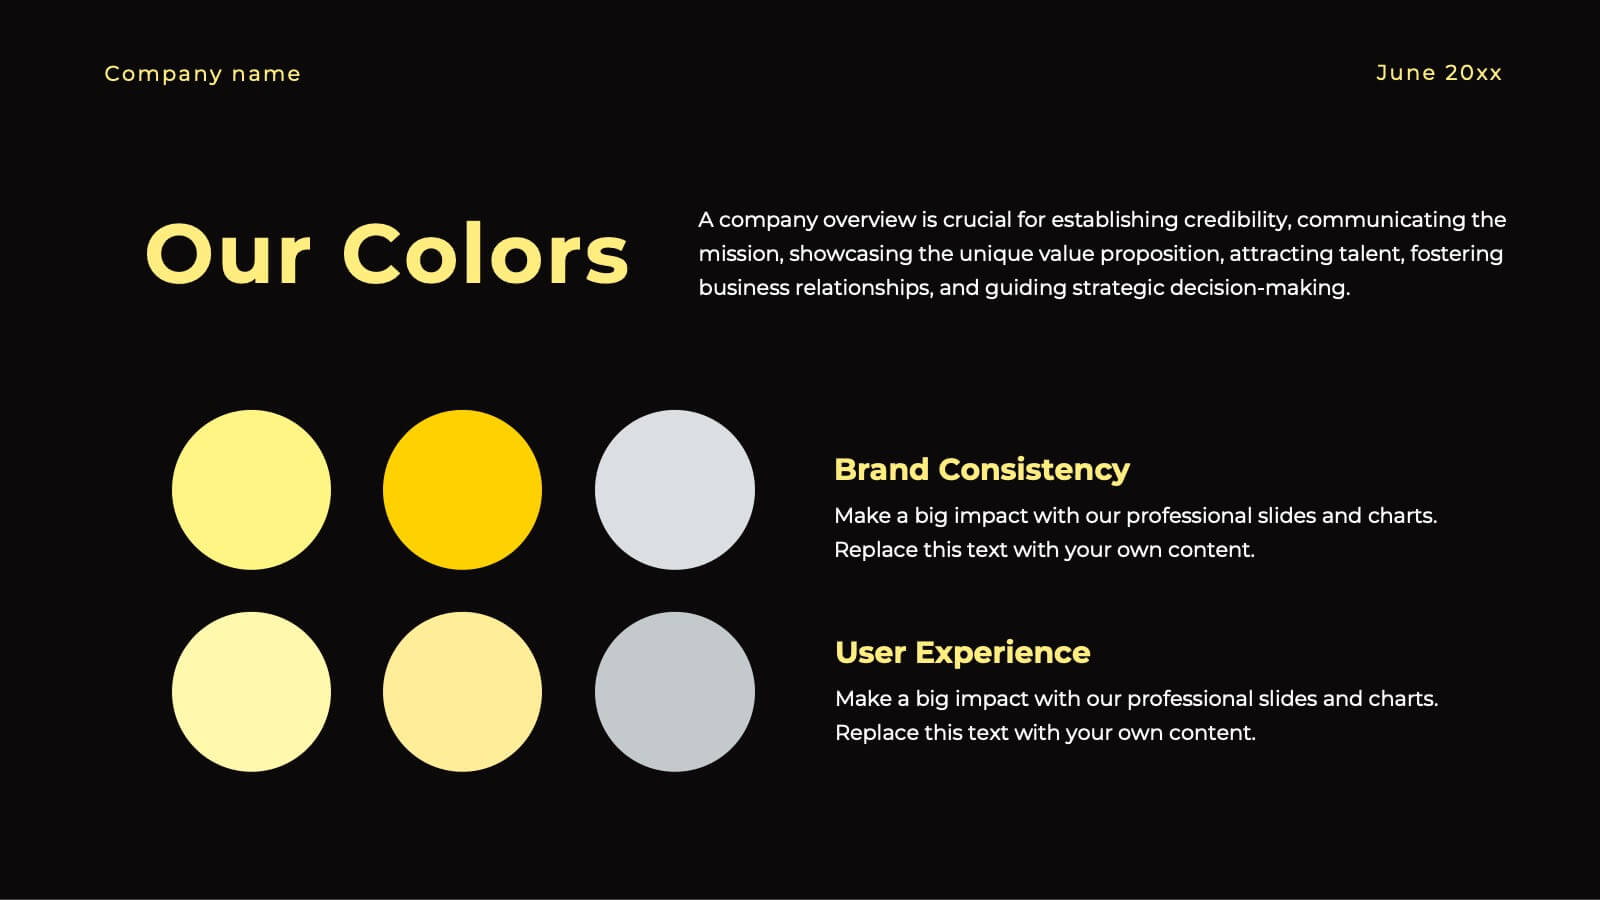
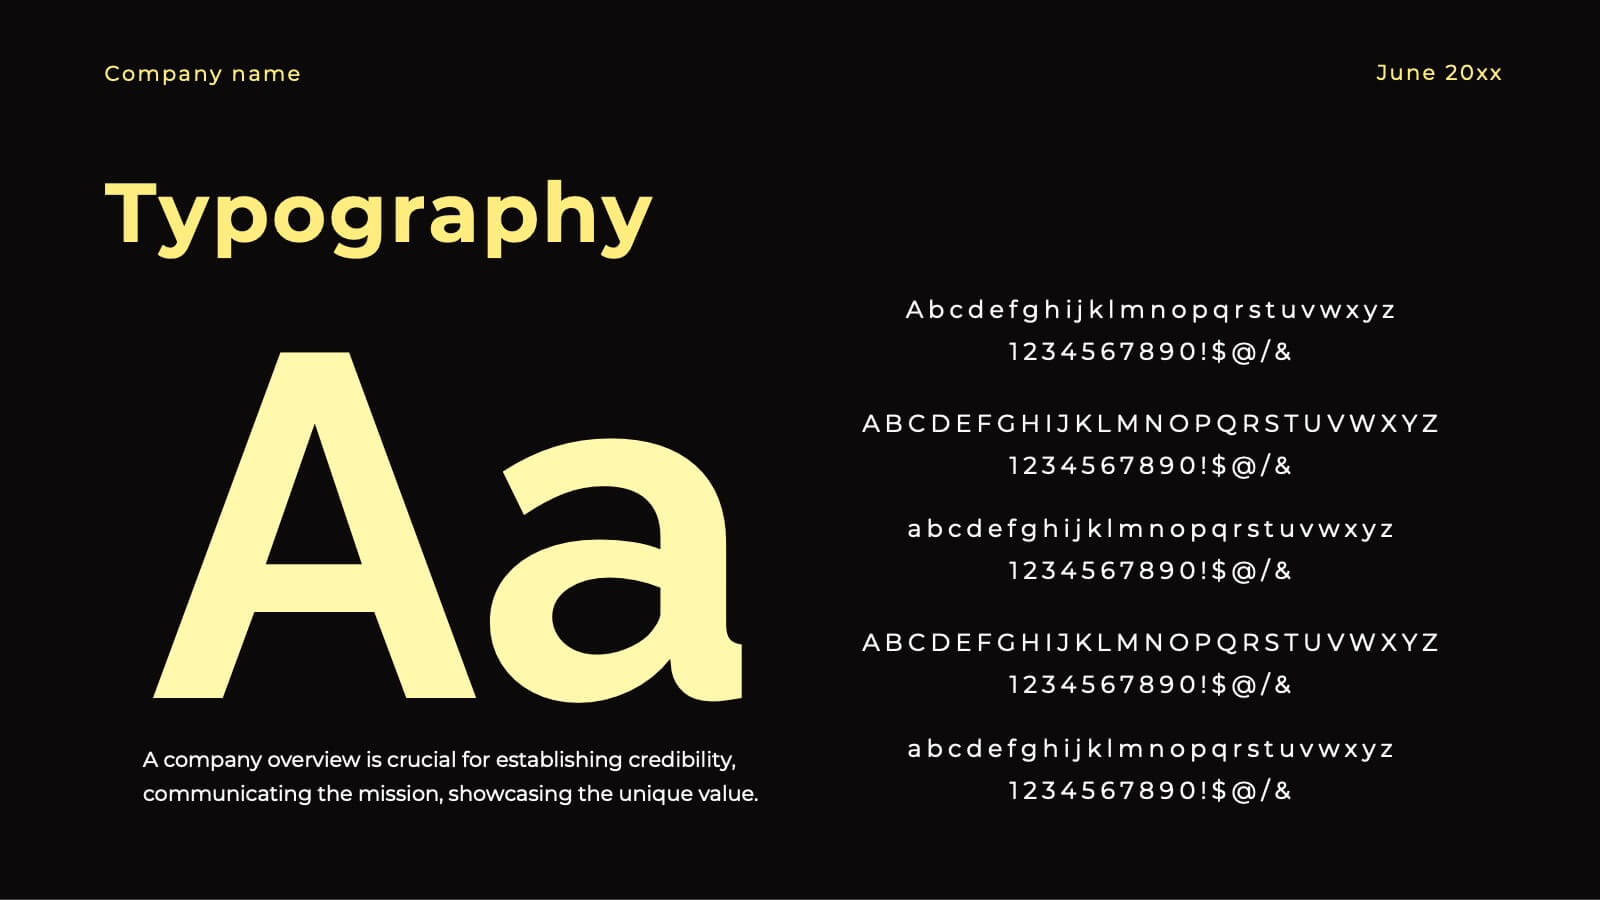
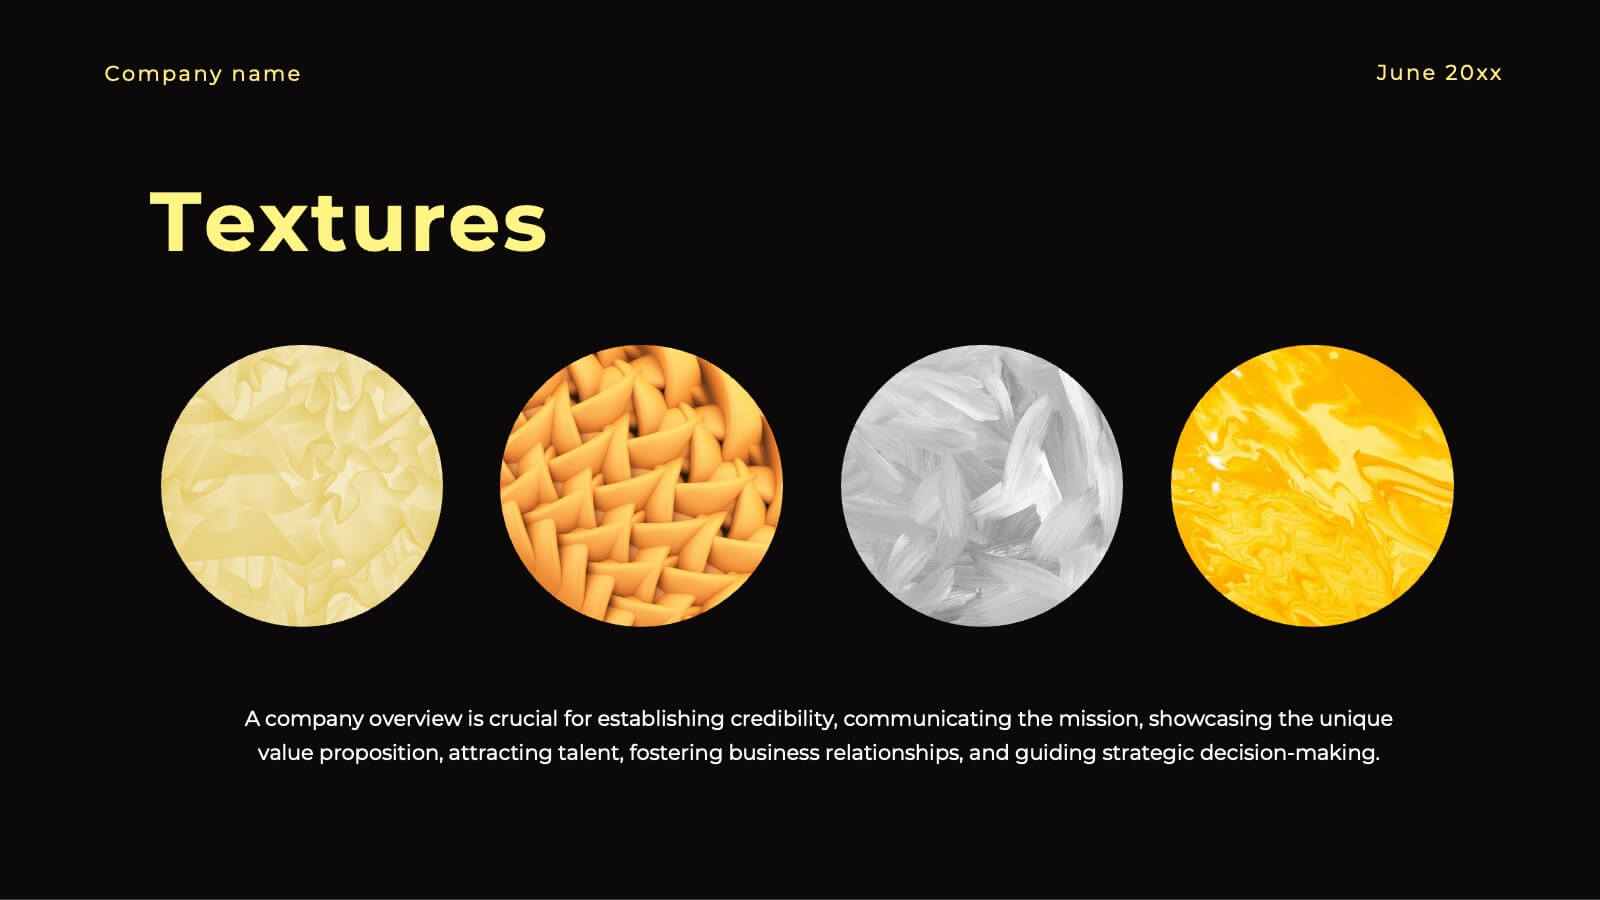
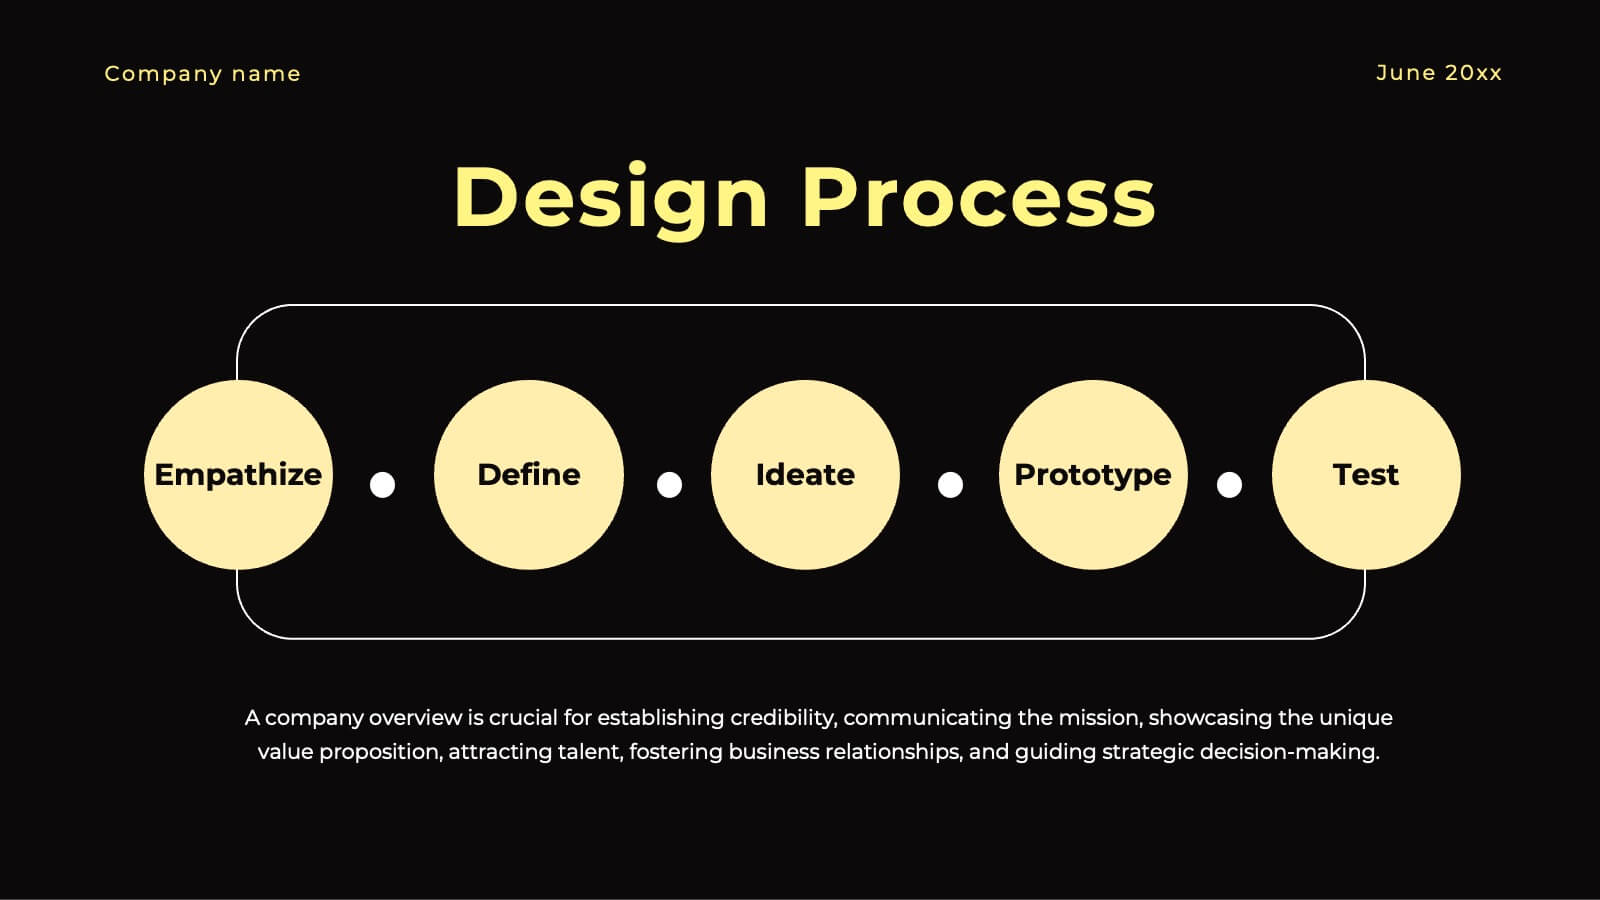
Ignite Creative Design Report Presentation
Unleash your creativity with this stunning design presentation template! Perfect for showcasing concept development, design processes, and final prototypes, it includes slides for typography, color palettes, and project timelines. Captivate your audience with sleek visuals and detailed content. Compatible with PowerPoint, Keynote, and Google Slides for seamless presentations on any platform.


5 slides
Defining Project Scope Presentation
Clearly outline project goals with the Defining Project Scope Presentation template. This step-by-step visual guide helps teams map out project objectives, key milestones, and deliverables in an organized manner. Perfect for project managers, business analysts, and consultants looking to present scope definitions effectively. Fully editable in PowerPoint, Keynote, and Google Slides for easy customization.


4 slides
Neuroscience-Inspired Concept Mapping Presentation
Visualize abstract ideas with clarity using the Neuroscience-Inspired Concept Mapping Presentation. Featuring a head silhouette and four labeled concept nodes, this layout is perfect for connecting ideas, frameworks, or steps in a thought process. Fully editable in PowerPoint, Canva, and Google Slides for seamless customization and presentation.


6 slides
Customer Perceived Value Analysis
Visualize what matters most to your audience using this customer-centric diagram. Perfect for marketers, brand strategists, and CX professionals looking to present value drivers, motivations, or user insights. Easily editable in PowerPoint, Keynote, and Google Slides—customize colors, icons, and text to align with your brand.


6 slides
Ideas Connection Venn Presentation Design
Present interconnected ideas with creativity and impact using the Ideas Connection Venn Presentation Design. This colorful, lightbulb-themed 5-section layout helps you visualize related concepts or stages, ideal for brainstorming, innovation mapping, or content planning. Each segment includes icons, titles, and descriptions to showcase your thoughts clearly. Fully customizable in PowerPoint, Keynote, and Google Slides.


6 slides
Basic Numbers Infographic
This Basic Numbers Infographic is a visual representation of numerical data or information using simple graphical elements. This infographic template is a straightforward way to convey statistics, facts, or comparisons to your audience in a clear and engaging manner. The infographic includes a clean and uncluttered design while effectively presenting the numerical information. The visual elements enhance understanding and make the infographic visually appealing to your audience. The icons, symbols, and simple illustrations enhance the appeal of the infographic. Compatible with Powerpoint, Keynote, and Google Slides.