


Features
- 4 Unique slides
- Fully editable and easy to edit in Microsoft Powerpoint, Keynote and Google Slides
- 16:9 widescreen layout
- Clean and professional designs
- Export to JPG, PDF or send by email


Do you have any questions?
Recommend


6 slides
Customer Perceived Value Analysis
Visualize what matters most to your audience using this customer-centric diagram. Perfect for marketers, brand strategists, and CX professionals looking to present value drivers, motivations, or user insights. Easily editable in PowerPoint, Keynote, and Google Slides—customize colors, icons, and text to align with your brand.


4 slides
Data Analytics Heat Map Presentation
Turn complex data into clear insights with this dynamic heat map template! Ideal for visualizing trends, risks, or performance metrics, this design enhances decision-making at a glance. With fully customizable elements, it simplifies data analysis for business, finance, or research. Compatible with PowerPoint, Keynote, and Google Slides for seamless use.


5 slides
3D Element Infographics for Impact Presentation
Add a bold visual twist to your data with the 3D Element Infographics for Impact Presentation. Featuring eye-catching 3D dice-style cubes, this template is perfect for showcasing four key concepts, comparisons, or stages. Ideal for business strategies, risk breakdowns, or decision-making visuals. Fully editable and compatible with PowerPoint, Keynote, and Google Slides.


6 slides
Project Scope and Expansion Scale Presentation
Display growth areas and operational coverage with this segmented radial chart. Ideal for showcasing project reach, departmental impact, or phase distributions, each section includes editable icons and labels. Perfect for strategy updates, expansion pitches, or status reporting. Fully customizable in PowerPoint, Keynote, and Google Slides for professional presentations.


7 slides
Vacations Travel Infographic
Are you ready to embark on a journey around the world? Our Vacations Travel Infographic is your ultimate guide to thrilling destinations, exotic experiences, and memorable adventures. Whether you're a passionate traveler seeking new horizons or an explorer at heart, this infographic is designed to ignite your wanderlust and set your vacation dreams on fire. Compatible with Powerpoint, Keynote, and Google Slides. Dive into the world of travel with this vivid infographic that sparks excitement and eagerness to discover what lies beyond. This template is not just a visual delight, it's a roadmap to your dream vacation!


6 slides
Corporation Schedule Infographics
Elevate your corporate presentations with our Corporation Schedule infographic, expertly designed for compatibility with Powerpoint, Keynote, and Google Slides. This practical and polished infographic is an exceptional resource for managers, team leads, and event coordinators planning and presenting schedules, timelines, and agendas. The infographic is structured to visually organize and communicate a corporation's schedule, making it an invaluable tool for outlining project timelines, meeting agendas, or corporate event itineraries. Its clear, concise format is specifically tailored to the business environment, where readability and quick comprehension are paramount. Integrating this infographic into your presentation will not only enhance its professional appearance but also facilitate effective time management and ensure alignment across teams. Whether you’re detailing a week-long conference schedule or outlining a project’s phases, this infographic provides a streamlined approach to sharing that information with your audience. It’s a strategic way to keep everyone informed and focused on the company's key timeframes and objectives.


5 slides
Meal Plan and Nutrition Guide Presentation
Simplify your nutrition strategy with the Meal Plan and Nutrition Guide Presentation. This visually engaging circular layout lets you outline five key nutrition pillars or daily meals with icons and editable titles. Ideal for dietitians, wellness coaches, or health brands. Compatible with PowerPoint, Canva, and Google Slides for seamless customization.
8 slides
Key Project Milestone Tracker
Stay on top of progress with this streamlined Key Project Milestone Tracker. Designed to showcase up to eight critical milestones with corresponding years, this timeline helps visualize project phases and deadlines clearly. Fully editable in PowerPoint, Keynote, and Google Slides for easy customization.


4 slides
Task and Role Allocation Matrix
Clarify team responsibilities with this modern Task and Role Allocation Matrix. Easily visualize who is Responsible, Accountable, Contributing, and Informed for each task. Ideal for team leaders, HR planners, and project coordinators. Fully customizable in PowerPoint, Keynote, and Google Slides.


5 slides
Investment Portfolio & Stock Forecast Presentation
Present key investment insights with clarity using the Investment Portfolio & Stock Forecast presentation template. Featuring a central briefcase visual and surrounding data points, this layout is perfect for showcasing portfolio allocation, stock predictions, market movements, or financial planning elements. Designed for finance professionals, analysts, and advisors, it simplifies complex data into digestible visuals. Fully editable and compatible with PowerPoint, Keynote, and Google Slides.


14 slides
Employee Happiness and Workplace Ratings Presentation
Measure and present employee satisfaction with clarity using this Employee Happiness and Workplace Ratings slide. Featuring a colorful semi-circular gauge and supporting percentage breakdowns, this layout is ideal for HR reports, internal surveys, or company culture reviews. Easily highlight key categories like benefits, leadership, or engagement levels. Fully editable in PowerPoint, Keynote, and Google Slides.


20 slides
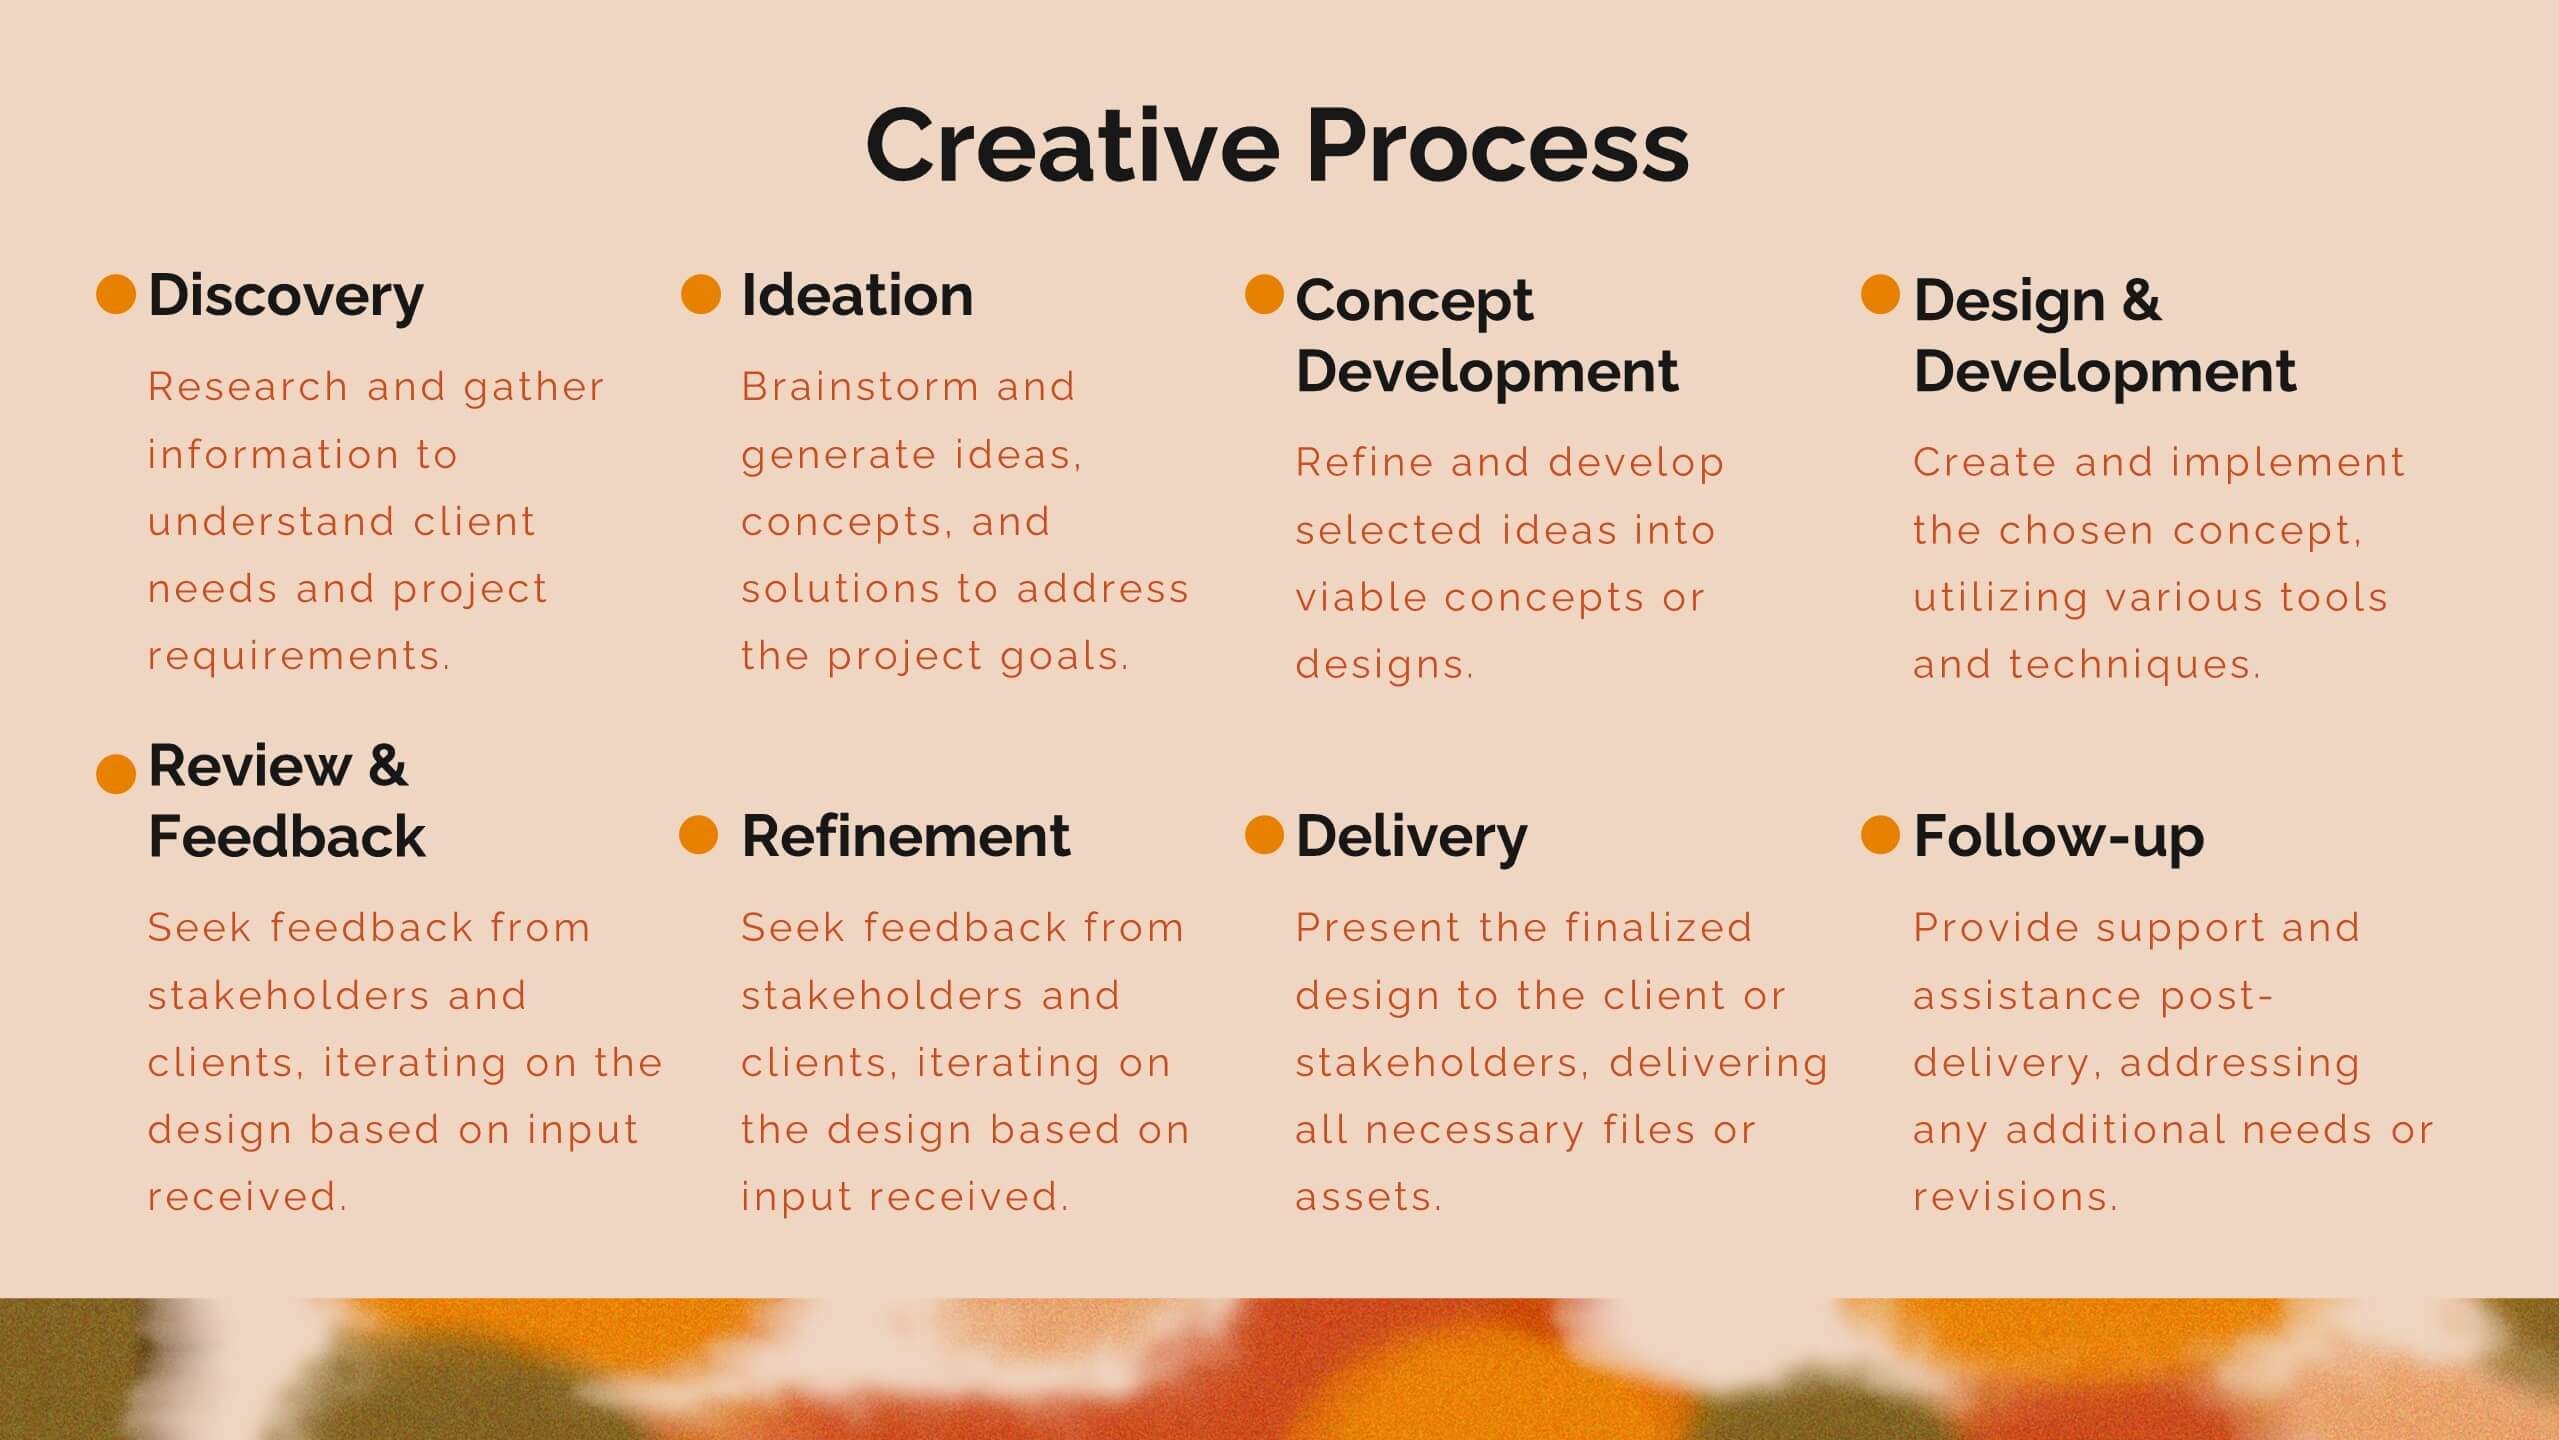
Zenith Artist Portfolio Presentation
Showcase your artistic journey with this captivating portfolio template! Perfect for presenting your projects, creative process, and client testimonials. Ideal for artists aiming to highlight their work and achievements. Compatible with PowerPoint, Keynote, and Google Slides, this template ensures your portfolio is visually stunning and professionally presented. Make your art stand out!


8 slides
Critical Challenges Analysis
Visualize obstacles and growth milestones with this mountain-themed slide—ideal for outlining major challenges and the efforts required to overcome them. Each peak highlights a key hurdle, complete with customizable icons and text. Fully editable in PowerPoint, Keynote, and Google Slides.


10 slides
AIDA Model Explained with Graphics Presentation
Bring your message to life with a dynamic visual flow that guides viewers through each stage of your communication strategy in a clear, compelling way. This presentation breaks complex concepts into simple steps, helping audiences follow your narrative effortlessly. Fully customizable and compatible with PowerPoint, Keynote, and Google Slides.


5 slides
Minimal Watercolor Aesthetic Presentation
Bring a soft artistic touch to your ideas with this clean, watercolor-inspired layout designed for simple, modern storytelling. The slide helps you highlight key points with gentle color accents that feel elegant yet professional, making complex insights easier to follow. Fully compatible with PowerPoint, Keynote, and Google Slides.


6 slides
Root Cause Analysis Tools Infographics
Uncover the root causes of issues effectively with our Root Cause Analysis Tools infographic template. This template is fully compatible with popular presentation software like PowerPoint, Keynote, and Google Slides, allowing you to easily customize it to analyze and address complex problems. The Root Cause Analysis Tools infographic template provides a visually engaging platform to showcase various methods and techniques for identifying and mitigating root causes. Whether you're a quality assurance professional, project manager, or problem-solving enthusiast, this template offers a user-friendly canvas to create informative presentations and strategies for root cause analysis. Improve your problem-solving capabilities with this SEO-optimized Root Cause Analysis Tools infographic template, thoughtfully designed for clarity and ease of use. Customize it to highlight the tools and methodologies best suited to your specific challenges, ensuring you can effectively address issues at their core. Start crafting your personalized infographic today to enhance your root cause analysis skills.


6 slides
30 60 90 Day Plan for Executives Infographics
Develop a strategic plan for executives with our customizable 30, 60, and 90 Day Plan for Executives infographic template. This template is fully compatible with popular presentation software like PowerPoint, Keynote, and Google Slides, allowing you to easily customize it to outline the key objectives and priorities for executives over these timeframes. The 30, 60, and 90 Day Plan for Executives infographic template offers a visually engaging platform to structure and communicate short-term goals, milestones, and initiatives for executive leaders. Whether you're an executive, manager, or HR professional, this template provides a user-friendly canvas to create informative presentations and strategic plans. Optimize executive performance and alignment with this SEO-optimized 30, 60, and 90 Day Plan for Executives infographic template, thoughtfully designed for clarity and ease of use. Customize it to showcase specific objectives, key projects, performance metrics, and alignment with broader organizational goals, ensuring that executives have a clear roadmap for success. Start crafting your personalized infographic today to help executives drive strategic impact in their roles.