


Features
- 6 Unique slides
- Fully editable and easy to edit in Microsoft Powerpoint, Keynote and Google Slides
- 16:9 widescreen layout
- Clean and professional designs
- Export to JPG, PDF or send by email


Do you have any questions?
Recommend


6 slides
Human Resources Job Infographic
Human Resources (HR) refers to the department or function within an organization that is responsible for managing the human capital, workforce, and related processes. This infographic template serves as a helpful guide for individuals interested in pursuing a career in HR or for HR professionals looking to understand the different career paths and opportunities available in their field. This infographic uses visuals, icons, and graphics to make the content more engaging and easily understandable. The layout of the infographic is organized and easy to navigate, allowing viewers to quickly find information about different HR job roles.


26 slides
Becka Presentation Template
Becka is a modern and powerful template for people who want to present themselves in a professional but bold way. Perfect for the CEO or company executive who wants to have a strong presence on screen. Made with clear and crisp typography, with added bold colors that appeal to both men and women which can evoke powerful emotions and confidence. This template contains easy to edit maps, charts and image place holders that are ready to use. The dynamic slides make it quick and easy to create the perfect presentation.
22 slides
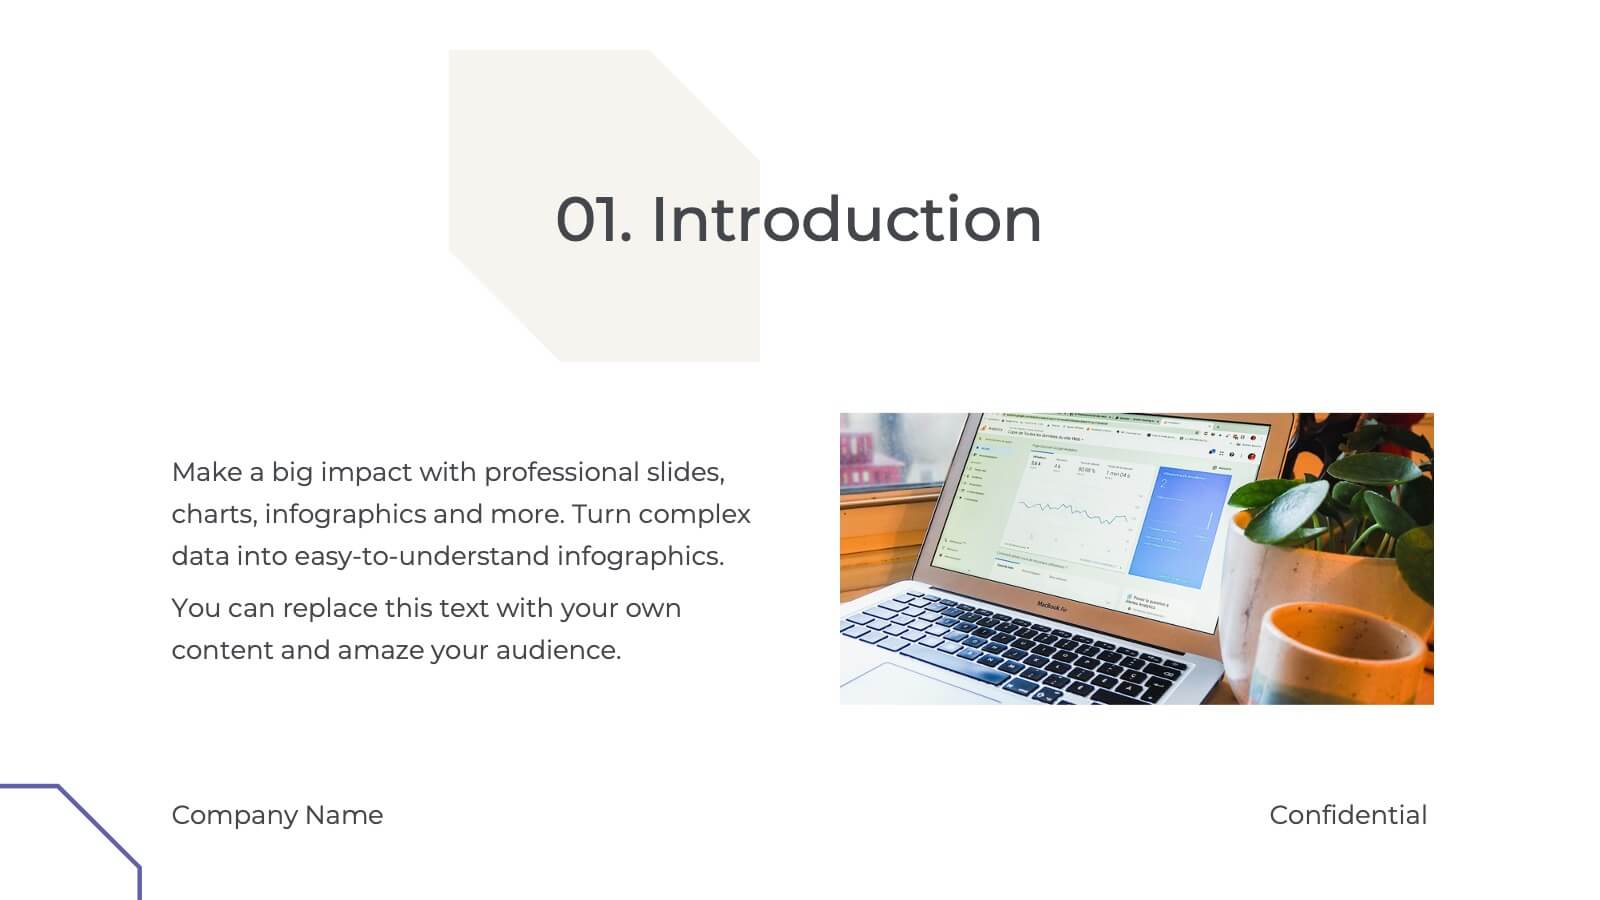
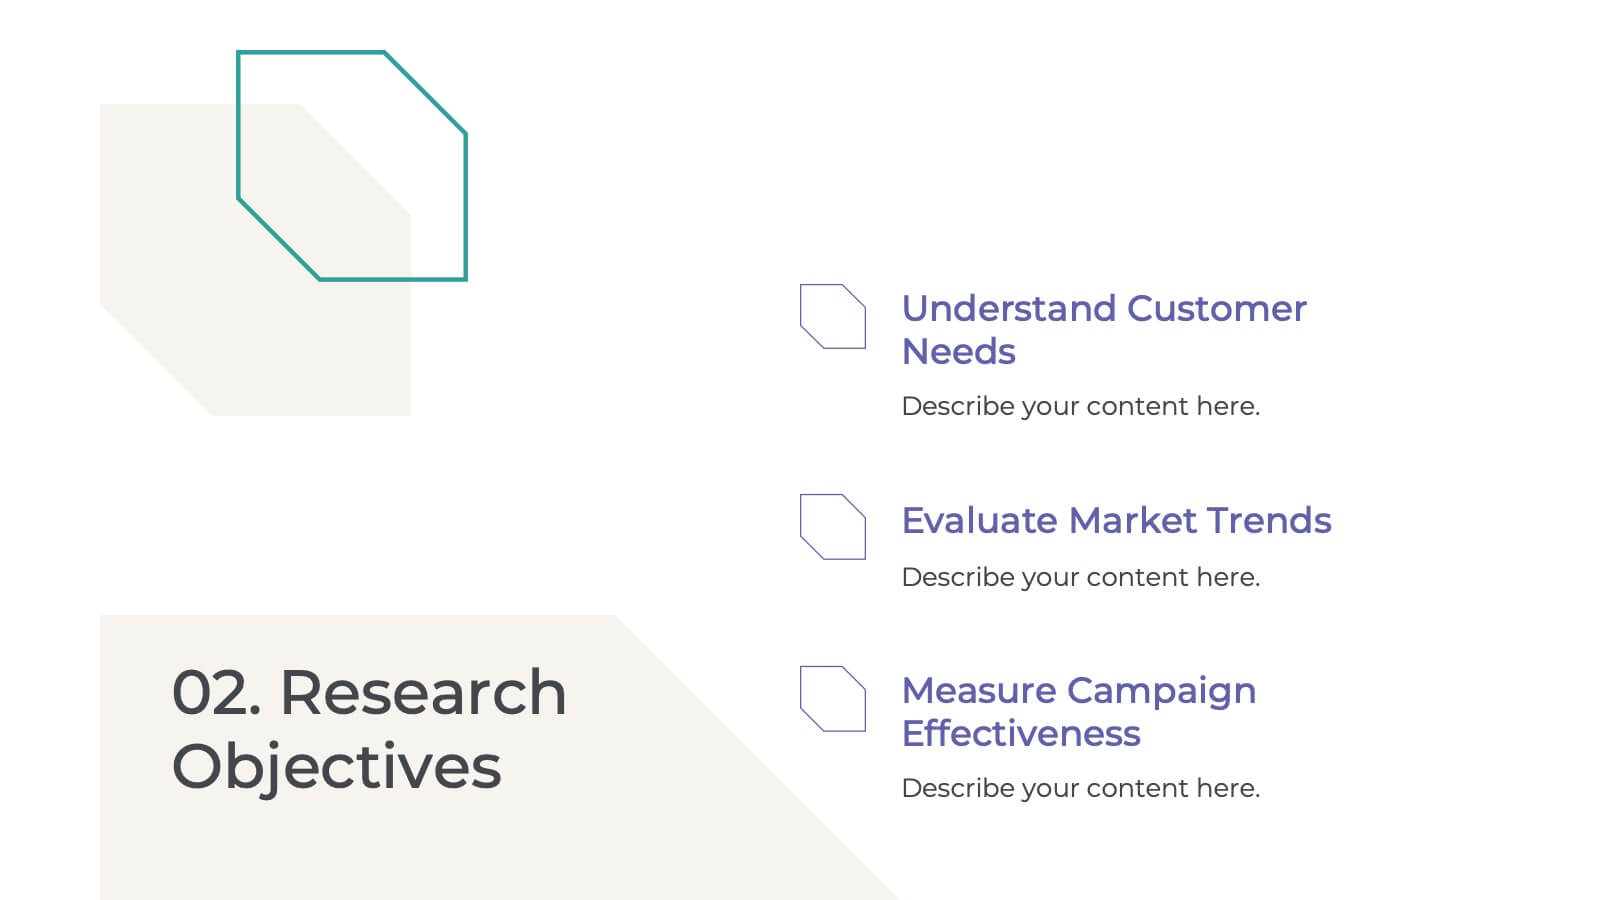
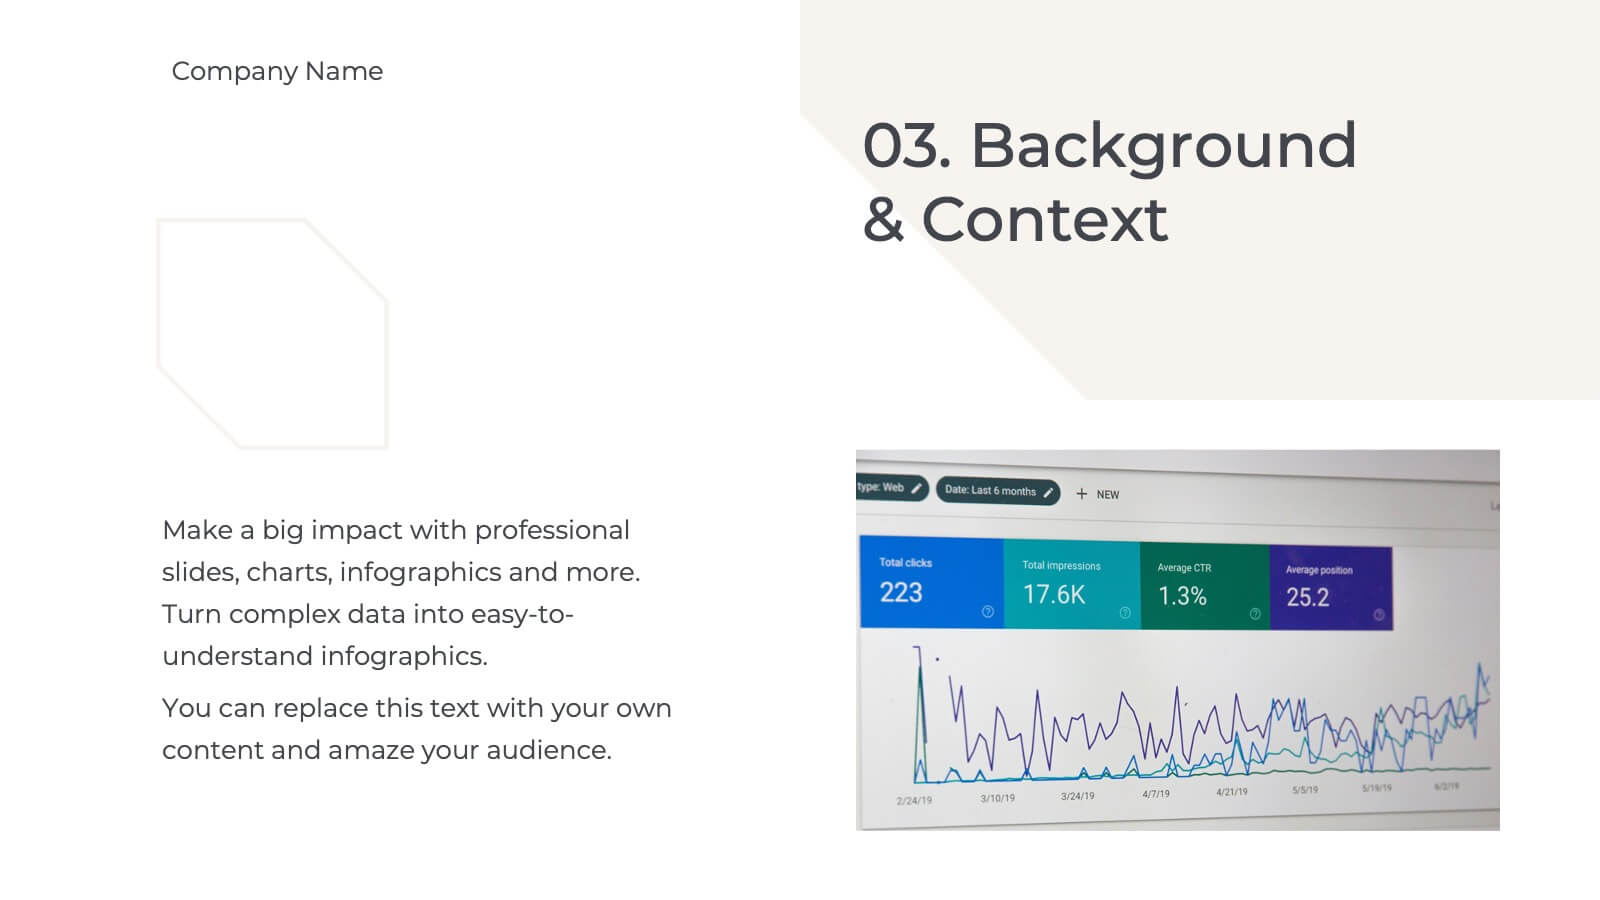
Palladium Qualitative Research Findings Presentation
Present your qualitative research findings effectively with this sleek, professional template. It includes sections for objectives, data analysis, key findings, and recommendations. Ideal for organizing research insights clearly, it's customizable and compatible with PowerPoint, Keynote, and Google Slides, ensuring smooth collaboration and impactful presentations for your audience.


6 slides
Revenue Cycle Infographic
The Revenue Cycle refers to the set of processes and activities involved in generating revenue for a business. This infographic template serves as a comprehensive guide to understanding and optimizing the revenue generation cycle. This presents the key stages, processes, metrics, and strategies involved in managing revenue in a colorful visually engaging and easy-to-understand format. With this template, you can effectively communicate the revenue cycle concepts and promote revenue optimization within your organization. Fully customizable and compatible with Powerpoint, Keynote, and Google Slides.


7 slides
Business Plan Process Infographic
Unveil the roadmap to entrepreneurial success with our business plan process infographic. This simple and streamlined infographic encapsulates the quintessential steps to draft a robust business plan, guiding entrepreneurs and business professionals on their journey to creating a successful enterprise. This infographic is an indispensable tool for budding entrepreneurs, business consultants, educators, and anyone looking to gain insights into the formulation of a business plan. Designed for seamless integration with PowerPoint, Keynote, or Google Slides, this template promises a presentation that is both engaging and educative.


7 slides
Cryptocurrency Infographic Presentation Template
Cryptocurrency is a form of digital or virtual currency that uses cryptography (the conversion of data into an unreadable format) to secure transactions between two parties. Cryptocurrencies use decentralized control as opposed to centralized electronic money and central banking systems. This template is the perfect presentation for informing on the world of cryptocurrency. The decentralized control of each cryptocurrency works through a blockchain. It is an alternative currency brought on by the emergence of Internet. This template comes with appealing illustrations made for you to customize.


4 slides
Risk vs Impact Matrix Layout Presentation
Visualize risk levels clearly with the Risk vs Impact Matrix Layout Presentation. This customizable template helps you assess and categorize potential risks based on their likelihood and impact, using a clear 3x3 color-coded grid. Ideal for project managers, risk analysts, and strategy teams. Compatible with PowerPoint, Keynote, Google Slides, and Canva.


6 slides
Domestic Statistics Infographic
Domestic statistics typically refers to numerical data and information related to a specific country's internal affairs, activities, and demographics. This infographics can be an effective way to present important data and trends related to a specific country or region. This template is designed with a balance between design aesthetics and data accuracy. By presenting the information in a visually engaging manner, you can effectively communicate key insights to your target audience. Compatible with Powerpoint, Keynote, and Google Slides. This ensures that your infographic is accessible by providing alternative text for images and using high-contrast colors.


5 slides
E-Learning and Digital Education Trends Presentation
Stay ahead in the digital learning space with the E-Learning and Digital Education Trends Presentation template. Designed for educators, trainers, and e-learning professionals, this modern and insightful layout highlights key trends, innovative tools, and strategies in online education. With fully customizable elements, you can tailor the slides to your audience’s needs. Compatible with PowerPoint, Keynote, and Google Slides for a seamless presentation experience.


6 slides
Corporation Schedule Infographics
Elevate your corporate presentations with our Corporation Schedule infographic, expertly designed for compatibility with Powerpoint, Keynote, and Google Slides. This practical and polished infographic is an exceptional resource for managers, team leads, and event coordinators planning and presenting schedules, timelines, and agendas. The infographic is structured to visually organize and communicate a corporation's schedule, making it an invaluable tool for outlining project timelines, meeting agendas, or corporate event itineraries. Its clear, concise format is specifically tailored to the business environment, where readability and quick comprehension are paramount. Integrating this infographic into your presentation will not only enhance its professional appearance but also facilitate effective time management and ensure alignment across teams. Whether you’re detailing a week-long conference schedule or outlining a project’s phases, this infographic provides a streamlined approach to sharing that information with your audience. It’s a strategic way to keep everyone informed and focused on the company's key timeframes and objectives.


6 slides
Strategy for Effective Solutions Presentation
Unlock strategic clarity with the Strategy for Effective Solutions template, which effectively organizes complex strategies into six interconnected segments, ideal for sequentially showcasing business insights. Its clear, systematic design supports concise communication and is compatible with PowerPoint, Keynote, and Google Slides, making it a versatile tool for professional presentations.


7 slides
Veterinary Medical Center Infographic
Dive into the world of animal healthcare with our comprehensive veterinary medical center infographic. Infused with refreshing shades of green, blue, and white, this template provides a clear snapshot of veterinary services, pet care essentials, and more. Designed especially for veterinarians, pet care professionals, and educators, its captivating graphics and icons make complex medical topics more digestible and engaging. With adorable pet-themed elements, it ensures audiences instantly connect with the content. Perfect for presentations, workshops, and seminars, it's optimized for PowerPoint, Keynote, and Google Slides, making information dissemination both appealing and efficient.


25 slides
The Power of HIIT Presentation
Supercharge your fitness routine with this high-energy presentation on the power of HIIT. Covering key benefits like fat burning, muscle endurance, metabolism boost, and time-efficient workouts, this template helps break down the science behind high-intensity interval training. Fully customizable and compatible with PowerPoint, Keynote, and Google Slides for a seamless presentation experience.


6 slides
Digital Marketing Strategy and Trends Presentation
The "Digital Marketing Strategy and Trends" template is designed to help marketers visualize and present their strategies and market trends effectively. It facilitates clear mapping of key steps in digital marketing campaigns, making it easier to convey complex strategies in a digestible format. This template is compatible with PowerPoint, Keynote, and Google Slides, ensuring it can be utilized across various platforms for diverse audiences.


26 slides
Construction Engineering Dark Presentation
Elevate your project narratives with our construction engineering dark presentation template, tailored specifically for industry professionals who desire clarity and precision. This template, steeped in dark shades complemented by stark orange and green accents, offers a sophisticated canvas for your plans. It's an essential asset for construction engineers and contractors seeking to outline project scopes, or innovative engineering solutions. Compatible with Powerpoint, Keynote, and Google Slides. Included are purposeful graphics and technical icons, all arranged to underscore your presentation's professionalism and comprehensive nature.


6 slides
Project Gantt Chart Presentation
This Project Gantt Chart Presentation helps visualize your project timeline with clarity. Featuring six tasks, weekly progress bars, and colorful icons, it’s ideal for tracking milestones. Fully customizable and easy to edit, this slide works seamlessly in PowerPoint, Keynote, and Google Slides for organized, professional project management presentations.


20 slides
Spectrum Graphic Design Project Plan Presentation
The Graphic Design Project Plan Presentation Template includes 20 clean and modern slides, tailored for creative professionals. It guides you through key design stages like audience targeting, design brief, elements, moodboards, prototypes, and project timelines. Featuring bold typography, engaging visuals, and a sleek black-and-yellow color palette, this template ensures clarity and style. Compatible with PowerPoint, Keynote, and Google Slides, it's fully editable to fit any design project.